Embed Size (px)
Citation preview

Eurex Fixed Income Options Insights
2
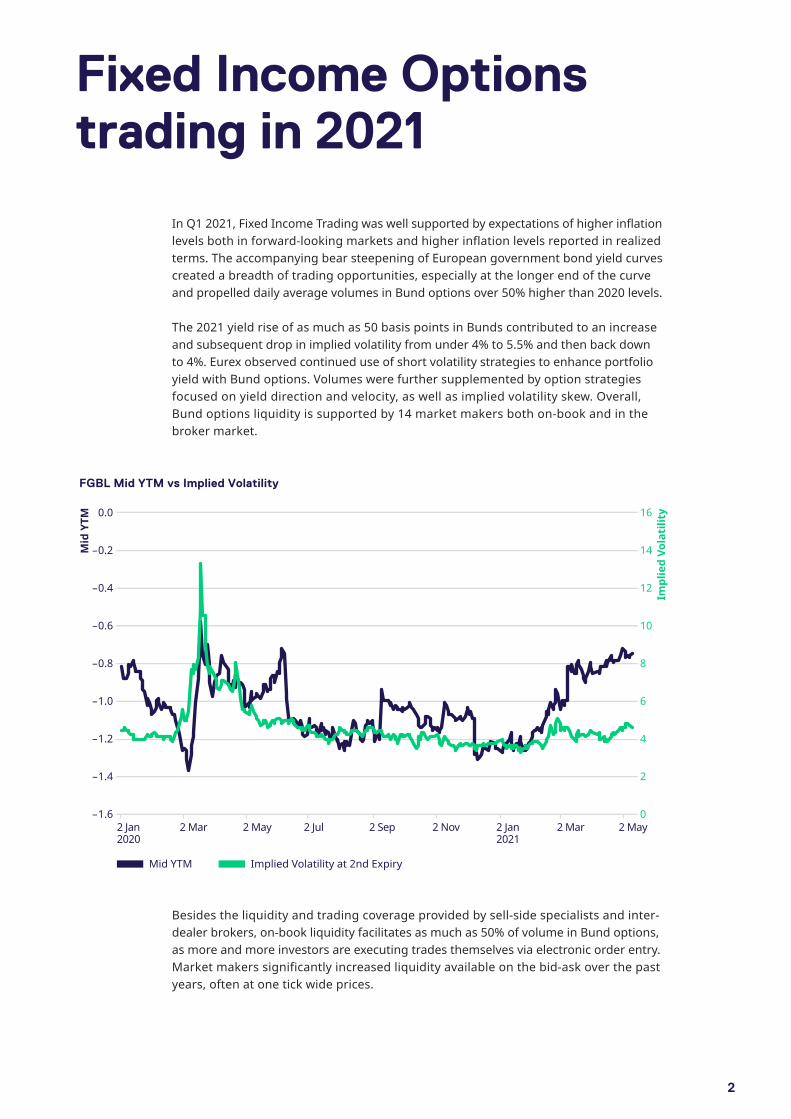
In Q1 2021, Fixed Income Trading was well supported by expectations of higher inflationlevels both in forward-looking markets and higher inflation levels reported in realizedterms. The accompanying bear steepening of European government bond yield curvescreated a breadth of trading opportunities, especially at the longer end of the curveand propelled daily average volumes in Bund options over 50% higher than 2020 levels.
The 2021 yield rise of as much as 50 basis points in Bunds contributed to an increaseand subsequent drop in implied volatility from under 4% to 5.5% and then back downto 4%. Eurex observed continued use of short volatility strategies to enhance portfolioyield with Bund options. Volumes were further supplemented by option strategies focused on yield direction and velocity, as well as implied volatility skew. Overall,Bund options liquidity is supported by 14 market makers both on-book and in thebroker market.
Besides the liquidity and trading coverage provided by sell-side specialists and inter-dealer brokers, on-book liquidity facilitates as much as 50% of volume in Bund options,as more and more investors are executing trades themselves via electronic order entry.Market makers significantly increased liquidity available on the bid-ask over the pastyears, often at one tick wide prices.
Fixed Income Options trading in 2021
FGBL Mid YTM vs Implied Volatility
0.0
–0.2
–0.4
–0.6
–0.8
–1.0
–1.2
–1.4
–1.6
16
14
12
10
8
6
4
2
0
Mid YTM
2 Jan 2020
Implied Volatility at 2nd Expiry
Mid
YTM
Impl
ied
Vola
tilit
y
2 Mar 2 May 2 Jul 2 Sep 2 Nov 2 Jan 2021
2 Mar 2 May

3
The order book shows nearby expiries well supported at tight spreads and quote sizesranging from hundreds to thousands of option contracts available for point-and-clickexecution. Given how Fixed Income Options are tied to the underlying futures, liquiditypicked up over March as trading interest in futures shifted to June expiries.
Investors with direct market access to Eurex markets can take advantage of optionstrategies that are supported by a multitude of independent trading software vendors.Users can create option structures tailored to their investment objective in terms of strategy and expiry across the full range of strikes. One can also create order booksfor non-standard strategies for bespoke structures with up to five option legs. Most volume is traded in directional strategies such as call and put spreads, followed by skew sensitive structures such as condors and butterflies:
BBO Size Bund JUNE 21 OTM Strikes Puts vs Implied Volatility
1,800
1,600
1,400
1,200
1,000
800
600
400
200
0
5.0
4.8
4.6
4.4
4.2
4.0
3.8
Put Med Ask Vol
1 Mar2021
Put Med Bid Vol Implied Volatility
Put M
ed A
sk/B
id V
ol
Impl
ied
Vola
tilit
y
3 Mar2021
5 Mar2021
9 Mar2021
11 Mar2021
15 Mar2021
17 Mar2021
19 Mar2021
23 Mar2021
25 Mar2021
29 Mar2021
31 Mar2021
OGBL Option Strategy Q1 2021 Breakdown
500
450
400
350
300
250
200
150
100
50
0
100
90
80
70
60
50
40
30
20
10
0
On-Book Off-Book Cumulative Sum
Volu
me
(tho
usan
ds)
Cum
ulat
ive
Sum
(%)
BER BUL
PCONDRBUL
PBUTPBER
CBUTST
DBER
-PPLA
DBU23
CLADBR23
BUL-C
COMBOST
GBER
-C BRT
BULBR
CCONDPDIA
ICONDOTH
ER

Strategies are often quoted in thousands of contracts at one to two tick wide bid-offerspreads as the risk characteristics can be offsetting and may reduce the delta and vegasensitivity of a given structure.
Contact us at Eurex for more insights into how our fixed income options suite can helpnavigate today’s and tomorrow’s markets.
4
Contract
OGBL BER Jun21 16800 – 16700
OGBL BER Jun21 17100 – 17050
OGBL BRT Jun21 Jul21 16950
OGBL BER Jun21 16900 – 16850
OGBL BER Jun21 16900 – 16800
OGBL PBUT Jun21 16800 – 16950 – 17100
OGBL BUL Jul21 17200 – 17300 vs C 17350
OGBL BER Jun21 17000 – 16900
OGBL PBUT Jun21 16850 – 16900 – 16950
OGBL PDIA Jun21 16950 Jul21 17000
CBQty
1,106
5,233
365
1,276
4,135
986
477
1,435
1,363
563
CAQty
3,399
2,992
365
3,656
2,667
842
349
2,216
3,165
387
CVol
5,000
4,500
3,067
2,505
2,300
2,041
1,800
1,625
1,500
1,500
CBid
0.07
0.40
0.02
0.14
0.22
0.62
–0.01
0.5
0.06
0.17
CAsk
0.08
0.42
0.05
0.15
0.24
0.65
0.01
0.52
0.08
0.20

Find out more online atwww.eurex.com
©2021 by Deutsche Börse AG. Eurex®, the EX® and EC®-Logo are registered trade-marks of Deutsche Börse AG. This publication is published for information purposes only and does not constitute accounting advice, investment advice or an offer, solicitation or recommendation to acquire or dispose of any investment or to engage in any othertransaction. While reasonable care has been taken in the preparation of this publication neither Eurex Frankfurt AG, nor any of its affiliates make any representation or warranty regarding the information contained herein. Customers should consider the legal, accounting and regulatory requirements in the jurisdictions relevant to them before using Eurex® products or services. All descriptions, examples and calculations contained in this publication are for illus-trative purposes only.
Contact us
SALES FIXED INCOME
Vassily Pascalis T +44-20-78 [email protected]
London Representative OfficeLondon E14 4HE
FIXED INCOME ETD PRODUCT DESIGN
Rex JonesT [email protected]
Eurex Frankfurt AG65760 Eschborn
© Eurex, July 2021
Published by
Eurex Frankfurt AGMergenthalerallee 6165760 EschbornGermany
www.eurex.com
ARBN Number
Eurex Frankfurt AG ARBN 100 999 764


![[Eurex] Interest Rate Derivatives - Fixed Income Trading Strategies](https://img.pdfslide.us/doc/110x75/545f4966b1af9f04598b4c61/eurex-interest-rate-derivatives-fixed-income-trading-strategies.jpg)