Embed Size (px)
Citation preview
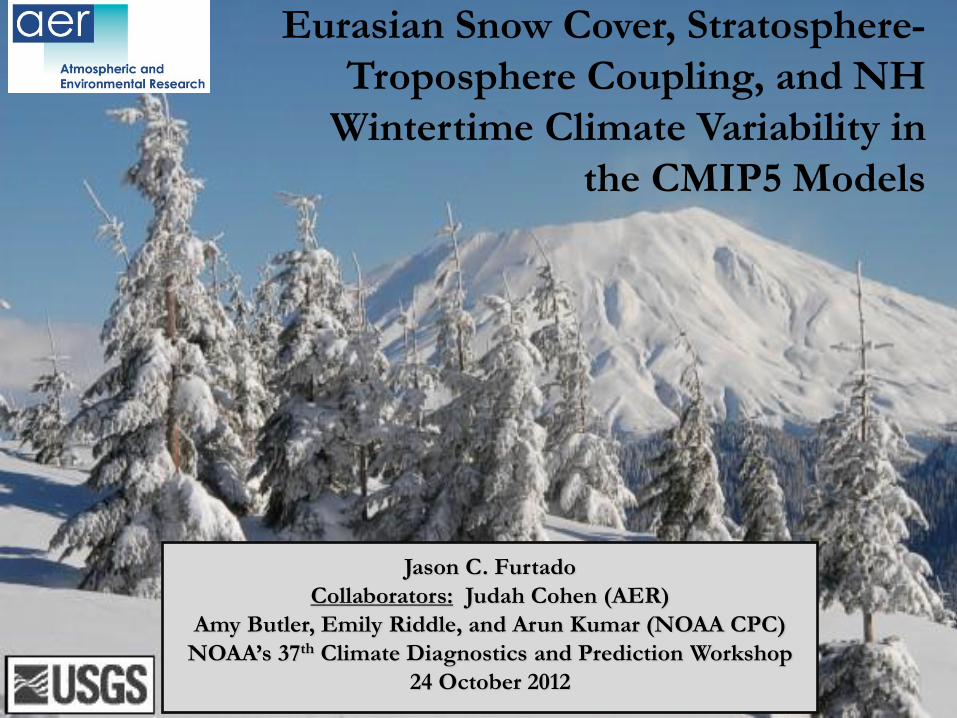
Eurasian Snow Cover, Stratosphere-
Troposphere Coupling, and NH
Wintertime Climate Variability in
the CMIP5 Models
Jason C. Furtado
Collaborators: Judah Cohen (AER)
Amy Butler, Emily Riddle, and Arun Kumar (NOAA CPC)
NOAA’s 37th Climate Diagnostics and Prediction Workshop
24 October 2012
11/14/2012 AER Company Proprietary Information. © Atmospheric and Environmental Research, Inc. (AER), 2011. 2
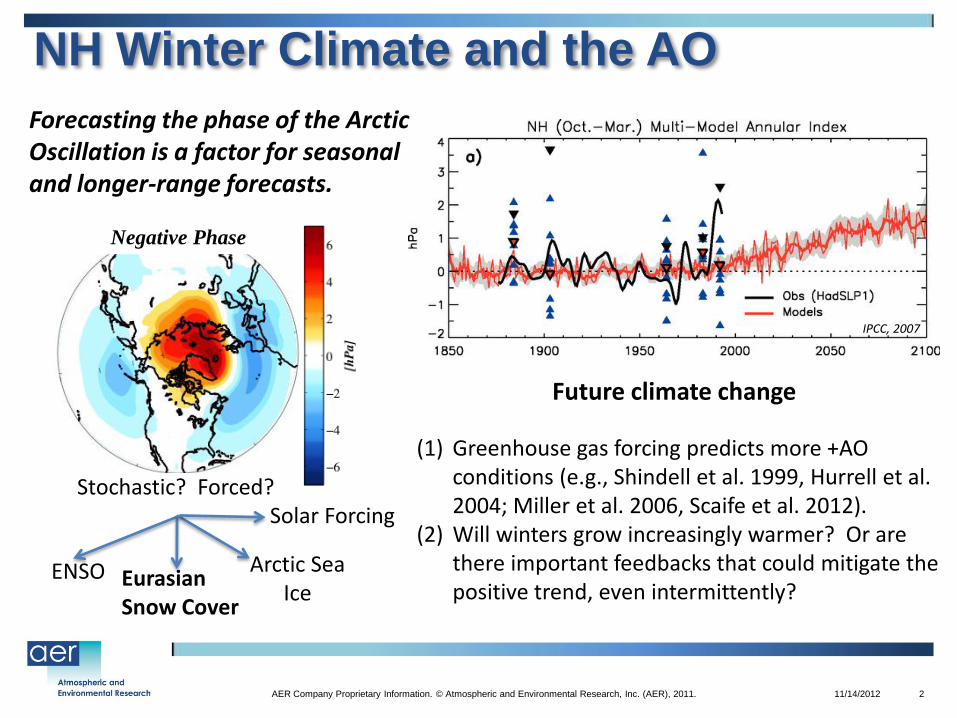
NH Winter Climate and the AO
Forecasting the phase of the Arctic Oscillation is a factor for seasonal and longer-range forecasts.
IPCC, 2007
Stochastic? Forced?
Future climate change
ENSO Eurasian Snow Cover
Arctic Sea Ice
(1) Greenhouse gas forcing predicts more +AO conditions (e.g., Shindell et al. 1999, Hurrell et al. 2004; Miller et al. 2006, Scaife et al. 2012).
(2) Will winters grow increasingly warmer? Or are there important feedbacks that could mitigate the positive trend, even intermittently?
Solar Forcing
Negative Phase
11/14/2012 AER Company Proprietary Information. © Atmospheric and Environmental Research, Inc. (AER), 2011. 3
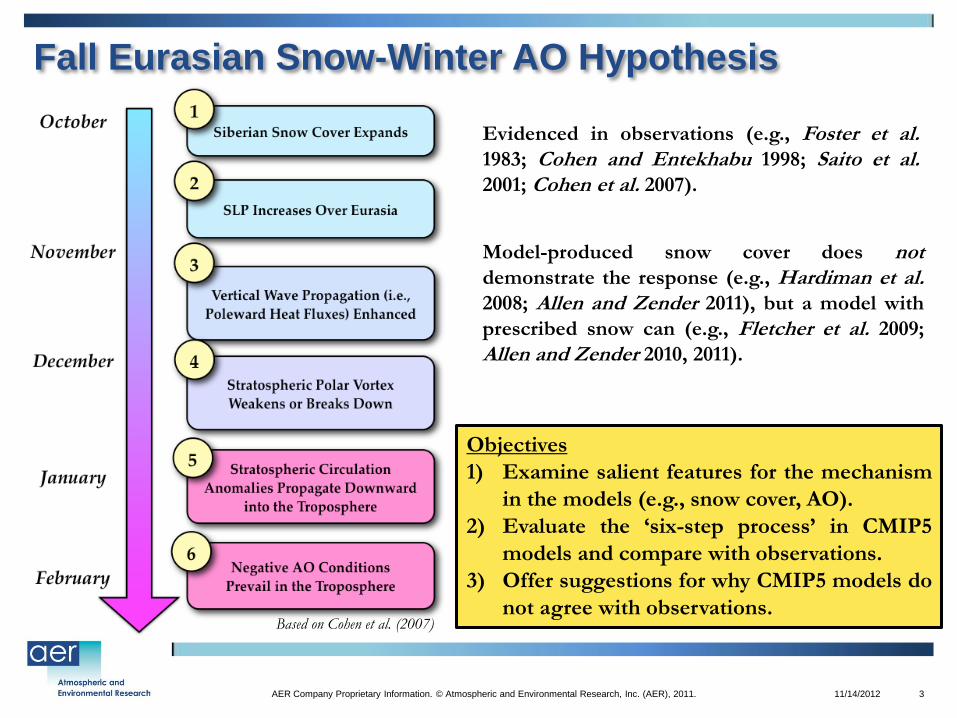
Fall Eurasian Snow-Winter AO Hypothesis
Based on Cohen et al. (2007)
Evidenced in observations (e.g., Foster et al. 1983; Cohen and Entekhabu 1998; Saito et al. 2001; Cohen et al. 2007).
Model-produced snow cover does not demonstrate the response (e.g., Hardiman et al. 2008; Allen and Zender 2011), but a model with
prescribed snow can (e.g., Fletcher et al. 2009;
Allen and Zender 2010, 2011).
Objectives
1) Examine salient features for the mechanism
in the models (e.g., snow cover, AO).
2) Evaluate the ‘six-step process’ in CMIP5
models and compare with observations.
3) Offer suggestions for why CMIP5 models do
not agree with observations.
11/14/2012 AER Company Proprietary Information. © Atmospheric and Environmental Research, Inc. (AER), 2011. 4
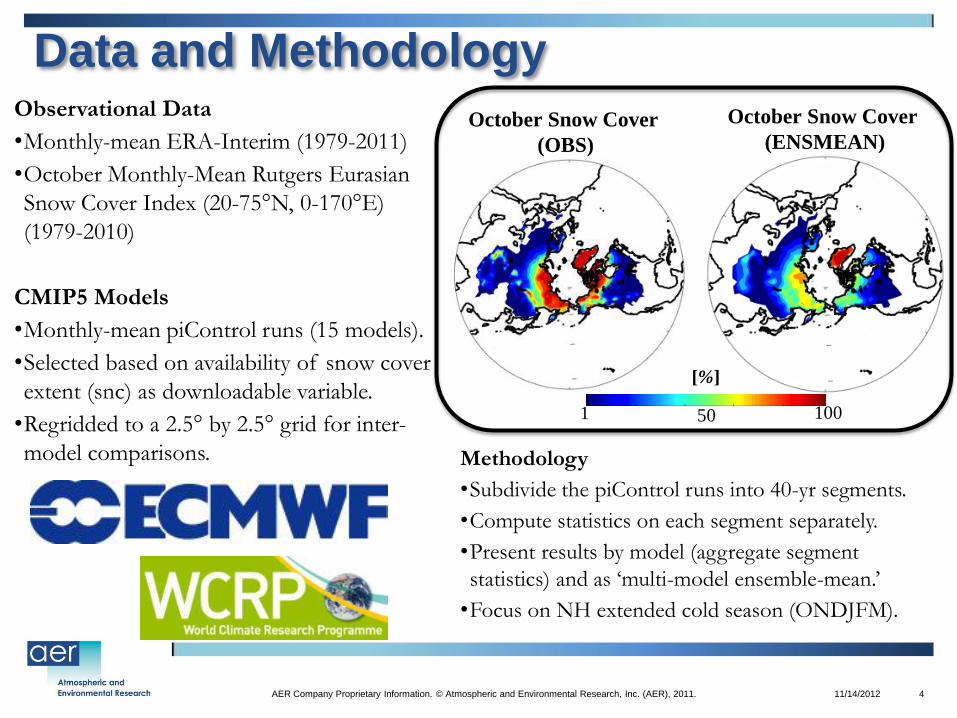
Data and Methodology Observational Data
•Monthly-mean ERA-Interim (1979-2011)
•October Monthly-Mean Rutgers Eurasian
Snow Cover Index (20-75°N, 0-170°E)
(1979-2010)
CMIP5 Models
•Monthly-mean piControl runs (15 models).
•Selected based on availability of snow cover
extent (snc) as downloadable variable.
•Regridded to a 2.5° by 2.5° grid for inter-
model comparisons. Methodology
•Subdivide the piControl runs into 40-yr segments.
•Compute statistics on each segment separately.
•Present results by model (aggregate segment
statistics) and as ‘multi-model ensemble-mean.’
•Focus on NH extended cold season (ONDJFM).
October Snow Cover
(OBS)
October Snow Cover
(ENSMEAN)
[%]
1 100 50
11/14/2012 AER Company Proprietary Information. © Atmospheric and Environmental Research, Inc. (AER), 2011. 5
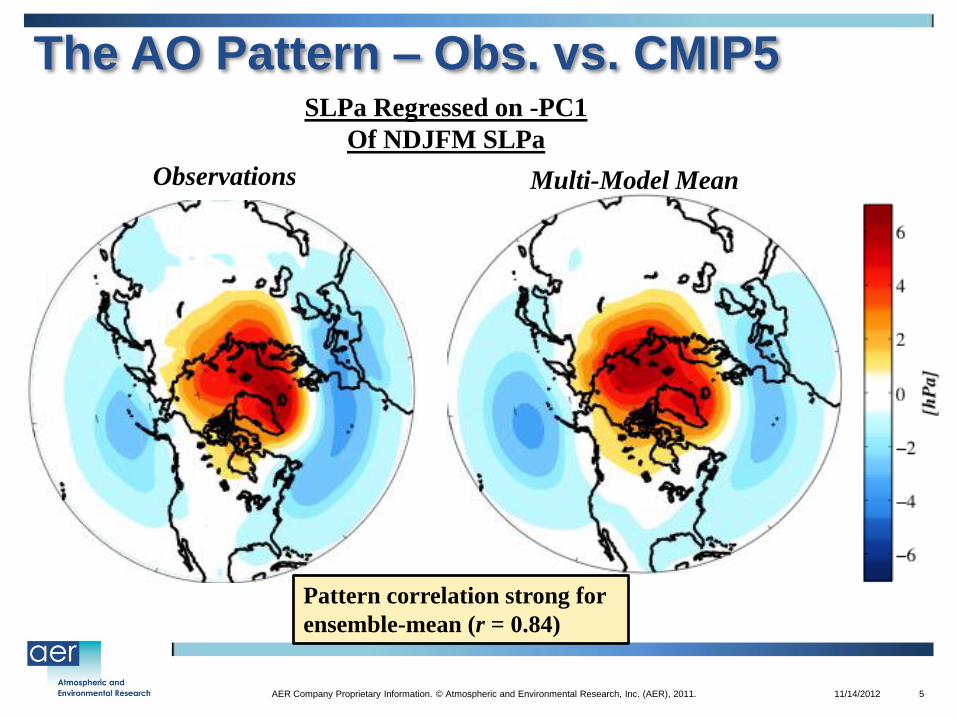
The AO Pattern – Obs. vs. CMIP5 SLPa Regressed on -PC1
Of NDJFM SLPa
Observations Multi-Model Mean
Pattern correlation strong for
ensemble-mean (r = 0.84)
11/14/2012 AER Company Proprietary Information. © Atmospheric and Environmental Research, Inc. (AER), 2011. 6
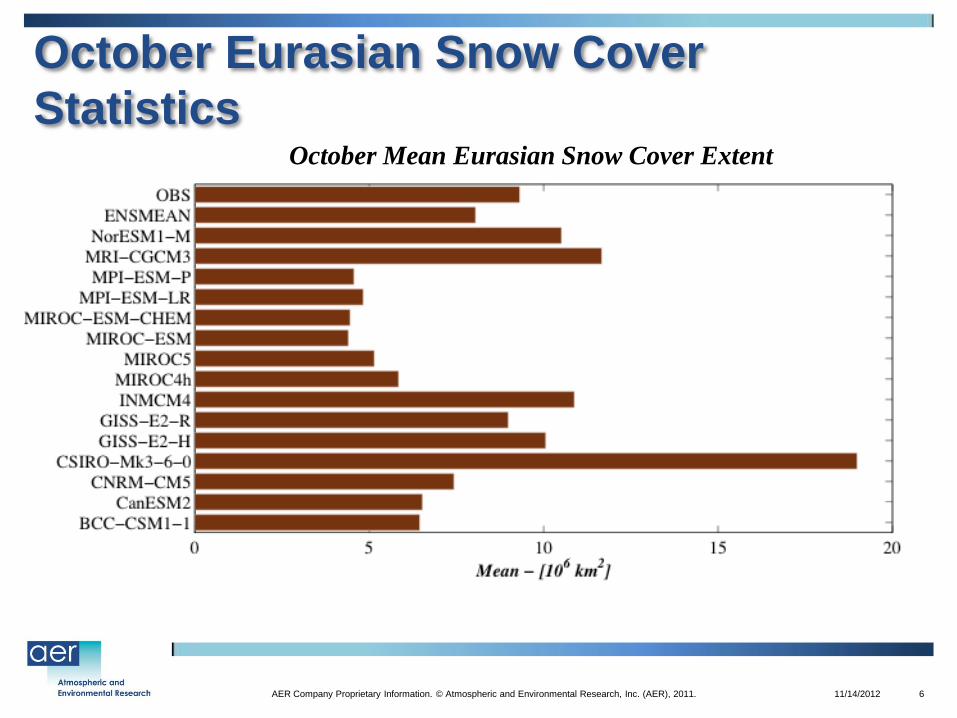
October Eurasian Snow Cover
Statistics October Mean Eurasian Snow Cover Extent
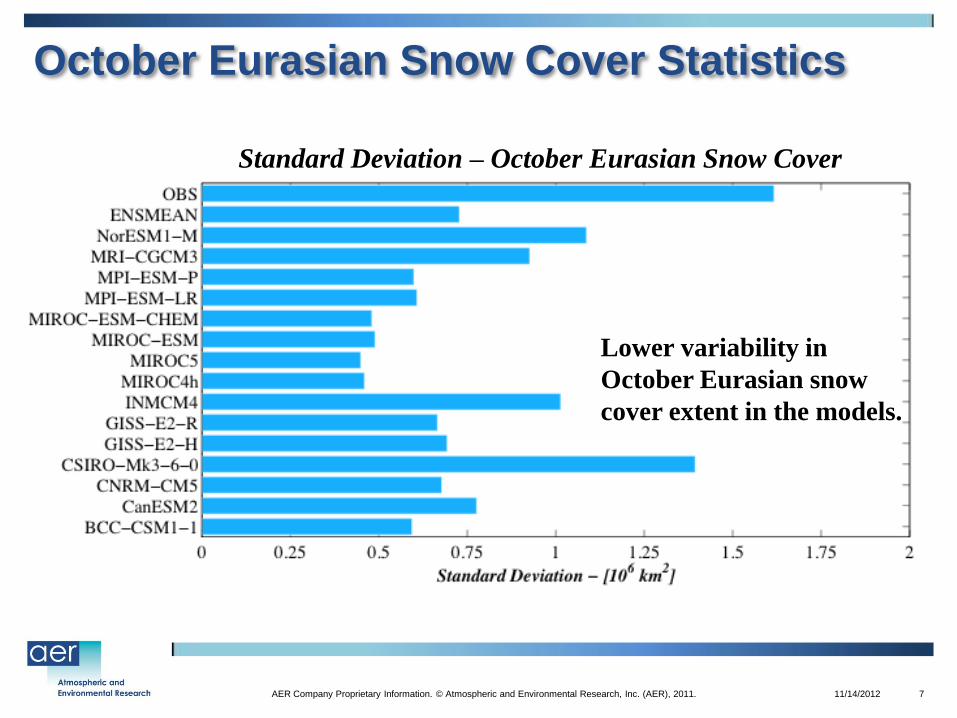
11/14/2012 AER Company Proprietary Information. © Atmospheric and Environmental Research, Inc. (AER), 2011. 7
October Eurasian Snow Cover Statistics
Lower variability in
October Eurasian snow
cover extent in the models.
Standard Deviation – October Eurasian Snow Cover
11/14/2012 AER Company Proprietary Information. © Atmospheric and Environmental Research, Inc. (AER), 2011. 8
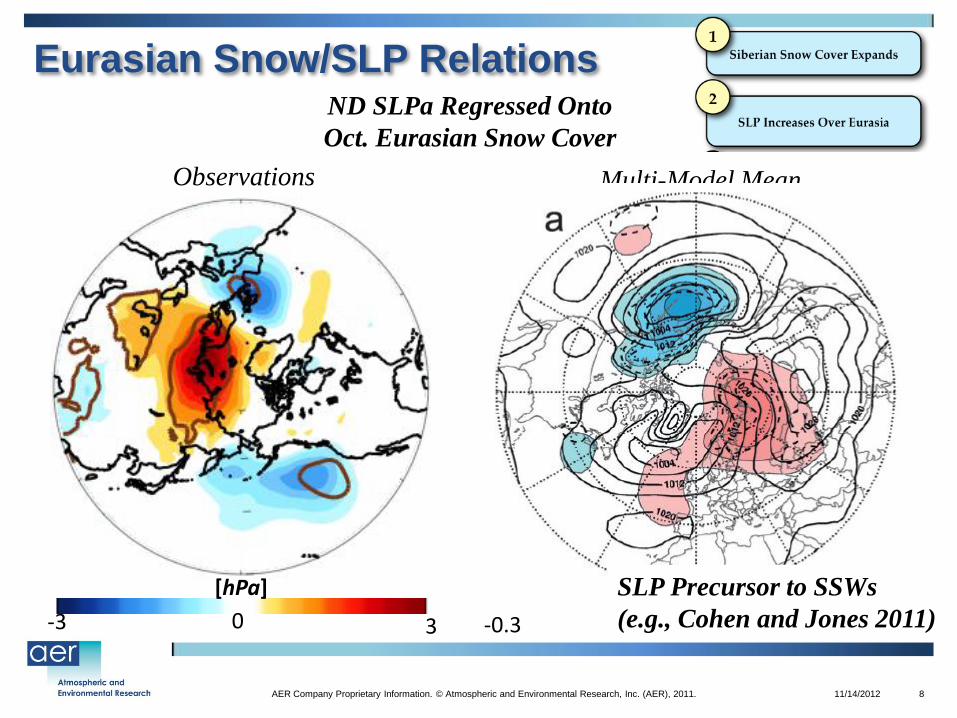
Eurasian Snow/SLP Relations ND SLPa Regressed Onto
Oct. Eurasian Snow Cover
Observations Multi-Model Mean
[hPa]
3 -3 0 0.3 -0.3 0
[hPa] SLP Precursor to SSWs
(e.g., Cohen and Jones 2011)
11/14/2012 AER Company Proprietary Information. © Atmospheric and Environmental Research, Inc. (AER), 2011. 9
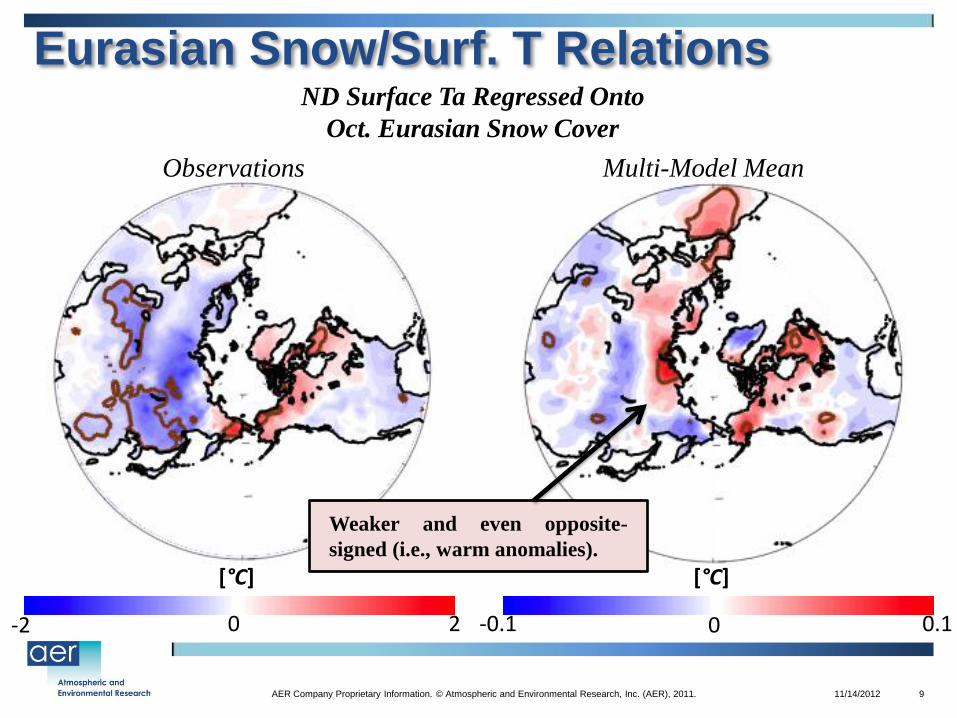
Eurasian Snow/Surf. T Relations ND Surface Ta Regressed Onto
Oct. Eurasian Snow Cover
Observations Multi-Model Mean
[°C]
-2 2 0
[°C]
-0.1 0.1 0
Weaker and even opposite-
signed (i.e., warm anomalies).
11/14/2012 AER Company Proprietary Information. © Atmospheric and Environmental Research, Inc. (AER), 2011. 10
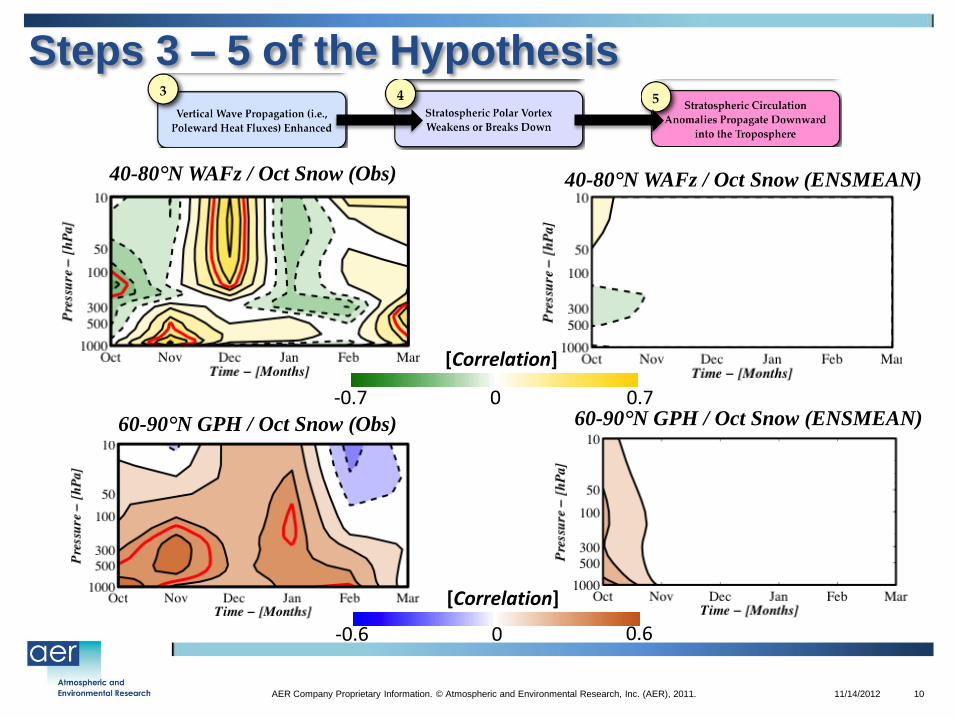
40-80°N WAFz / Oct Snow (Obs)
60-90°N GPH / Oct Snow (Obs) 60-90°N GPH / Oct Snow (ENSMEAN)
[Correlation]
-0.7 0.7 0
[Correlation]
-0.6 0.6 0
40-80°N WAFz / Oct Snow (ENSMEAN)
Steps 3 – 5 of the Hypothesis
11/14/2012 AER Company Proprietary Information. © Atmospheric and Environmental Research, Inc. (AER), 2011. 11
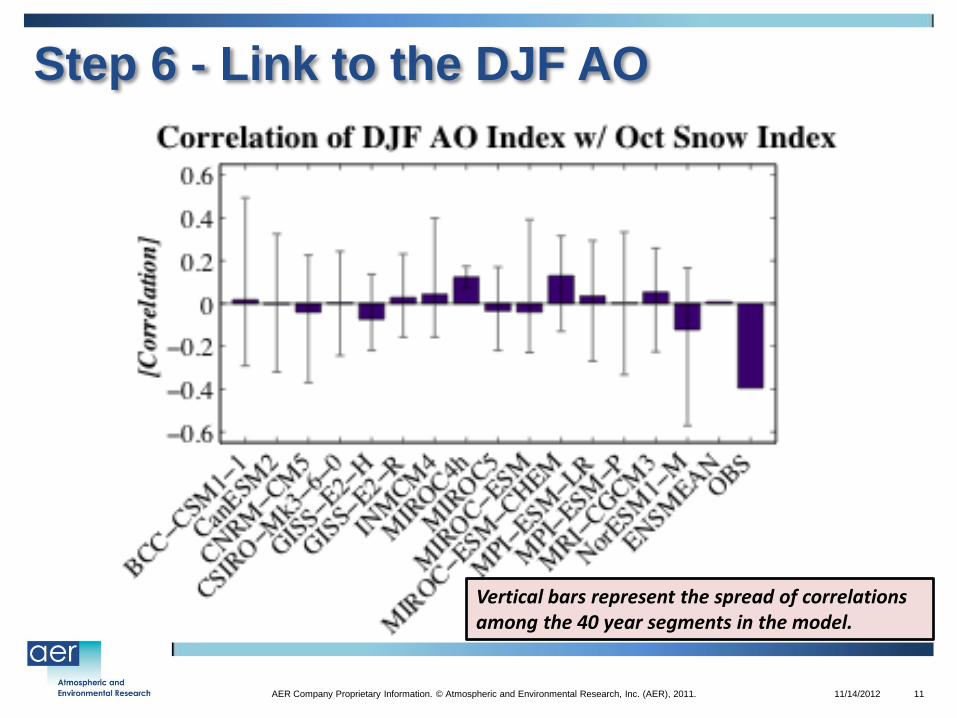
Step 6 - Link to the DJF AO
Vertical bars represent the spread of correlations among the 40 year segments in the model.
11/14/2012 AER Company Proprietary Information. © Atmospheric and Environmental Research, Inc. (AER), 2011. 12
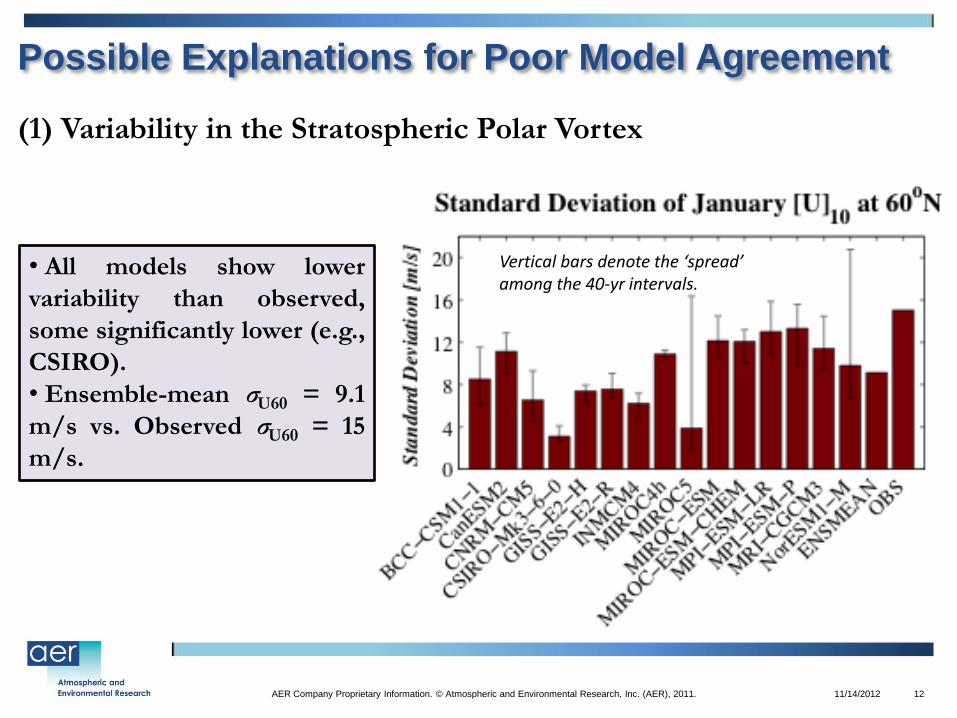
Possible Explanations for Poor Model Agreement
(1) Variability in the Stratospheric Polar Vortex
Vertical bars denote the ‘spread’ among the 40-yr intervals.
• All models show lower
variability than observed,
some significantly lower (e.g.,
CSIRO).
• Ensemble-mean σU60 = 9.1
m/s vs. Observed σU60 = 15
m/s.
11/14/2012 AER Company Proprietary Information. © Atmospheric and Environmental Research, Inc. (AER), 2011. 13
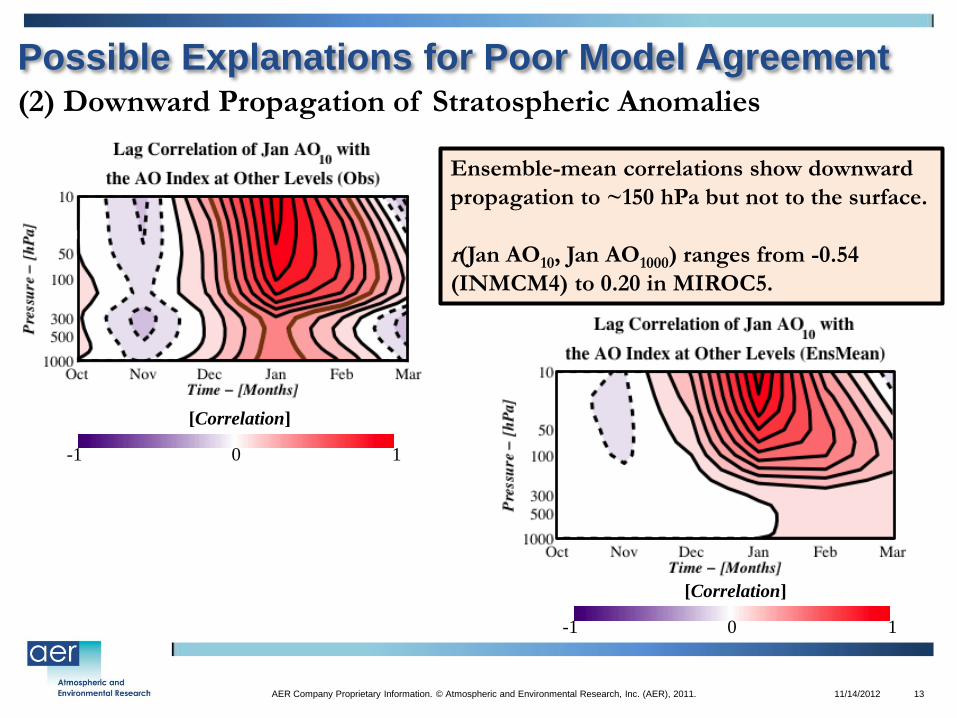
(2) Downward Propagation of Stratospheric Anomalies
Ensemble-mean correlations show downward
propagation to ~150 hPa but not to the surface.
r(Jan AO10, Jan AO1000) ranges from -0.54
(INMCM4) to 0.20 in MIROC5.
-1 1 0
[Correlation]
Possible Explanations for Poor Model Agreement
-1 1 0
[Correlation]
• The six-step snow-AO hypothesis does not verify in the CMIP5 models,
similar to the results from the CMIP3 models (Hardiman et al. 2008).
• Models continue to underperform on simulating fall snow cover extent, its
variability, and the lagged atmospheric response to the snow.
• Analysis with the historical runs yields very similar conclusions.
• Irrespective of the snow relationship, the coupled climate models have
issues with stratospheric vortex variability and ‘downward propagation’.
– This fact may give pause for wintertime climate model projections.
• Remaining Challenges/Future Work
– Snowfall/snow cover in the models. Precipitation-related? Land surface?
– Investigation of daily-mean output for downward propagation and wave
dynamics propagation. This is relevant for both S/T studies as well as the
snow-AO hypothesis.
11/14/2012 AER Company Proprietary Information. © Atmospheric and Environmental Research, Inc. (AER), 2011. 14
Summary and Conclusions
11/14/2012 AER Company Proprietary Information. © Atmospheric and Environmental Research, Inc. (AER), 2011. 15
This work is funded through NOAA Grant #NA10OAR4310163 and
NSF Grant #BCS-1060323.
Thank you!
Jason C Furtado
Atmospheric and Environmental Research
E-mail: [email protected]
11/14/2012 AER Company Proprietary Information. © Atmospheric and Environmental Research, Inc. (AER), 2011. 16
October 24, 2012
Jason C. Furtado,
Atmospheric and Environmental Research, Inc. (AER)
NOAA 37TH Annual Climate Diagnostics Workshop
11/14/2012 AER Company Proprietary Information. © Atmospheric and Environmental Research, Inc. (AER), 2011. 17
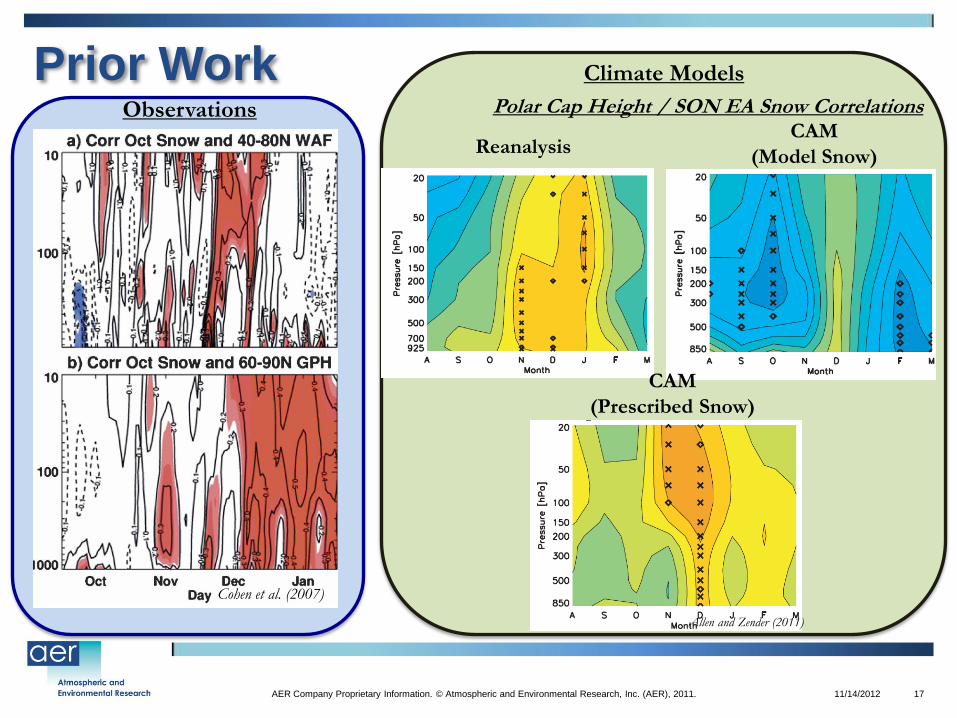
Prior Work
Cohen et al. (2007)
Observations
Climate Models
Polar Cap Height / SON EA Snow Correlations CAM
(Model Snow)
CAM
(Prescribed Snow)
Allen and Zender (2011)
Reanalysis
11/14/2012 AER Company Proprietary Information. © Atmospheric and Environmental Research, Inc. (AER), 2011. 18
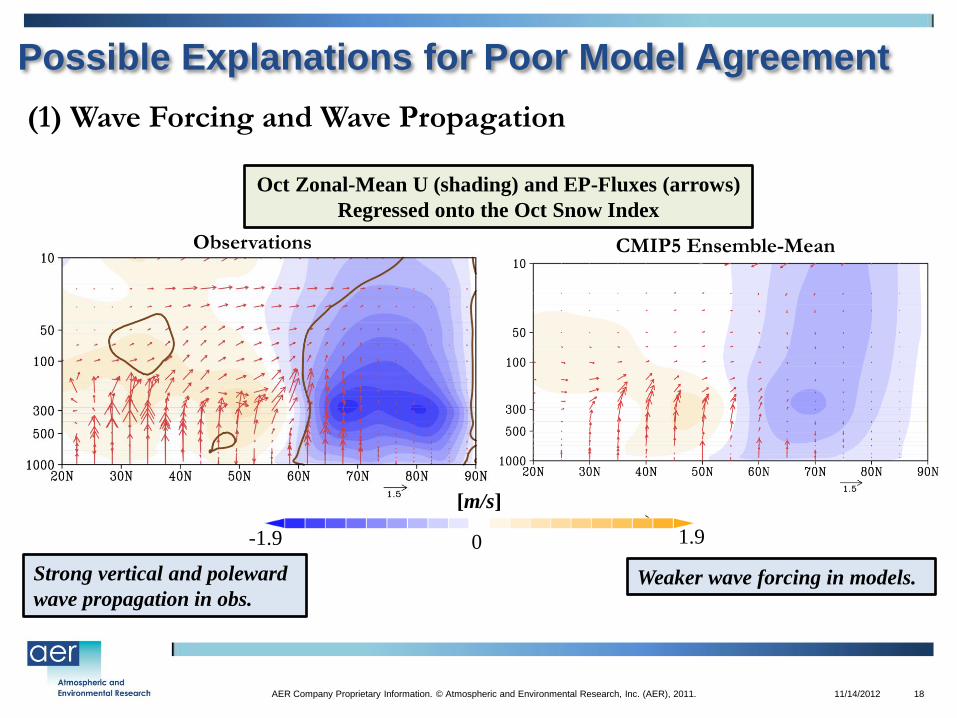
(1) Wave Forcing and Wave Propagation
Oct Zonal-Mean U (shading) and EP-Fluxes (arrows)
Regressed onto the Oct Snow Index
-1.9 1.9 0
Strong vertical and poleward
wave propagation in obs. Weaker wave forcing in models.
CMIP5 Ensemble-Mean
[m/s]
Observations
Possible Explanations for Poor Model Agreement
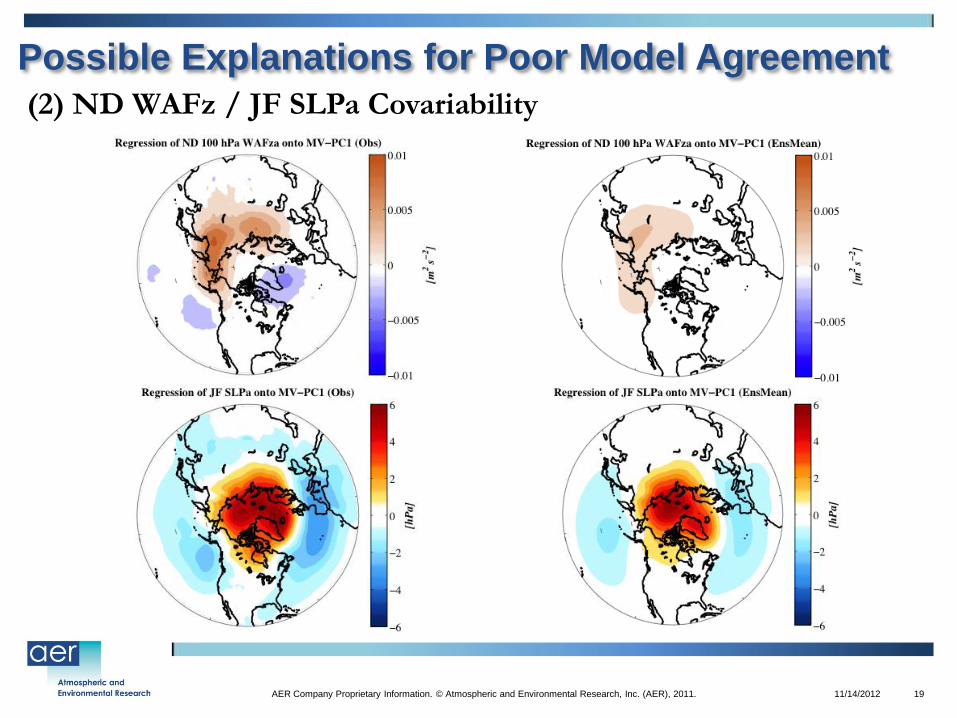
11/14/2012 AER Company Proprietary Information. © Atmospheric and Environmental Research, Inc. (AER), 2011. 19
Possible Explanations for Poor Model Agreement
(2) ND WAFz / JF SLPa Covariability