Embed Size (px)
Citation preview
2005 EUR 22157 EN
ATP as an indicator of microbiological activity in tap water
Katarzyna Ochromowicz, Eddo J. Hoekstra

ATP as an indicator of microbiological activity in tap water
Katarzyna Ochromowicz, Eddo J. Hoekstra 1
1 Correspondence to: E.J. Hoekstra European Commission, DG Joint Research Centre Via E. Fermi 1 (TP 280), Ispra (VA), Italia [email protected]
LEGAL NOTICE
Neither the European Commission nor any person acting on behalf of the Commission is responsible for
the use which might be made of the following information.
A great deal of additional information on the European Union is available on the Internet. It can be accessed through the Europa server
(http://europa.eu.int)
EUR 22157 EN © European Communities, 2005
Reproduction is authorised provided the source is acknowledged Printed in Italy
ISSN 1018-5593
TABLE OF CONTENTS INTRODUCTION .................................................................................................................................................... 7 METHODS AND MATERIALS............................................................................................................................. 9
REAGENTS ............................................................................................................................................................... 9 ATP ANALYSIS........................................................................................................................................................ 9 HETEROTROPHIC PLATE COUNT ........................................................................................................................... 10 SAMPLES ............................................................................................................................................................... 10
CALIBRATION CURVE ...................................................................................................................................... 11 DETECTION LIMIT OF ATP ............................................................................................................................. 13 CALCULATION OF ATP CONCENTRATION IN THE SAMPLES............................................................ 15 RLU RESPONSE.................................................................................................................................................... 17
EFFECT OF SAMPLE VOLUME................................................................................................................................. 17 EFFECT OF AMBIENT LIGHT ................................................................................................................................... 17 EFFECT OF LUMINEX ON RESPONSE ..................................................................................................................... 19 EFFECT OF LUMINATE VOLUME ON RESPONSE .................................................................................................... 19
ATP STABILITY AND DEGRADATION.......................................................................................................... 21 CALCULATION OF ATP CONCENTRATION IN SAMPLES PREPARED FOR ATP DEGRADATION................................ 21
INFLUENCE OF STAGNATION TIME ON ATP CONCENTRATION IN TAP WATER SAMPLES... 25 500 ML SAMPLES AT CONSUMERS’ TAP IN LEGGIUNO AND LAVENO .................................................................... 25 ATP CONCENTRATIONS IN 20 SUCCESSIVE 50 ML TAP WATER SAMPLES FROM LEGGIUNO AND LAVENO ........... 28 ATP CONCENTRATIONS IN SAMPLES FROM THE DYNAMIC TEST FACILITY.......................................................... 29 OVERVIEW OF ATP CONCENTRATIONS IN TAP WATER SAMPLES FROM DIFFERENT DISTRIBUTION SYSTEMS ...... 35
HETEROTROPHIC PLATE COUNTS OF TAP WATER SAMPLES.......................................................... 37 CONCLUSIONS ..................................................................................................................................................... 41 REFERENCES........................................................................................................................................................ 43 ANNEX 1 DETECTION LIMIT OF ATP ................................................................................................... 45 ANNEX 2 CALIBRATION DATA ............................................................................................................... 47 ANNEX 3 RLU RESPONSE.......................................................................................................................... 53 ANNEX 4 METHODS FOR ATP CALCULATION IN THE SAMPLES............................................... 57 ANNEX 5 ATP STABILITY AND DEGRADATION................................................................................ 59 ANNEX 6 INFLUENCE OF STAGNATION TIME ON ATP CONCENTRATION IN TAP WATER
SAMPLES...................................................................................................................................... 63 ANNEX 7 HETEROTROPHIC PLATE COUNTS OF TAP WATER SAMPLES................................ 74

7
INTRODUCTION The DWD [7] requires from Member States to take all measures to ensure that water intended for human consumption is free from any micro-organisms, parasites and from any substances, which in numbers or concentrations, constitute a potential danger to human health. Traditional methods to evaluate the presence of bacteria in drinking water samples, such as Heterotrophic Plate Count (HPC), need a few days of incubation and require selection of appropriate temperature and medium. Another important disadvantage is that a small fraction of microorganisms is able to cultivate on artificial mediums [1].
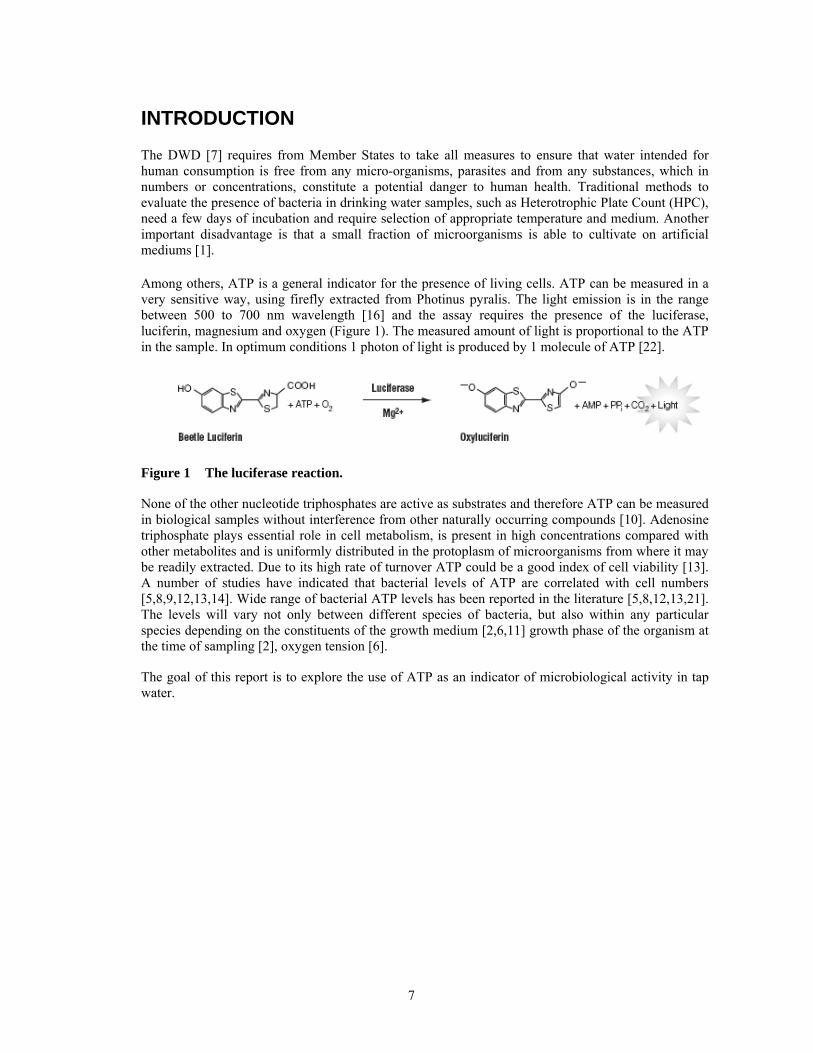
Among others, ATP is a general indicator for the presence of living cells. ATP can be measured in a very sensitive way, using firefly extracted from Photinus pyralis. The light emission is in the range between 500 to 700 nm wavelength [16] and the assay requires the presence of the luciferase, luciferin, magnesium and oxygen (Figure 1). The measured amount of light is proportional to the ATP in the sample. In optimum conditions 1 photon of light is produced by 1 molecule of ATP [22].
Figure 1 The luciferase reaction.
None of the other nucleotide triphosphates are active as substrates and therefore ATP can be measured in biological samples without interference from other naturally occurring compounds [10]. Adenosine triphosphate plays essential role in cell metabolism, is present in high concentrations compared with other metabolites and is uniformly distributed in the protoplasm of microorganisms from where it may be readily extracted. Due to its high rate of turnover ATP could be a good index of cell viability [13]. A number of studies have indicated that bacterial levels of ATP are correlated with cell numbers [5,8,9,12,13,14]. Wide range of bacterial ATP levels has been reported in the literature [5,8,12,13,21]. The levels will vary not only between different species of bacteria, but also within any particular species depending on the constituents of the growth medium [2,6,11] growth phase of the organism at the time of sampling [2], oxygen tension [6].
The goal of this report is to explore the use of ATP as an indicator of microbiological activity in tap water.

9
METHODS AND MATERIALS
Reagents
Celsis LuminATE is the light generating reagent containing luciferin and luciferase. It is supplied as a freeze-dried pellet and stored at 5o C. It is reconstituted with 7 ml of Celsis LuminATE Buffer and is stable for 24 h at room temperature [4].
Celsis LuminATE Buffer is used for LuminATE and ATP Standard reconstitution. It is stored at 5o C [4].
Celsis LuminEX is used for the destruction of the microbial cell membrane. It is stored at 5o C [4].
ATP Standard is supplied by Celsis in freeze-dried form. Each vial of adenosine-5’triphosphate contains 10 µg of disodium salt, 0.025 M Hepes buffer, MgSO4 , EDTA, sodium azide and 0.02 mg bovine serum albumin [4]. Small aliquots containing 100 µl of 2 mg/l ATP solutions after reconstitution with LuminATE Buffer were immediately frozen and stored at -80 o C in capped tubes. During the performance of the analyses reagents were maintained at room temperature.
Milli-Q water was obtained from a combined Elix-Element system (Millipore). Tap water initially passes through a ProgardTM pretreatment pack. It is designed to remove free particles and free chlorine from the water. The water is pressurized with a pump and than is purified by reverse osmosis (RO). Afterwards the RO product water passes through an electrodeionisation (E.D.I) module, where organic and mineral contaminants levels are reduced. Pre-treated water is exposed a 185/254 nm UV lamp to ensure the destruction of organisms, including those with trapped metals. The released elements can than be retained by the ion exchange resins. Afterwards water goes through the G-Gard polishing packs, which contains high quality ion-exchange mixed bed resin in a pure natural polypropylene housing selected for its low leaching characteristics. Final filtration is ensured through a 0.1 µm filter containing ultra high molecular weight polyethylene membrane able to remove trace ions and oxidation by-products produced by the action of the UV light [18].
Sterile water produced by Monico SPA is bought in glass bottles containing 500 ml. It is prepared by reverse osmosis followed by distillation and sterilization at 120o C.
ATP analysis
ATP was analyzed using a luminometer (Celsis AdvanceTM Coupe). 100 µl of the sample was put in the ATP-free disposable polystyrene tube and put in the autosampler. For the determination of free ATP, i.e. the fraction not present inside the cells, 100 µl of the mixture of luciferin-luciferase (Celsis, LuminATE) was injected into the sample by the automatic dispenser. For the determination of total ATP, i.e. free and cellular ATP, first 100 µl of a reagent that destroys the microbial cell membrane (Celsis, LuminEX) was added followed by the mixture of 100 µl of luciferin-luciferase (Celsis, LuminATE).
The background measuring time and sample measuring time were set at 10 s. The background measuring time is the measuring time prior to the actual injection of the reagents. The sample measuring time is the time that the instrument reads the sample tube, where the bioluminescent reaction is taking place.
To enable proper dissolution and reaction of LuminEX in the sample, the injection of LuminATE was delayed by 30 sec. A delay of 2 sec. was used between the injection of LuminATE and the measuring
10
time. The luminometer is calibrated to measure optimally at 560 nm wavelength of light emitted by the luminescence reaction [3].
Following technical specifications the start-up and shut-down procedure by rinsing and washing the reagents out of the tubing has been applied every measuring day. Prior to calibration and analyzing samples, blank empty tubes have been analyzed to check the background response [3].
Heterotrophic Plate Count
Water samples have been cultivated on two different mediums: R2A and PCA [19] for total counts of heterotrophic bacteria. 1 ml of the sample was placed in the Petri dish on both mediums. The plates were incubated at 22°C for 68 hours and at 37°C for 44 hours. Additionally for each medium and temperature blank mediums have been prepared.
Samples
Samples have been collected from tap water on the premises of JRC in Ispra, Italy and in surrounding villages. The volume of the samples was 50 or 500 ml. Sampling bottles before sampling have been thoroughly washed: firstly in an automatic washing machine, subsequently washed with 1% nitric acid solution and followed by three times with Milli-Q water.
The tap sampling procedure was consisted of flushing the tap for one minute and taking directly a sample first followed by a known stagnation period and sampling two or more successive samples.
Additionally samples have been obtained using the Dynamic Test Facility. The Dynamic Test Facility is a device that simulates consumer behaviour enabling to measure automatically temperature, pH, conductivity and dissolved oxygen of the incoming water. The facility is used to study corrosion and the potential of materials to form a biofilm. Currently 4 lines with different pipe materials are in use: copper, stainless steel, galvanized, polypropylene. The DTF has been programmed to take samples automatically after stagnation times of 0.5, 1, 2, 4, 8 and 16 h. Since 0.5 and 1 h stagnation (0.5 HS and 1 HS) occur twice in the measuring procedure, the nomenclature 1st and 2nd stagnation have been used. The volume of all DTF samples is 200 ml.
11
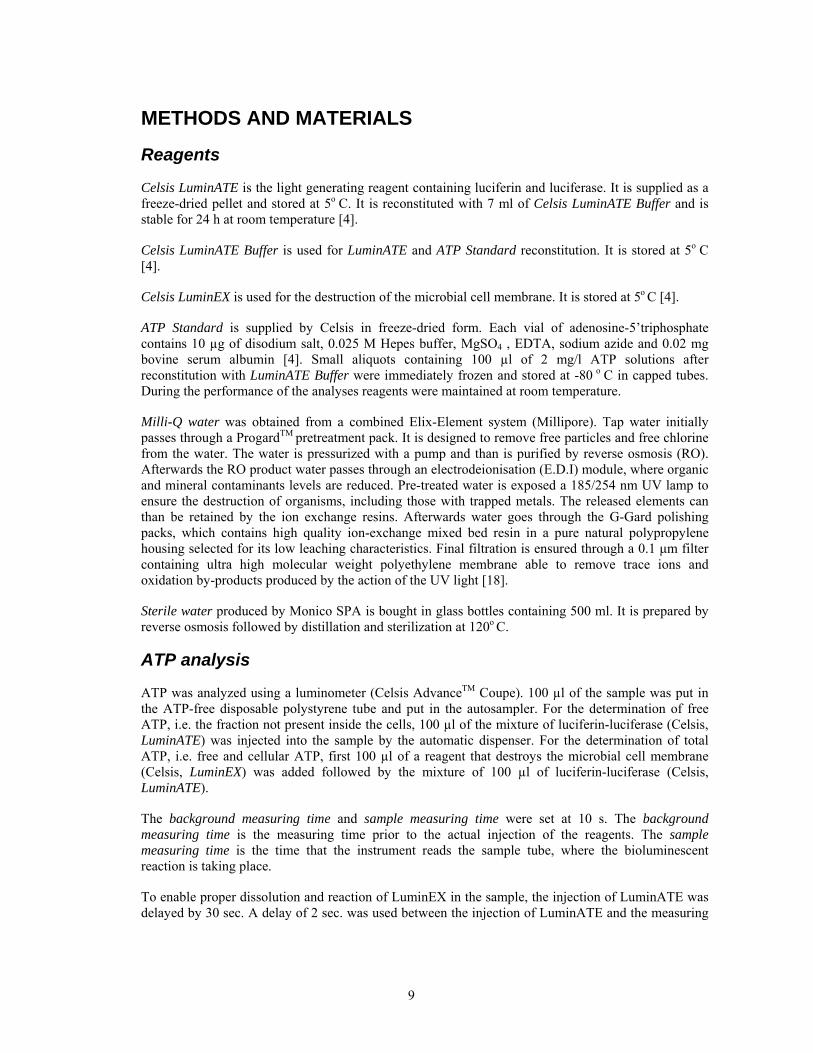
CALIBRATION CURVE On each measuring day a new ATP stock solution containing 100 µl of 2 mg/l ATP has been used. After thawing for half an hour at a room temperature, the stock solution was 1000-fold diluted followed by steps of 10-fold dilutions down to 2 ng ATP/l. This latter solution was diluted 2-fold (1 ng ATP/l). On each day, a calibration curve (Figure 2) for total and free ATP concentration has been prepared. Annex 2 gives the details for all curves.
As a solvent for ATP dilutions firstly Milli-Q water and sterile water have been used. However, considering the fact that this may lead to underestimation of ATP concentrations in samples, due to the composition of the tap water [22] further dilutions have been prepared using water from water production point in JRC-Ispra, Italy.
calibration curves
y = 15.666x + 45.283R2 = 1
y = 24.89x + 32.523R2 = 1
0
1000
2000
3000
4000
5000
6000
0 50 100 150 200 250
ATP concentration [ng/l]
RLU
Linear (total ATP) Linear (free ATP)
Figure 2 Calibration curves for total and free ATP
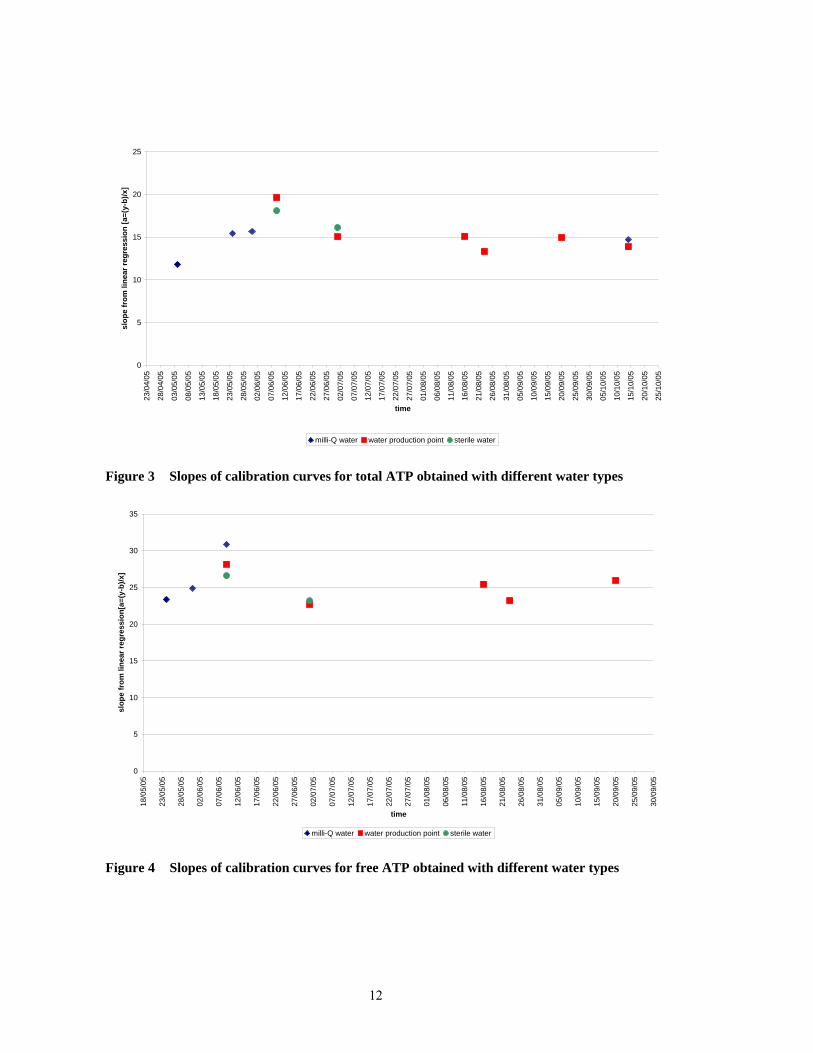
Slopes obtained through linear regression of all calibration curves (prepared on each measuring day) are illustrated in Figure 3 for total ATP and Figure 4 for free ATP. The average slope of calibration curve for total ATP is 15±2.29 and for free ATP 25±2.60.
12
0
5
10
15
20
2523
/04/
05
28/0
4/05
03/0
5/05
08/0
5/05
13/0
5/05
18/0
5/05
23/0
5/05
28/0
5/05
02/0
6/05
07/0
6/05
12/0
6/05
17/0
6/05
22/0
6/05
27/0
6/05
02/0
7/05
07/0
7/05
12/0
7/05
17/0
7/05
22/0
7/05
27/0
7/05
01/0
8/05
06/0
8/05
11/0
8/05
16/0
8/05
21/0
8/05
26/0
8/05
31/0
8/05
05/0
9/05
10/0
9/05
15/0
9/05
20/0
9/05
25/0
9/05
30/0
9/05
05/1
0/05
10/1
0/05
15/1
0/05
20/1
0/05
25/1
0/05
time
slop
e fr
om li
near
regr
essi
on [a
=(y-
b)/x
]
milli-Q water water production point sterile water
Figure 3 Slopes of calibration curves for total ATP obtained with different water types
0
5
10
15
20
25
30
35
18/0
5/05
23/0
5/05
28/0
5/05
02/0
6/05
07/0
6/05
12/0
6/05
17/0
6/05
22/0
6/05
27/0
6/05
02/0
7/05
07/0
7/05
12/0
7/05
17/0
7/05
22/0
7/05
27/0
7/05
01/0
8/05
06/0
8/05
11/0
8/05
16/0
8/05
21/0
8/05
26/0
8/05
31/0
8/05
05/0
9/05
10/0
9/05
15/0
9/05
20/0
9/05
25/0
9/05
30/0
9/05
time
slop
e fr
om li
near
regr
essi
on[a
=(y-
b)/x
]
milli-Q water water production point sterile water
Figure 4 Slopes of calibration curves for free ATP obtained with different water types

13
DETECTION LIMIT OF ATP To estimate the limit of detection that is significantly different from the background, the comparison of the RLU average of two concentrations was performed. It was assumed that the standard deviations of the two means are not significantly different [17]:
Eq.1 S2 = ((n1-1)s12+(n2-1) s2
2)/( n1+ n2-2)
n1 amount of water samples (milli-Q water samples) n2 amount of samples with 0.2 ng/l ATP concentration s1 standard deviation of water samples (milli-Q water samples) s2 standard deviation of samples with 0.2 ng/l ATP concentration
Eq.2 t = (x1-x2)/s/(1/n1+1/n2)2
x1 mean of water samples (milli-Q water samples) x2 mean of samples with 0.2 ng/l ATP concentration t has f = (n1+ n2)-2 degrees of freedom
Annex 1 gives the data of milli-Q water, 0.2, 1, 2, 20, 200 ng/l of ATP. As an example the hypothesis was tested that the two RLU means obtained for Milli-Q water samples and 0.2 ng/l ATP samples are equal. There are 10 degrees of freedom for comparison of Milli-Q water samples and 0.2 ng/l ATP samples. The calculated ׀t׀ value is 1.42. The critical value of ׀t׀ (P=0.05) is 2.23. Since the critical ׀t׀ (P=0.05) value is higher than the calculated value, the difference between RLU values of Milli-Q water samples and 0.2 ng/l ATP samples is not significant.
Using the same statistical test RLU values of the following averages have been compared:
a. Milli-Q water and 1ng/l ATP
b. 0.2 ng/l ATP and 1 ng/l ATP
c. 1 ng/l ATP and 2 ng/l ATP
The test show that the critical values of ׀t׀ (P=0.05) for the above samples are lower than the calculated ׀t׀ values, therefore the differences between RLU means for these cases are significant. The concentration of 1 ng/l ATP is a good estimate of the limit of detection since it is significantly different from milli-Q water and 0.2 ng/l ATP.

15
CALCULATION OF ATP CONCENTRATION IN THE SAMPLES
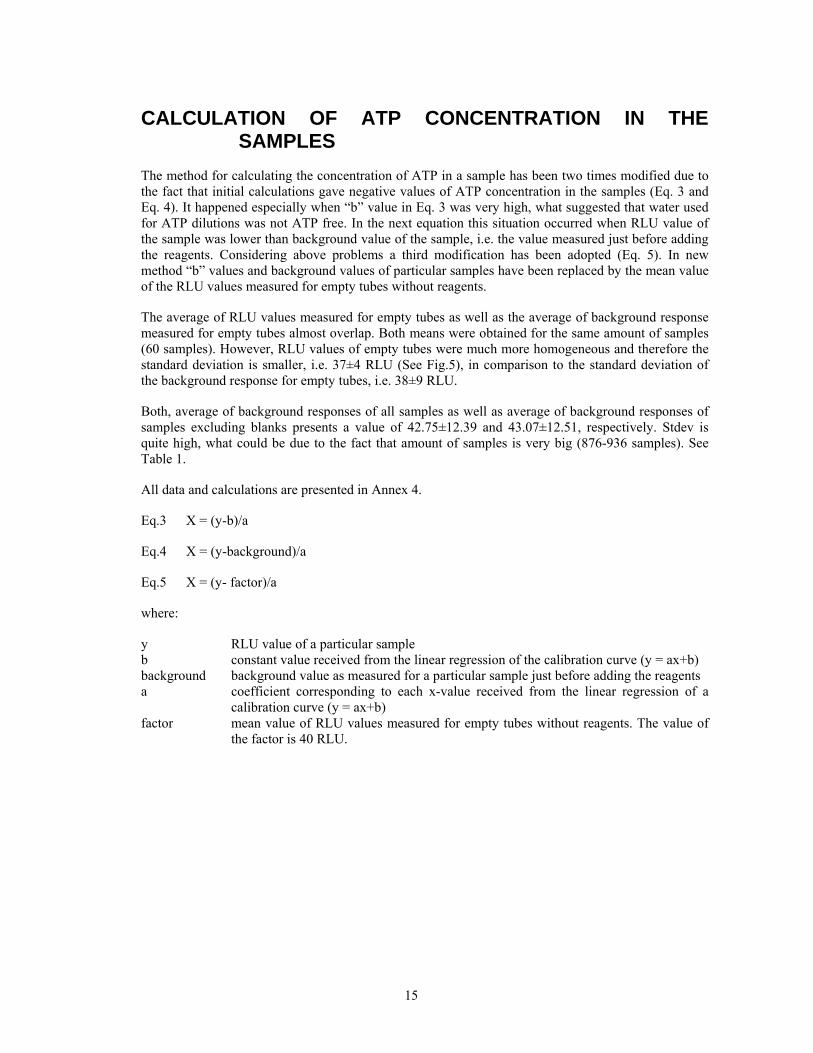
The method for calculating the concentration of ATP in a sample has been two times modified due to the fact that initial calculations gave negative values of ATP concentration in the samples (Eq. 3 and Eq. 4). It happened especially when “b” value in Eq. 3 was very high, what suggested that water used for ATP dilutions was not ATP free. In the next equation this situation occurred when RLU value of the sample was lower than background value of the sample, i.e. the value measured just before adding the reagents. Considering above problems a third modification has been adopted (Eq. 5). In new method “b” values and background values of particular samples have been replaced by the mean value of the RLU values measured for empty tubes without reagents.
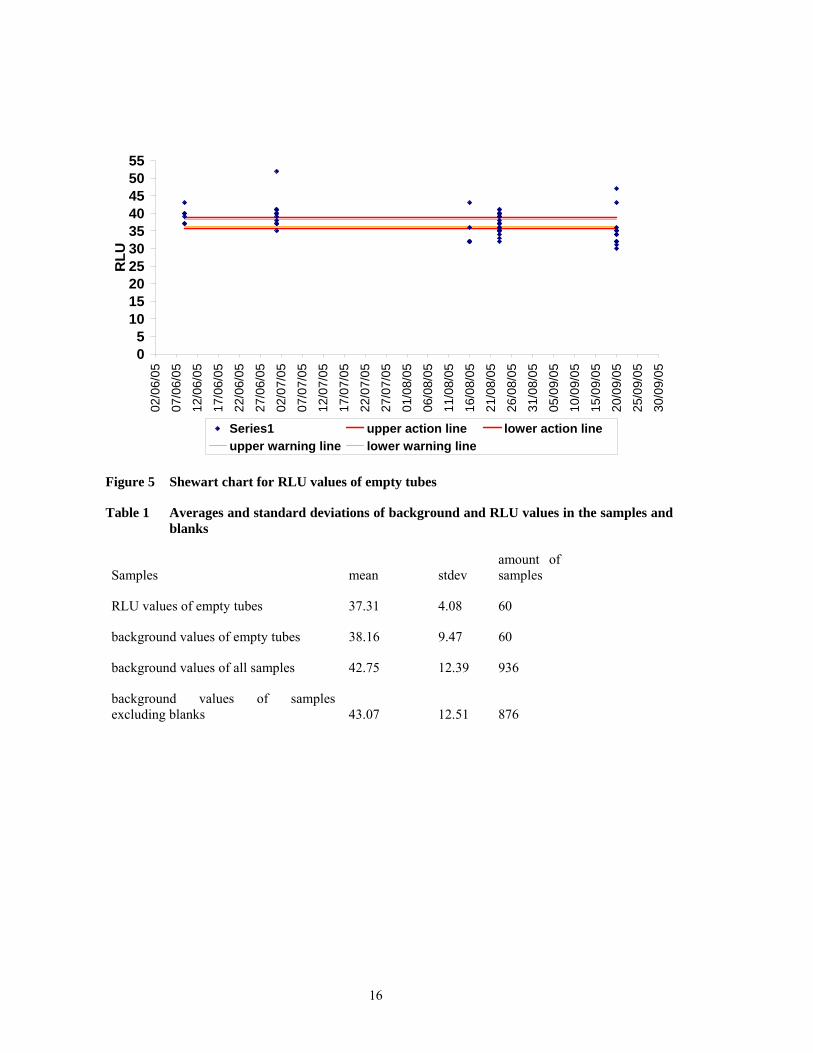
The average of RLU values measured for empty tubes as well as the average of background response measured for empty tubes almost overlap. Both means were obtained for the same amount of samples (60 samples). However, RLU values of empty tubes were much more homogeneous and therefore the standard deviation is smaller, i.e. 37±4 RLU (See Fig.5), in comparison to the standard deviation of the background response for empty tubes, i.e. 38±9 RLU.
Both, average of background responses of all samples as well as average of background responses of samples excluding blanks presents a value of 42.75±12.39 and 43.07±12.51, respectively. Stdev is quite high, what could be due to the fact that amount of samples is very big (876-936 samples). See Table 1.
All data and calculations are presented in Annex 4.
Eq.3 X = (y-b)/a
Eq.4 X = (y-background)/a
Eq.5 X = (y- factor)/a
where:
y RLU value of a particular sample b constant value received from the linear regression of the calibration curve (y = ax+b) background background value as measured for a particular sample just before adding the reagents a coefficient corresponding to each x-value received from the linear regression of a
calibration curve (y = ax+b) factor mean value of RLU values measured for empty tubes without reagents. The value of
the factor is 40 RLU.
16
05
10152025303540455055
02/0
6/05
07/0
6/05
12/0
6/05
17/0
6/05
22/0
6/05
27/0
6/05
02/0
7/05
07/0
7/05
12/0
7/05
17/0
7/05
22/0
7/05
27/0
7/05
01/0
8/05
06/0
8/05
11/0
8/05
16/0
8/05
21/0
8/05
26/0
8/05
31/0
8/05
05/0
9/05
10/0
9/05
15/0
9/05
20/0
9/05
25/0
9/05
30/0
9/05
Date
RLU
Series1 upper action line lower action lineupper warning line lower warning line
Figure 5 Shewart chart for RLU values of empty tubes
Table 1 Averages and standard deviations of background and RLU values in the samples and blanks
Samples mean stdev amount of samples
RLU values of empty tubes 37.31 4.08 60
background values of empty tubes 38.16 9.47 60
background values of all samples 42.75 12.39 936
background values of samples excluding blanks 43.07 12.51 876
17
RLU RESPONSE The assay was performed on samples containing only milli-Q water in order to check how different variable would modify the response. Different volume of milli-Q water samples seems not to have a significant influence. RLU values were fluctuating in the range 35-45 RLU. Sunlight exposure was another parameter of interest. Although some samples gave elevated RLU values after sunlight exposure has been applied others didn’t change the response. Additionally, since all tubes used in experiments were polystyrene, an “antistatic test”, to see if material of tubes have any influence on the response, have been included.
Effect of sample volume
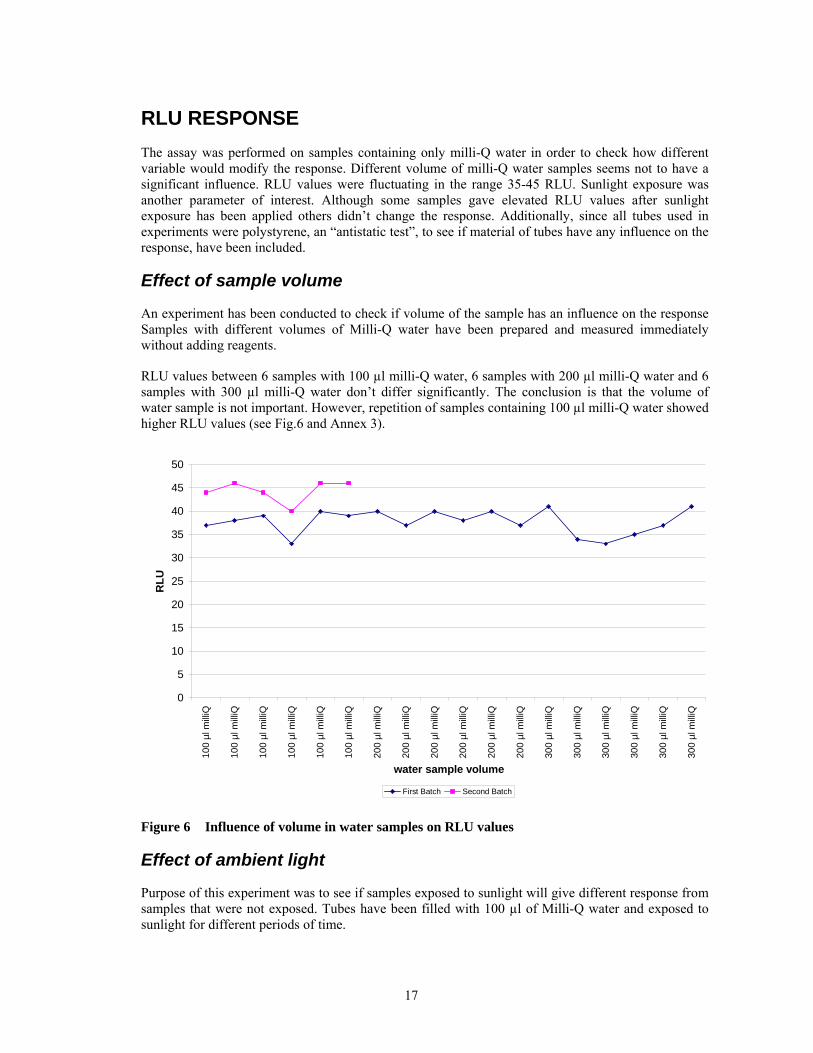
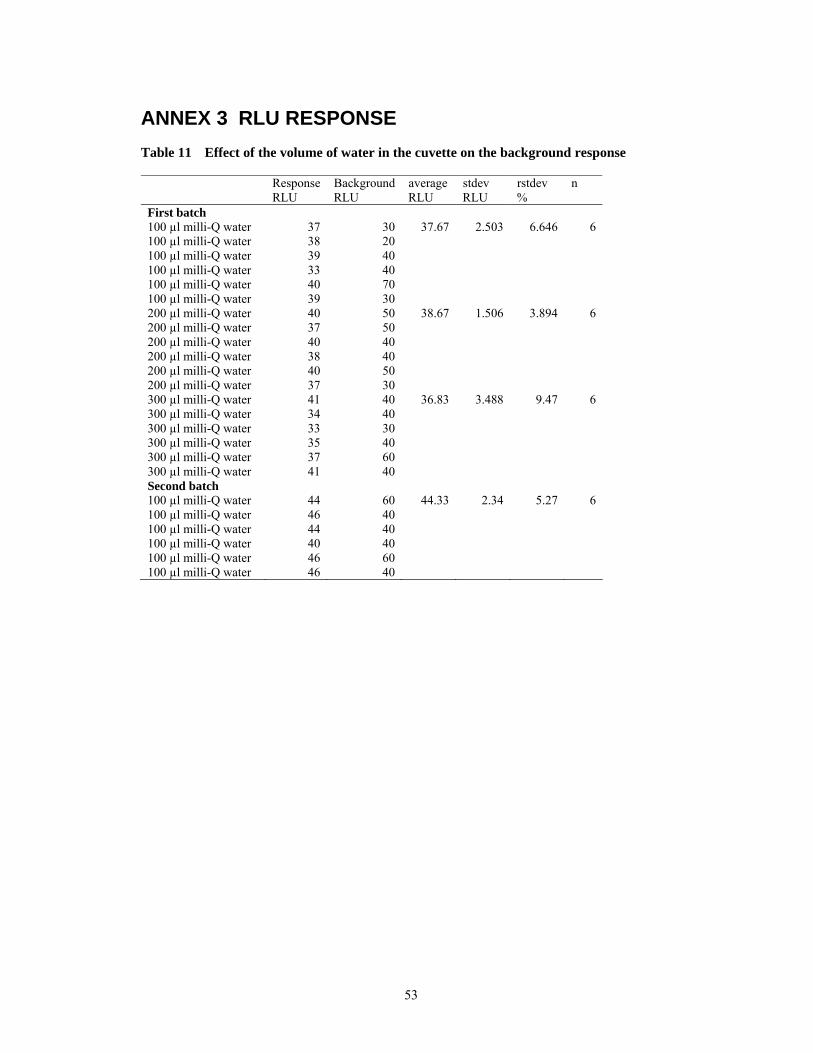
An experiment has been conducted to check if volume of the sample has an influence on the response Samples with different volumes of Milli-Q water have been prepared and measured immediately without adding reagents.
RLU values between 6 samples with 100 µl milli-Q water, 6 samples with 200 µl milli-Q water and 6 samples with 300 µl milli-Q water don’t differ significantly. The conclusion is that the volume of water sample is not important. However, repetition of samples containing 100 µl milli-Q water showed higher RLU values (see Fig.6 and Annex 3).
0
5
10
15
20
25
30
35
40
45
50
100
µl m
illiQ
100
µl m
illiQ
100
µl m
illiQ
100
µl m
illiQ
100
µl m
illiQ
100
µl m
illiQ
200
µl m
illiQ
200
µl m
illiQ
200
µl m
illiQ
200
µl m
illiQ
200
µl m
illiQ
200
µl m
illiQ
300
µl m
illiQ
300
µl m
illiQ
300
µl m
illiQ
300
µl m
illiQ
300
µl m
illiQ
300
µl m
illiQ
water sample volume
RLU
First Batch Second Batch
Figure 6 Influence of volume in water samples on RLU values
Effect of ambient light
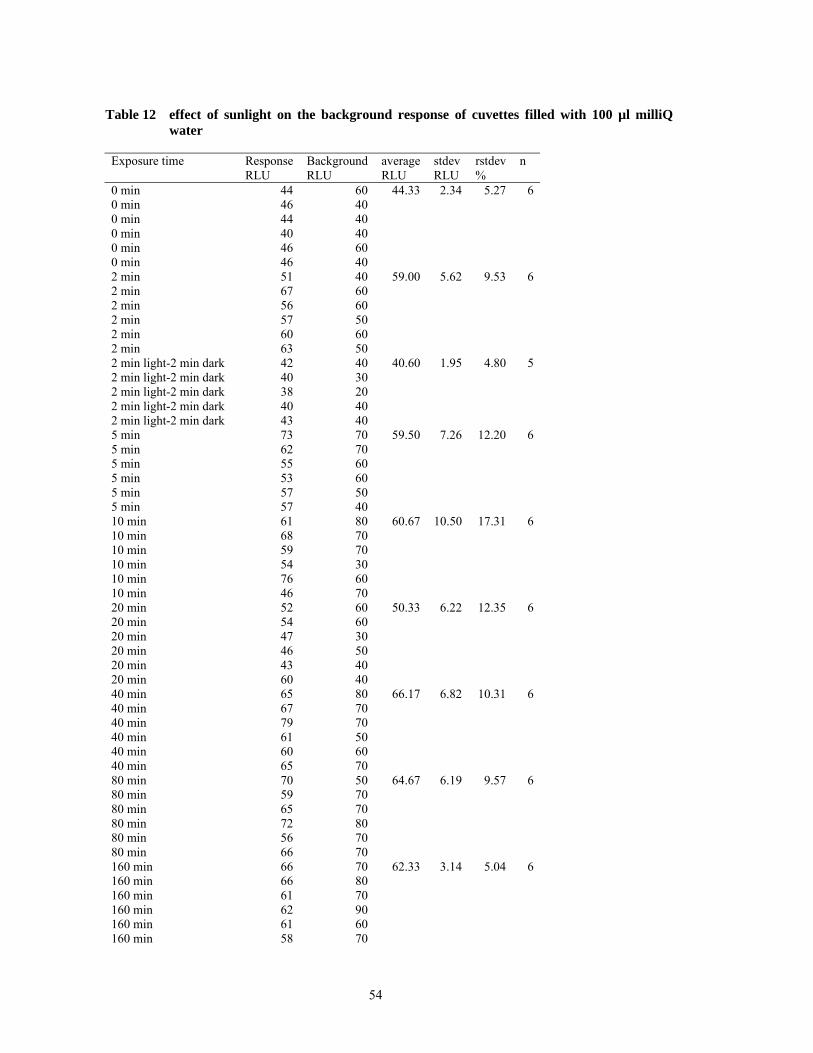
Purpose of this experiment was to see if samples exposed to sunlight will give different response from samples that were not exposed. Tubes have been filled with 100 µl of Milli-Q water and exposed to sunlight for different periods of time.
18
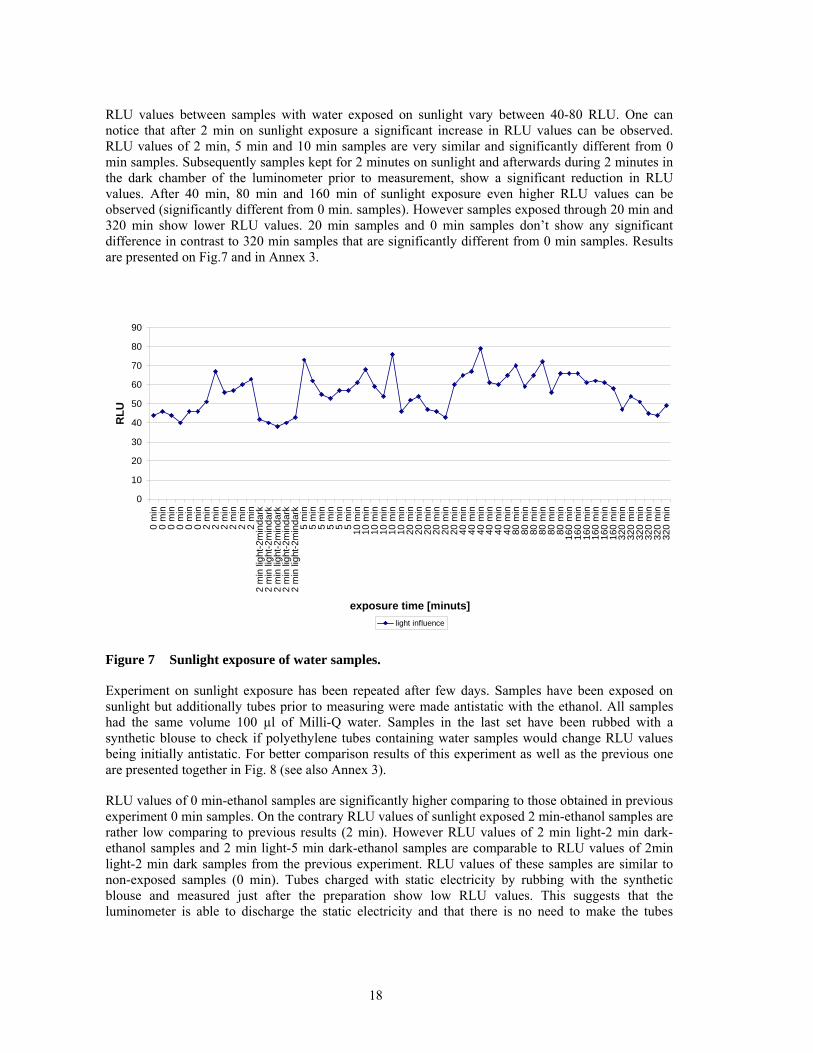
RLU values between samples with water exposed on sunlight vary between 40-80 RLU. One can notice that after 2 min on sunlight exposure a significant increase in RLU values can be observed. RLU values of 2 min, 5 min and 10 min samples are very similar and significantly different from 0 min samples. Subsequently samples kept for 2 minutes on sunlight and afterwards during 2 minutes in the dark chamber of the luminometer prior to measurement, show a significant reduction in RLU values. After 40 min, 80 min and 160 min of sunlight exposure even higher RLU values can be observed (significantly different from 0 min. samples). However samples exposed through 20 min and 320 min show lower RLU values. 20 min samples and 0 min samples don’t show any significant difference in contrast to 320 min samples that are significantly different from 0 min samples. Results are presented on Fig.7 and in Annex 3.
0
10
20
30
40
50
60
70
80
90
0 m
in0
min
0 m
in0
min
0 m
in0
min
2 m
in 2
min
2 m
in 2
min
2 m
in 2
min
2 m
in li
ght-2
min
dark
2 m
in li
ght-2
min
dark
2 m
in li
ght-2
min
dark
2 m
in li
ght-2
min
dark
2 m
in li
ght-2
min
dark
5 m
in5
min
5 m
in5
min
5 m
in5
min
10 m
in10
min
10 m
in10
min
10 m
in10
min
20 m
in20
min
20 m
in20
min
20 m
in20
min
40 m
in40
min
40 m
in40
min
40 m
in40
min
80
min
80
min
80
min
80
min
80
min
80
min
160
min
160
min
160
min
160
min
160
min
160
min
320
min
320
min
320
min
320
min
320
min
320
min
exposure time [minuts]
RLU
light influence
Figure 7 Sunlight exposure of water samples.
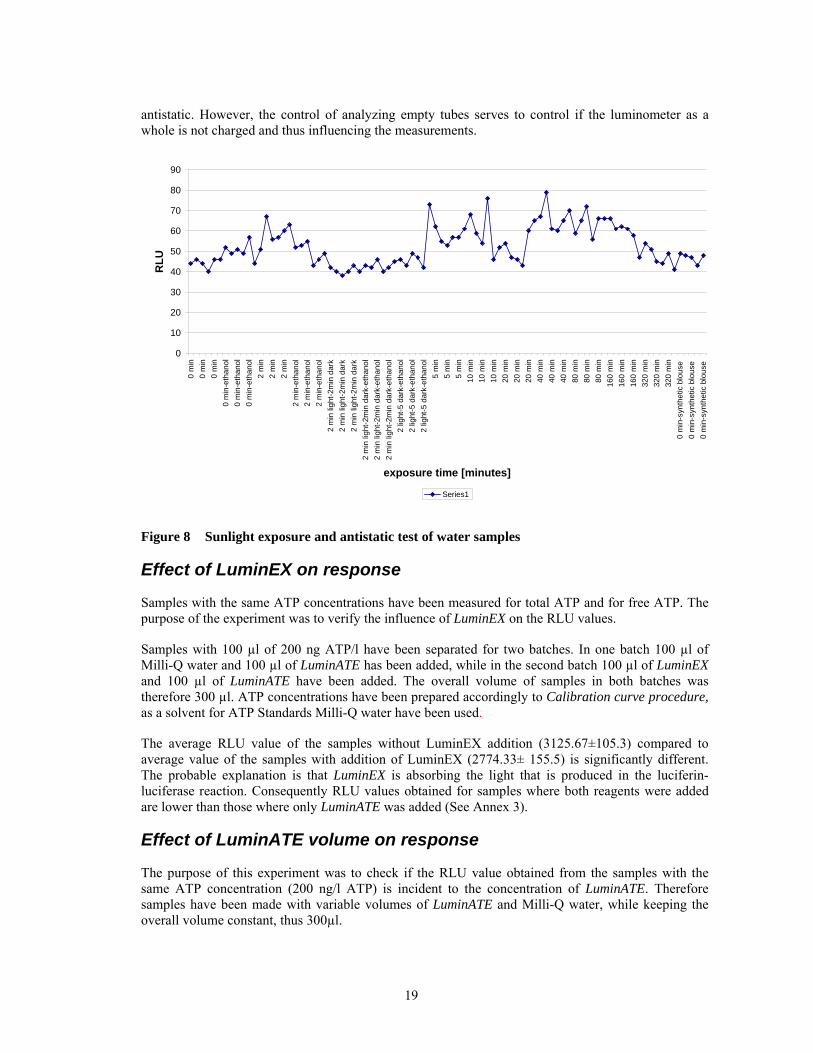
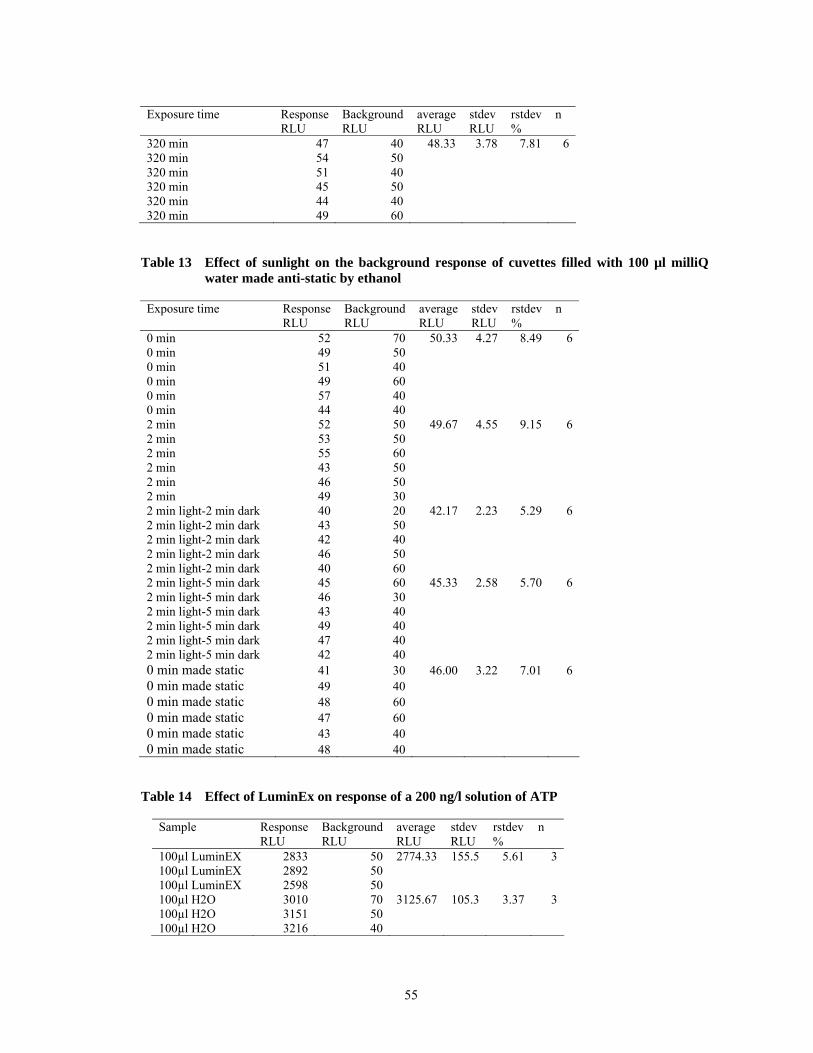
Experiment on sunlight exposure has been repeated after few days. Samples have been exposed on sunlight but additionally tubes prior to measuring were made antistatic with the ethanol. All samples had the same volume 100 µl of Milli-Q water. Samples in the last set have been rubbed with a synthetic blouse to check if polyethylene tubes containing water samples would change RLU values being initially antistatic. For better comparison results of this experiment as well as the previous one are presented together in Fig. 8 (see also Annex 3).
RLU values of 0 min-ethanol samples are significantly higher comparing to those obtained in previous experiment 0 min samples. On the contrary RLU values of sunlight exposed 2 min-ethanol samples are rather low comparing to previous results (2 min). However RLU values of 2 min light-2 min dark-ethanol samples and 2 min light-5 min dark-ethanol samples are comparable to RLU values of 2min light-2 min dark samples from the previous experiment. RLU values of these samples are similar to non-exposed samples (0 min). Tubes charged with static electricity by rubbing with the synthetic blouse and measured just after the preparation show low RLU values. This suggests that the luminometer is able to discharge the static electricity and that there is no need to make the tubes
19
antistatic. However, the control of analyzing empty tubes serves to control if the luminometer as a whole is not charged and thus influencing the measurements.
0
10
20
30
40
50
60
70
80
90
0 m
in0
min
0 m
in 0
min
-eth
anol
0 m
in-e
than
ol 0
min
-eth
anol
2 m
in 2
min
2 m
in2
min
-eth
anol
2 m
in-e
than
ol2
min
-eth
anol
2 m
in li
ght-2
min
dar
k 2
min
ligh
t-2m
in d
ark
2 m
in li
ght-2
min
dar
k 2
min
ligh
t-2m
in d
ark-
etha
nol
2 m
in li
ght-2
min
dar
k-et
hano
l 2
min
ligh
t-2m
in d
ark-
etha
nol
2 lig
ht-5
dar
k-et
hano
l2
light
-5 d
ark-
etha
nol
2 lig
ht-5
dar
k-et
hano
l5
min
5 m
in5
min
10 m
in10
min
10 m
in20
min
20 m
in20
min
40 m
in40
min
40 m
in 8
0 m
in 8
0 m
in 8
0 m
in16
0 m
in16
0 m
in16
0 m
in 3
20 m
in 3
20 m
in 3
20 m
in0
min
-syn
thet
ic b
lous
e 0
min
-syn
thet
ic b
lous
e 0
min
-syn
thet
ic b
lous
e
exposure time [minutes]
RLU
Series1
Figure 8 Sunlight exposure and antistatic test of water samples
Effect of LuminEX on response
Samples with the same ATP concentrations have been measured for total ATP and for free ATP. The purpose of the experiment was to verify the influence of LuminEX on the RLU values.
Samples with 100 µl of 200 ng ATP/l have been separated for two batches. In one batch 100 µl of Milli-Q water and 100 µl of LuminATE has been added, while in the second batch 100 µl of LuminEX and 100 µl of LuminATE have been added. The overall volume of samples in both batches was therefore 300 µl. ATP concentrations have been prepared accordingly to Calibration curve procedure, as a solvent for ATP Standards Milli-Q water have been used.
The average RLU value of the samples without LuminEX addition (3125.67±105.3) compared to average value of the samples with addition of LuminEX (2774.33± 155.5) is significantly different. The probable explanation is that LuminEX is absorbing the light that is produced in the luciferin-luciferase reaction. Consequently RLU values obtained for samples where both reagents were added are lower than those where only LuminATE was added (See Annex 3).
Effect of LuminATE volume on response
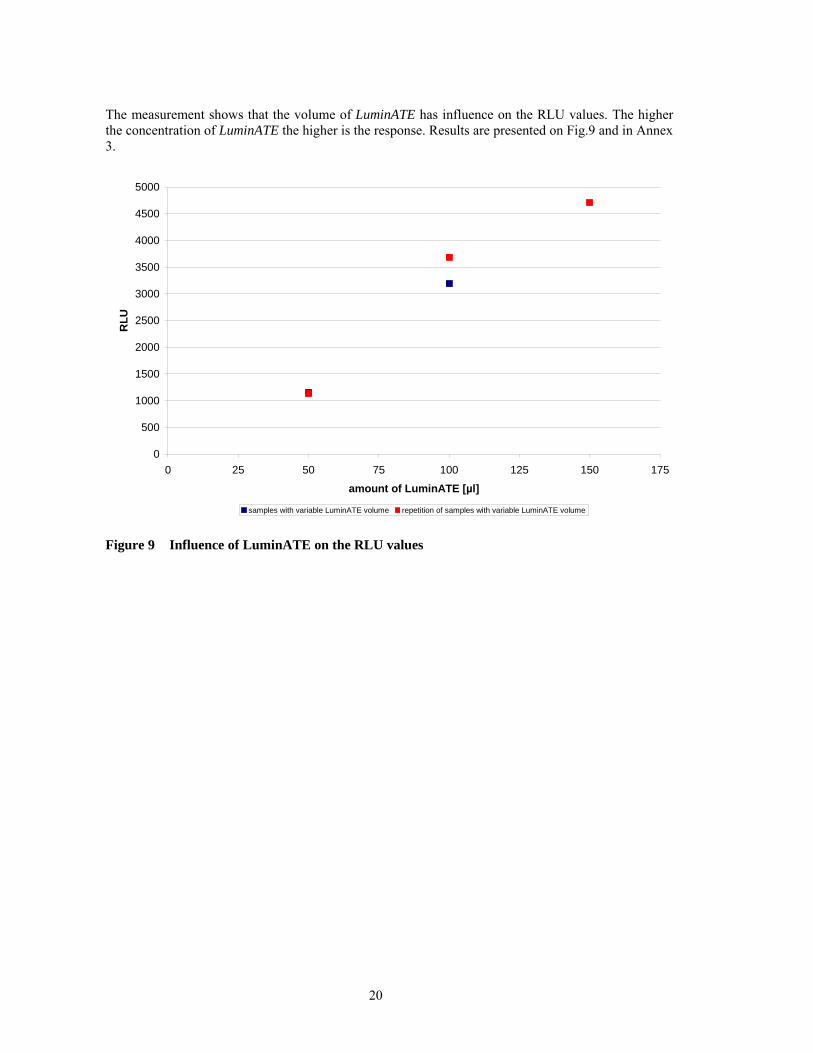
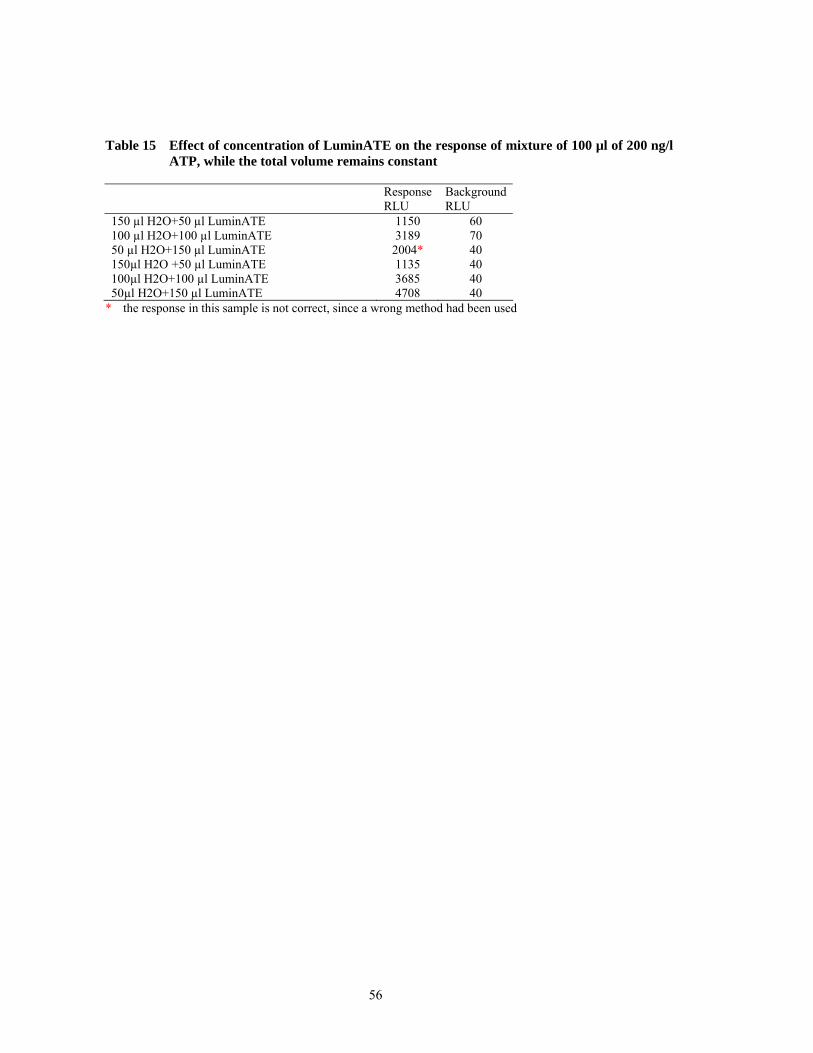
The purpose of this experiment was to check if the RLU value obtained from the samples with the same ATP concentration (200 ng/l ATP) is incident to the concentration of LuminATE. Therefore samples have been made with variable volumes of LuminATE and Milli-Q water, while keeping the overall volume constant, thus 300µl.
20
The measurement shows that the volume of LuminATE has influence on the RLU values. The higher the concentration of LuminATE the higher is the response. Results are presented on Fig.9 and in Annex 3.
0
500
1000
1500
2000
2500
3000
3500
4000
4500
5000
0 25 50 75 100 125 150 175
amount of LuminATE [µl]
RLU
samples with variable LuminATE volume repetition of samples with variable LuminATE volume
Figure 9 Influence of LuminATE on the RLU values
21
ATP STABILITY AND DEGRADATION To assess ATP stability and degradation the following experiment has been conducted. 100µl of 2mg/l ATP solutions have been diluted in water from the water production point and in Milli-Q water to see if degradation depends on the type of water. All dilutions were prepared in successive dilution using first a 1000 time step followed by 10 times dilution down to 2 ng/l. The latter was diluted to 1 ng/l.
Also blank water samples (without ATP addition) of water from the water production point and milli-Q water were included in the experiment. Due to fact that it was difficult to take the whole ATP aliquot from the vial to prepare dilutions, real ATP concentrations in samples prepared on different days could vary significantly giving diverse RLU values.
Samples have been kept for 4 days in 4oC and 24o C environment. All the samples during storage have been capped. On the measuring day 20th of September also new ATP dilutions for calibration curve have been prepared and directly afterwards analyzed (see Annex 2).
In order to have more data and trace more in detail ATP degradation, the experiment on ATP degradation has been modified and repeated. ATP dilutions have been prepared in the same way as previously but stagnation time has been changed. Dilutions of ATP Standards have been prepared and stored in 4oC and 24oC environment for 1 day, 4 days, 8 days, 9 days and 10 days. As previously, on the day of analysis also new ATP dilutions for calibration curve have been prepared (see Annex 2).
Calculation of ATP concentration in samples prepared for ATP degradation
ATP concentrations in the samples prepared for ATP degradation have been firstly calculated using X=(y-factor)/a method. However calculated in this way ATP concentrations especially in samples with low initial ATP concentrations (1 ng/l ATP and 2 ng/l ATP) gave always too elevated calculated ATP concentrations in proportion to initial ATP concentrations in those samples. That could be due to the fact that RLU values of blank tap water samples were very similar to RLU values received from samples containing 1 ng/l ATP and 2 ng/l ATP. Therefore the responses of the samples have been corrected by the RLU response of the blank before the calculation method was applied. This new method has also given negative concentrations: e.g.: all ATP samples prepared with tap water after 10 days of stagnation in 24o environment gave lower RLU values than blank tap water sample also stored for 10 days at 24o (See Annex 5).
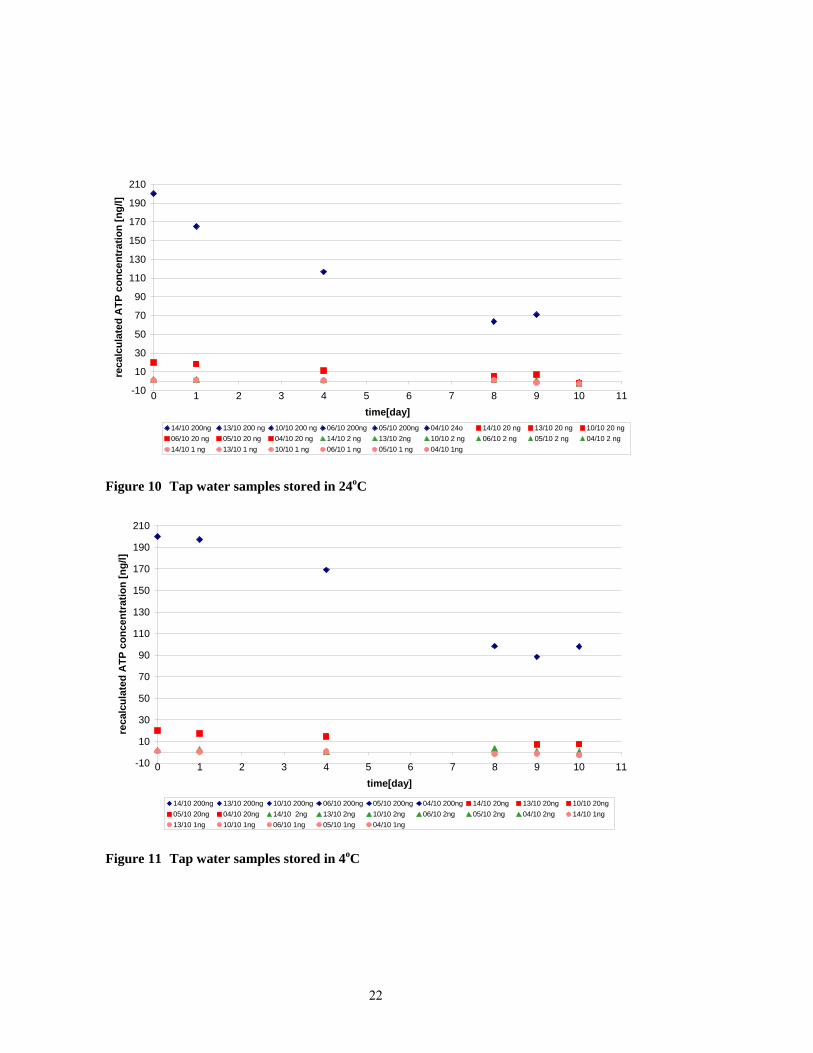
It appears that ATP stability and degradation depends on the type of water used for the dilutions. ATP is rather stable when diluted in Milli-Q water regardless the temperature and time. On the other hand ATP diluted in tap water show gradual degradation with time especially at 24o C. 4-5 days seem to be a half-life of ATP especially for 200 ng/l ATP and 20 ng/l ATP concentrations. Samples with lower concentrations: 2 ng/l ATP and 1 ng/l ATP show slower ATP degradation and their half-life can be estimated as 8-9 days. After 10 days only trace amounts of ATP remained in the samples (Fig.10).
ATP concentrations prepared with tap water and kept in 4oC environment show much slower ATP degradation comparing to samples prepared with the same water and kept in 24oC environment. Half-life for all ATP concentrations in this temperature can be assessed as 8-10 days (Fig. 11).
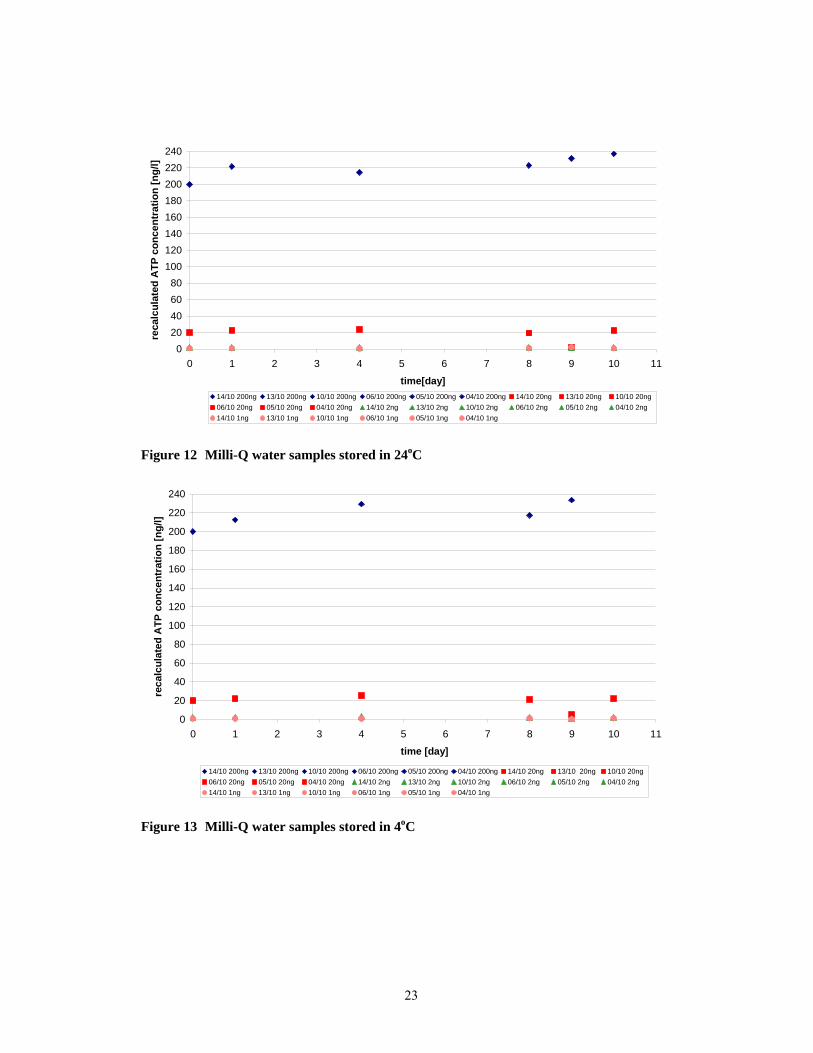
ATP concentrations prepared with milli-Q water and kept at 4 oC and 24oC seem rather stable with time (Fig.12 and Fig.13). Unexpectedly the initial concentration of 200 ng/l seems to increase with time. However it might be explained by the precision of the analysis and the way the samples have been prepared.
22
-10
10
30
50
70
90
110
130
150
170
190
210
0 1 2 3 4 5 6 7 8 9 10 11time[day]
reca
lcul
ated
ATP
con
cent
ratio
n [n
g/l]
14/10 200ng 13/10 200 ng 10/10 200 ng 06/10 200ng 05/10 200ng 04/10 24o 14/10 20 ng 13/10 20 ng 10/10 20 ng06/10 20 ng 05/10 20 ng 04/10 20 ng 14/10 2 ng 13/10 2ng 10/10 2 ng 06/10 2 ng 05/10 2 ng 04/10 2 ng14/10 1 ng 13/10 1 ng 10/10 1 ng 06/10 1 ng 05/10 1 ng 04/10 1ng
Figure 10 Tap water samples stored in 24oC
-10
10
30
50
70
90
110
130
150
170
190
210
0 1 2 3 4 5 6 7 8 9 10 11time[day]
reca
lcul
ated
ATP
con
cent
ratio
n [n
g/l]
14/10 200ng 13/10 200ng 10/10 200ng 06/10 200ng 05/10 200ng 04/10 200ng 14/10 20ng 13/10 20ng 10/10 20ng05/10 20ng 04/10 20ng 14/10 2ng 13/10 2ng 10/10 2ng 06/10 2ng 05/10 2ng 04/10 2ng 14/10 1ng13/10 1ng 10/10 1ng 06/10 1ng 05/10 1ng 04/10 1ng
Figure 11 Tap water samples stored in 4oC
23
020406080
100120140160180200220240
0 1 2 3 4 5 6 7 8 9 10 11
time[day]
reca
lcul
ated
ATP
con
cent
ratio
n [n
g/l]
14/10 200ng 13/10 200ng 10/10 200ng 06/10 200ng 05/10 200ng 04/10 200ng 14/10 20ng 13/10 20ng 10/10 20ng06/10 20ng 05/10 20ng 04/10 20ng 14/10 2ng 13/10 2ng 10/10 2ng 06/10 2ng 05/10 2ng 04/10 2ng14/10 1ng 13/10 1ng 10/10 1ng 06/10 1ng 05/10 1ng 04/10 1ng
Figure 12 Milli-Q water samples stored in 24oC
0
20
40
60
80
100
120
140
160
180
200
220
240
0 1 2 3 4 5 6 7 8 9 10 11
time [day]
reca
lcul
ated
ATP
con
cent
ratio
n [n
g/l]
14/10 200ng 13/10 200ng 10/10 200ng 06/10 200ng 05/10 200ng 04/10 200ng 14/10 20ng 13/10 20ng 10/10 20ng06/10 20ng 05/10 20ng 04/10 20ng 14/10 2ng 13/10 2ng 10/10 2ng 06/10 2ng 05/10 2ng 04/10 2ng14/10 1ng 13/10 1ng 10/10 1ng 06/10 1ng 05/10 1ng 04/10 1ng
Figure 13 Milli-Q water samples stored in 4oC

25
INFLUENCE OF STAGNATION TIME ON ATP CONCENTRATION IN TAP WATER SAMPLES
500 ml samples at consumers’ tap in Leggiuno and Laveno
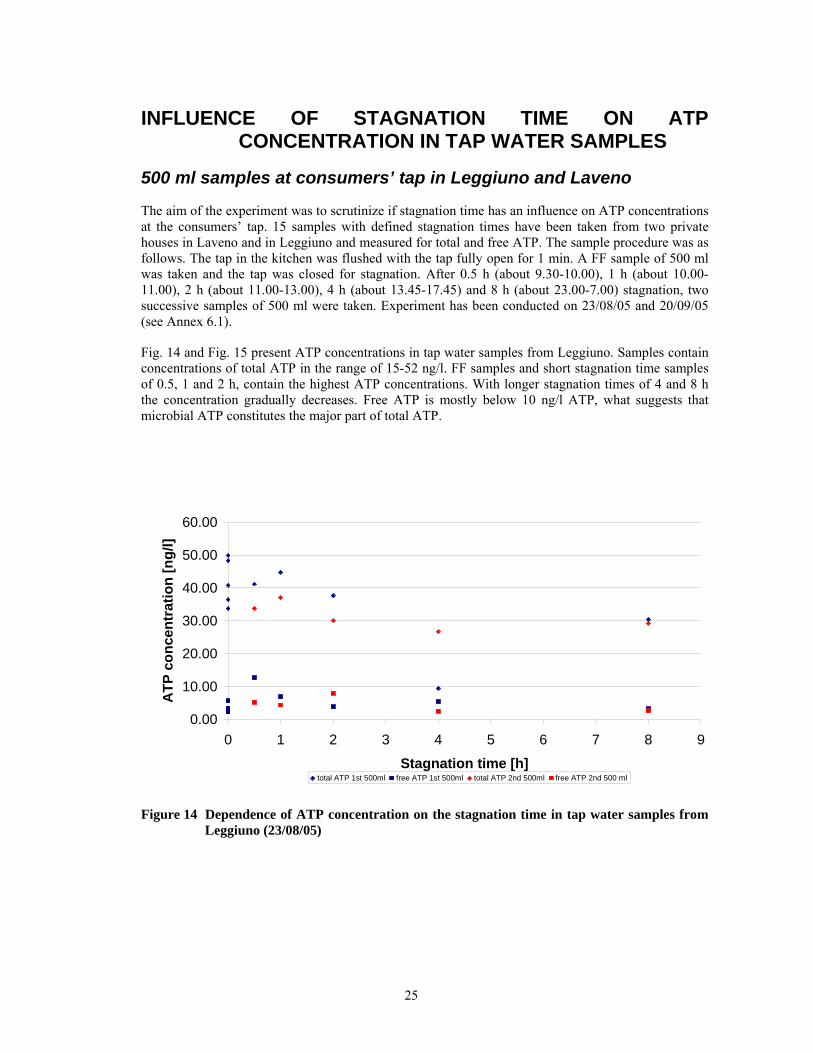
The aim of the experiment was to scrutinize if stagnation time has an influence on ATP concentrations at the consumers’ tap. 15 samples with defined stagnation times have been taken from two private houses in Laveno and in Leggiuno and measured for total and free ATP. The sample procedure was as follows. The tap in the kitchen was flushed with the tap fully open for 1 min. A FF sample of 500 ml was taken and the tap was closed for stagnation. After 0.5 h (about 9.30-10.00), 1 h (about 10.00-11.00), 2 h (about 11.00-13.00), 4 h (about 13.45-17.45) and 8 h (about 23.00-7.00) stagnation, two successive samples of 500 ml were taken. Experiment has been conducted on 23/08/05 and 20/09/05 (see Annex 6.1).
Fig. 14 and Fig. 15 present ATP concentrations in tap water samples from Leggiuno. Samples contain concentrations of total ATP in the range of 15-52 ng/l. FF samples and short stagnation time samples of 0.5, 1 and 2 h, contain the highest ATP concentrations. With longer stagnation times of 4 and 8 h the concentration gradually decreases. Free ATP is mostly below 10 ng/l ATP, what suggests that microbial ATP constitutes the major part of total ATP.
0.00
10.00
20.00
30.00
40.00
50.00
60.00
0 1 2 3 4 5 6 7 8 9
Stagnation time [h]
ATP
con
cent
ratio
n [n
g/l]
total ATP 1st 500ml free ATP 1st 500ml total ATP 2nd 500ml free ATP 2nd 500 ml
Figure 14 Dependence of ATP concentration on the stagnation time in tap water samples from Leggiuno (23/08/05)
26
0.00
10.00
20.00
30.00
40.00
50.00
60.00
0 1 2 3 4 5 6 7 8 9
stagnation time [h]
ATP
con
cent
ratio
n [n
g/l]
total ATP 1st 500ml free ATP 1st 500ml total ATP 2nd 500ml free ATP 2nd 500ml
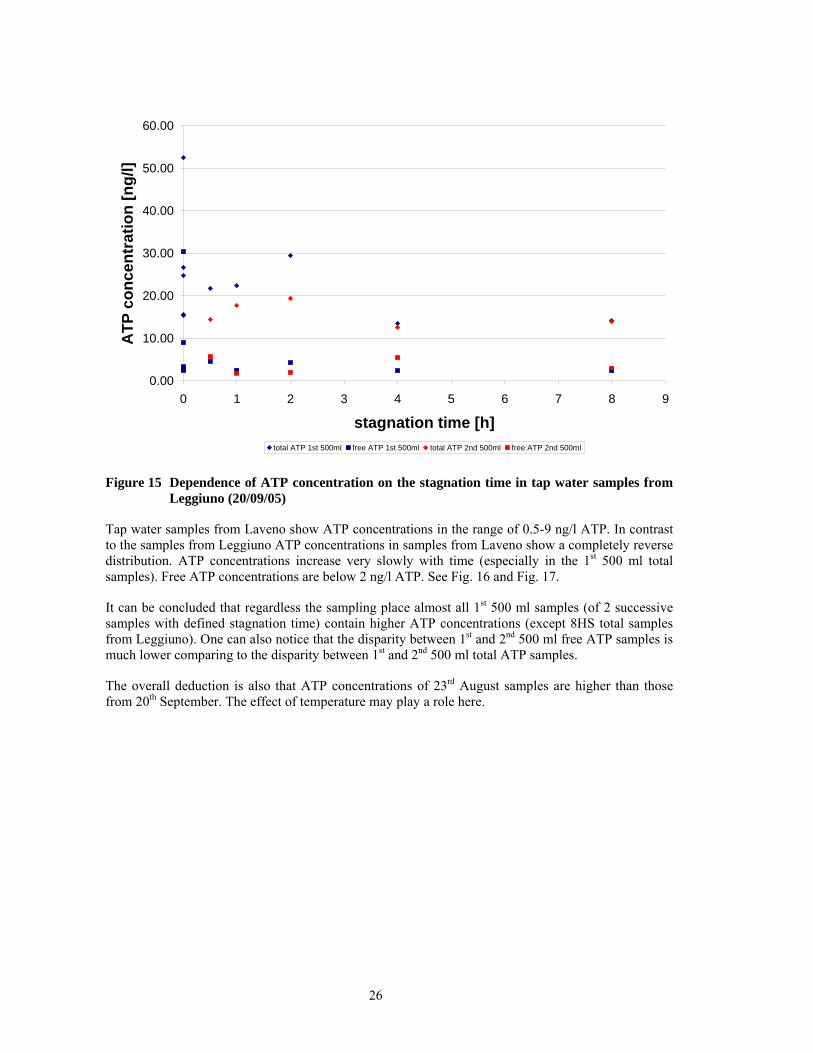
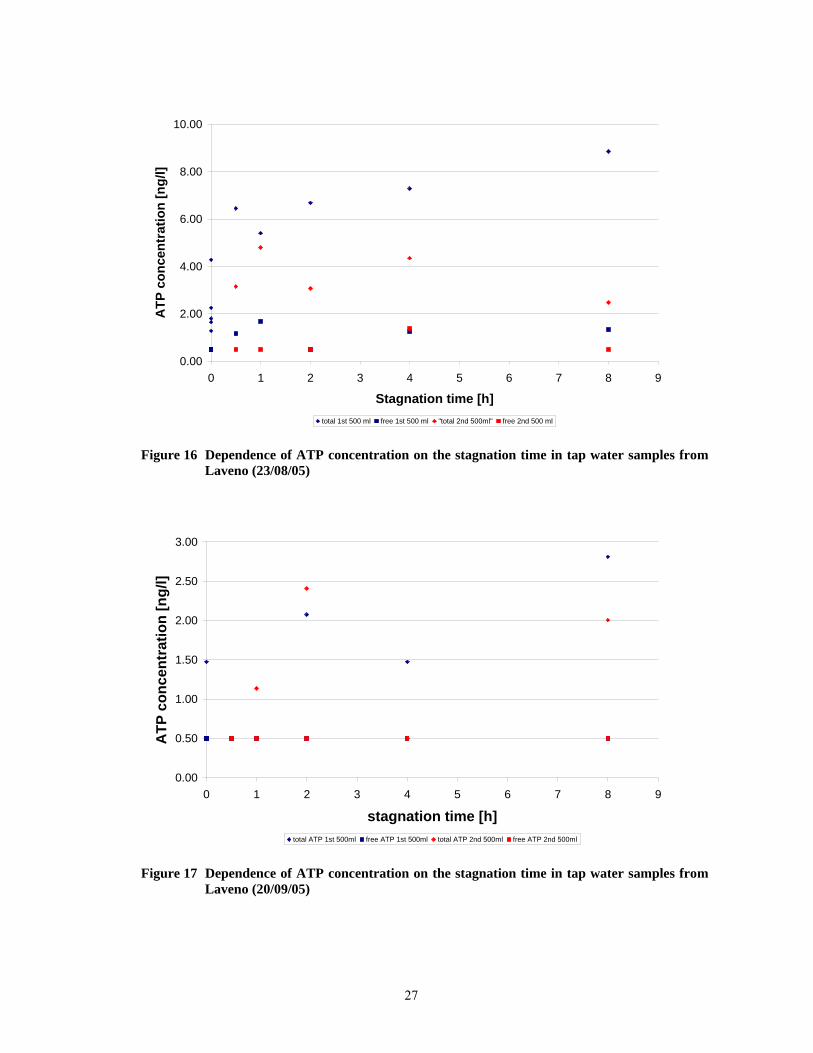
Figure 15 Dependence of ATP concentration on the stagnation time in tap water samples from Leggiuno (20/09/05)
Tap water samples from Laveno show ATP concentrations in the range of 0.5-9 ng/l ATP. In contrast to the samples from Leggiuno ATP concentrations in samples from Laveno show a completely reverse distribution. ATP concentrations increase very slowly with time (especially in the 1st 500 ml total samples). Free ATP concentrations are below 2 ng/l ATP. See Fig. 16 and Fig. 17.
It can be concluded that regardless the sampling place almost all 1st 500 ml samples (of 2 successive samples with defined stagnation time) contain higher ATP concentrations (except 8HS total samples from Leggiuno). One can also notice that the disparity between 1st and 2nd 500 ml free ATP samples is much lower comparing to the disparity between 1st and 2nd 500 ml total ATP samples.
The overall deduction is also that ATP concentrations of 23rd August samples are higher than those from 20th September. The effect of temperature may play a role here.
27
0.00
2.00
4.00
6.00
8.00
10.00
0 1 2 3 4 5 6 7 8 9
Stagnation time [h]
ATP
con
cent
ratio
n [n
g/l]
total 1st 500 ml free 1st 500 ml "total 2nd 500ml" free 2nd 500 ml
Figure 16 Dependence of ATP concentration on the stagnation time in tap water samples from Laveno (23/08/05)
0.00
0.50
1.00
1.50
2.00
2.50
3.00
0 1 2 3 4 5 6 7 8 9
stagnation time [h]
ATP
con
cent
ratio
n [n
g/l]
total ATP 1st 500ml free ATP 1st 500ml total ATP 2nd 500ml free ATP 2nd 500ml
Figure 17 Dependence of ATP concentration on the stagnation time in tap water samples from Laveno (20/09/05)
28
ATP concentrations in 20 successive 50 ml tap water samples from Leggiuno and Laveno
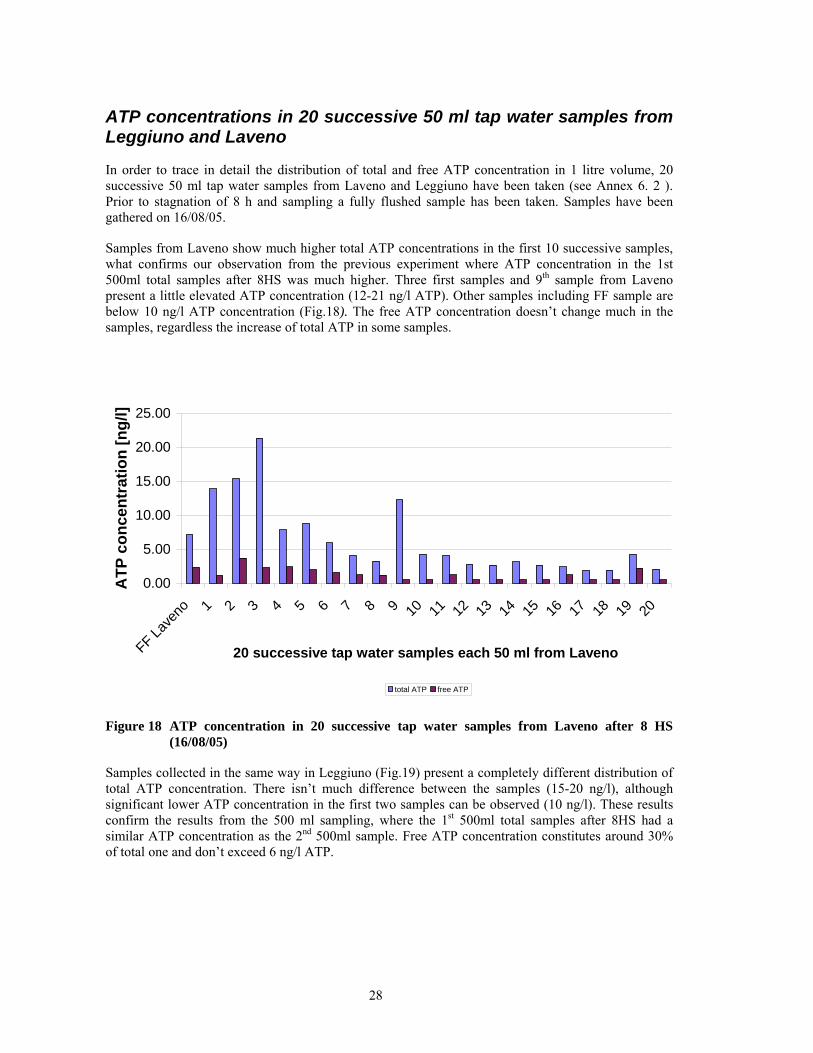
In order to trace in detail the distribution of total and free ATP concentration in 1 litre volume, 20 successive 50 ml tap water samples from Laveno and Leggiuno have been taken (see Annex 6. 2 ). Prior to stagnation of 8 h and sampling a fully flushed sample has been taken. Samples have been gathered on 16/08/05.
Samples from Laveno show much higher total ATP concentrations in the first 10 successive samples, what confirms our observation from the previous experiment where ATP concentration in the 1st 500ml total samples after 8HS was much higher. Three first samples and 9th sample from Laveno present a little elevated ATP concentration (12-21 ng/l ATP). Other samples including FF sample are below 10 ng/l ATP concentration (Fig.18). The free ATP concentration doesn’t change much in the samples, regardless the increase of total ATP in some samples.
0.00
5.00
10.00
15.00
20.00
25.00
FF Lave
no 1 2 3 4 5 6 7 8 9 10 11 12 13 14 15 16 17 18 19 20
20 successive tap water samples each 50 ml from Laveno
ATP
con
cent
ratio
n [n
g/l]
total ATP free ATP
Figure 18 ATP concentration in 20 successive tap water samples from Laveno after 8 HS (16/08/05)
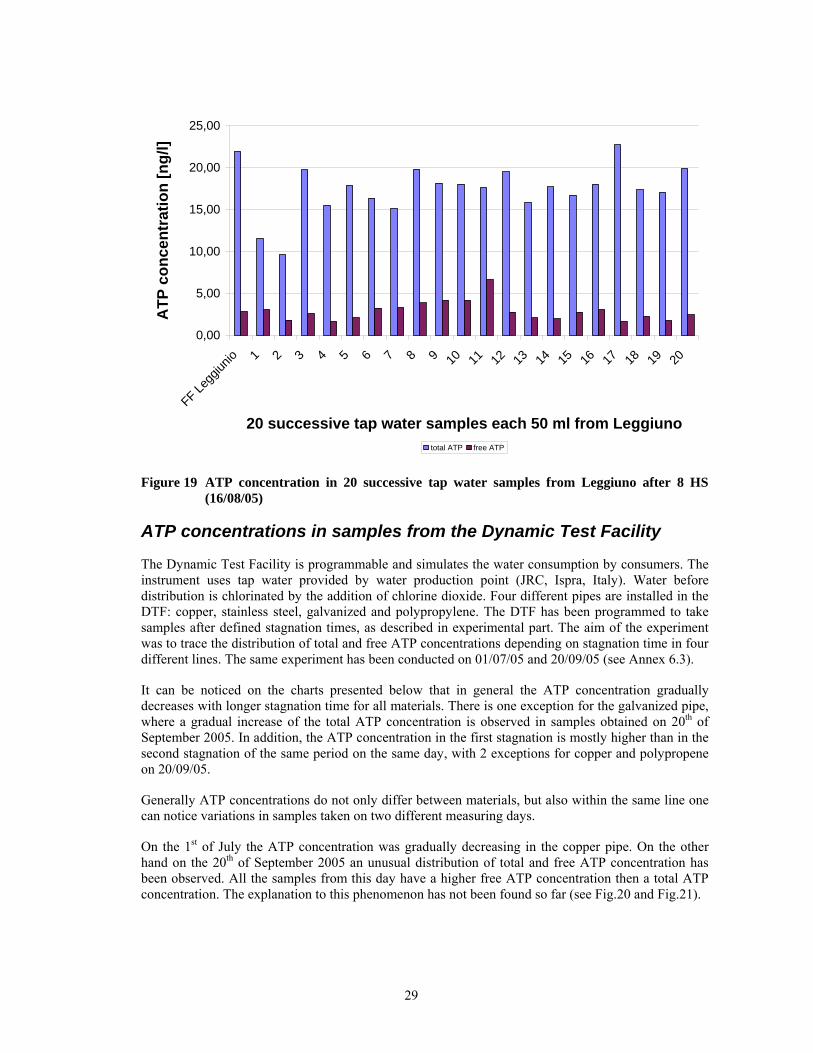
Samples collected in the same way in Leggiuno (Fig.19) present a completely different distribution of total ATP concentration. There isn’t much difference between the samples (15-20 ng/l), although significant lower ATP concentration in the first two samples can be observed (10 ng/l). These results confirm the results from the 500 ml sampling, where the 1st 500ml total samples after 8HS had a similar ATP concentration as the 2nd 500ml sample. Free ATP concentration constitutes around 30% of total one and don’t exceed 6 ng/l ATP.
29
0,00
5,00
10,00
15,00
20,00
25,00
FF Legg
iunio 1 2 3 4 5 6 7 8 9 10 11 12 13 14 15 16 17 18 19 20
20 successive tap water samples each 50 ml from Leggiuno
ATP
con
cent
ratio
n [n
g/l]
total ATP free ATP
Figure 19 ATP concentration in 20 successive tap water samples from Leggiuno after 8 HS (16/08/05)
ATP concentrations in samples from the Dynamic Test Facility
The Dynamic Test Facility is programmable and simulates the water consumption by consumers. The instrument uses tap water provided by water production point (JRC, Ispra, Italy). Water before distribution is chlorinated by the addition of chlorine dioxide. Four different pipes are installed in the DTF: copper, stainless steel, galvanized and polypropylene. The DTF has been programmed to take samples after defined stagnation times, as described in experimental part. The aim of the experiment was to trace the distribution of total and free ATP concentrations depending on stagnation time in four different lines. The same experiment has been conducted on 01/07/05 and 20/09/05 (see Annex 6.3).
It can be noticed on the charts presented below that in general the ATP concentration gradually decreases with longer stagnation time for all materials. There is one exception for the galvanized pipe, where a gradual increase of the total ATP concentration is observed in samples obtained on 20th of September 2005. In addition, the ATP concentration in the first stagnation is mostly higher than in the second stagnation of the same period on the same day, with 2 exceptions for copper and polypropene on 20/09/05.
Generally ATP concentrations do not only differ between materials, but also within the same line one can notice variations in samples taken on two different measuring days.
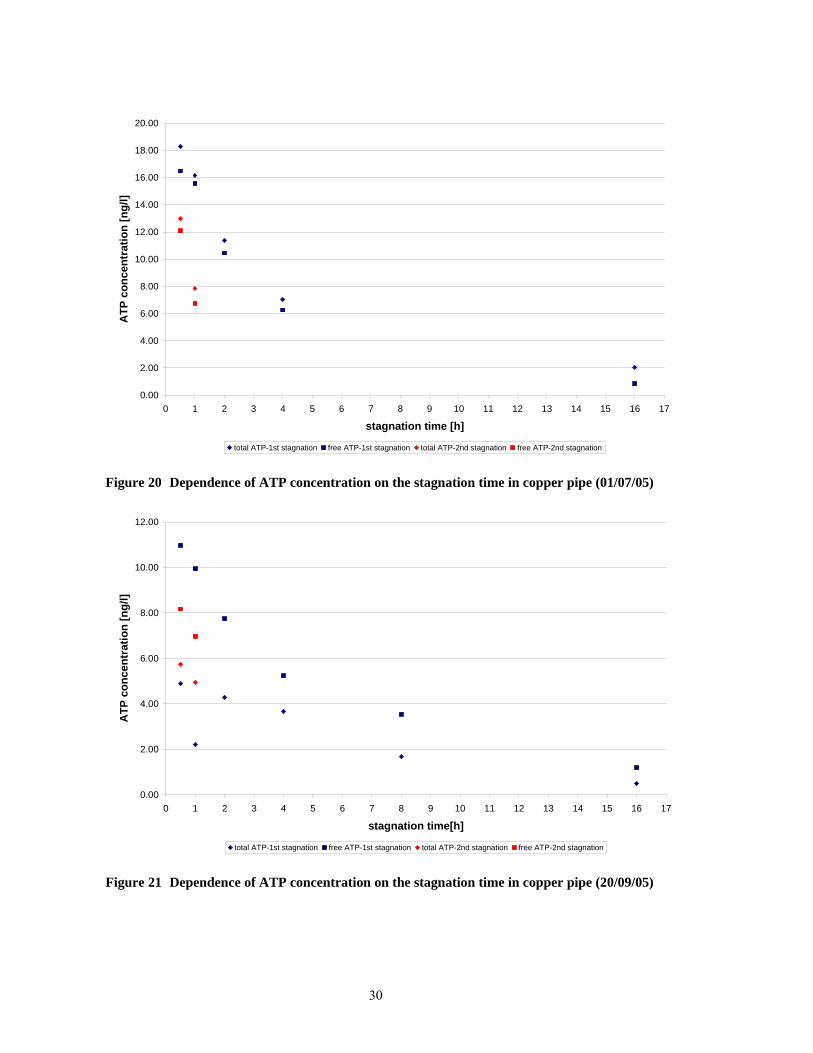
On the 1st of July the ATP concentration was gradually decreasing in the copper pipe. On the other hand on the 20th of September 2005 an unusual distribution of total and free ATP concentration has been observed. All the samples from this day have a higher free ATP concentration then a total ATP concentration. The explanation to this phenomenon has not been found so far (see Fig.20 and Fig.21).
30
0.00
2.00
4.00
6.00
8.00
10.00
12.00
14.00
16.00
18.00
20.00
0 1 2 3 4 5 6 7 8 9 10 11 12 13 14 15 16 17
stagnation time [h]
ATP
con
cent
ratio
n [n
g/l]
total ATP-1st stagnation free ATP-1st stagnation total ATP-2nd stagnation free ATP-2nd stagnation
Figure 20 Dependence of ATP concentration on the stagnation time in copper pipe (01/07/05)
0.00
2.00
4.00
6.00
8.00
10.00
12.00
0 1 2 3 4 5 6 7 8 9 10 11 12 13 14 15 16 17
stagnation time[h]
ATP
con
cent
ratio
n [n
g/l]
total ATP-1st stagnation free ATP-1st stagnation total ATP-2nd stagnation free ATP-2nd stagnation
Figure 21 Dependence of ATP concentration on the stagnation time in copper pipe (20/09/05)
31
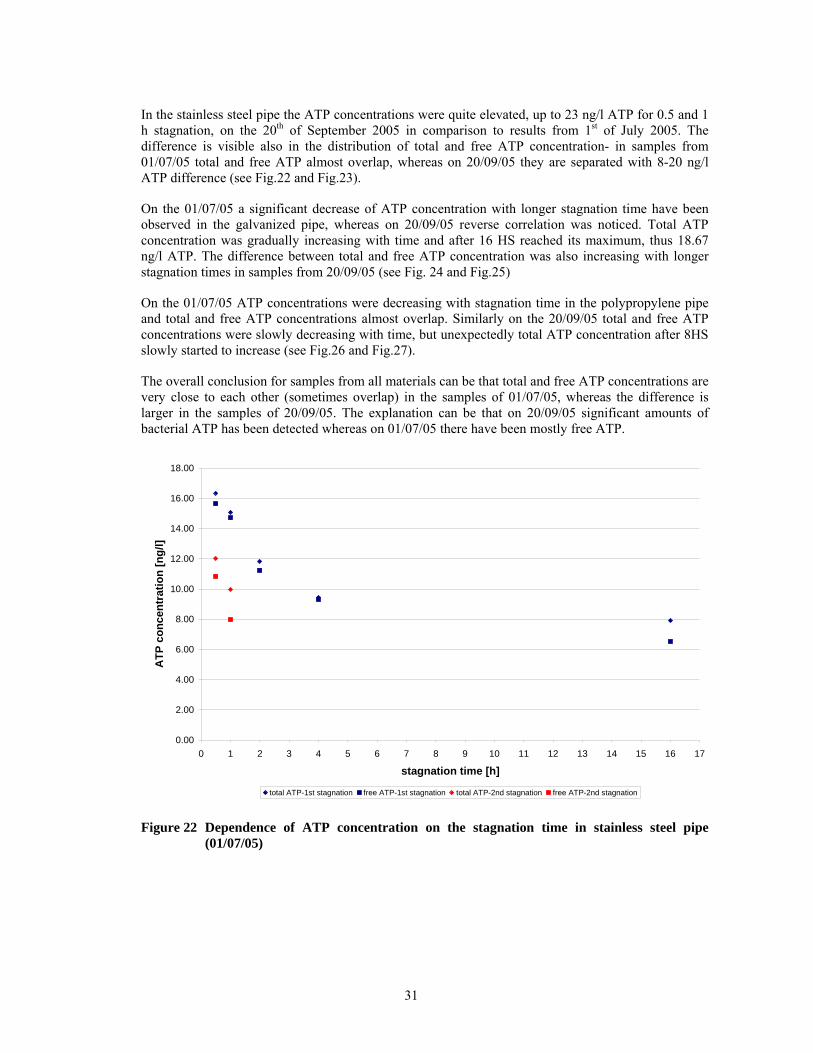
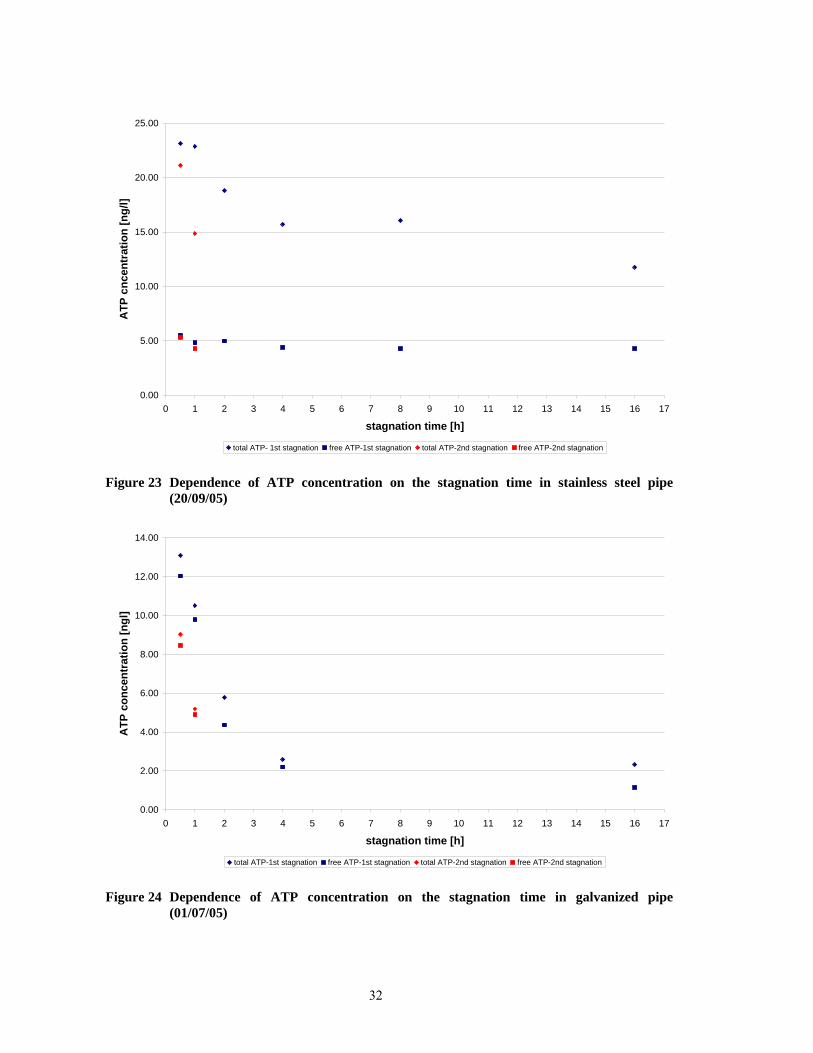
In the stainless steel pipe the ATP concentrations were quite elevated, up to 23 ng/l ATP for 0.5 and 1 h stagnation, on the 20th of September 2005 in comparison to results from 1st of July 2005. The difference is visible also in the distribution of total and free ATP concentration- in samples from 01/07/05 total and free ATP almost overlap, whereas on 20/09/05 they are separated with 8-20 ng/l ATP difference (see Fig.22 and Fig.23).
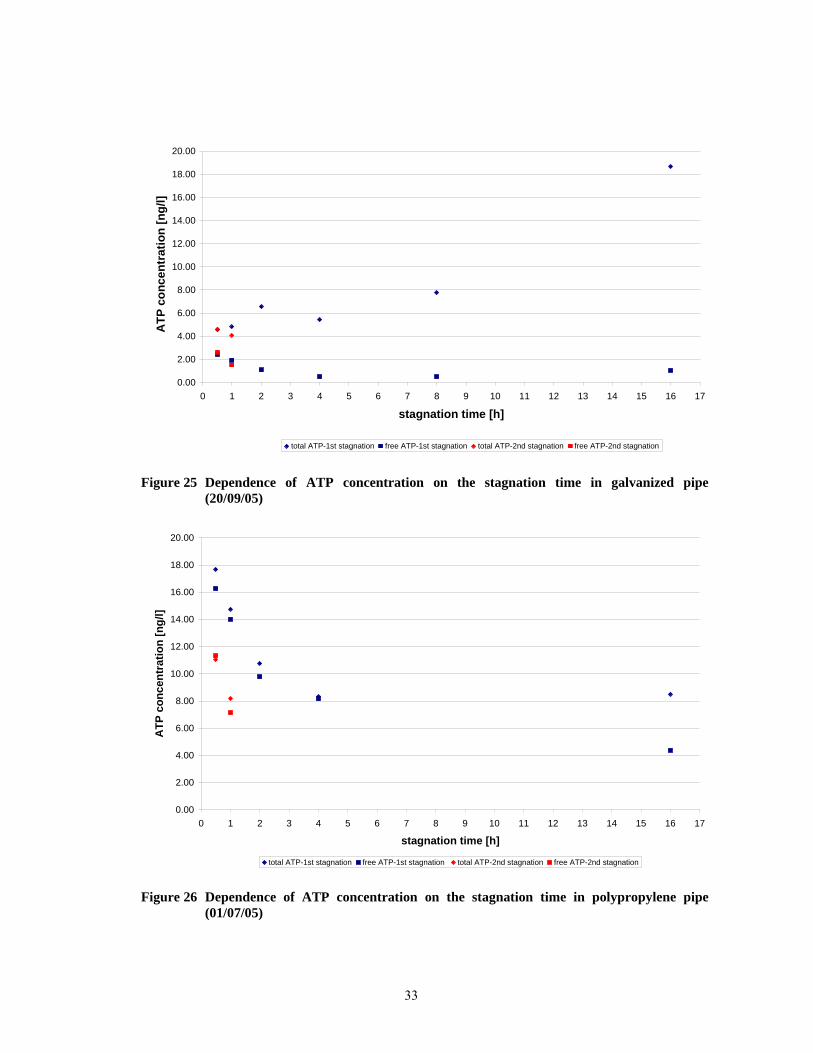
On the 01/07/05 a significant decrease of ATP concentration with longer stagnation time have been observed in the galvanized pipe, whereas on 20/09/05 reverse correlation was noticed. Total ATP concentration was gradually increasing with time and after 16 HS reached its maximum, thus 18.67 ng/l ATP. The difference between total and free ATP concentration was also increasing with longer stagnation times in samples from 20/09/05 (see Fig. 24 and Fig.25)
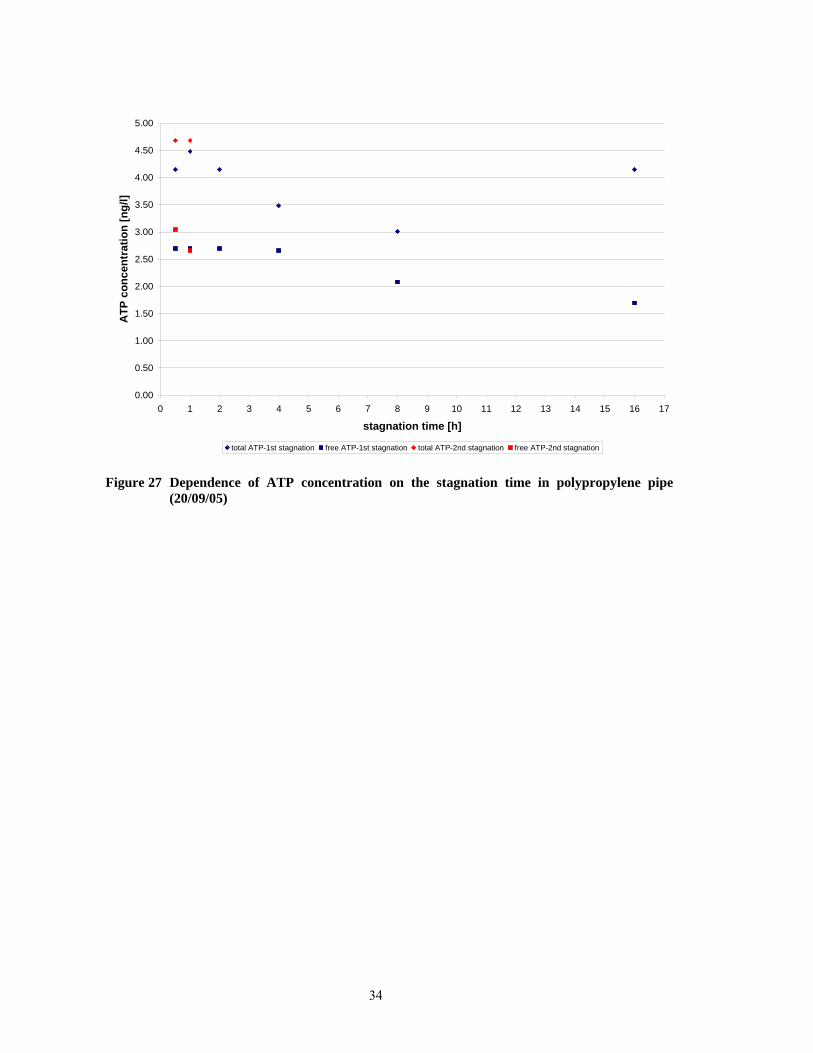
On the 01/07/05 ATP concentrations were decreasing with stagnation time in the polypropylene pipe and total and free ATP concentrations almost overlap. Similarly on the 20/09/05 total and free ATP concentrations were slowly decreasing with time, but unexpectedly total ATP concentration after 8HS slowly started to increase (see Fig.26 and Fig.27).
The overall conclusion for samples from all materials can be that total and free ATP concentrations are very close to each other (sometimes overlap) in the samples of 01/07/05, whereas the difference is larger in the samples of 20/09/05. The explanation can be that on 20/09/05 significant amounts of bacterial ATP has been detected whereas on 01/07/05 there have been mostly free ATP.
0.00
2.00
4.00
6.00
8.00
10.00
12.00
14.00
16.00
18.00
0 1 2 3 4 5 6 7 8 9 10 11 12 13 14 15 16 17
stagnation time [h]
ATP
con
cent
ratio
n [n
g/l]
total ATP-1st stagnation free ATP-1st stagnation total ATP-2nd stagnation free ATP-2nd stagnation
Figure 22 Dependence of ATP concentration on the stagnation time in stainless steel pipe (01/07/05)
32
0.00
5.00
10.00
15.00
20.00
25.00
0 1 2 3 4 5 6 7 8 9 10 11 12 13 14 15 16 17
stagnation time [h]
ATP
cnc
entr
atio
n [n
g/l]
total ATP- 1st stagnation free ATP-1st stagnation total ATP-2nd stagnation free ATP-2nd stagnation
Figure 23 Dependence of ATP concentration on the stagnation time in stainless steel pipe (20/09/05)
0.00
2.00
4.00
6.00
8.00
10.00
12.00
14.00
0 1 2 3 4 5 6 7 8 9 10 11 12 13 14 15 16 17
stagnation time [h]
ATP
con
cent
ratio
n [n
gl]
total ATP-1st stagnation free ATP-1st stagnation total ATP-2nd stagnation free ATP-2nd stagnation
Figure 24 Dependence of ATP concentration on the stagnation time in galvanized pipe (01/07/05)
33
0.00
2.00
4.00
6.00
8.00
10.00
12.00
14.00
16.00
18.00
20.00
0 1 2 3 4 5 6 7 8 9 10 11 12 13 14 15 16 17
stagnation time [h]
ATP
con
cent
ratio
n [n
g/l]
total ATP-1st stagnation free ATP-1st stagnation total ATP-2nd stagnation free ATP-2nd stagnation
Figure 25 Dependence of ATP concentration on the stagnation time in galvanized pipe (20/09/05)
0.00
2.00
4.00
6.00
8.00
10.00
12.00
14.00
16.00
18.00
20.00
0 1 2 3 4 5 6 7 8 9 10 11 12 13 14 15 16 17
stagnation time [h]
ATP
con
cent
ratio
n [n
g/l]
total ATP-1st stagnation free ATP-1st stagnation total ATP-2nd stagnation free ATP-2nd stagnation
Figure 26 Dependence of ATP concentration on the stagnation time in polypropylene pipe (01/07/05)
34
0.00
0.50
1.00
1.50
2.00
2.50
3.00
3.50
4.00
4.50
5.00
0 1 2 3 4 5 6 7 8 9 10 11 12 13 14 15 16 17
stagnation time [h]
ATP
con
cent
ratio
n [n
g/l]
total ATP-1st stagnation free ATP-1st stagnation total ATP-2nd stagnation free ATP-2nd stagnation
Figure 27 Dependence of ATP concentration on the stagnation time in polypropylene pipe (20/09/05)
35
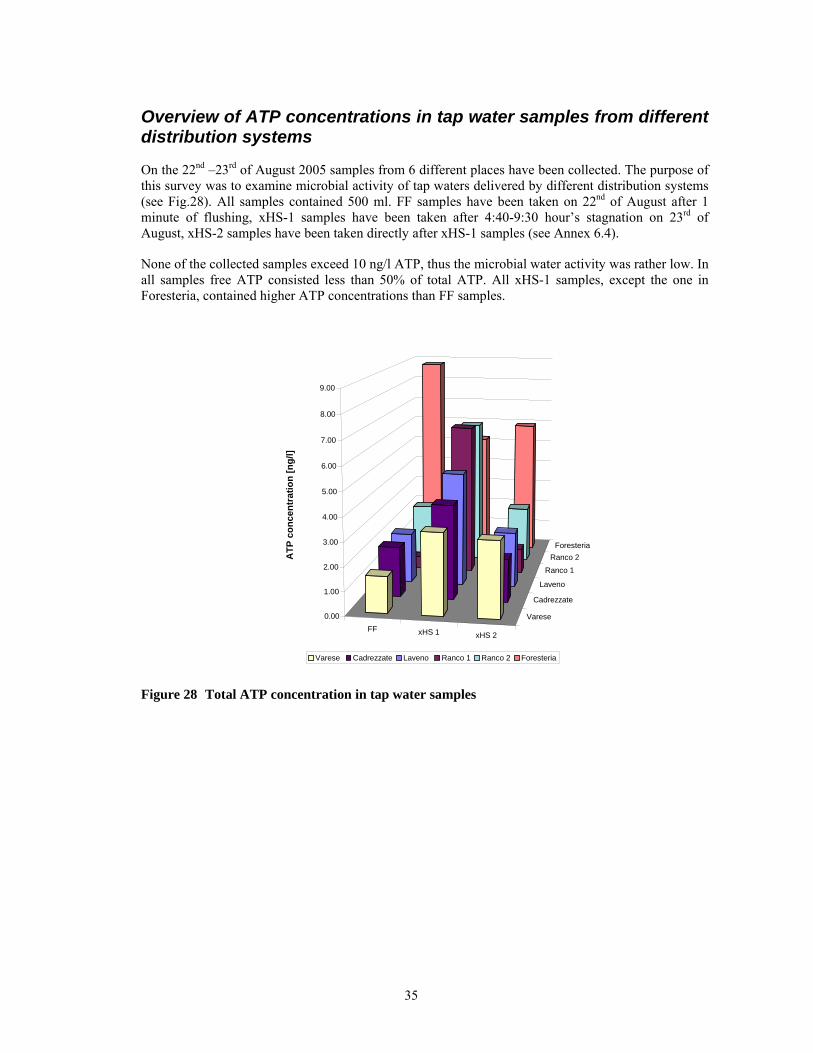
Overview of ATP concentrations in tap water samples from different distribution systems
On the 22nd –23rd of August 2005 samples from 6 different places have been collected. The purpose of this survey was to examine microbial activity of tap waters delivered by different distribution systems (see Fig.28). All samples contained 500 ml. FF samples have been taken on 22nd of August after 1 minute of flushing, xHS-1 samples have been taken after 4:40-9:30 hour’s stagnation on 23rd of August, xHS-2 samples have been taken directly after xHS-1 samples (see Annex 6.4).
None of the collected samples exceed 10 ng/l ATP, thus the microbial water activity was rather low. In all samples free ATP consisted less than 50% of total ATP. All xHS-1 samples, except the one in Foresteria, contained higher ATP concentrations than FF samples.
FF xHS 1 xHS 2
Varese
Cadrezzate
Laveno
Ranco 1
Ranco 2Foresteria
0.00
1.00
2.00
3.00
4.00
5.00
6.00
7.00
8.00
9.00
ATP
con
cent
ratio
n [n
g/l]
Varese Cadrezzate Laveno Ranco 1 Ranco 2 Foresteria
Figure 28 Total ATP concentration in tap water samples

37
HETEROTROPHIC PLATE COUNTS OF TAP WATER SAMPLES
On the 24th of May 2005 samples have been collected on JRC premises (see list of samples below) and analyzed for total colony count. The sampling procedure started by taking 2 successive 500 ml samples (RDT – random day time), followed by 1 minute of flushing and taking a fully flushed sample (FF). From each numerated sample 1 ml has been put on a petri plate. PCA or R2A medium, kept in a water bath at 45°C, was added and carefully mixed. The dishes were incubated either at 22°C or 37°C. (see Annex 7). A control plate has been prepared for each medium and temperature. The samples on PCA and R2A [19] mediums incubated at 37oC were counted after 44 hours. Petri plates with mediums and samples have been put to incubator on 24/05/05 at 19:00 and counted on 26/05/05 at 15:00. The samples on PCA and R2A mediums incubated in 22oC were counted after 68 hours. Mediums with samples have been inserted to incubator on 24/05/05 at 19:00 and counted on 27/05/05 at 15:00.
List of samples collected on the JRC premises:
ED 30, room 004 - Milli-Q water (001) ED 8, room 006 (old mensa):
a. RDT 1 (002) b. RDT 2 (003) c. FF (004)
ED 8A, room 003 (new mensa): a. RDT 1 (005) b. RDT 2 (006) c. FF (007)
ED 15, room 004 (the water production point)- FF (008) ED 30 A, room E15 (the men’s toilet):
a. RDT 1 (009) b. RDT 2 (010) c. FF (011)
ED 30, room 012 (the valve used for Dynamic Test Facility): a. RDT 1 (012) b. RDT 2 (013) c. FF (014)
Experiment with total colony counts has been repeated on 31st of May 2005. Newly collected samples (see list of samples below) as previously have been analyzed as above (see Annex 7). The samples on PCA and R2A mediums incubated in 37oC have been inserted to incubator on 01/06/05 at 13:30 and counted on 03/06/05 at 15:00. The samples on PCA and R2A mediums incubated in 22oC have been inserted to incubator on 01/06/05 at 13:30 and counted on 06/06/05 at 10:00.
List of samples collected in Laveno, Leggiunio and on the JRC premises:
private house in Laveno, kitchen: a. RDT 1 (001) b. RDT 2 (002) c. FF (003)
private house in Leggiuno, kitchen: a. RDT 1 (004) b. RDT 2 (005) c. FF (006)
38
ED 8A, room 003 (new mensa):
a. RDT 1 (007) b. RDT 2 (008) c. FF (009)
ED 8, room 006 (old mensa): a. RDT1 (010) b. RDT2 (011) c. FF (012)
ED 15, room 004 (the water production point)- FF (013)
Comparison between HPC and ATP assay
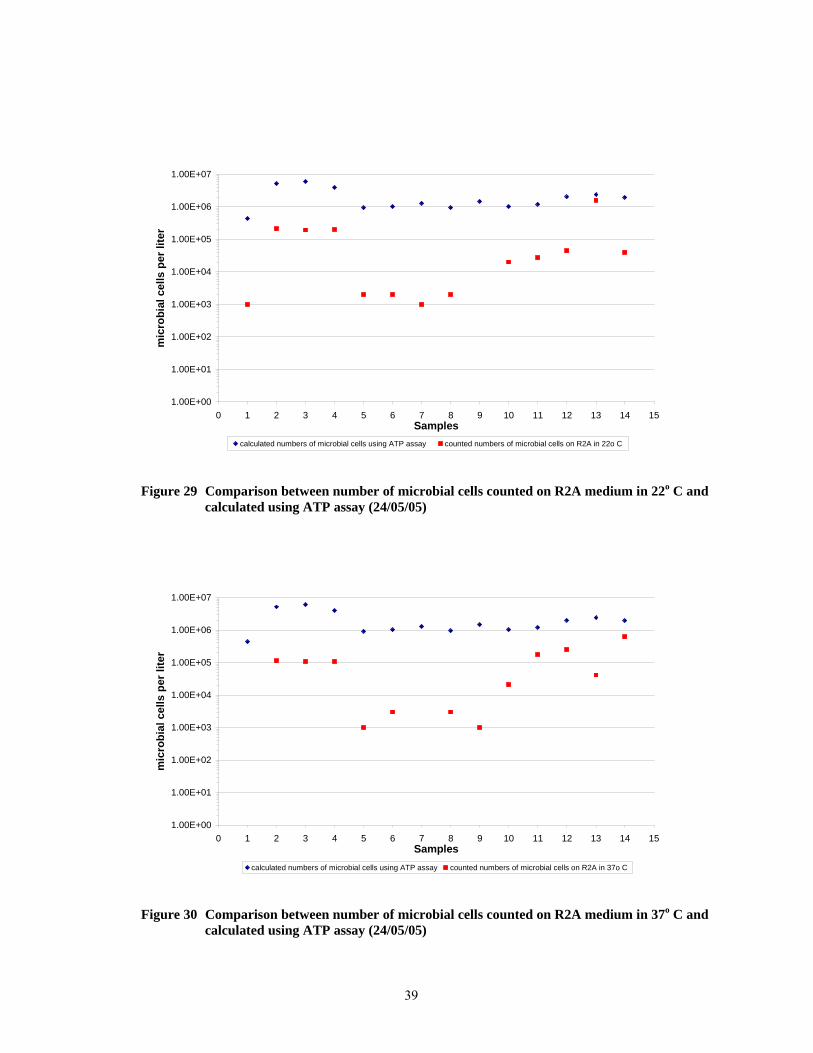
An attempt has been made to compare the numbers of microbial cells counted on the mediums and those calculated from the concentration of ATP. All samples cultivated on mediums have been also analyzed for total and free ATP concentrations. ATP concentrations in the samples have been calculated using method for ATP calculation in the samples. ATP values were calculated in ng/l ATP.
In order to estimate the amount of bacteria from the ATP concentration, the concentration of ATP in the cell was assumed to be 1 fg ATP/cell [9,21] .
Calculated numbers of cells should represent only living bacteria and therefore free ATP concentrations have been subtracted from the total ATP concentrations to receive the microbial ATP concentrations in the samples. Since on the PCA medium microbial growth was rather limited, the comparison has been made for R2A medium at both temperatures.
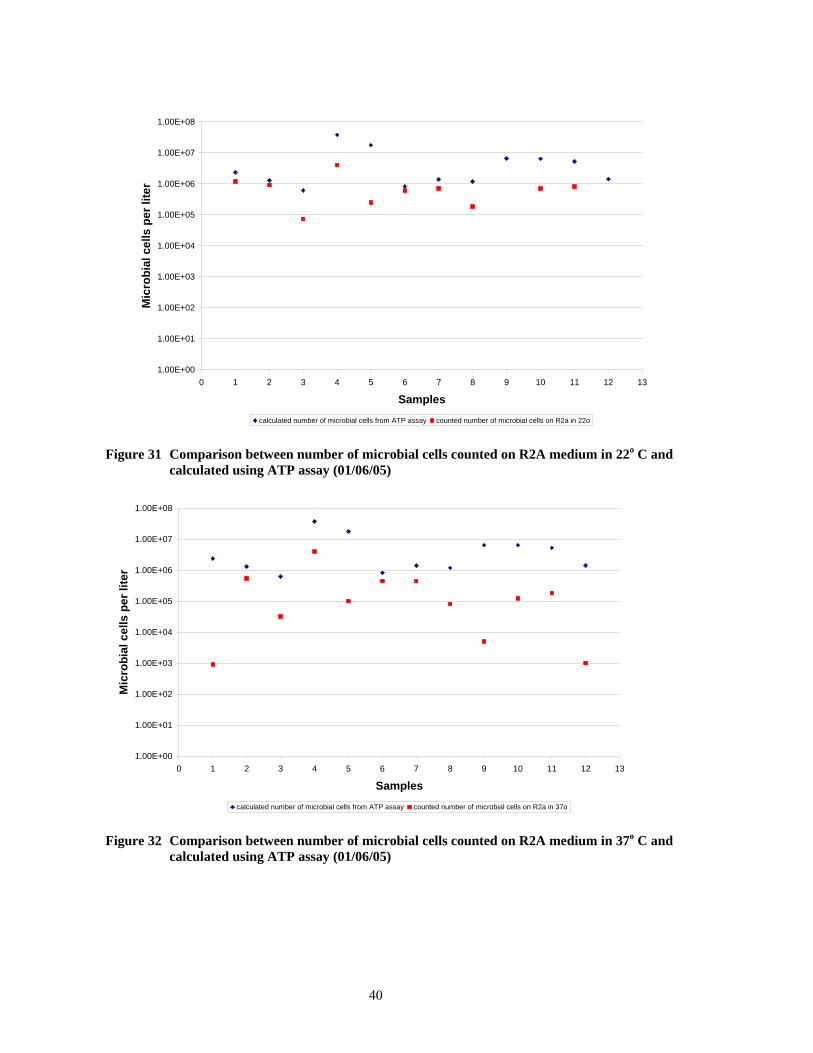
Results of the comparison between microbial numbers cultivated on R2A mediums and calculated using the ATP assay show that the cell concentration calculated from the ATP concentrations are higher that the real measured colonies (Fig.29, Fig.30, Fig.31, Fig.32). Differences can be due to the presence of non-culturable bacteria. There is also a unknown uncertainty in the assumption of 1 fg ATP per cell.
Detection limit for number of microbial cells counted on mediums has been assessed as 103 cells/litre. On R2A medium only one colony have been observed in 1ml in 22oC, but since the number of colonies had to be recalculated and presented in litres the value has been multiplied. Therefore the detection limit went up to 103 cells/litre
39
1.00E+00
1.00E+01
1.00E+02
1.00E+03
1.00E+04
1.00E+05
1.00E+06
1.00E+07
0 1 2 3 4 5 6 7 8 9 10 11 12 13 14 15Samples
mic
robi
al c
ells
per
lite
r
calculated numbers of microbial cells using ATP assay counted numbers of microbial cells on R2A in 22o C
Figure 29 Comparison between number of microbial cells counted on R2A medium in 22o C and calculated using ATP assay (24/05/05)
1.00E+00
1.00E+01
1.00E+02
1.00E+03
1.00E+04
1.00E+05
1.00E+06
1.00E+07
0 1 2 3 4 5 6 7 8 9 10 11 12 13 14 15Samples
mic
robi
al c
ells
per
lite
r
calculated numbers of microbial cells using ATP assay counted numbers of microbial cells on R2A in 37o C
Figure 30 Comparison between number of microbial cells counted on R2A medium in 37o C and calculated using ATP assay (24/05/05)
40
1.00E+00
1.00E+01
1.00E+02
1.00E+03
1.00E+04
1.00E+05
1.00E+06
1.00E+07
1.00E+08
0 1 2 3 4 5 6 7 8 9 10 11 12 13
Samples
Mic
robi
al c
ells
per
lite
r
calculated number of microbial cells from ATP assay counted number of microbial cells on R2a in 22o
Figure 31 Comparison between number of microbial cells counted on R2A medium in 22o C and calculated using ATP assay (01/06/05)
1.00E+00
1.00E+01
1.00E+02
1.00E+03
1.00E+04
1.00E+05
1.00E+06
1.00E+07
1.00E+08
0 1 2 3 4 5 6 7 8 9 10 11 12 13
Samples
Mic
robi
al c
ells
per
lite
r
calculated number of microbial cells from ATP assay counted number of microbial cells on R2a in 37o
Figure 32 Comparison between number of microbial cells counted on R2A medium in 37o C and calculated using ATP assay (01/06/05)
41
CONCLUSIONS 1) The detection limit of ATP is determined as 1 ng/l.
2) Polyethylene cuvettes used in all experiments gave a background level of about 40 RLU. The instrument discharged the cuvettes properly even if they were made static. The volume of water sample doesn’t have an influence on the background level. Sunlight exposure has an ambiguous influence on RLU values. The background level may vary significantly from batch to batch and it seems better to keep samples in the dark prior to measurement.
3) RLU values of the samples with the same ATP concentrations and the same overall volume are dependent on the concentration of the reagents: a) Samples treated with only light generating reagent LuminATE give higher response
comparing to samples treated additionally with LuminEX (quenching effect) b) The higher the volume of LuminATE used during the measurement the higher will be the
RLU value
4) ATP concentrations prepared with tap water show gradual degradation when stored at 24oC. The half-life is 4-5 days and 8-9 days for 20-200 ng/l ATP and 1-20 ng/l ATP concentration, respectively. Half-life for all ATP concentrations prepared with tap water and keep at 4oC is in the range of 8-10 days. ATP concentrations prepared with milli-Q water and kept at 4oC and 24oC are rather stable with time.
5) Tap water samples collected in Leggiuno gradually decrease with longer stagnation times, fully flushed samples and short stagnation time samples contain the highest ATP concentrations. Tap water samples from Laveno show completely reverse distribution, ATP concentrations increase very slowly with stagnation time.
6) Almost all first 500 ml samples (of totally 1 litre of 2 successive RDT samples with defined stagnation time) contain higher ATP concentrations. Leggiuno samples had very similar ATP concentrations.
7) 20 successive 50 ml samples collected in Laveno and Leggiuno confirmed the results of the 500 ml samples. In addition the 50 ml samples show an ATP production in the distribution system near the tap of the house in Laveno. The house in Leggiuno seems to be supplied with drinking water which is rather biologically active.
8) ATP concentrations in all tubes in the Dynamic Test Facility were decreasing with increasing stagnation time. One exception was observed for galvanized steel with a reverse ATP stagnation curve. The first 0.5 and 1 hour stagnation times on a day gave always higher values than the second ones. ATP concentration was also slowly decreasing with time in Leggiuno samples.
9) It is not possible to compare results of tap water samples with results of DTF samples. Samples probably contained different physical and chemical parameters, but real values were not measured. In future experiments they should be taken into account (e.g. it is essential to check chlorine levels in tap water, prior to sampling).
10) Incoming water samples in DTF should be also included in sampling protocol of future experiments (water from the main valve).
11) Control plates (blank) show that mediums with tap water samples have been prepared properly – there weren’t any colonies forming.
42
12) Comparison between numbers of microbial cells counted on R2A mediums and calculated using ATP assay show that results doesn’t fit very well. Whereas for some samples the data are comparable, for others the difference in number of microbial cells is within three orders of magnitude higher. The number of microbial cells calculated using ATP concentrations is higher most probably due to the fact that not all bacterial cells were culturable on mediums.
13) On the PCA medium in both temperatures microbiological growth was lower than on the R2A medium, therefore R2A was a better medium for microbiological growth in our samples. The highest bacterial growth was on R2A medium in 22oC, than on R2A medium in 37oC. On PCA medium growth was mostly better in 37o C than in 22oC.
14) ATP can be a good, fast and sensitive indicator of microbiological activity in tap water samples.
43
REFERENCES 1. Bartram J., Cotruvo J., Exner M., Fricker C., Glasmacher A.; Heterotrophic Plate Counts
and Drinking-water Safety; The Significance of HPCs for Water Quality and Human Health; (2003)
2. Bush V. N., Picciolo G. L., Chappelle E.W.: The effect of growth phase and medium on the use of the firefly adenosine triphosphate (ATP) assay for the quantitation of bacteria. In Analytical Applications of Bioluminescence and Chemiluminescence, E.W. Chappelle and G.L. Picciolo. National Aeronautics and Space Administration, Washington, D.C., p.35-41, (1975)
3. Celsis AdvanceTM coupe Luminometer, Operator Manual, Celsis Reference: OM 011-2
4. Celsis Bioluminescence Reagents, updated 8-7-04, Rref: Prot 93-2
5. Chapelle E. W., Levin G. V.: Use of the firefly bioluminescent reaction for rapid detection and counting of bacteria, Biochem. Med. 2; 41-52, (1968)
6. Cole H. A., Wimpenny J.W.T., Hughes D.E. The ATP pool in Escherichia coli. 1 Measurement of the pool using a modified luciferase assay. Biochem. Biophys. Acta.143, p.445-453, (1967)
7. Council Directive 98/83/EC of 3 November 1998 on the quality of water intended for human consumption; L 330/32
8. D’Eustachio A.J., Johnson D.R.: Adenosine triphosphate content of bacteria. Fed. Proc.27:761, (1968)
9. Deininger R.A. Lee J. Rapid Determination of Bacteria in Drinking Water using an ATP Assay, Field Analytical Chemistry and Technology 5 No4, p.185-189, (2001)
10. DeLuca M.: Bioluminescent assays using co-immobilized enzymes, in Analytical Applications of Bioluminescence and Chemiluminescence (Kricka L.J., Stanley P.E., Thorpe G.H.G, Whitehead T.P), p.111-123, Academic Press, London, (1984)
11. Franzen JS and Binkley SB Comparison of the acid-soluble nucleotides in Escherichia coli at different growth rates. J Biol Chem 236, p.515–519, (1961)
12. Hamilton, R. D and Holm-Hansen O.,: Adenosine triphosphate content of marine bacteria. Limnol. Oceanogr. 12, p.319-324, (1967)
13. Harber M. J: Applications of Luminescence in Medical Microbiology and Hematology in Clinical and Biochemical Luminescence (Kricka L.J. and Carter T.J.N.) p. 189-218, Dekker, New York, (1982)
14. Harber M.J., Asscher A.W.: A new method for antibiotic assay based on measurement of bacterial adenosine triphosphate using the firefly bioluminescence system, Journal of Antimicrobial Chemotherapy, Vol. 3, pp.35-41, (1977)
15. Lee Jiyoung and Deininger Rolf A.: A rapid method for detecting bacteria in drinking water, Journal of Rapid Methods of Automation in Microbiology Vol 7, p. 135-145, (1999)
16. Lundin A.: Analytical Applications of bioluminescence: the firefly system in Clinical and Biochemical Luminescence (Kricka L.J., Carter T.J.N.) p.44-74, Dekker, New York, (1982)
17. Miller J.C., Miller J. N.: Statistics for analytical chemistry, Ellis Horwood Limited, Second Edition, (1988)
44
18. Operating and maintenance manual, Milli-Q Element, Millipore Corporation, PF06831 (Rev O), (1998)
19. Reasoner DJ. Geldreich EE. A new medium for the enumeration and subculture of bacteria from potable water. Appl Environ Microbiol 49, p. 1-7, (1985)
20. Somberg R., Pferdehirt B., Kupcho K., Promega Corporation:A Universal Kinase Assay for a World of Kinases”, Introducing the Kinase-GloTM Luminescent Kinase Assay, Number 83 2003
21. Stanley Philip: Extraction of Adenosine Triphosphate from Microbial and somatic Cells, Methods in Enzymology, Vol. 133, p.14-22, (1986)
22. Van der Kooij D., Albrechtsen H.J., Corfitzen C.B., Ashworth J., Parry I., Enkiri F., Hametner B., Kloiber R., Veenendaal H.R., Verhamme D., Hoekstra E.J.: CPDW project, Assessment of the microbial growth support potential of products in contact with drinking water”; EUR 20832 EN, (2003)
45
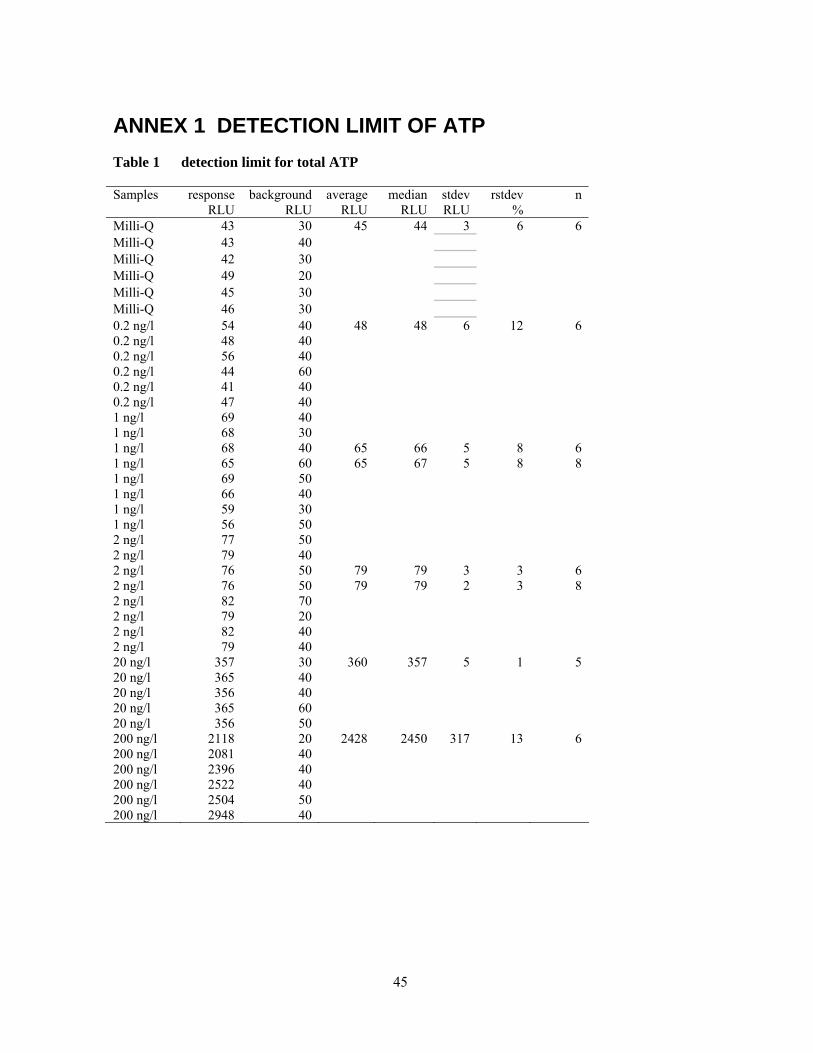
ANNEX 1 DETECTION LIMIT OF ATP Table 1 detection limit for total ATP
Samples response background average median stdev rstdev n RLU RLU RLU RLU RLU % Milli-Q 43 30 45 44 3 6 6 Milli-Q 43 40 Milli-Q 42 30 Milli-Q 49 20 Milli-Q 45 30 Milli-Q 46 30 0.2 ng/l 54 40 48 48 6 12 6 0.2 ng/l 48 40 0.2 ng/l 56 40 0.2 ng/l 44 60 0.2 ng/l 41 40 0.2 ng/l 47 40 1 ng/l 69 40 1 ng/l 68 30 1 ng/l 68 40 65 66 5 8 6 1 ng/l 65 60 65 67 5 8 8 1 ng/l 69 50 1 ng/l 66 40 1 ng/l 59 30 1 ng/l 56 50 2 ng/l 77 50 2 ng/l 79 40 2 ng/l 76 50 79 79 3 3 6 2 ng/l 76 50 79 79 2 3 8 2 ng/l 82 70 2 ng/l 79 20 2 ng/l 82 40 2 ng/l 79 40 20 ng/l 357 30 360 357 5 1 5 20 ng/l 365 40 20 ng/l 356 40 20 ng/l 365 60 20 ng/l 356 50 200 ng/l 2118 20 2428 2450 317 13 6 200 ng/l 2081 40 200 ng/l 2396 40 200 ng/l 2522 40 200 ng/l 2504 50 200 ng/l 2948 40

47
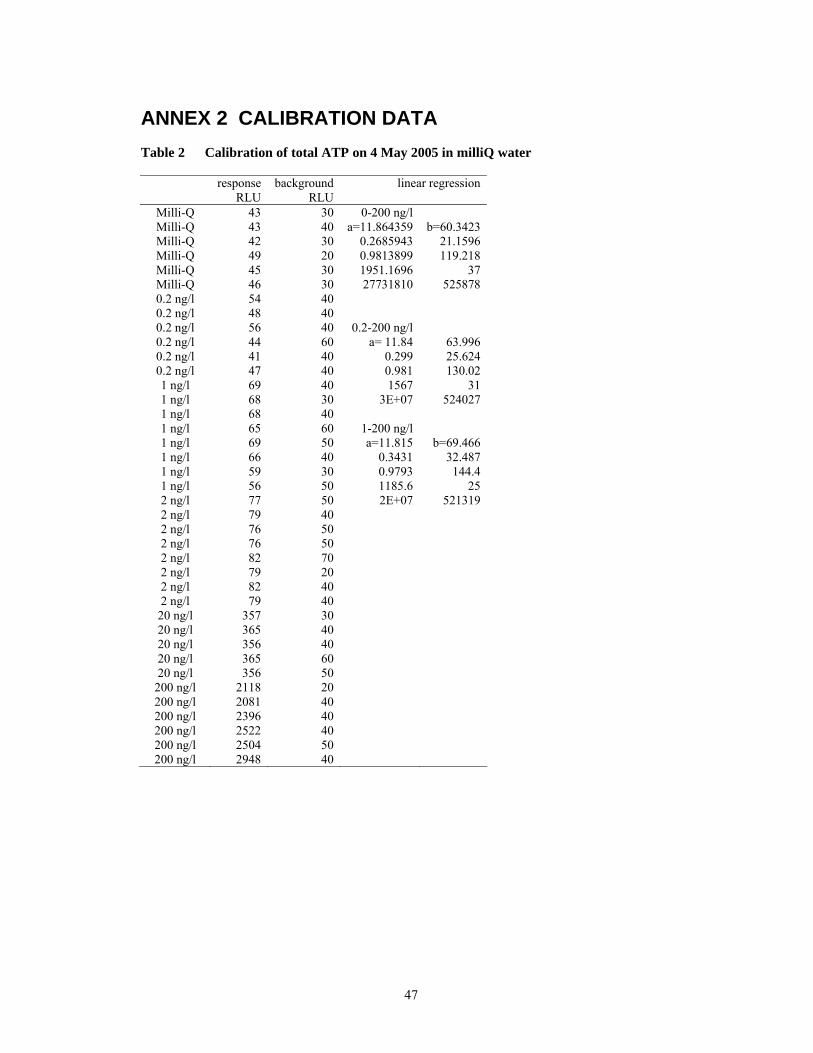
ANNEX 2 CALIBRATION DATA Table 2 Calibration of total ATP on 4 May 2005 in milliQ water
response background linear regression RLU RLU
Milli-Q 43 30 0-200 ng/l Milli-Q 43 40 a=11.864359 b=60.3423 Milli-Q 42 30 0.2685943 21.1596 Milli-Q 49 20 0.9813899 119.218 Milli-Q 45 30 1951.1696 37 Milli-Q 46 30 27731810 525878 0.2 ng/l 54 40 0.2 ng/l 48 40 0.2 ng/l 56 40 0.2-200 ng/l 0.2 ng/l 44 60 a= 11.84 63.996 0.2 ng/l 41 40 0.299 25.624 0.2 ng/l 47 40 0.981 130.02 1 ng/l 69 40 1567 31 1 ng/l 68 30 3E+07 524027 1 ng/l 68 40 1 ng/l 65 60 1-200 ng/l 1 ng/l 69 50 a=11.815 b=69.466 1 ng/l 66 40 0.3431 32.487 1 ng/l 59 30 0.9793 144.4 1 ng/l 56 50 1185.6 25 2 ng/l 77 50 2E+07 521319 2 ng/l 79 40 2 ng/l 76 50 2 ng/l 76 50 2 ng/l 82 70 2 ng/l 79 20 2 ng/l 82 40 2 ng/l 79 40 20 ng/l 357 30 20 ng/l 365 40 20 ng/l 356 40 20 ng/l 365 60 20 ng/l 356 50
200 ng/l 2118 20 200 ng/l 2081 40 200 ng/l 2396 40 200 ng/l 2522 40 200 ng/l 2504 50 200 ng/l 2948 40
48
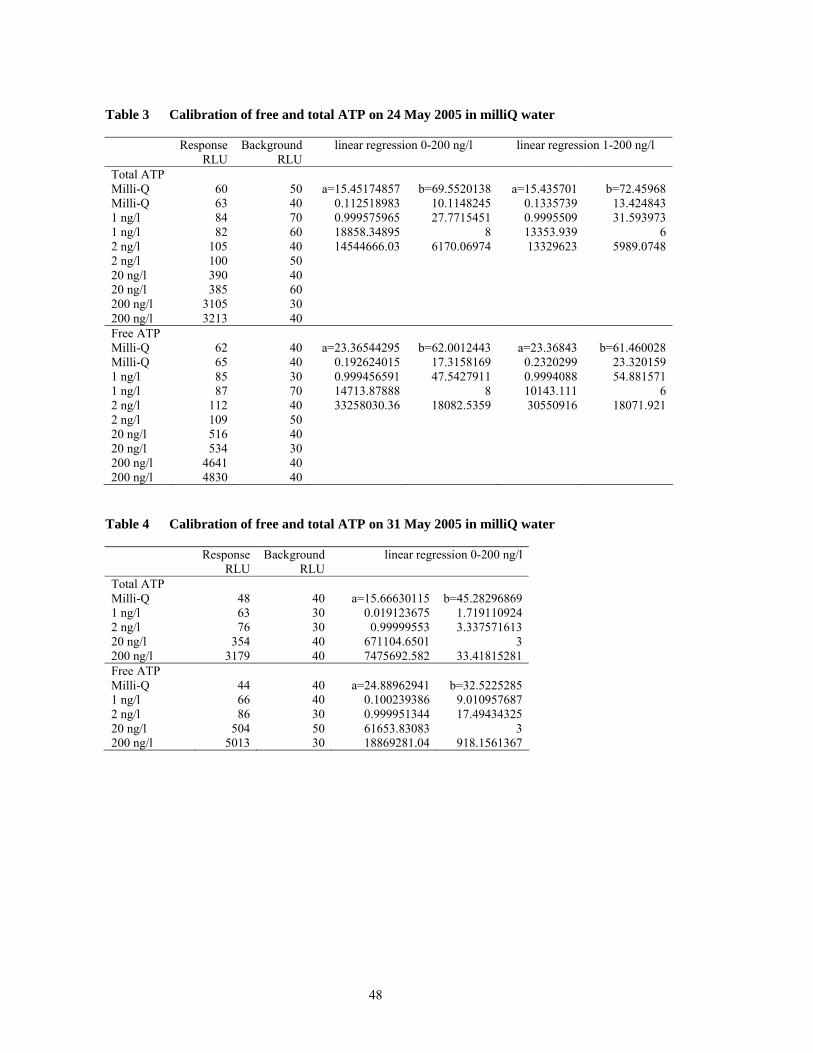
Table 3 Calibration of free and total ATP on 24 May 2005 in milliQ water
Response Background linear regression 0-200 ng/l linear regression 1-200 ng/l RLU RLU Total ATP Milli-Q 60 50 a=15.45174857 b=69.5520138 a=15.435701 b=72.45968 Milli-Q 63 40 0.112518983 10.1148245 0.1335739 13.424843 1 ng/l 84 70 0.999575965 27.7715451 0.9995509 31.593973 1 ng/l 82 60 18858.34895 8 13353.939 6 2 ng/l 105 40 14544666.03 6170.06974 13329623 5989.0748 2 ng/l 100 50 20 ng/l 390 40 20 ng/l 385 60 200 ng/l 3105 30 200 ng/l 3213 40 Free ATP Milli-Q 62 40 a=23.36544295 b=62.0012443 a=23.36843 b=61.460028 Milli-Q 65 40 0.192624015 17.3158169 0.2320299 23.320159 1 ng/l 85 30 0.999456591 47.5427911 0.9994088 54.881571 1 ng/l 87 70 14713.87888 8 10143.111 6 2 ng/l 112 40 33258030.36 18082.5359 30550916 18071.921 2 ng/l 109 50 20 ng/l 516 40 20 ng/l 534 30 200 ng/l 4641 40 200 ng/l 4830 40
Table 4 Calibration of free and total ATP on 31 May 2005 in milliQ water
Response Background linear regression 0-200 ng/l RLU RLU Total ATP Milli-Q 48 40 a=15.66630115 b=45.28296869 1 ng/l 63 30 0.019123675 1.719110924 2 ng/l 76 30 0.99999553 3.337571613 20 ng/l 354 40 671104.6501 3 200 ng/l 3179 40 7475692.582 33.41815281 Free ATP Milli-Q 44 40 a=24.88962941 b=32.5225285 1 ng/l 66 40 0.100239386 9.010957687 2 ng/l 86 30 0.999951344 17.49434325 20 ng/l 504 50 61653.83083 3 200 ng/l 5013 30 18869281.04 918.1561367
49
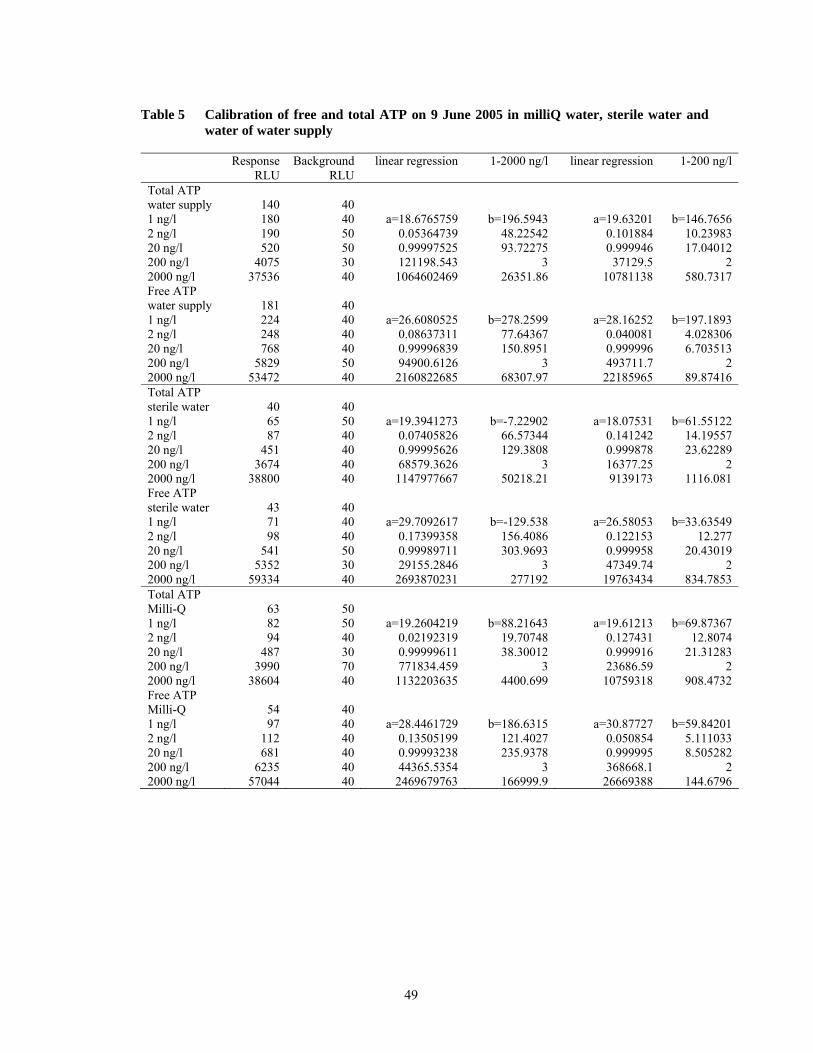
Table 5 Calibration of free and total ATP on 9 June 2005 in milliQ water, sterile water and water of water supply
Response Background linear regression 1-2000 ng/l linear regression 1-200 ng/l RLU RLU Total ATP water supply 140 40 1 ng/l 180 40 a=18.6765759 b=196.5943 a=19.63201 b=146.7656 2 ng/l 190 50 0.05364739 48.22542 0.101884 10.23983 20 ng/l 520 50 0.99997525 93.72275 0.999946 17.04012 200 ng/l 4075 30 121198.543 3 37129.5 2 2000 ng/l 37536 40 1064602469 26351.86 10781138 580.7317 Free ATP water supply 181 40 1 ng/l 224 40 a=26.6080525 b=278.2599 a=28.16252 b=197.1893 2 ng/l 248 40 0.08637311 77.64367 0.040081 4.028306 20 ng/l 768 40 0.99996839 150.8951 0.999996 6.703513 200 ng/l 5829 50 94900.6126 3 493711.7 2 2000 ng/l 53472 40 2160822685 68307.97 22185965 89.87416 Total ATP sterile water 40 40 1 ng/l 65 50 a=19.3941273 b=-7.22902 a=18.07531 b=61.55122 2 ng/l 87 40 0.07405826 66.57344 0.141242 14.19557 20 ng/l 451 40 0.99995626 129.3808 0.999878 23.62289 200 ng/l 3674 40 68579.3626 3 16377.25 2 2000 ng/l 38800 40 1147977667 50218.21 9139173 1116.081 Free ATP sterile water 43 40 1 ng/l 71 40 a=29.7092617 b=-129.538 a=26.58053 b=33.63549 2 ng/l 98 40 0.17399358 156.4086 0.122153 12.277 20 ng/l 541 50 0.99989711 303.9693 0.999958 20.43019 200 ng/l 5352 30 29155.2846 3 47349.74 2 2000 ng/l 59334 40 2693870231 277192 19763434 834.7853 Total ATP Milli-Q 63 50 1 ng/l 82 50 a=19.2604219 b=88.21643 a=19.61213 b=69.87367 2 ng/l 94 40 0.02192319 19.70748 0.127431 12.8074 20 ng/l 487 30 0.99999611 38.30012 0.999916 21.31283 200 ng/l 3990 70 771834.459 3 23686.59 2 2000 ng/l 38604 40 1132203635 4400.699 10759318 908.4732 Free ATP Milli-Q 54 40 1 ng/l 97 40 a=28.4461729 b=186.6315 a=30.87727 b=59.84201 2 ng/l 112 40 0.13505199 121.4027 0.050854 5.111033 20 ng/l 681 40 0.99993238 235.9378 0.999995 8.505282 200 ng/l 6235 40 44365.5354 3 368668.1 2 2000 ng/l 57044 40 2469679763 166999.9 26669388 144.6796
50
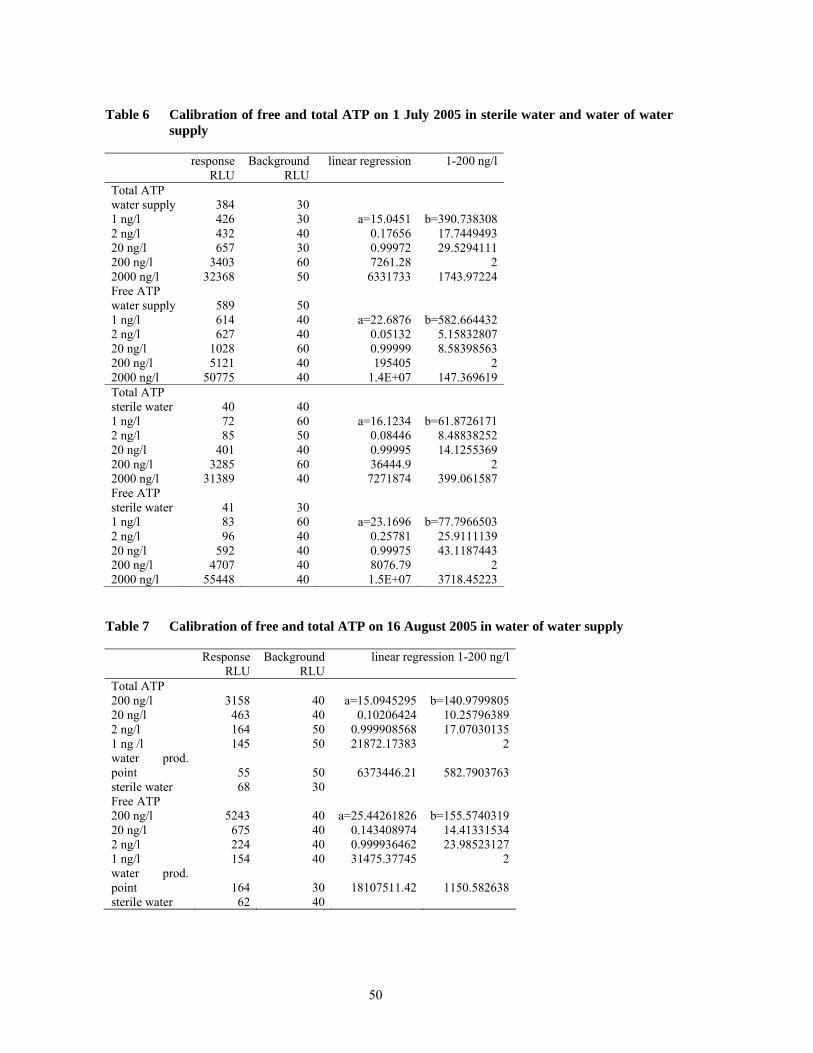
Table 6 Calibration of free and total ATP on 1 July 2005 in sterile water and water of water supply
response Background linear regression 1-200 ng/l RLU RLU Total ATP water supply 384 30 1 ng/l 426 30 a=15.0451 b=390.738308 2 ng/l 432 40 0.17656 17.7449493 20 ng/l 657 30 0.99972 29.5294111 200 ng/l 3403 60 7261.28 2 2000 ng/l 32368 50 6331733 1743.97224 Free ATP water supply 589 50 1 ng/l 614 40 a=22.6876 b=582.664432 2 ng/l 627 40 0.05132 5.15832807 20 ng/l 1028 60 0.99999 8.58398563 200 ng/l 5121 40 195405 2 2000 ng/l 50775 40 1.4E+07 147.369619 Total ATP sterile water 40 40 1 ng/l 72 60 a=16.1234 b=61.8726171 2 ng/l 85 50 0.08446 8.48838252 20 ng/l 401 40 0.99995 14.1255369 200 ng/l 3285 60 36444.9 2 2000 ng/l 31389 40 7271874 399.061587 Free ATP sterile water 41 30 1 ng/l 83 60 a=23.1696 b=77.7966503 2 ng/l 96 40 0.25781 25.9111139 20 ng/l 592 40 0.99975 43.1187443 200 ng/l 4707 40 8076.79 2 2000 ng/l 55448 40 1.5E+07 3718.45223
Table 7 Calibration of free and total ATP on 16 August 2005 in water of water supply
Response Background linear regression 1-200 ng/l RLU RLU Total ATP 200 ng/l 3158 40 a=15.0945295 b=140.9799805 20 ng/l 463 40 0.10206424 10.25796389 2 ng/l 164 50 0.999908568 17.07030135 1 ng /l 145 50 21872.17383 2 water prod. point 55 50 6373446.21 582.7903763 sterile water 68 30 Free ATP 200 ng/l 5243 40 a=25.44261826 b=155.5740319 20 ng/l 675 40 0.143408974 14.41331534 2 ng/l 224 40 0.999936462 23.98523127 1 ng/l 154 40 31475.37745 2 water prod. point 164 30 18107511.42 1150.582638 sterile water 62 40
51
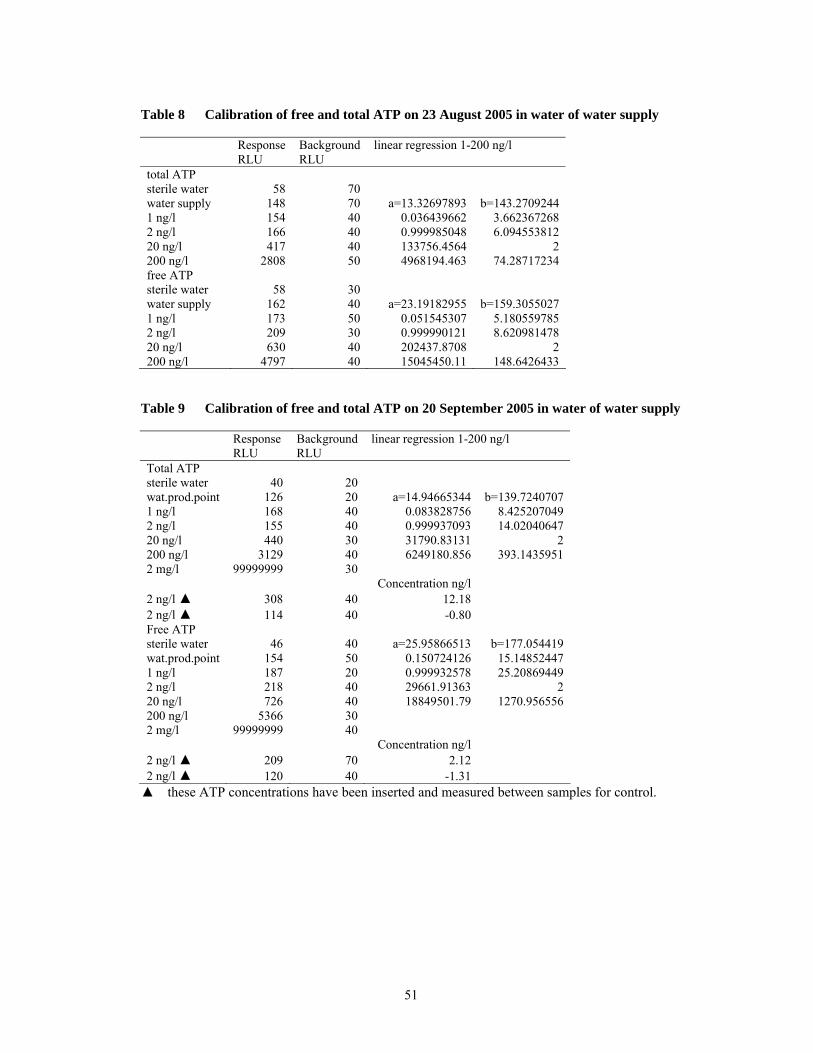
Table 8 Calibration of free and total ATP on 23 August 2005 in water of water supply
Response Background linear regression 1-200 ng/l RLU RLU total ATP sterile water 58 70 water supply 148 70 a=13.32697893 b=143.2709244 1 ng/l 154 40 0.036439662 3.662367268 2 ng/l 166 40 0.999985048 6.094553812 20 ng/l 417 40 133756.4564 2 200 ng/l 2808 50 4968194.463 74.28717234 free ATP sterile water 58 30 water supply 162 40 a=23.19182955 b=159.3055027 1 ng/l 173 50 0.051545307 5.180559785 2 ng/l 209 30 0.999990121 8.620981478 20 ng/l 630 40 202437.8708 2 200 ng/l 4797 40 15045450.11 148.6426433
Table 9 Calibration of free and total ATP on 20 September 2005 in water of water supply
Response Background linear regression 1-200 ng/l RLU RLU Total ATP sterile water 40 20 wat.prod.point 126 20 a=14.94665344 b=139.7240707 1 ng/l 168 40 0.083828756 8.425207049 2 ng/l 155 40 0.999937093 14.02040647 20 ng/l 440 30 31790.83131 2 200 ng/l 3129 40 6249180.856 393.1435951 2 mg/l 99999999 30 Concentration ng/l 2 ng/l ▲ 308 40 12.18 2 ng/l ▲ 114 40 -0.80 Free ATP sterile water 46 40 a=25.95866513 b=177.054419 wat.prod.point 154 50 0.150724126 15.14852447 1 ng/l 187 20 0.999932578 25.20869449 2 ng/l 218 40 29661.91363 2 20 ng/l 726 40 18849501.79 1270.956556 200 ng/l 5366 30 2 mg/l 99999999 40 Concentration ng/l 2 ng/l ▲ 209 70 2.12 2 ng/l ▲ 120 40 -1.31 ▲ these ATP concentrations have been inserted and measured between samples for control.
52
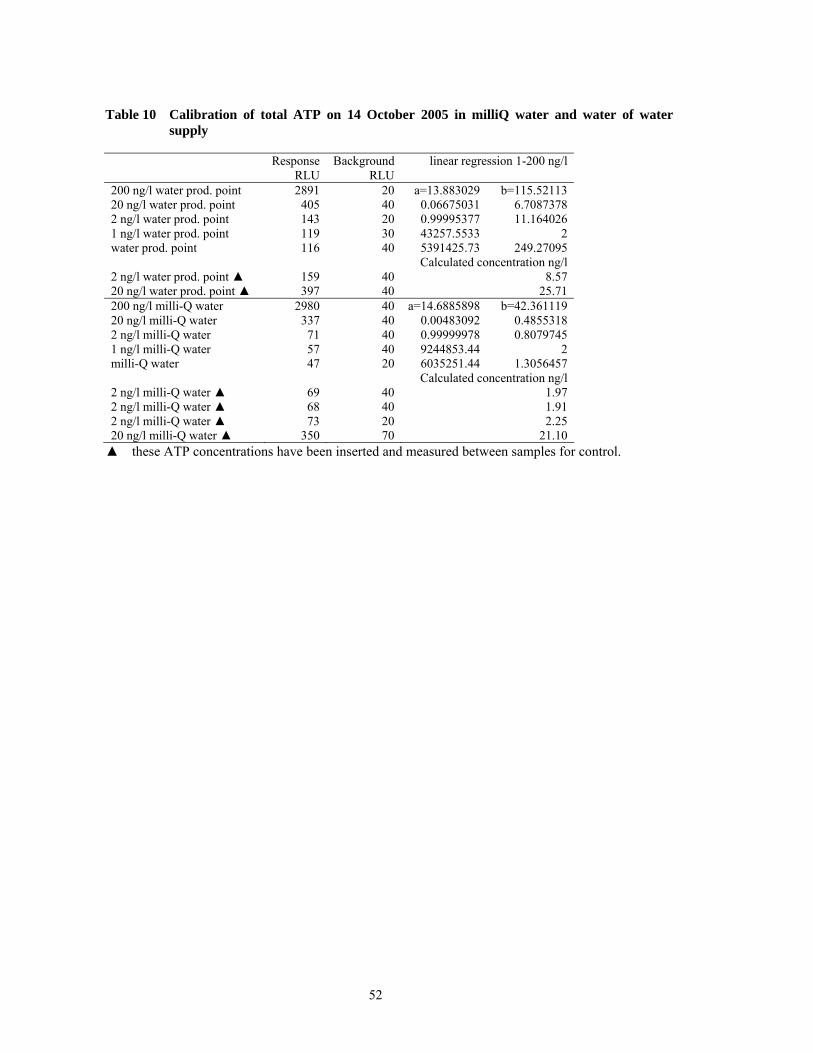
Table 10 Calibration of total ATP on 14 October 2005 in milliQ water and water of water supply
Response Background linear regression 1-200 ng/l RLU RLU 200 ng/l water prod. point 2891 20 a=13.883029 b=115.52113 20 ng/l water prod. point 405 40 0.06675031 6.7087378 2 ng/l water prod. point 143 20 0.99995377 11.164026 1 ng/l water prod. point 119 30 43257.5533 2 water prod. point 116 40 5391425.73 249.27095 Calculated concentration ng/l 2 ng/l water prod. point ▲ 159 40 8.57 20 ng/l water prod. point ▲ 397 40 25.71 200 ng/l milli-Q water 2980 40 a=14.6885898 b=42.361119 20 ng/l milli-Q water 337 40 0.00483092 0.4855318 2 ng/l milli-Q water 71 40 0.99999978 0.8079745 1 ng/l milli-Q water 57 40 9244853.44 2 milli-Q water 47 20 6035251.44 1.3056457 Calculated concentration ng/l 2 ng/l milli-Q water ▲ 69 40 1.97 2 ng/l milli-Q water ▲ 68 40 1.91 2 ng/l milli-Q water ▲ 73 20 2.25 20 ng/l milli-Q water ▲ 350 70 21.10 ▲ these ATP concentrations have been inserted and measured between samples for control.
53
ANNEX 3 RLU RESPONSE Table 11 Effect of the volume of water in the cuvette on the background response
Response Background average stdev rstdev n RLU RLU RLU RLU % First batch 100 µl milli-Q water 37 30 37.67 2.503 6.646 6 100 µl milli-Q water 38 20 100 µl milli-Q water 39 40 100 µl milli-Q water 33 40 100 µl milli-Q water 40 70 100 µl milli-Q water 39 30 200 µl milli-Q water 40 50 38.67 1.506 3.894 6 200 µl milli-Q water 37 50 200 µl milli-Q water 40 40 200 µl milli-Q water 38 40 200 µl milli-Q water 40 50 200 µl milli-Q water 37 30 300 µl milli-Q water 41 40 36.83 3.488 9.47 6 300 µl milli-Q water 34 40 300 µl milli-Q water 33 30 300 µl milli-Q water 35 40 300 µl milli-Q water 37 60 300 µl milli-Q water 41 40 Second batch 100 µl milli-Q water 44 60 44.33 2.34 5.27 6 100 µl milli-Q water 46 40 100 µl milli-Q water 44 40 100 µl milli-Q water 40 40 100 µl milli-Q water 46 60 100 µl milli-Q water 46 40
54
Table 12 effect of sunlight on the background response of cuvettes filled with 100 µl milliQ water
Exposure time Response Background average stdev rstdev n RLU RLU RLU RLU % 0 min 44 60 44.33 2.34 5.27 6 0 min 46 40 0 min 44 40 0 min 40 40 0 min 46 60 0 min 46 40 2 min 51 40 59.00 5.62 9.53 6 2 min 67 60 2 min 56 60 2 min 57 50 2 min 60 60 2 min 63 50 2 min light-2 min dark 42 40 40.60 1.95 4.80 5 2 min light-2 min dark 40 30 2 min light-2 min dark 38 20 2 min light-2 min dark 40 40 2 min light-2 min dark 43 40 5 min 73 70 59.50 7.26 12.20 6 5 min 62 70 5 min 55 60 5 min 53 60 5 min 57 50 5 min 57 40 10 min 61 80 60.67 10.50 17.31 6 10 min 68 70 10 min 59 70 10 min 54 30 10 min 76 60 10 min 46 70 20 min 52 60 50.33 6.22 12.35 6 20 min 54 60 20 min 47 30 20 min 46 50 20 min 43 40 20 min 60 40 40 min 65 80 66.17 6.82 10.31 6 40 min 67 70 40 min 79 70 40 min 61 50 40 min 60 60 40 min 65 70 80 min 70 50 64.67 6.19 9.57 6 80 min 59 70 80 min 65 70 80 min 72 80 80 min 56 70 80 min 66 70 160 min 66 70 62.33 3.14 5.04 6 160 min 66 80 160 min 61 70 160 min 62 90 160 min 61 60 160 min 58 70
55
Exposure time Response Background average stdev rstdev n RLU RLU RLU RLU % 320 min 47 40 48.33 3.78 7.81 6 320 min 54 50 320 min 51 40 320 min 45 50 320 min 44 40 320 min 49 60
Table 13 Effect of sunlight on the background response of cuvettes filled with 100 µl milliQ water made anti-static by ethanol
Exposure time Response Background average stdev rstdev n RLU RLU RLU RLU % 0 min 52 70 50.33 4.27 8.49 6 0 min 49 50 0 min 51 40 0 min 49 60 0 min 57 40 0 min 44 40 2 min 52 50 49.67 4.55 9.15 6 2 min 53 50 2 min 55 60 2 min 43 50 2 min 46 50 2 min 49 30 2 min light-2 min dark 40 20 42.17 2.23 5.29 6 2 min light-2 min dark 43 50 2 min light-2 min dark 42 40 2 min light-2 min dark 46 50 2 min light-2 min dark 40 60 2 min light-5 min dark 45 60 45.33 2.58 5.70 6 2 min light-5 min dark 46 30 2 min light-5 min dark 43 40 2 min light-5 min dark 49 40 2 min light-5 min dark 47 40 2 min light-5 min dark 42 40 0 min made static 41 30 46.00 3.22 7.01 6 0 min made static 49 40 0 min made static 48 60 0 min made static 47 60 0 min made static 43 40 0 min made static 48 40
Table 14 Effect of LuminEx on response of a 200 ng/l solution of ATP
Sample Response Background average stdev rstdev n RLU RLU RLU RLU % 100µl LuminEX 2833 50 2774.33 155.5 5.61 3 100µl LuminEX 2892 50 100µl LuminEX 2598 50 100µl H2O 3010 70 3125.67 105.3 3.37 3 100µl H2O 3151 50 100µl H2O 3216 40
56
Table 15 Effect of concentration of LuminATE on the response of mixture of 100 µl of 200 ng/l ATP, while the total volume remains constant
Response Background RLU RLU 150 µl H2O+50 µl LuminATE 1150 60 100 µl H2O+100 µl LuminATE 3189 70 50 µl H2O+150 µl LuminATE 2004* 40 150µl H2O +50 µl LuminATE 1135 40 100µl H2O+100 µl LuminATE 3685 40 50µl H2O+150 µl LuminATE 4708 40
* the response in this sample is not correct, since a wrong method had been used
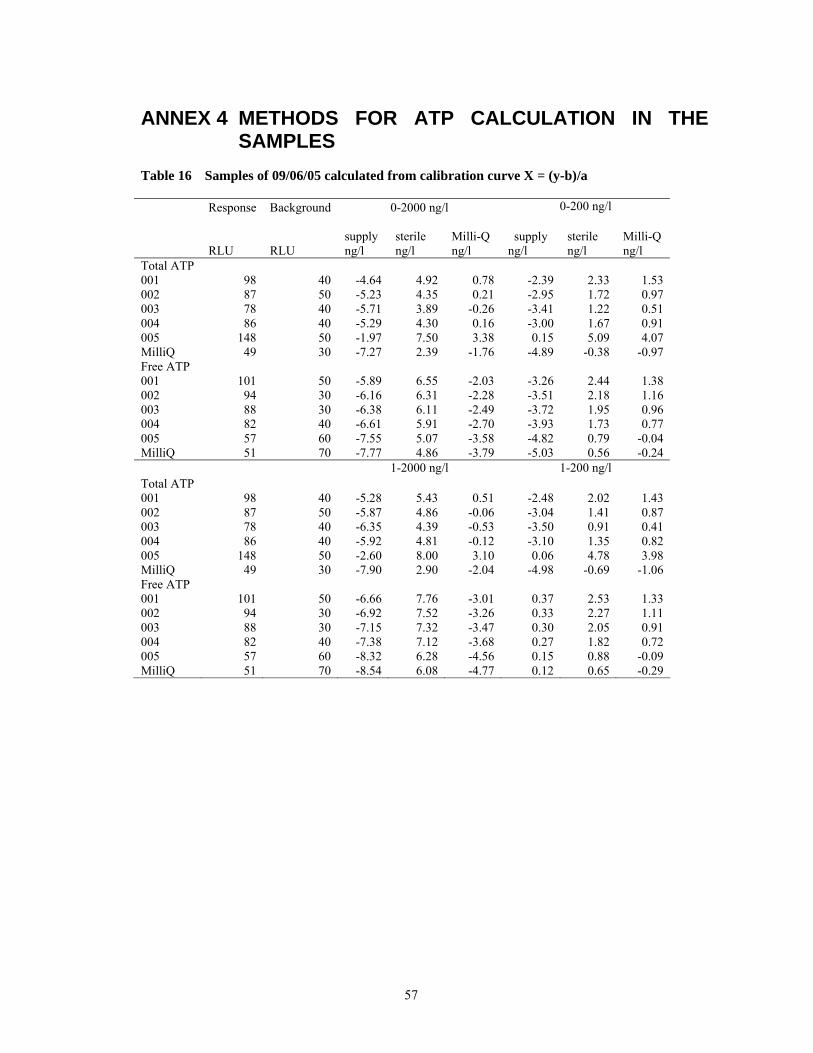
57
ANNEX 4 METHODS FOR ATP CALCULATION IN THE SAMPLES
Table 16 Samples of 09/06/05 calculated from calibration curve X = (y-b)/a
Response Background 0-2000 ng/l 0-200 ng/l
supply sterile Milli-Q supply sterile Milli-Q
RLU RLU ng/l ng/l ng/l ng/l ng/l ng/l Total ATP 001 98 40 -4.64 4.92 0.78 -2.39 2.33 1.53 002 87 50 -5.23 4.35 0.21 -2.95 1.72 0.97 003 78 40 -5.71 3.89 -0.26 -3.41 1.22 0.51 004 86 40 -5.29 4.30 0.16 -3.00 1.67 0.91 005 148 50 -1.97 7.50 3.38 0.15 5.09 4.07 MilliQ 49 30 -7.27 2.39 -1.76 -4.89 -0.38 -0.97 Free ATP 001 101 50 -5.89 6.55 -2.03 -3.26 2.44 1.38 002 94 30 -6.16 6.31 -2.28 -3.51 2.18 1.16 003 88 30 -6.38 6.11 -2.49 -3.72 1.95 0.96 004 82 40 -6.61 5.91 -2.70 -3.93 1.73 0.77 005 57 60 -7.55 5.07 -3.58 -4.82 0.79 -0.04 MilliQ 51 70 -7.77 4.86 -3.79 -5.03 0.56 -0.24 1-2000 ng/l 1-200 ng/l Total ATP 001 98 40 -5.28 5.43 0.51 -2.48 2.02 1.43 002 87 50 -5.87 4.86 -0.06 -3.04 1.41 0.87 003 78 40 -6.35 4.39 -0.53 -3.50 0.91 0.41 004 86 40 -5.92 4.81 -0.12 -3.10 1.35 0.82 005 148 50 -2.60 8.00 3.10 0.06 4.78 3.98 MilliQ 49 30 -7.90 2.90 -2.04 -4.98 -0.69 -1.06 Free ATP 001 101 50 -6.66 7.76 -3.01 0.37 2.53 1.33 002 94 30 -6.92 7.52 -3.26 0.33 2.27 1.11 003 88 30 -7.15 7.32 -3.47 0.30 2.05 0.91 004 82 40 -7.38 7.12 -3.68 0.27 1.82 0.72 005 57 60 -8.32 6.28 -4.56 0.15 0.88 -0.09 MilliQ 51 70 -8.54 6.08 -4.77 0.12 0.65 -0.29
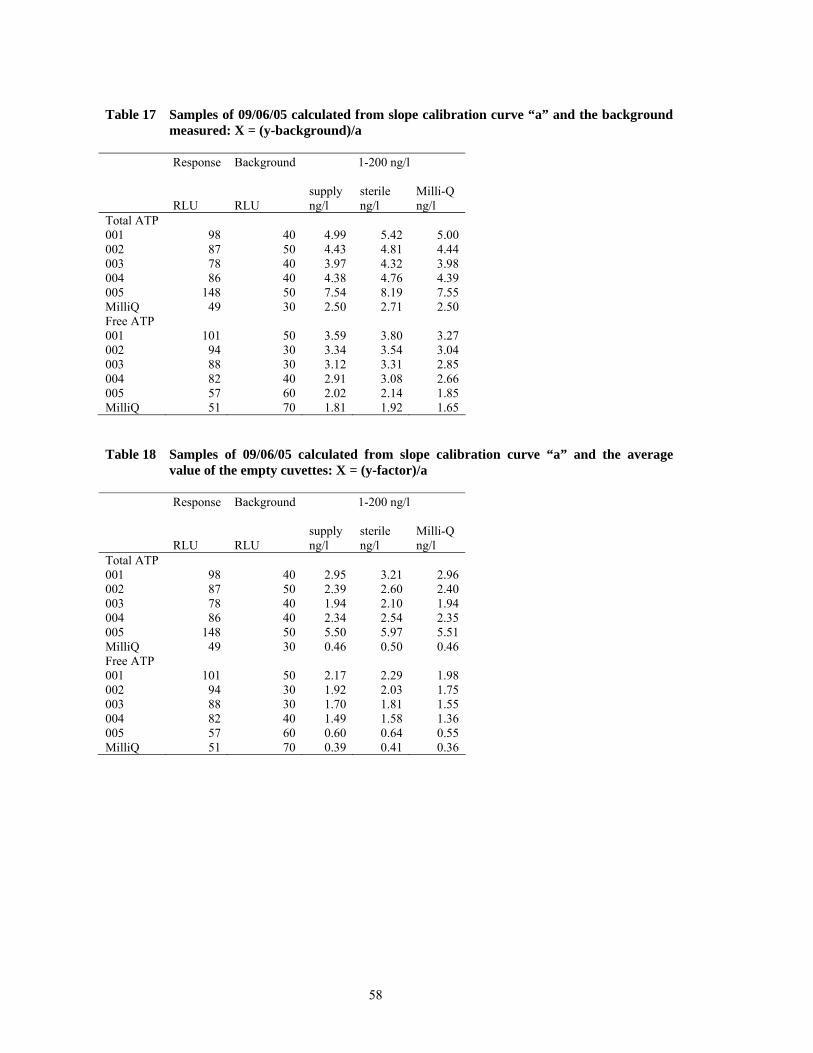
58
Table 17 Samples of 09/06/05 calculated from slope calibration curve “a” and the background measured: X = (y-background)/a
Response Background 1-200 ng/l
supply sterile Milli-Q
RLU RLU ng/l ng/l ng/l Total ATP 001 98 40 4.99 5.42 5.00 002 87 50 4.43 4.81 4.44 003 78 40 3.97 4.32 3.98 004 86 40 4.38 4.76 4.39 005 148 50 7.54 8.19 7.55 MilliQ 49 30 2.50 2.71 2.50 Free ATP 001 101 50 3.59 3.80 3.27 002 94 30 3.34 3.54 3.04 003 88 30 3.12 3.31 2.85 004 82 40 2.91 3.08 2.66 005 57 60 2.02 2.14 1.85 MilliQ 51 70 1.81 1.92 1.65
Table 18 Samples of 09/06/05 calculated from slope calibration curve “a” and the average value of the empty cuvettes: X = (y-factor)/a
Response Background 1-200 ng/l
supply sterile Milli-Q
RLU RLU ng/l ng/l ng/l Total ATP 001 98 40 2.95 3.21 2.96 002 87 50 2.39 2.60 2.40 003 78 40 1.94 2.10 1.94 004 86 40 2.34 2.54 2.35 005 148 50 5.50 5.97 5.51 MilliQ 49 30 0.46 0.50 0.46 Free ATP 001 101 50 2.17 2.29 1.98 002 94 30 1.92 2.03 1.75 003 88 30 1.70 1.81 1.55 004 82 40 1.49 1.58 1.36 005 57 60 0.60 0.64 0.55 MilliQ 51 70 0.39 0.41 0.36
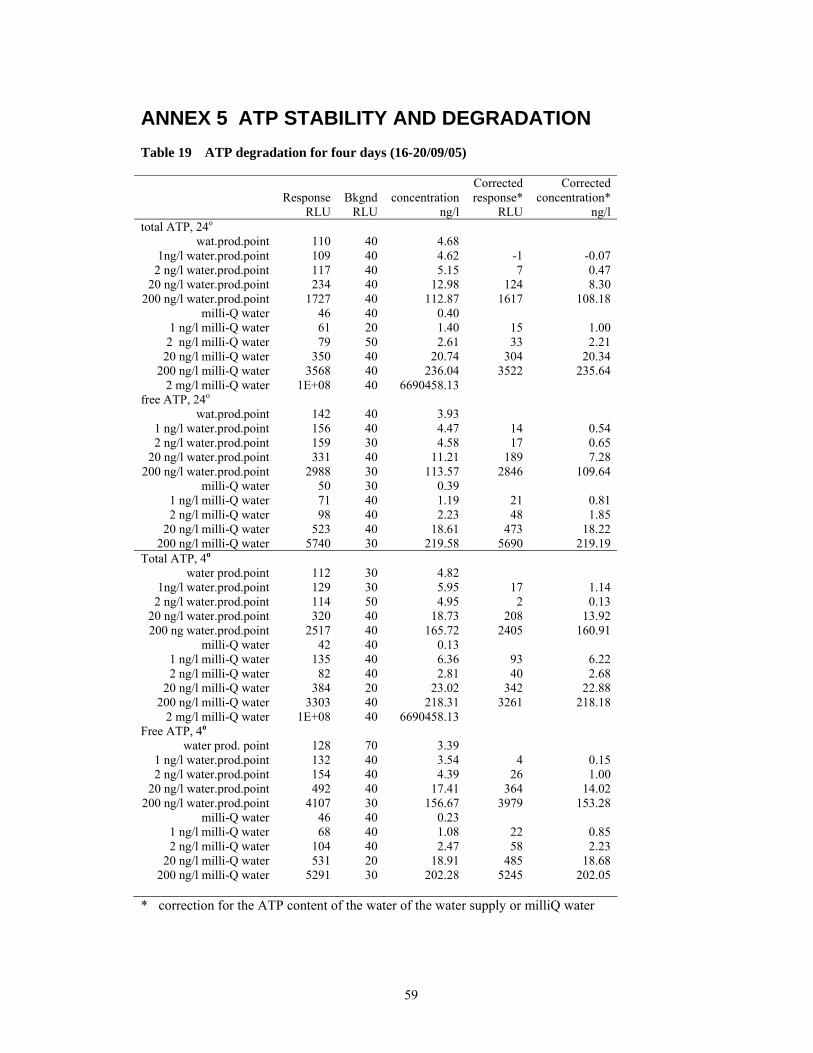
59
ANNEX 5 ATP STABILITY AND DEGRADATION Table 19 ATP degradation for four days (16-20/09/05)
Response Bkgnd concentration Corrected response*
Corrected concentration*
RLU RLU ng/l RLU ng/l total ATP, 24o
wat.prod.point 110 40 4.68 1ng/l water.prod.point 109 40 4.62 -1 -0.07
2 ng/l water.prod.point 117 40 5.15 7 0.47 20 ng/l water.prod.point 234 40 12.98 124 8.30
200 ng/l water.prod.point 1727 40 112.87 1617 108.18 milli-Q water 46 40 0.40
1 ng/l milli-Q water 61 20 1.40 15 1.00 2 ng/l milli-Q water 79 50 2.61 33 2.21 20 ng/l milli-Q water 350 40 20.74 304 20.34
200 ng/l milli-Q water 3568 40 236.04 3522 235.64 2 mg/l milli-Q water 1E+08 40 6690458.13
free ATP, 24o wat.prod.point 142 40 3.93
1 ng/l water.prod.point 156 40 4.47 14 0.54 2 ng/l water.prod.point 159 30 4.58 17 0.65
20 ng/l water.prod.point 331 40 11.21 189 7.28 200 ng/l water.prod.point 2988 30 113.57 2846 109.64
milli-Q water 50 30 0.39 1 ng/l milli-Q water 71 40 1.19 21 0.81 2 ng/l milli-Q water 98 40 2.23 48 1.85
20 ng/l milli-Q water 523 40 18.61 473 18.22 200 ng/l milli-Q water 5740 30 219.58 5690 219.19
Total ATP, 4o water prod.point 112 30 4.82
1ng/l water.prod.point 129 30 5.95 17 1.14 2 ng/l water.prod.point 114 50 4.95 2 0.13
20 ng/l water.prod.point 320 40 18.73 208 13.92 200 ng water.prod.point 2517 40 165.72 2405 160.91
milli-Q water 42 40 0.13 1 ng/l milli-Q water 135 40 6.36 93 6.22 2 ng/l milli-Q water 82 40 2.81 40 2.68
20 ng/l milli-Q water 384 20 23.02 342 22.88 200 ng/l milli-Q water 3303 40 218.31 3261 218.18
2 mg/l milli-Q water 1E+08 40 6690458.13 Free ATP, 4o
water prod. point 128 70 3.39 1 ng/l water.prod.point 132 40 3.54 4 0.15 2 ng/l water.prod.point 154 40 4.39 26 1.00
20 ng/l water.prod.point 492 40 17.41 364 14.02 200 ng/l water.prod.point 4107 30 156.67 3979 153.28
milli-Q water 46 40 0.23 1 ng/l milli-Q water 68 40 1.08 22 0.85 2 ng/l milli-Q water 104 40 2.47 58 2.23
20 ng/l milli-Q water 531 20 18.91 485 18.68 200 ng/l milli-Q water 5291 30 202.28 5245 202.05
* correction for the ATP content of the water of the water supply or milliQ water
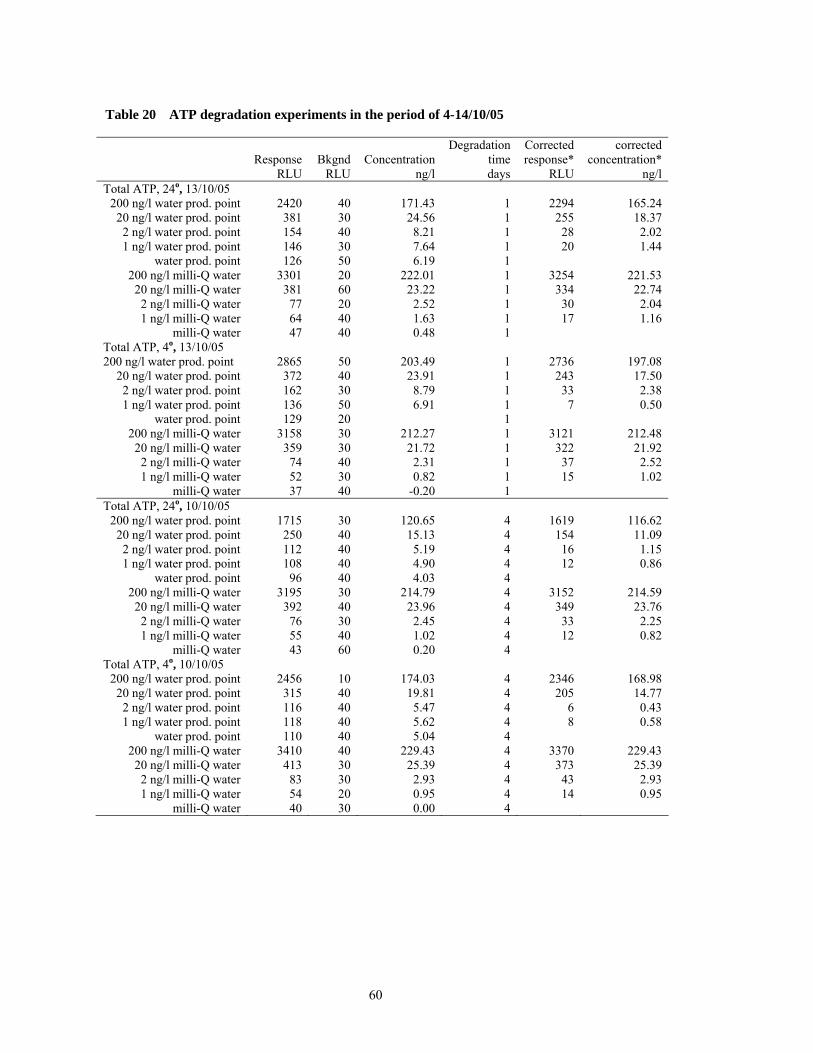
60
Table 20 ATP degradation experiments in the period of 4-14/10/05
Response Bkgnd Concentration Degradation
time Corrected response*
corrected concentration*
RLU RLU ng/l days RLU ng/l Total ATP, 24o, 13/10/05
200 ng/l water prod. point 2420 40 171.43 1 2294 165.24 20 ng/l water prod. point 381 30 24.56 1 255 18.37 2 ng/l water prod. point 154 40 8.21 1 28 2.02 1 ng/l water prod. point 146 30 7.64 1 20 1.44
water prod. point 126 50 6.19 1 200 ng/l milli-Q water 3301 20 222.01 1 3254 221.53 20 ng/l milli-Q water 381 60 23.22 1 334 22.74 2 ng/l milli-Q water 77 20 2.52 1 30 2.04 1 ng/l milli-Q water 64 40 1.63 1 17 1.16
milli-Q water 47 40 0.48 1 Total ATP, 4o, 13/10/05 200 ng/l water prod. point 2865 50 203.49 1 2736 197.08
20 ng/l water prod. point 372 40 23.91 1 243 17.50 2 ng/l water prod. point 162 30 8.79 1 33 2.38 1 ng/l water prod. point 136 50 6.91 1 7 0.50
water prod. point 129 20 1 200 ng/l milli-Q water 3158 30 212.27 1 3121 212.48 20 ng/l milli-Q water 359 30 21.72 1 322 21.92 2 ng/l milli-Q water 74 40 2.31 1 37 2.52 1 ng/l milli-Q water 52 30 0.82 1 15 1.02
milli-Q water 37 40 -0.20 1 Total ATP, 24o, 10/10/05
200 ng/l water prod. point 1715 30 120.65 4 1619 116.62 20 ng/l water prod. point 250 40 15.13 4 154 11.09 2 ng/l water prod. point 112 40 5.19 4 16 1.15 1 ng/l water prod. point 108 40 4.90 4 12 0.86
water prod. point 96 40 4.03 4 200 ng/l milli-Q water 3195 30 214.79 4 3152 214.59 20 ng/l milli-Q water 392 40 23.96 4 349 23.76 2 ng/l milli-Q water 76 30 2.45 4 33 2.25 1 ng/l milli-Q water 55 40 1.02 4 12 0.82
milli-Q water 43 60 0.20 4 Total ATP, 4o, 10/10/05
200 ng/l water prod. point 2456 10 174.03 4 2346 168.98 20 ng/l water prod. point 315 40 19.81 4 205 14.77 2 ng/l water prod. point 116 40 5.47 4 6 0.43 1 ng/l water prod. point 118 40 5.62 4 8 0.58
water prod. point 110 40 5.04 4 200 ng/l milli-Q water 3410 40 229.43 4 3370 229.43 20 ng/l milli-Q water 413 30 25.39 4 373 25.39 2 ng/l milli-Q water 83 30 2.93 4 43 2.93 1 ng/l milli-Q water 54 20 0.95 4 14 0.95
milli-Q water 40 30 0.00 4
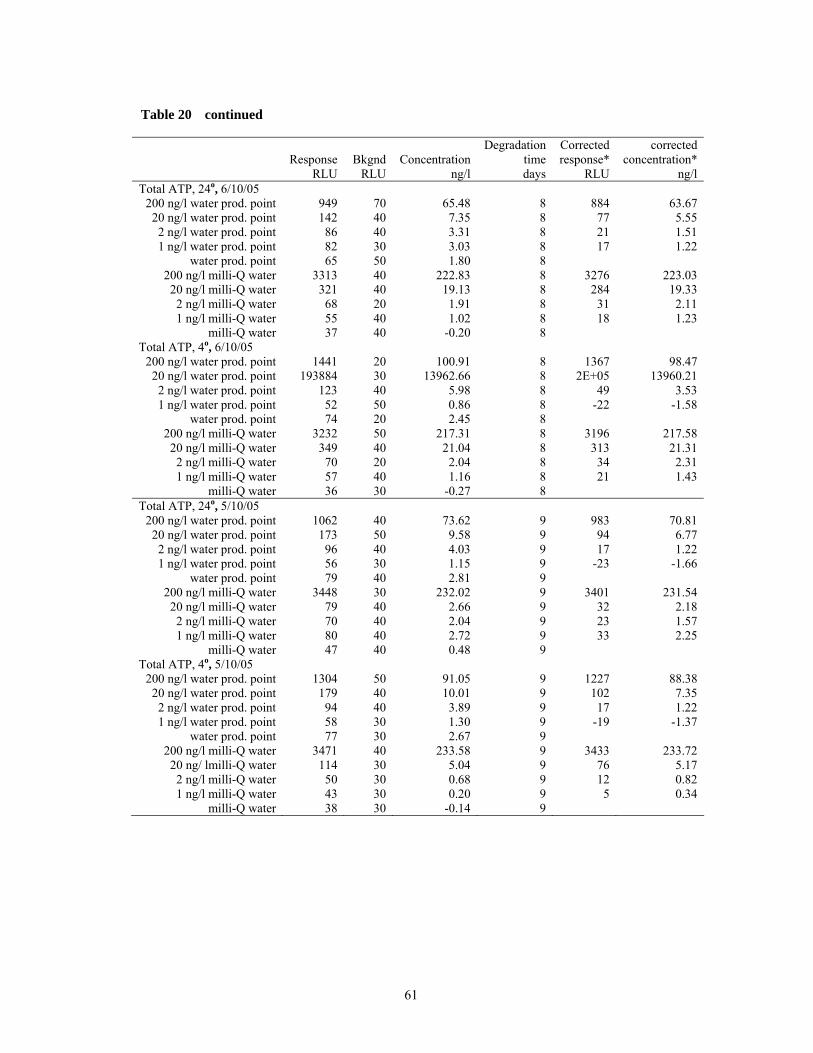
61
Table 20 continued
Response Bkgnd Concentration Degradation
time Corrected response*
corrected concentration*
RLU RLU ng/l days RLU ng/l Total ATP, 24o, 6/10/05
200 ng/l water prod. point 949 70 65.48 8 884 63.67 20 ng/l water prod. point 142 40 7.35 8 77 5.55 2 ng/l water prod. point 86 40 3.31 8 21 1.51 1 ng/l water prod. point 82 30 3.03 8 17 1.22
water prod. point 65 50 1.80 8 200 ng/l milli-Q water 3313 40 222.83 8 3276 223.03 20 ng/l milli-Q water 321 40 19.13 8 284 19.33 2 ng/l milli-Q water 68 20 1.91 8 31 2.11 1 ng/l milli-Q water 55 40 1.02 8 18 1.23
milli-Q water 37 40 -0.20 8 Total ATP, 4o, 6/10/05
200 ng/l water prod. point 1441 20 100.91 8 1367 98.47 20 ng/l water prod. point 193884 30 13962.66 8 2E+05 13960.21 2 ng/l water prod. point 123 40 5.98 8 49 3.53 1 ng/l water prod. point 52 50 0.86 8 -22 -1.58
water prod. point 74 20 2.45 8 200 ng/l milli-Q water 3232 50 217.31 8 3196 217.58 20 ng/l milli-Q water 349 40 21.04 8 313 21.31 2 ng/l milli-Q water 70 20 2.04 8 34 2.31 1 ng/l milli-Q water 57 40 1.16 8 21 1.43
milli-Q water 36 30 -0.27 8 Total ATP, 24o, 5/10/05
200 ng/l water prod. point 1062 40 73.62 9 983 70.81 20 ng/l water prod. point 173 50 9.58 9 94 6.77 2 ng/l water prod. point 96 40 4.03 9 17 1.22 1 ng/l water prod. point 56 30 1.15 9 -23 -1.66
water prod. point 79 40 2.81 9 200 ng/l milli-Q water 3448 30 232.02 9 3401 231.54 20 ng/l milli-Q water 79 40 2.66 9 32 2.18 2 ng/l milli-Q water 70 40 2.04 9 23 1.57 1 ng/l milli-Q water 80 40 2.72 9 33 2.25
milli-Q water 47 40 0.48 9 Total ATP, 4o, 5/10/05
200 ng/l water prod. point 1304 50 91.05 9 1227 88.38 20 ng/l water prod. point 179 40 10.01 9 102 7.35 2 ng/l water prod. point 94 40 3.89 9 17 1.22 1 ng/l water prod. point 58 30 1.30 9 -19 -1.37
water prod. point 77 30 2.67 9 200 ng/l milli-Q water 3471 40 233.58 9 3433 233.72 20 ng/ lmilli-Q water 114 30 5.04 9 76 5.17 2 ng/l milli-Q water 50 30 0.68 9 12 0.82 1 ng/l milli-Q water 43 30 0.20 9 5 0.34
milli-Q water 38 30 -0.14 9
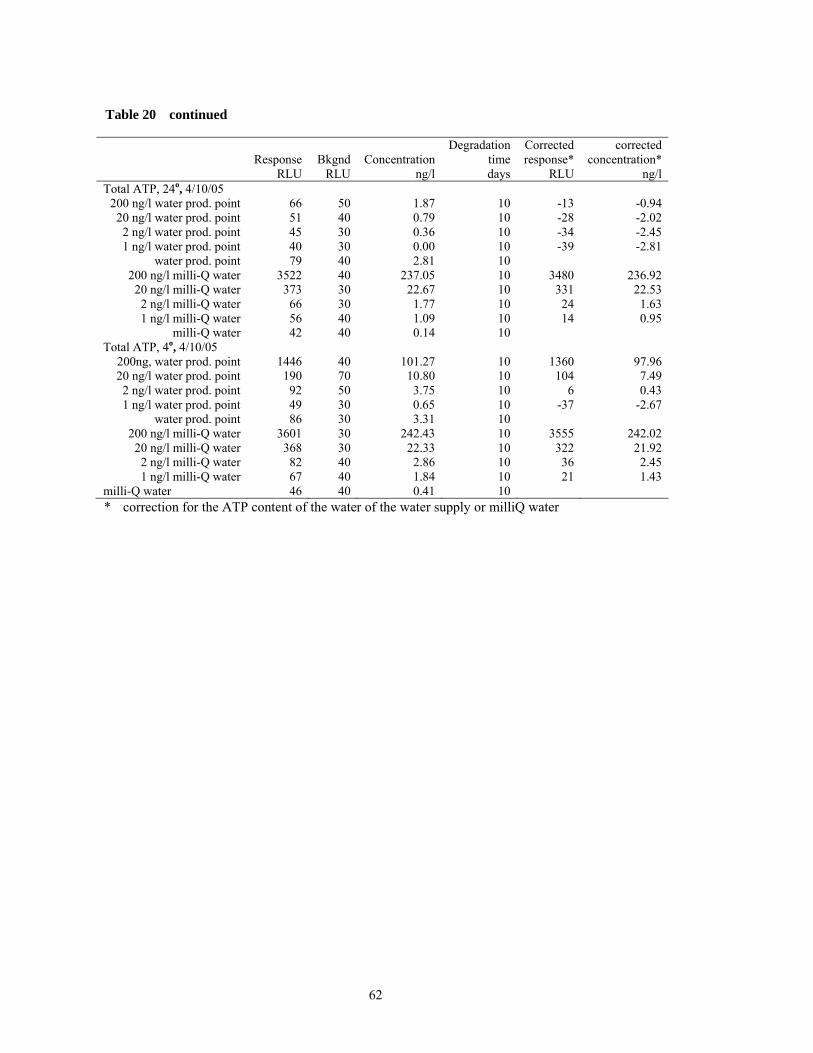
62
Table 20 continued
Response Bkgnd Concentration Degradation
time Corrected response*
corrected concentration*
RLU RLU ng/l days RLU ng/l Total ATP, 24o, 4/10/05
200 ng/l water prod. point 66 50 1.87 10 -13 -0.94 20 ng/l water prod. point 51 40 0.79 10 -28 -2.02 2 ng/l water prod. point 45 30 0.36 10 -34 -2.45 1 ng/l water prod. point 40 30 0.00 10 -39 -2.81
water prod. point 79 40 2.81 10 200 ng/l milli-Q water 3522 40 237.05 10 3480 236.92 20 ng/l milli-Q water 373 30 22.67 10 331 22.53 2 ng/l milli-Q water 66 30 1.77 10 24 1.63 1 ng/l milli-Q water 56 40 1.09 10 14 0.95
milli-Q water 42 40 0.14 10 Total ATP, 4o, 4/10/05
200ng, water prod. point 1446 40 101.27 10 1360 97.96 20 ng/l water prod. point 190 70 10.80 10 104 7.49 2 ng/l water prod. point 92 50 3.75 10 6 0.43 1 ng/l water prod. point 49 30 0.65 10 -37 -2.67
water prod. point 86 30 3.31 10 200 ng/l milli-Q water 3601 30 242.43 10 3555 242.02 20 ng/l milli-Q water 368 30 22.33 10 322 21.92 2 ng/l milli-Q water 82 40 2.86 10 36 2.45 1 ng/l milli-Q water 67 40 1.84 10 21 1.43
milli-Q water 46 40 0.41 10 * correction for the ATP content of the water of the water supply or milliQ water
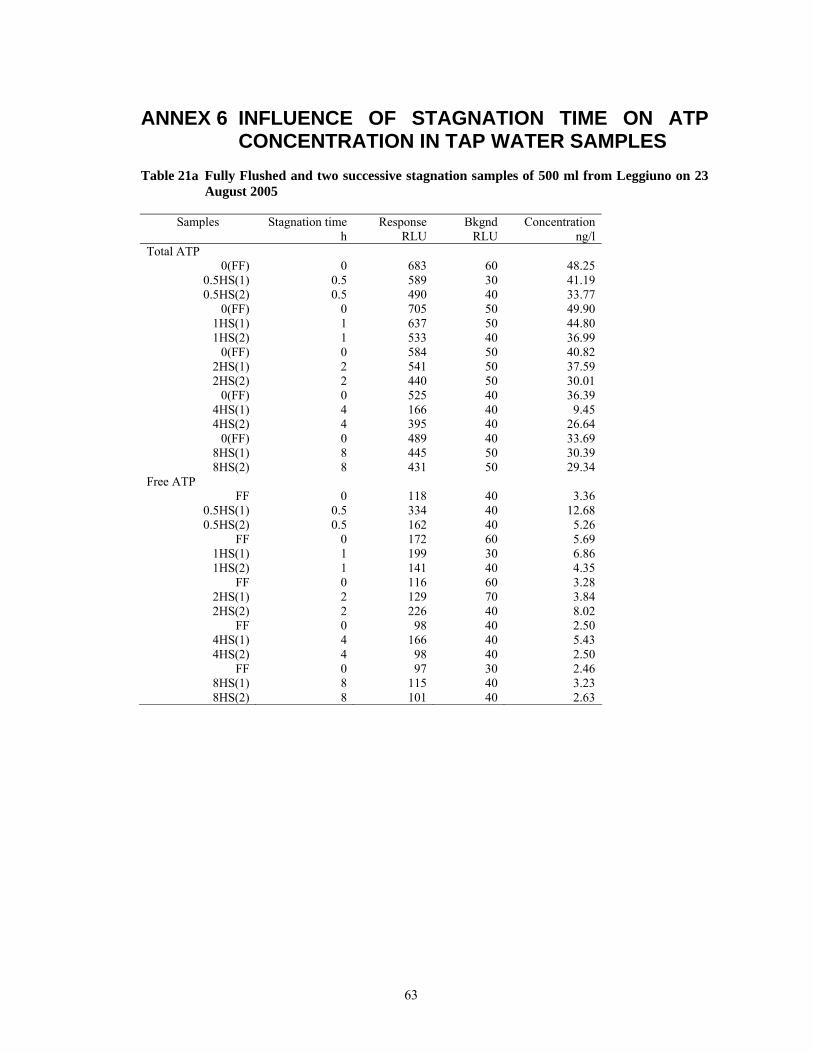
63
ANNEX 6 INFLUENCE OF STAGNATION TIME ON ATP CONCENTRATION IN TAP WATER SAMPLES
Table 21a Fully Flushed and two successive stagnation samples of 500 ml from Leggiuno on 23 August 2005
Samples Stagnation time Response Bkgnd Concentration h RLU RLU ng/l
Total ATP 0(FF) 0 683 60 48.25
0.5HS(1) 0.5 589 30 41.19 0.5HS(2) 0.5 490 40 33.77
0(FF) 0 705 50 49.90 1HS(1) 1 637 50 44.80 1HS(2) 1 533 40 36.99
0(FF) 0 584 50 40.82 2HS(1) 2 541 50 37.59 2HS(2) 2 440 50 30.01
0(FF) 0 525 40 36.39 4HS(1) 4 166 40 9.45 4HS(2) 4 395 40 26.64
0(FF) 0 489 40 33.69 8HS(1) 8 445 50 30.39 8HS(2) 8 431 50 29.34
Free ATP FF 0 118 40 3.36
0.5HS(1) 0.5 334 40 12.68 0.5HS(2) 0.5 162 40 5.26
FF 0 172 60 5.69 1HS(1) 1 199 30 6.86 1HS(2) 1 141 40 4.35
FF 0 116 60 3.28 2HS(1) 2 129 70 3.84 2HS(2) 2 226 40 8.02
FF 0 98 40 2.50 4HS(1) 4 166 40 5.43 4HS(2) 4 98 40 2.50
FF 0 97 30 2.46 8HS(1) 8 115 40 3.23 8HS(2) 8 101 40 2.63
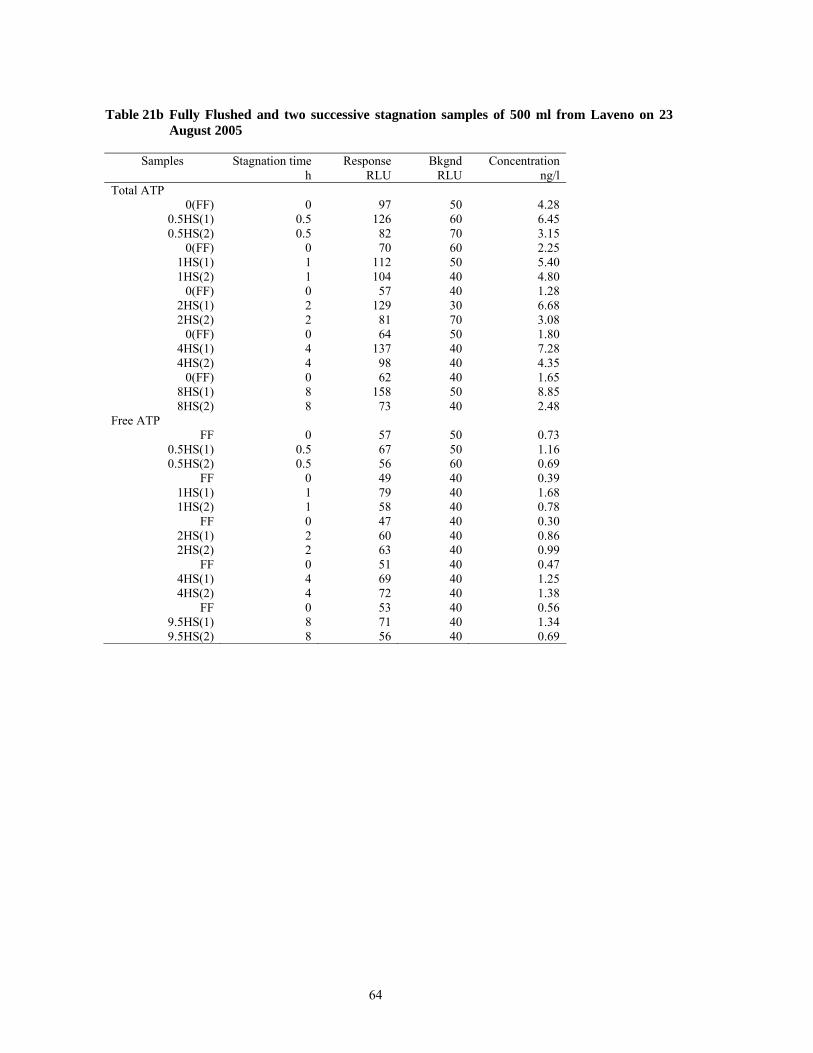
64
Table 21b Fully Flushed and two successive stagnation samples of 500 ml from Laveno on 23 August 2005
Samples Stagnation time Response Bkgnd Concentration h RLU RLU ng/l
Total ATP 0(FF) 0 97 50 4.28
0.5HS(1) 0.5 126 60 6.45 0.5HS(2) 0.5 82 70 3.15
0(FF) 0 70 60 2.25 1HS(1) 1 112 50 5.40 1HS(2) 1 104 40 4.80
0(FF) 0 57 40 1.28 2HS(1) 2 129 30 6.68 2HS(2) 2 81 70 3.08
0(FF) 0 64 50 1.80 4HS(1) 4 137 40 7.28 4HS(2) 4 98 40 4.35
0(FF) 0 62 40 1.65 8HS(1) 8 158 50 8.85 8HS(2) 8 73 40 2.48
Free ATP FF 0 57 50 0.73
0.5HS(1) 0.5 67 50 1.16 0.5HS(2) 0.5 56 60 0.69
FF 0 49 40 0.39 1HS(1) 1 79 40 1.68 1HS(2) 1 58 40 0.78
FF 0 47 40 0.30 2HS(1) 2 60 40 0.86 2HS(2) 2 63 40 0.99
FF 0 51 40 0.47 4HS(1) 4 69 40 1.25 4HS(2) 4 72 40 1.38
FF 0 53 40 0.56 9.5HS(1) 8 71 40 1.34 9.5HS(2) 8 56 40 0.69
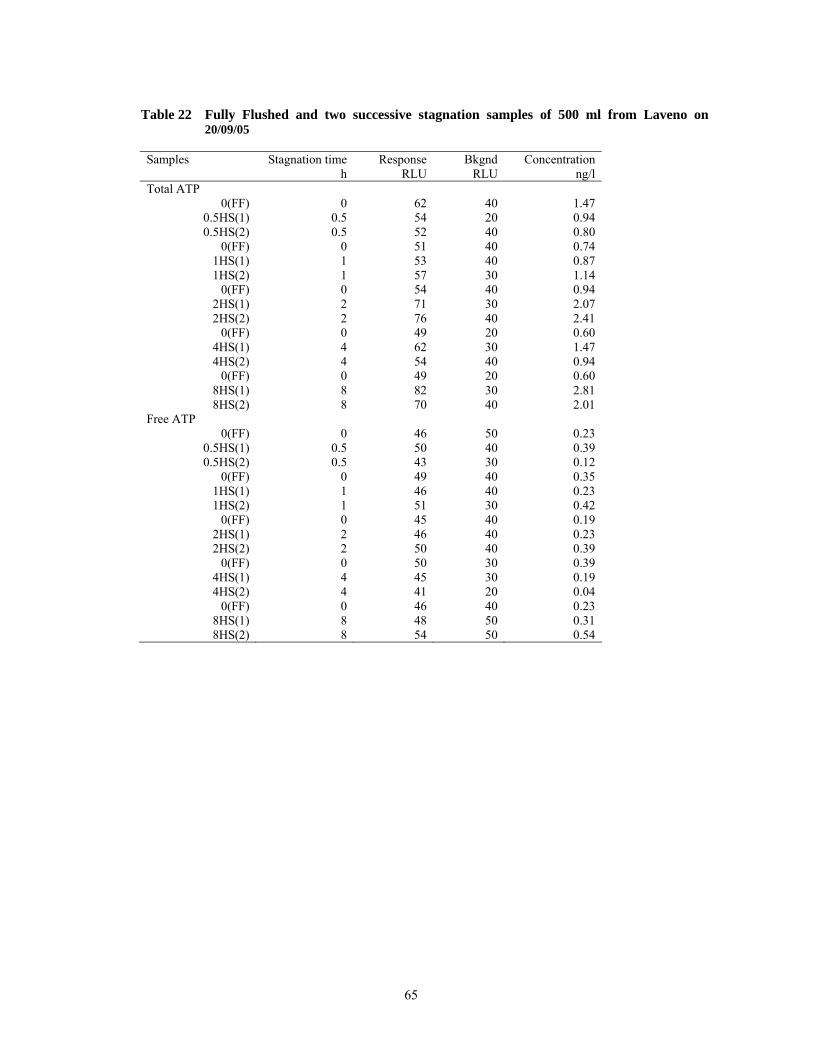
65
Table 22 Fully Flushed and two successive stagnation samples of 500 ml from Laveno on 20/09/05
Samples Stagnation time Response Bkgnd Concentration h RLU RLU ng/l Total ATP
0(FF) 0 62 40 1.47 0.5HS(1) 0.5 54 20 0.94 0.5HS(2) 0.5 52 40 0.80
0(FF) 0 51 40 0.74 1HS(1) 1 53 40 0.87 1HS(2) 1 57 30 1.14
0(FF) 0 54 40 0.94 2HS(1) 2 71 30 2.07 2HS(2) 2 76 40 2.41
0(FF) 0 49 20 0.60 4HS(1) 4 62 30 1.47 4HS(2) 4 54 40 0.94
0(FF) 0 49 20 0.60 8HS(1) 8 82 30 2.81 8HS(2) 8 70 40 2.01
Free ATP 0(FF) 0 46 50 0.23
0.5HS(1) 0.5 50 40 0.39 0.5HS(2) 0.5 43 30 0.12
0(FF) 0 49 40 0.35 1HS(1) 1 46 40 0.23 1HS(2) 1 51 30 0.42
0(FF) 0 45 40 0.19 2HS(1) 2 46 40 0.23 2HS(2) 2 50 40 0.39
0(FF) 0 50 30 0.39 4HS(1) 4 45 30 0.19 4HS(2) 4 41 20 0.04
0(FF) 0 46 40 0.23 8HS(1) 8 48 50 0.31 8HS(2) 8 54 50 0.54
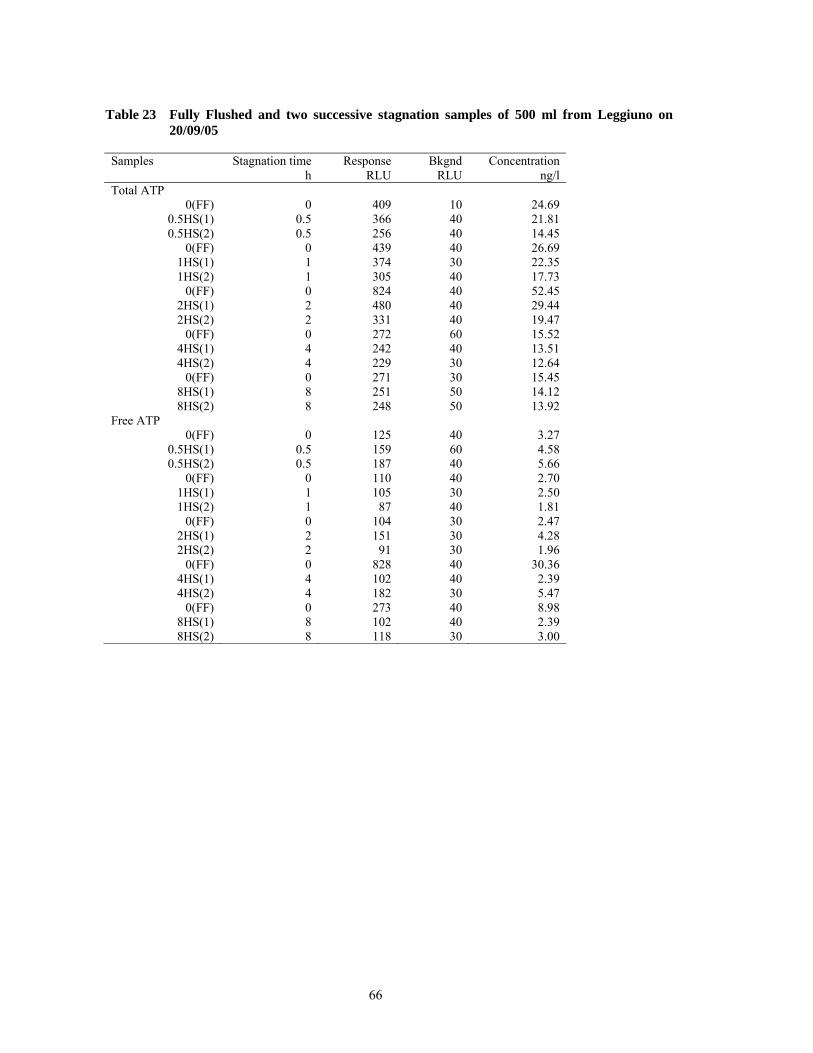
66
Table 23 Fully Flushed and two successive stagnation samples of 500 ml from Leggiuno on 20/09/05
Samples Stagnation time Response Bkgnd Concentration h RLU RLU ng/l Total ATP
0(FF) 0 409 10 24.69 0.5HS(1) 0.5 366 40 21.81 0.5HS(2) 0.5 256 40 14.45
0(FF) 0 439 40 26.69 1HS(1) 1 374 30 22.35 1HS(2) 1 305 40 17.73
0(FF) 0 824 40 52.45 2HS(1) 2 480 40 29.44 2HS(2) 2 331 40 19.47
0(FF) 0 272 60 15.52 4HS(1) 4 242 40 13.51 4HS(2) 4 229 30 12.64
0(FF) 0 271 30 15.45 8HS(1) 8 251 50 14.12 8HS(2) 8 248 50 13.92
Free ATP 0(FF) 0 125 40 3.27
0.5HS(1) 0.5 159 60 4.58 0.5HS(2) 0.5 187 40 5.66
0(FF) 0 110 40 2.70 1HS(1) 1 105 30 2.50 1HS(2) 1 87 40 1.81
0(FF) 0 104 30 2.47 2HS(1) 2 151 30 4.28 2HS(2) 2 91 30 1.96
0(FF) 0 828 40 30.36 4HS(1) 4 102 40 2.39 4HS(2) 4 182 30 5.47
0(FF) 0 273 40 8.98 8HS(1) 8 102 40 2.39 8HS(2) 8 118 30 3.00
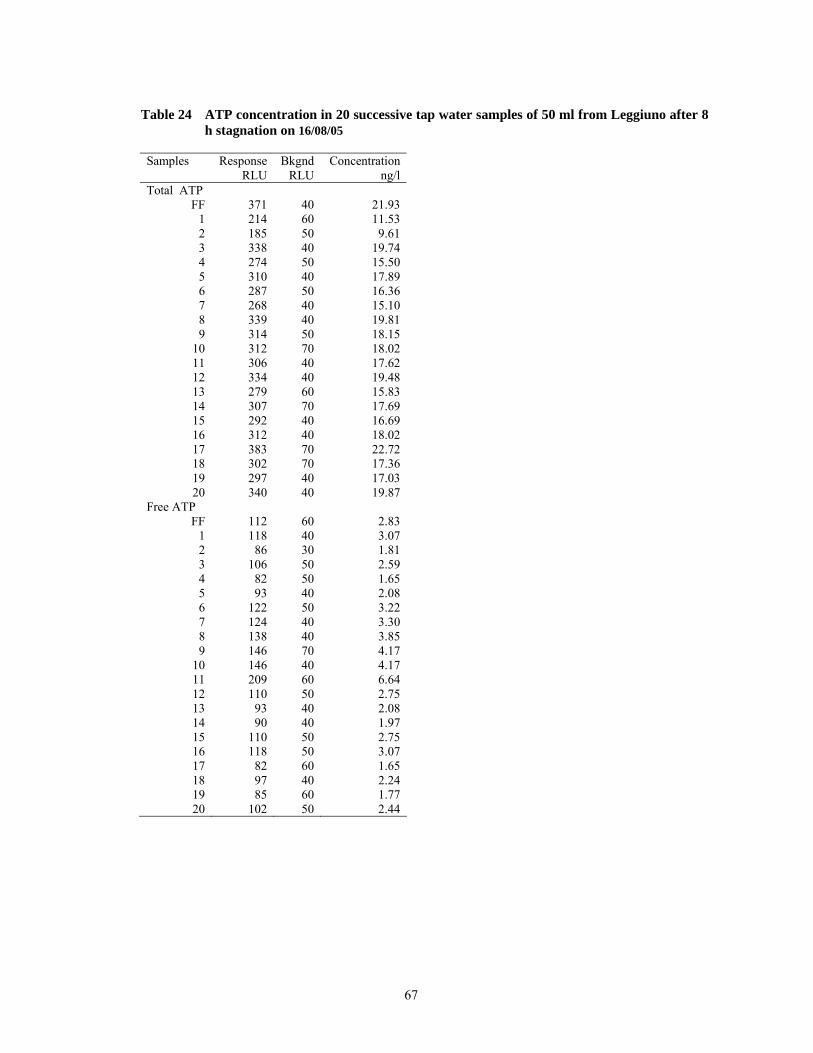
67
Table 24 ATP concentration in 20 successive tap water samples of 50 ml from Leggiuno after 8 h stagnation on 16/08/05
Samples Response Bkgnd Concentration RLU RLU ng/l Total ATP
FF 371 40 21.93 1 214 60 11.53 2 185 50 9.61 3 338 40 19.74 4 274 50 15.50 5 310 40 17.89 6 287 50 16.36 7 268 40 15.10 8 339 40 19.81 9 314 50 18.15
10 312 70 18.02 11 306 40 17.62 12 334 40 19.48 13 279 60 15.83 14 307 70 17.69 15 292 40 16.69 16 312 40 18.02 17 383 70 22.72 18 302 70 17.36 19 297 40 17.03 20 340 40 19.87
Free ATP FF 112 60 2.83
1 118 40 3.07 2 86 30 1.81 3 106 50 2.59 4 82 50 1.65 5 93 40 2.08 6 122 50 3.22 7 124 40 3.30 8 138 40 3.85 9 146 70 4.17
10 146 40 4.17 11 209 60 6.64 12 110 50 2.75 13 93 40 2.08 14 90 40 1.97 15 110 50 2.75 16 118 50 3.07 17 82 60 1.65 18 97 40 2.24 19 85 60 1.77 20 102 50 2.44
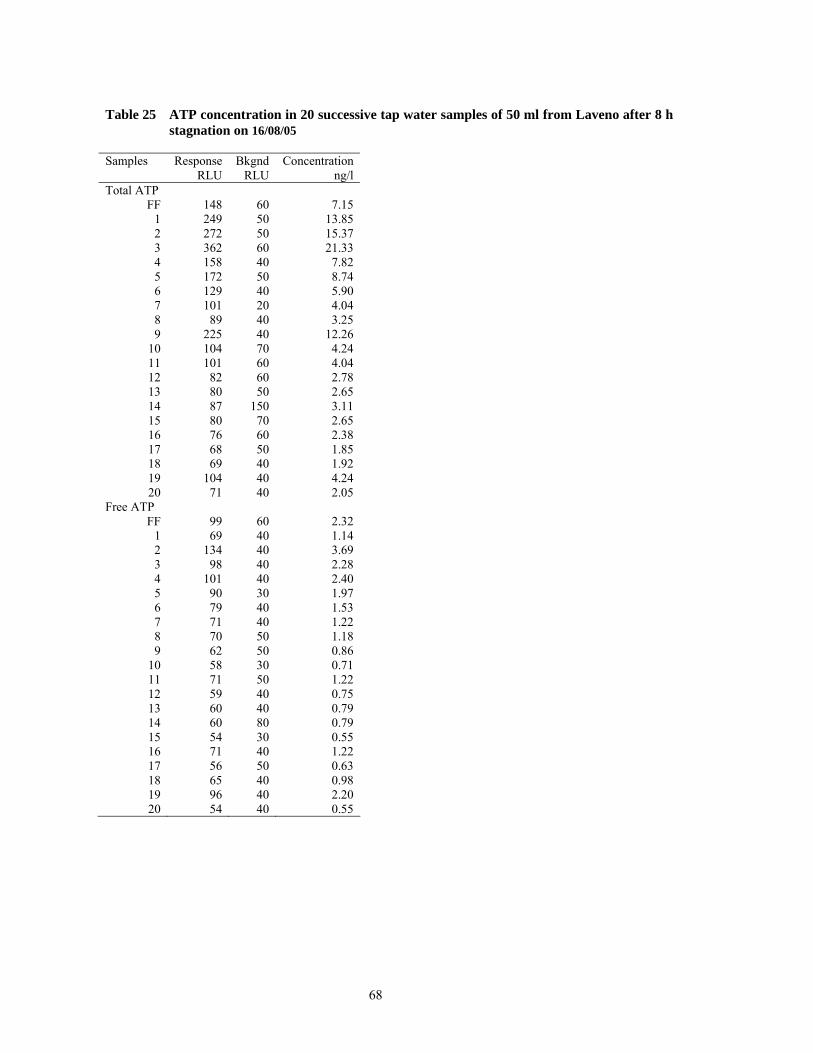
68
Table 25 ATP concentration in 20 successive tap water samples of 50 ml from Laveno after 8 h stagnation on 16/08/05
Samples Response Bkgnd Concentration RLU RLU ng/l Total ATP
FF 148 60 7.15 1 249 50 13.85 2 272 50 15.37 3 362 60 21.33 4 158 40 7.82 5 172 50 8.74 6 129 40 5.90 7 101 20 4.04 8 89 40 3.25 9 225 40 12.26
10 104 70 4.24 11 101 60 4.04 12 82 60 2.78 13 80 50 2.65 14 87 150 3.11 15 80 70 2.65 16 76 60 2.38 17 68 50 1.85 18 69 40 1.92 19 104 40 4.24 20 71 40 2.05
Free ATP FF 99 60 2.32
1 69 40 1.14 2 134 40 3.69 3 98 40 2.28 4 101 40 2.40 5 90 30 1.97 6 79 40 1.53 7 71 40 1.22 8 70 50 1.18 9 62 50 0.86
10 58 30 0.71 11 71 50 1.22 12 59 40 0.75 13 60 40 0.79 14 60 80 0.79 15 54 30 0.55 16 71 40 1.22 17 56 50 0.63 18 65 40 0.98 19 96 40 2.20 20 54 40 0.55
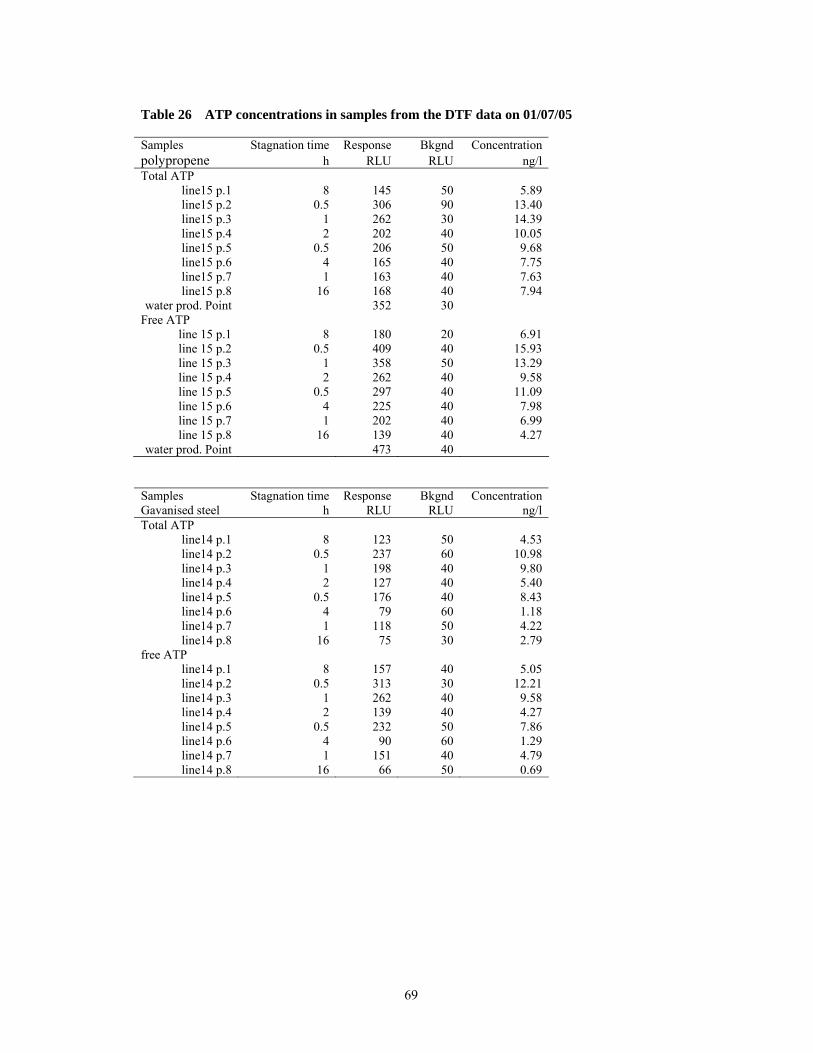
69
Table 26 ATP concentrations in samples from the DTF data on 01/07/05
Samples Stagnation time Response Bkgnd Concentration polypropene h RLU RLU ng/l Total ATP
line15 p.1 8 145 50 5.89 line15 p.2 0.5 306 90 13.40 line15 p.3 1 262 30 14.39 line15 p.4 2 202 40 10.05 line15 p.5 0.5 206 50 9.68 line15 p.6 4 165 40 7.75 line15 p.7 1 163 40 7.63 line15 p.8 16 168 40 7.94
water prod. Point 352 30 Free ATP
line 15 p.1 8 180 20 6.91 line 15 p.2 0.5 409 40 15.93 line 15 p.3 1 358 50 13.29 line 15 p.4 2 262 40 9.58 line 15 p.5 0.5 297 40 11.09 line 15 p.6 4 225 40 7.98 line 15 p.7 1 202 40 6.99 line 15 p.8 16 139 40 4.27
water prod. Point 473 40
Samples Stagnation time Response Bkgnd Concentration Gavanised steel h RLU RLU ng/l Total ATP
line14 p.1 8 123 50 4.53 line14 p.2 0.5 237 60 10.98 line14 p.3 1 198 40 9.80 line14 p.4 2 127 40 5.40 line14 p.5 0.5 176 40 8.43 line14 p.6 4 79 60 1.18 line14 p.7 1 118 50 4.22 line14 p.8 16 75 30 2.79
free ATP line14 p.1 8 157 40 5.05 line14 p.2 0.5 313 30 12.21 line14 p.3 1 262 40 9.58 line14 p.4 2 139 40 4.27 line14 p.5 0.5 232 50 7.86 line14 p.6 4 90 60 1.29 line14 p.7 1 151 40 4.79 line14 p.8 16 66 50 0.69
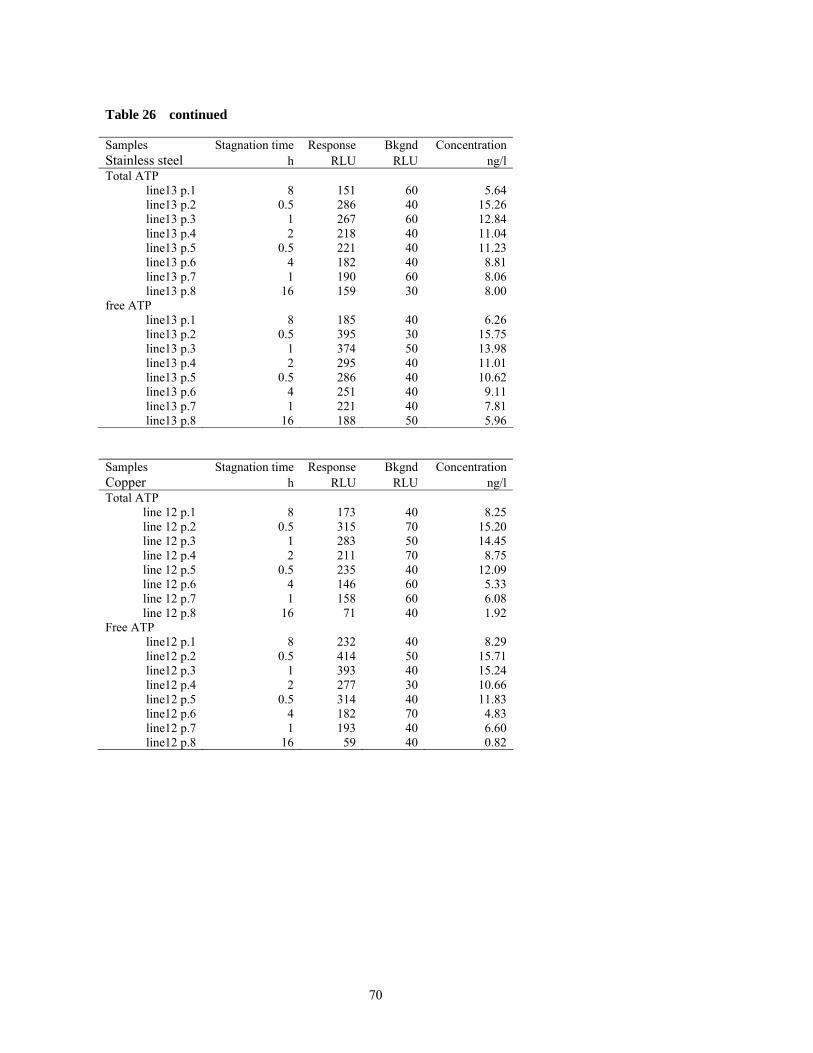
70
Table 26 continued
Samples Stagnation time Response Bkgnd Concentration Stainless steel h RLU RLU ng/l Total ATP
line13 p.1 8 151 60 5.64 line13 p.2 0.5 286 40 15.26 line13 p.3 1 267 60 12.84 line13 p.4 2 218 40 11.04 line13 p.5 0.5 221 40 11.23 line13 p.6 4 182 40 8.81 line13 p.7 1 190 60 8.06 line13 p.8 16 159 30 8.00
free ATP line13 p.1 8 185 40 6.26 line13 p.2 0.5 395 30 15.75 line13 p.3 1 374 50 13.98 line13 p.4 2 295 40 11.01 line13 p.5 0.5 286 40 10.62 line13 p.6 4 251 40 9.11 line13 p.7 1 221 40 7.81 line13 p.8 16 188 50 5.96
Samples Stagnation time Response Bkgnd Concentration Copper h RLU RLU ng/l Total ATP
line 12 p.1 8 173 40 8.25 line 12 p.2 0.5 315 70 15.20 line 12 p.3 1 283 50 14.45 line 12 p.4 2 211 70 8.75 line 12 p.5 0.5 235 40 12.09 line 12 p.6 4 146 60 5.33 line 12 p.7 1 158 60 6.08 line 12 p.8 16 71 40 1.92
Free ATP line12 p.1 8 232 40 8.29 line12 p.2 0.5 414 50 15.71 line12 p.3 1 393 40 15.24 line12 p.4 2 277 30 10.66 line12 p.5 0.5 314 40 11.83 line12 p.6 4 182 70 4.83 line12 p.7 1 193 40 6.60 line12 p.8 16 59 40 0.82
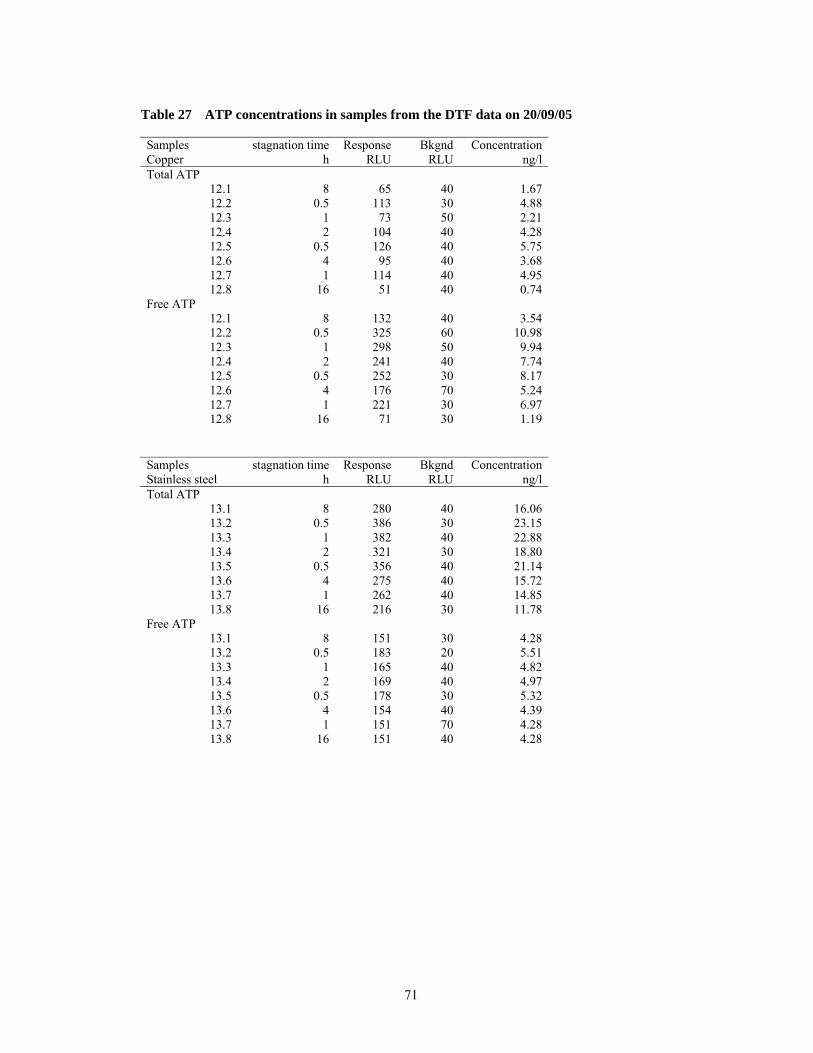
71
Table 27 ATP concentrations in samples from the DTF data on 20/09/05
Samples stagnation time Response Bkgnd Concentration Copper h RLU RLU ng/l Total ATP
12.1 8 65 40 1.67 12.2 0.5 113 30 4.88 12.3 1 73 50 2.21 12.4 2 104 40 4.28 12.5 0.5 126 40 5.75 12.6 4 95 40 3.68 12.7 1 114 40 4.95 12.8 16 51 40 0.74
Free ATP 12.1 8 132 40 3.54 12.2 0.5 325 60 10.98 12.3 1 298 50 9.94 12.4 2 241 40 7.74 12.5 0.5 252 30 8.17 12.6 4 176 70 5.24 12.7 1 221 30 6.97 12.8 16 71 30 1.19
Samples stagnation time Response Bkgnd Concentration Stainless steel h RLU RLU ng/l Total ATP
13.1 8 280 40 16.06 13.2 0.5 386 30 23.15 13.3 1 382 40 22.88 13.4 2 321 30 18.80 13.5 0.5 356 40 21.14 13.6 4 275 40 15.72 13.7 1 262 40 14.85 13.8 16 216 30 11.78
Free ATP 13.1 8 151 30 4.28 13.2 0.5 183 20 5.51 13.3 1 165 40 4.82 13.4 2 169 40 4.97 13.5 0.5 178 30 5.32 13.6 4 154 40 4.39 13.7 1 151 70 4.28 13.8 16 151 40 4.28
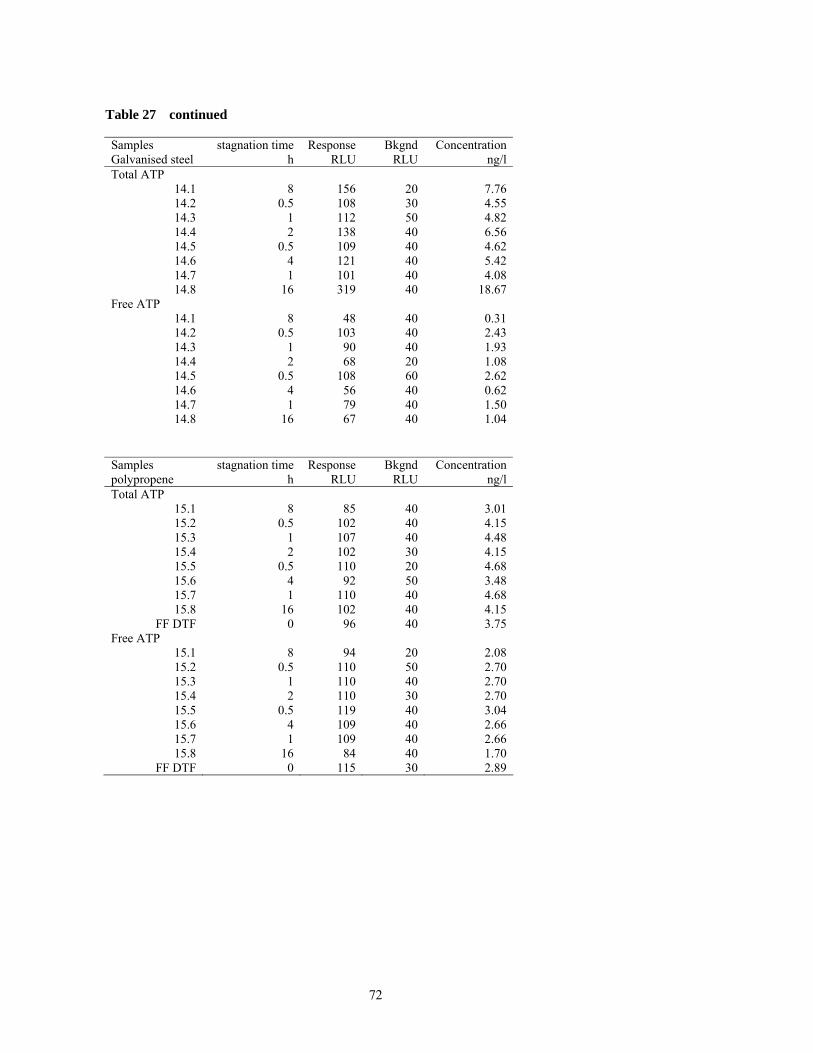
72
Table 27 continued
Samples stagnation time Response Bkgnd Concentration Galvanised steel h RLU RLU ng/l Total ATP
14.1 8 156 20 7.76 14.2 0.5 108 30 4.55 14.3 1 112 50 4.82 14.4 2 138 40 6.56 14.5 0.5 109 40 4.62 14.6 4 121 40 5.42 14.7 1 101 40 4.08 14.8 16 319 40 18.67
Free ATP 14.1 8 48 40 0.31 14.2 0.5 103 40 2.43 14.3 1 90 40 1.93 14.4 2 68 20 1.08 14.5 0.5 108 60 2.62 14.6 4 56 40 0.62 14.7 1 79 40 1.50 14.8 16 67 40 1.04
Samples stagnation time Response Bkgnd Concentration polypropene h RLU RLU ng/l Total ATP
15.1 8 85 40 3.01 15.2 0.5 102 40 4.15 15.3 1 107 40 4.48 15.4 2 102 30 4.15 15.5 0.5 110 20 4.68 15.6 4 92 50 3.48 15.7 1 110 40 4.68 15.8 16 102 40 4.15
FF DTF 0 96 40 3.75 Free ATP
15.1 8 94 20 2.08 15.2 0.5 110 50 2.70 15.3 1 110 40 2.70 15.4 2 110 30 2.70 15.5 0.5 119 40 3.04 15.6 4 109 40 2.66 15.7 1 109 40 2.66 15.8 16 84 40 1.70
FF DTF 0 115 30 2.89
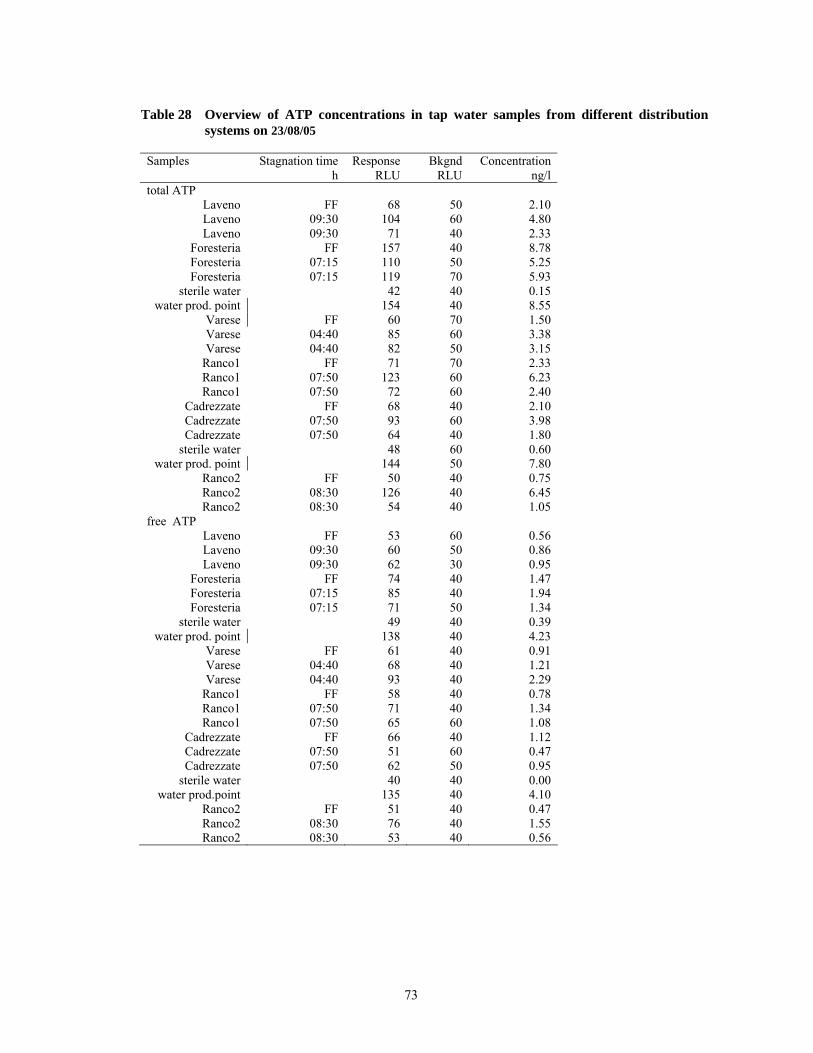
73
Table 28 Overview of ATP concentrations in tap water samples from different distribution systems on 23/08/05
Samples Stagnation time Response Bkgnd Concentration h RLU RLU ng/l total ATP
Laveno FF 68 50 2.10 Laveno 09:30 104 60 4.80 Laveno 09:30 71 40 2.33
Foresteria FF 157 40 8.78 Foresteria 07:15 110 50 5.25 Foresteria 07:15 119 70 5.93
sterile water 42 40 0.15 water prod. point 154 40 8.55
Varese FF 60 70 1.50 Varese 04:40 85 60 3.38 Varese 04:40 82 50 3.15
Ranco1 FF 71 70 2.33 Ranco1 07:50 123 60 6.23 Ranco1 07:50 72 60 2.40
Cadrezzate FF 68 40 2.10 Cadrezzate 07:50 93 60 3.98 Cadrezzate 07:50 64 40 1.80
sterile water 48 60 0.60 water prod. point 144 50 7.80
Ranco2 FF 50 40 0.75 Ranco2 08:30 126 40 6.45 Ranco2 08:30 54 40 1.05
free ATP Laveno FF 53 60 0.56 Laveno 09:30 60 50 0.86 Laveno 09:30 62 30 0.95
Foresteria FF 74 40 1.47 Foresteria 07:15 85 40 1.94 Foresteria 07:15 71 50 1.34
sterile water 49 40 0.39 water prod. point 138 40 4.23
Varese FF 61 40 0.91 Varese 04:40 68 40 1.21 Varese 04:40 93 40 2.29
Ranco1 FF 58 40 0.78 Ranco1 07:50 71 40 1.34 Ranco1 07:50 65 60 1.08
Cadrezzate FF 66 40 1.12 Cadrezzate 07:50 51 60 0.47 Cadrezzate 07:50 62 50 0.95
sterile water 40 40 0.00 water prod.point 135 40 4.10
Ranco2 FF 51 40 0.47 Ranco2 08:30 76 40 1.55 Ranco2 08:30 53 40 0.56
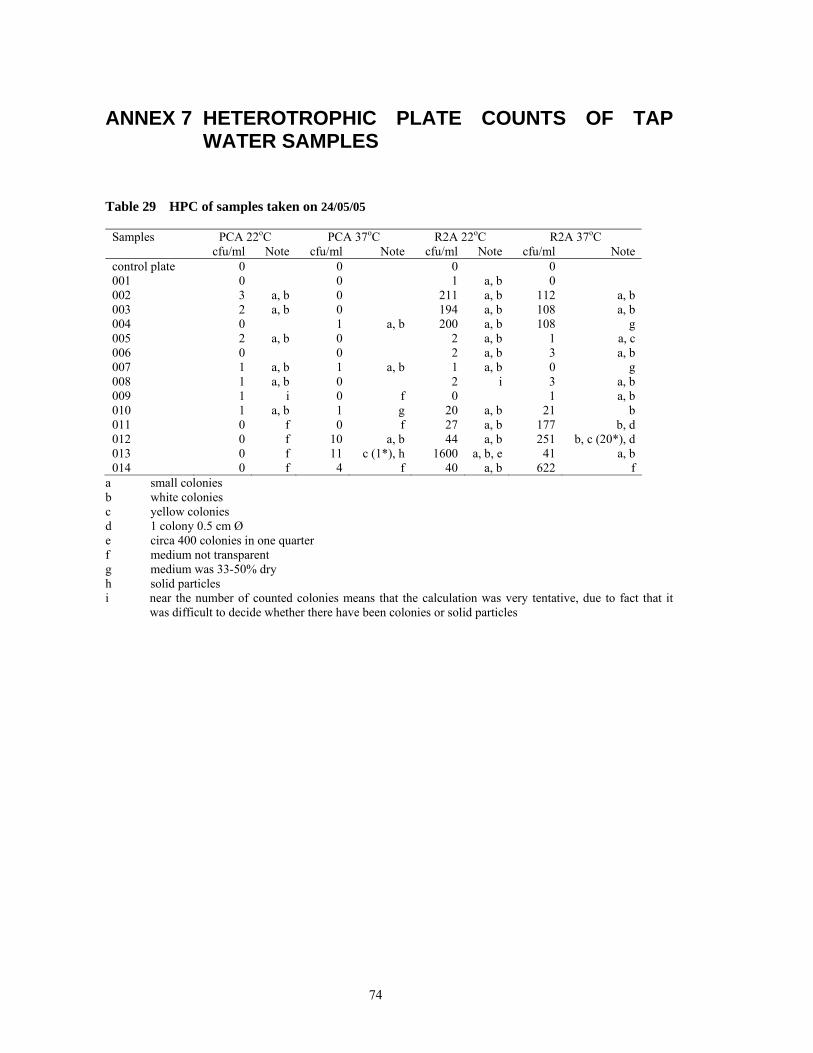
74
ANNEX 7 HETEROTROPHIC PLATE COUNTS OF TAP WATER SAMPLES
Table 29 HPC of samples taken on 24/05/05
Samples PCA 22oC PCA 37oC R2A 22oC R2A 37oC cfu/ml Note cfu/ml Note cfu/ml Note cfu/ml Note control plate 0 0 0 0 001 0 0 1 a, b 0 002 3 a, b 0 211 a, b 112 a, b 003 2 a, b 0 194 a, b 108 a, b 004 0 1 a, b 200 a, b 108 g 005 2 a, b 0 2 a, b 1 a, c 006 0 0 2 a, b 3 a, b 007 1 a, b 1 a, b 1 a, b 0 g 008 1 a, b 0 2 i 3 a, b 009 1 i 0 f 0 1 a, b 010 1 a, b 1 g 20 a, b 21 b 011 0 f 0 f 27 a, b 177 b, d 012 0 f 10 a, b 44 a, b 251 b, c (20*), d 013 0 f 11 c (1*), h 1600 a, b, e 41 a, b 014 0 f 4 f 40 a, b 622 f
a small colonies b white colonies c yellow colonies d 1 colony 0.5 cm Ø e circa 400 colonies in one quarter f medium not transparent g medium was 33-50% dry h solid particles i near the number of counted colonies means that the calculation was very tentative, due to fact that it
was difficult to decide whether there have been colonies or solid particles
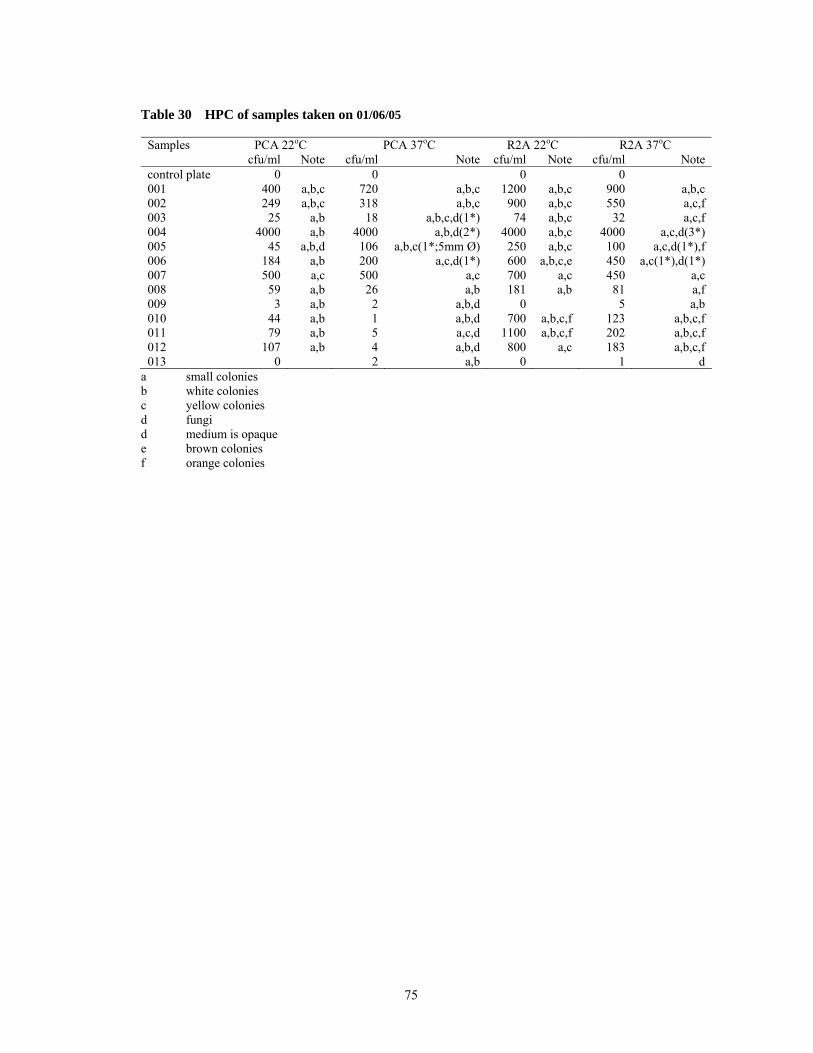
75
Table 30 HPC of samples taken on 01/06/05
Samples PCA 22oC PCA 37oC R2A 22oC R2A 37oC cfu/ml Note cfu/ml Note cfu/ml Note cfu/ml Note control plate 0 0 0 0 001 400 a,b,c 720 a,b,c 1200 a,b,c 900 a,b,c 002 249 a,b,c 318 a,b,c 900 a,b,c 550 a,c,f 003 25 a,b 18 a,b,c,d(1*) 74 a,b,c 32 a,c,f 004 4000 a,b 4000 a,b,d(2*) 4000 a,b,c 4000 a,c,d(3*) 005 45 a,b,d 106 a,b,c(1*;5mm Ø) 250 a,b,c 100 a,c,d(1*),f 006 184 a,b 200 a,c,d(1*) 600 a,b,c,e 450 a,c(1*),d(1*) 007 500 a,c 500 a,c 700 a,c 450 a,c 008 59 a,b 26 a,b 181 a,b 81 a,f 009 3 a,b 2 a,b,d 0 5 a,b 010 44 a,b 1 a,b,d 700 a,b,c,f 123 a,b,c,f 011 79 a,b 5 a,c,d 1100 a,b,c,f 202 a,b,c,f 012 107 a,b 4 a,b,d 800 a,c 183 a,b,c,f 013 0 2 a,b 0 1 d
a small colonies b white colonies c yellow colonies d fungi d medium is opaque e brown colonies f orange colonies
76
Mission of the JRC
The mission of the JRC is to provide customer-driven scientific and technical support for the conception, development, implementation and monitoring of EU policies. As a service of the European Commission, the JRC functions as a reference centre of science and technology for the Union. Close to the policy-making process, it serves the common interest of the Member States, while being independent of special interests, whether private or national.


![[XLS]JRC MD Core Editor - Datasetcidportal.jrc.ec.europa.eu/ftp/jrc-opendata/JRCOD/REM/jrc-md-core... · Web view ... In such cases, ... Generated with: JRC MD Core Editor - Dataset](https://img.pdfslide.us/doc/110x75/5b378c757f8b9a5a178c6cf5/xlsjrc-md-core-editor-web-view-in-such-cases-generated-with-jrc.jpg)