Embed Size (px)
Citation preview
1
Please note that this is an author-produced PDF of an article accepted for publication following peer review. The definitive publisher-authenticated version is available on the publisher Web site.
Science May 2015, Volume 348 Issue 6237 Pages 1-12 http://dx.doi.org/10.1126/science.1261605 http://archimer.ifremer.fr/doc/00270/38135/ © 2015 American Association for the Advancement of Science. All Rights Reserved.
Achimer http://archimer.ifremer.fr
Eukaryotic plankton diversity in the sunlit ocean
De Vargas Colomban 1, 2, *
, Audic Stephane 1, 2
, Henry Nicolas 1, 2
, Decelle Johan 1, 2
, Mahe Frederic 1, 2,
3, Logares Ramiro
4, Lara Enrique
5, Berney Cedric
1, 2, Le Bescot Noan
1, 2, Probert Ian
6, 7,
Carmichael Margaux 1, 2, 8, 9, 10
, Poulain Julie 11
, Romac Sarah 1, 2
, Colin Sebastien 1, 2, 8, 9, 10
, Aury Jean-Marc
11, Bittner Lucie
1, 2, 8, 9, 10, 12, 13, Chaffron Samuel
14, 15, 16, Dunthorn Micah
3,
Engelen Stefan 11
, Flegontova Olga 17, 18
, Guidi Lionel 19, 20
, Horak Ales 17, 18
, Jaillon Olivier 11, 21, 22
, Lima-Mendez Gipsi
14, 15, 16, Lukes Julius
17, 18, 23, Malviya Shruti
8, 9, 10, Morard Raphael
1, 2, 24,
Mulot Matthieu 5, Scalco Eleonora
25, Siano Raffaele
26, Vincent Flora
8, 9, 10, 15, Zingone Adriana
25,
Dimier Celine 1, 2, 8, 9, 10
, Picheral Marc 19, 20
, Searson Sarah 19, 20
, Kandels-Lewis Stefanie 27, 28
, Acinas Silvia G.
4, Bork Peer
27, 29, Bowler Chris
8, 9, 10, Gorsky Gabriel
19, 20, Grimsley Nigel
30, 31,
Hingamp Pascal 32
, Iudicone Daniele 25
, Not Fabrice 1, 2
, Ogata Hiroyuki 33
, Pesant Stephane 34
, Raes Jeroen
14, 15, 16, Sieracki Michael E.
35, 36, Speich Sabrina
37, 38, Stemmann Lars
19, 20,
Sunagawa Shinichi 27
, Weissenbach Jean 11, 21, 22
, Wincker Patrick 11, 21, 22
, Karsenti Eric 8, 9, 10, 28
1 CNRS, UMR 7144, Stn Biol Roscoff, F-29680 Roscoff, France.
2 Univ Paris 06, Univ Paris 04, UMR 7144, Stn Biol Roscoff, F-29680 Roscoff, France.
3 Univ Kaiserslautern, Dept Ecol, D-67663 Kaiserslautern, Germany.
4 CSIC, Inst Marine Sci ICM, Dept Marine Biol & Oceanog, E-08003 Barcelona, Spain.
5 Univ Neuchatel, Lab Soil Biol, CH-2000 Neuchatel, Switzerland.
6 CNRS, FR2424, Roscoff Culture Collect, Stn Biol Roscoff, F-29680 Roscoff, France.
7 Univ Paris 06, Univ Paris 04, FR 2424, Roscoff Culture Collect,Stn Biol Roscoff, F-29680 Roscoff,
France. 8 Ecole Normale Super, IBENS, F-75005 Paris, France.
9 INSERM, U1024, F-75005 Paris, France.
10 CNRS, UMR 8197, F-75005 Paris, France.
11 Commissariat Energie Atom & Energies Alternat CEA, Inst Genom, GENOSCOPE, F-91000 Evry,
France. 12
CNRS, FR3631, Inst Biol Paris Seine, F-75005 Paris, France. 13
Univ Paris 06, Univ Paris 04, Inst Biol Paris Seine, F-75005 Paris, France. 14
Katholieke Univ Leuven, Rega Inst, Dept Microbiol & Immunol, B-3000 Leuven, Belgium. 15
VIB, Ctr Biol Dis, B-3000 Leuven, Belgium. 16
Vrije Univ Brussel, Dept Appl Biol Sci, B-1050 Brussels, Belgium. 17
Acad Sci Czech Republic, Ctr Biol, Inst Parasitol, Ceske Budejovice 37005, Czech Republic. 18
Univ South Bohemia, Fac Sci, Ceske Budejovice 37005, Czech Republic. 19
CNRS, UMR 7093, LOV, Observ Oceanol, F-06230 Villefranche Sur Mer, France. 20
Univ Paris 06, Univ Paris 04, UMR 7093, LOV,Observ Oceanol, F-06230 Villefranche Sur Mer, France. 21
CNRS, UMR 8030, CP5706, Evry, France. 22
Univ Evry, UMR 8030, CP5706, Evry, France. 23
Canadian Inst Adv Res, Toronto, ON M5G 1Z8, Canada. 24
Univ Bremen, Ctr Marine Environm Sci, MARUM, D-28359 Bremen, Germany. 25
Stn Zool A Dohrn, I-80121 Naples, Italy. 26
IFREMER, Ctr Brest, DYNECO Pelagos CS 10070, F-29280 Plouzane, France. 27
European Mol Biol Lab, Struct & Computat Biol, D-69117 Heidelberg, Germany.
2
Please note that this is an author-produced PDF of an article accepted for publication following peer review. The definitive publisher-authenticated version is available on the publisher Web site.
28 European Mol Biol Lab, Directors Res, D-69117 Heidelberg, Germany.
29 Max Delbruck Ctr Mol Med, D-13092 Berlin, Germany.
30 CNRS, UMR 7232, BIOM, F-66650 Banyuls Sur Mer, France.
31 Univ Paris 06, Univ Paris 04, OOB, F-66650 Banyuls Sur Mer, France.
32 Aix Marseille Univ, CNRS IGS UMR 7256, F-13288 Marseille, France.
33 Kyoto Univ, Inst Chem Res, Kyoto 6110011, Japan.
34 Univ Bremen, Data Publisher Earth & Environm Sci, PANGAEA, D-28359 Bremen, Germany.
35 Bigelow Lab Ocean Sci, East Boothbay, ME 04544 USA.
36 Natl Sci Fdn, Arlington, VA 22230 USA.
37 Ecole Normale Super, LMD, Dept Geosci, F-75231 Paris 05, France.
38 UBO, IUEM, Lab Phys Oceans, F-29820 Plouzane, France.
* Corresponding author : Colomban de Vargas, email address : [email protected] ; [email protected] ; [email protected]
Abstract : Marine plankton support global biological and geochemical processes. Surveys of their biodiversity have hitherto been geographically restricted and have not accounted for the full range of plankton size. We assessed eukaryotic diversity from 334 size-fractionated photic-zone plankton communities collected across tropical and temperate oceans during the circumglobal Tara Oceans expedition. We analyzed 18S ribosomal DNA sequences across the intermediate plankton-size spectrum from the smallest unicellular eukaryotes (protists, > 0.8 micrometers) to small animals of a few millimeters. Eukaryotic ribosomal diversity saturated at similar to 150,000 operational taxonomic units, about one-third of which could not be assigned to known eukaryotic groups. Diversity emerged at all taxonomic levels, both within the groups comprising the similar to 11,200 cataloged morphospecies of eukaryotic plankton and among twice as many other deep-branching lineages of unappreciated importance in plankton ecology studies. Most eukaryotic plankton biodiversity belonged to heterotrophic protistan groups, particularly those known to be parasites or symbiotic hosts.
3
Main Text:
Introduction. The sunlit surface layer of the world’s oceans functions as a giant biogeochemical
membrane between the atmosphere and the ocean interior (1). This biome includes plankton
communities that fix CO2 and other elements into biological matter, which then enters the food
web. This biological matter can be remineralized or exported to the deeper ocean, where it may
be sequestered over ecological to geological time scales. Study of this biome has typically
focused on either conspicuous phyto- or zoo-plankton at the larger end of the organismal size
spectrum, or "microbes" (prokaryotes and viruses) at the smaller end. Here, we studied the
taxonomic and ecological diversity of the intermediate size spectrum (from 0.8µm to a few mm),
which includes all unicellular eukaryotes (protists) and ranges from the smallest protistan cells to
small animals (2). The ecological biodiversity of marine planktonic protists has been analyzed
using Sanger (e.g. (3–5)) and high-throughput (e.g. (6, 7)) sequencing of mainly ribosomal DNA
(rDNA) gene markers, on relatively small taxonomic and/or geographical scales, unveiling key
new groups of phagotrophs (8), parasites (9), and phototrophs (10) . We sequenced 18S rDNA
metabarcodes up to local and global saturations from size-fractionated plankton communities
sampled systematically across the world tropical and temperate sunlit oceans.
A global metabarcoding approach. To explore patterns of photic-zone eukaryotic plankton
biodiversity, we generated ~766 million raw rDNA sequence reads from 334 plankton samples
collected during the circum-global Tara Oceans expedition (11). At each of 47 stations, plankton
communities were sampled at two water-column depths corresponding to the main hydrographic
structures of the photic zone: subsurface mixed-layer waters (SRF) and the Deep Chlorophyll
Maximum (DCM) at the top of the thermocline. A low-shear, non-intrusive peristaltic pump and
plankton nets of various mesh-sizes were used on board Tara to sample and concentrate
appropriate volumes of seawater to theoretically recover complete local eukaryotic biodiversity
from four major organismal size fractions: piconano-plankton (0.8-5µm), nano-plankton (5-
20µm), micro-plankton (20-180µm), and meso-plankton (180-2000µm) (see (12) for detailed
Tara Oceans field sampling strategy and protocols).
We extracted total DNA from all samples, PCR amplified the hyper-variable V9 region of the
nuclear gene that encodes 18S rRNA (13), and generated an average of 1.73±0.65 million
sequence reads (paired-end Illumina) per sample (11). Strict bioinformatic quality control led to a
final dataset of 580 million reads, of which ~2.3 million were distinct, hereafter denoted
4
metabarcodes. We then clustered metabarcodes into biologically meaningful OTUs (14), and
assigned a eukaryotic taxonomic path to all metabarcodes and OTUs by global similarity analysis
with 77,449 reference, Sanger-sequenced V9 rDNA barcodes covering the known diversity of
eukaryotes and assembled into an in-house database called V9_PR2 (15). Beyond taxonomic
assignation, we inferred basic trophic and symbiotic ecological modes (photo- versus hetero-
trophy; parasitism, commensalism, mutualism for both hosts and symbionts) to Tara Oceans
reads and OTUs, based on their genetic affiliation to large, monophyletic and monofunctional
groups of reference barcodes. We finally inferred large-scale ecological patterns of eukaryotic
biodiversity across geography, taxonomy, and organismal size-fractions based on rDNA
abundance data and community similarity analyses, and compared them to current knowledge
extracted from the literature.
The extent of eukaryotic plankton diversity in the photic-zone of the world ocean. Sequencing
of ~1.7 million V9 rDNA reads from each of the 334 size-fractionated plankton samples was
sufficient to approach saturation of eukaryotic richness at both local and global scales (Fig.
1A,B). Local richness represented on average 9.7±4% of global richness, the latter approaching
saturation at ~2 million eukaryotic metabarcodes or ~110,000 OTUs (16). The global pool of
OTUs displayed a good fit to the truncated Preston log-normal distribution (17), which, by
extrapolation, suggests a total photic-zone eukaryotic plankton richness of ~150,000 OTUs, of
which ~40,000 were not found in our survey (Fig. 1C). Thus we estimate that our survey unveiled
~75% of eukaryotic ribosomal diversity in the globally distributed water masses analysed. The
extrapolated ~150,000 total OTUs is much higher than the ~11,200 formally described species of
marine eukaryotic plankton (see below), and likely represents a highly conservative, lower
boundary estimate of the true number of eukaryotic species in this biome given the relatively
limited taxonomic resolution power of the 18S rDNA gene. Our data indicate that eukaryotic
taxonomic diversity is higher in smaller organismal size fractions, with a peak in the piconano-
plankton (Fig. 1A), highlighting the richness of tiny organisms that are poorly characterized in
terms of morpho-taxonomy and physiology (18). A first-order, super-group level classification of
all Tara Oceans OTUs demonstrated the prevalence, at the biome scale and across the >4 orders
of size-magnitude sampled, of protist rDNA biodiversity with respect to that of classical
multicellular eukaryotes, i.e., animals, plants, and fungi (Fig. 2A). Protists accounted for >85% of
total eukaryotic ribosomal diversity, a ratio that may well hold true for other marine, freshwater,
and terrestrial oxygenic ecosystems (19). The latest estimates of total marine eukaryotic
biodiversity based on statistical extrapolations from classical taxonomic knowledge predict the
5
existence of 0.5 to 2.2 million species (including all benthic and planktonic systems from reefs to
deep-sea vents (20, 21), but do not take into account the protistan knowledge gap highlighted
here. Simple application of our ‘animal to other eukaryotes’ ratio of ~13% to the robust
prediction of the total number of metazoan species from (20) would imply that 16.5 million and
60 million eukaryotic species potentially inhabit the oceans and the Earth, respectively.
Phylogenetic breakdown of photic-zone eukaryotic biodiversity. About one third of eukaryotic
ribosomal diversity in our dataset did not match any reference barcode in the extensive V9_PR2
database (‘unassigned’ category in Fig. 2A). This unassignable diversity represented only a small
proportion (2.6%) of total reads, and increased in both richness and abundance in smaller
organismal size fractions, suggesting that it may correspond in part to rare and minute taxa that
have escaped previous characterization. Some may also correspond to divergent rDNA
pseudogenes, known to exist in eukaryotes (22, 23), or sequencing artefacts (24), although both of
these would be expected to be present in equal proportion in all size-fractions (details in (16)).
The remaining ~87,000 assignable OTUs were classified into 97 deep-branching lineages
covering the full spectrum of catalogued eukaryotic diversity amongst the 7 recognized super-
groups and multiple incertae sedis lineages (15) whose origins go back to the primary radiation of
eukaryotic life in the Neo-Proterozoic. Although highly represented in the V9_PR2 reference
database, several well-known lineages adapted to terrestrial, marine benthic, or anaerobic habitats
(e.g. Embryophyta, apicomplexan and trypanosome parasites of land plants and animals,
amoeboflagellate Breviatea, several lineages of Amoebozoa, Excavata and Cercozoa) were not
detected in our metabarcoding dataset, suggesting the absence of contamination during the PCR
and sequencing steps on land, and reducing the number of deep branches of eukaryotic plankton
to 85 (Fig. 3).
We then extracted the metabarcodes assigned to morphologically well-known planktonic
eukaryotic taxa from our dataset, and compared them with the conventional, 150 year-old
morphological view of marine eukaryotic plankton that includes ~11,200 catalogued species
divided into three broad categories: ~4,350 species of phytoplankton (microalgae), ~1,350 species
of protozooplankton (relatively large, often biomineralized, heterotrophic protists) and ~5,500
species of metazooplankton (holoplanktonic animals) (25–27). A congruent picture of the
distribution of morpho-genetic diversity amongst and within these organismal categories emerged
from our dataset (Fig. 2B), but typically 3 to 8 times more rDNA OTUs were found than
described morphospecies in the best-known lineages within these categories. This is within the
6
range of the number of cryptic species typically detected in globally-distributed pelagic taxa
using molecular data (28, 29). The general congruency between genetic and morphological data
in the catalogued compartment of eukaryotic plankton suggests that the protocols used, from
plankton sampling to DNA sequencing, recovered the known eukaryotic biodiversity without
significant qualitative or quantitative biases. However, OTUs related to morphologically
described taxa represented only a minor part of the total eukaryotic plankton ribosomal and
phylogenetic diversity. Overall, <1% of OTUs were strictly identical to reference sequences, and
OTUs were on average only ~86% similar to any V9 reference sequence (Fig. 3F and (16)). This
shows that most photic-zone eukaryotic plankton V9 rDNA diversity had not been previously
sequenced from cultured strains, single-cell isolates, or even environmental clone library surveys.
The Tara Oceans metabarcode dataset added considerable phylogenetic information to previous
protistan rDNA knowledge, with an estimated mean tree length increase of 453%, reaching
>100% in 43 lineages (16). Even in the best-referenced groups such as the diatoms (1,232
reference sequences, Fig. 3B), we identified many new rDNA sequences both within known
groups and forming new clades (16).
Eleven ‘hyper-diverse’ lineages each contained >1,000 OTUs, together representing ~88% and
~90% of all OTUs and reads, respectively (Fig. 3C). Amongst these, the only permanently
phototrophic taxa were diatoms (Fig. 4A) and about a third of dinoflagellates (Fig. 4B-F),
together comprising ~15% and ~13% of hyper-diverse OTUs and reads, respectively (30). Most
hyper-diverse photic-zone plankton belonged to three super-groups, the Alveolata, Rhizaria, and
Excavata, about which we have limited biological or ecological information. The Alveolata,
which consist mostly of parasitic (MALVs, Fig. 4F) and phagotrophic (ciliates and most
dinoflagellates) taxa, were by far the most diverse super-group, comprising ~42% of all
assignable OTUs. The Rhizaria are a group of amoeboid heterotrophic protists with active
pseudopods displaying a broad spectrum of ecological behavior from phagotrophy to parasitism
and mutualism (symbioses) (31). Rhizarian diversity peaked in the Retaria (Fig. 4C, D), a
subgroup including giant protists that build complex skeletons of silicate (Polycystinea),
strontium sulfate (Acantharia, Fig. 4C), or calcium carbonate (Foraminifera), and thus comprise
key microfossils for paleoceanography. Unsuspected rDNA diversity was recorded within the
Collodaria (5,636 OTUs), polycystines which are mostly colonial, poorly silicified or naked, and
live in obligatory symbiosis with photosynthetic dinoflagellates (Fig. 4D) (32, 33). Arguably the
most surprising component of novel biodiversity was the >12,300 OTUs related to reference
sequences of diplonemids, an excavate lineage that has only two described genera of flagellate
7
grazers, one of which parasitizes diatoms and crustaceans (34, 35). Their ribosomal diversity was
not only much higher than that observed in classical plankton groups such as foraminifers,
ciliates, or diatoms (50-fold, 6-fold, and 3.8-fold higher, respectively), but was also far from
richness saturation (Fig. 3E). Eukaryotic rDNA diversity peaked especially in the few lineages
that extend across larger size fractions (i.e. metazoans, rhizarians, dinoflagellates, ciliates,
diatoms; Fig. 3E). Larger cells or colonies not only provide protection against predation via size-
mediated avoidance and/or construction of composite skeletons, but also support for complex and
coevolving relationships with often specialized parasites or mutualistic symbionts.
Beyond this hyper-diverse, largely heterotrophic eukaryotic majority, our dataset also highlighted
phylogenetic diversity of poorly known phagotrophic (e.g., 413 OTUs of Katablepharidophyta,
240 OTUs of Telonemia), osmotrophic (e.g., 410 OTUs of Ascomycota, 322 OTUs of
Labyrinthulea), and parasitic (e.g., 384 OTUs of gregarine apicomplexans, 160 OTUs of
Ascetosporea, 68 OTUs of Ichthyosporea) protist groups. Amongst the 85 major lineages
presented in the phylogenetic framework of Fig. 3, less than a third (~25) have been recognized
as significant in previous marine plankton biodiversity and ecology studies using morphological
and/or molecular data (Fig. 3C and (15)). The remaining ~60 branches had either never been
observed in marine plankton, or were detected through morphological description of one or a few
species and/or the presence of environmental sequences in geographically restricted clone library
surveys (15). This understudied diversity represents ~25% of all taxonomically assignable OTUs
(>21,500) and covers broad taxonomic and geographic scales, thus representing a wealth of new
actors to integrate into future plankton systems biology studies.
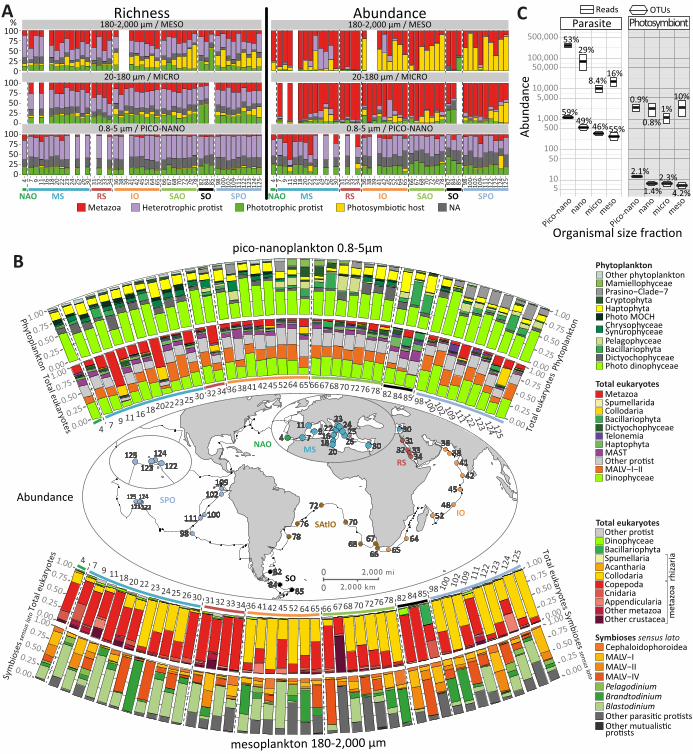
Insights into photic-zone eukaryotic plankton ecology. Functional annotation of taxonomically-
assigned V9 rDNA metabarcodes was used as a first attempt to explore ecological patterns of
eukaryotic diversity across broad spatial scales and organismal size-fractions, focusing on
fundamental trophic modes (photo- vs. hetero-trophy) and symbiotic interactions (parasitism to
mutualism). Heterotroph (protists and metazoans) V9 rDNA metabarcodes were significantly
more diverse (63%) and abundant (62%) than phototroph metabarcodes that represented <20% of
OTUs and reads across all size-fractions and geographic sites, with an increasing heterotroph to
phototroph ratio in the micro- and meso-plankton (Fig. 5A, confirmed in 17 non-size-fractionated
samples (30)). These results challenge the classical, morphological view of plankton diversity,
biased by a terrestrial ecology approach, whereby phyto- and metazoo-plankton (the plant/animal
paradigm) are thought to comprise ~88% of eukaryotic plankton diversity (Fig. 2B) and
8
heterotrophic protists are typically reduced in food web modeling to a single entity, often
idealized as ciliate grazers.
An unsuspected richness and abundance of metabarcodes assigned to monophyletic groups of
heterotrophic protists that cannot survive without endosymbiotic microalgae was found in larger
size fractions (‘photosymbiotic hosts’ in Fig. 5A). Their abundance and even diversity were
sometimes greater than those of all metazoan metabarcodes, including those from copepods. Most
of these cosmopolitan photosymbiotic hosts were found within the hyper-diverse radiolarians
Acantharia (1,043 OTUs) and Collodaria (5,636 OTUs, Figs. 3, 4B and 5D), which have often
been overlooked in traditional morphological surveys of plankton-net collected material because
of their delicate gelatinous and/or easily dissolved structures, but are known to be very abundant
from microscope-based and in situ imaging studies (36–38). All 95 known colonial collodarian
species described since the 19th century (39) harbour intracellular symbiotic microalgae and these
key players for plankton ecology are protistan analogues of photosymbiotic corals in tropical
coastal reef ecosystems with no equivalent in terrestrial ecology. In addition to their contribution
to total primary production (36, 38), these diverse, biologically complex, often biomineralized,
and relatively long-lived giant mixotrophic protists stabilize carbon in larger size fractions and
likely increase its flux to the ocean interior (38). Conversely, the microalgae that are known
obligate intracellular partners in open-ocean photosymbioses (33, 40–42) (Fig. 5B) were neither
very diverse nor highly abundant, and occurred evenly across organismal size fractions (Fig. 5C).
However, their relative contribution was greatest in the meso-plankton category (10%) (Fig. 5C),
where the known photosymbionts of pelagic rhizarians were found (together with their hosts Fig.
5B). The stable and systematic abundance of photosymbiotic microalgae across size fractions (a
pattern not shown by non-photosymbiotic microalgae, see (30)) suggests that pelagic
photosymbionts maintain free-living and potentially actively growing populations in the
piconano- and nano-plankton, representing an accessible pool for recruitment by their
heterotrophic hosts. This appears to contrast with photosymbioses in coral reefs and terrestrial
systems where symbiotic microalgal populations mainly occur within their multicellular hosts
(43).
On the other end of the spectrum of biological interactions, rDNA metabarcodes affiliated to
groups of known parasites were ~90 times more diverse than photosymbionts in the piconano-
plankton, where they represented ~59% of total heterotrophic protistan ribosomal richness, and
~53% of abundance (Fig. 4; Fig. 5C), although this latter value may be inflated by a
9
hypothetically higher rDNA copy number in some marine alveolate lineages (18). Parasites in this
size fraction were mostly (89% of diversity and 88% of abundance, across all stations) within the
MALV-I and II Syndiniales (30), which are known exclusively as parasitoid species that kill their
host and release hundreds of small (2 to 10 µm), non-phagotrophic, dinospores (44, 9) that
survive for only a few days in the water column (45). Abundant parasite-assigned metabarcodes
in small size fractions (Fig. 5B, C) suggest the existence of a large and diverse pool of free-living
parasites in photic-zone piconano-plankton, mirroring phage ecology (46), and reflecting the
extreme diversity and abundance of their known hosts, essentially radiolarians, ciliates, and
dinoflagellates (Fig. 3) (9, 47–49). Contrasting with the pattern observed for metabarcodes
affiliated to purely phagotrophic taxa, the relative abundance and richness of putative parasite
metabarcodes decreased in the nano- and micro-planktonic size fractions, but increased again in
the meso-plankton (Fig. 5C), where parasites are most likely in their infectious stage within
larger-sized host organisms. This putative in hospite parasites richness, equivalent to only 23% of
that in the piconano-plankton, consisted mostly of a variety of alveolate taxa known to infect
crustaceans: MALV-IV such as Haematodinium and Syndinium, dinoflagellates such as
Blastodinium (Fig. 4E), and apicomplexan gregarines, mainly Cephaloidophoroidea (Fig. 5B) (9,
50, 51). This pattern contrasts with terrestrial systems where most parasites live within their
hosts, and are typically transmitted either vertically or through vectors since they generally do not
survive outside their hosts (52). In the pelagic realm, free-living parasitic spores, like phages, are
protected from dessication, dispersed by water diffusion, and are apparently massively produced,
which likely increases horizontal transmission rate.
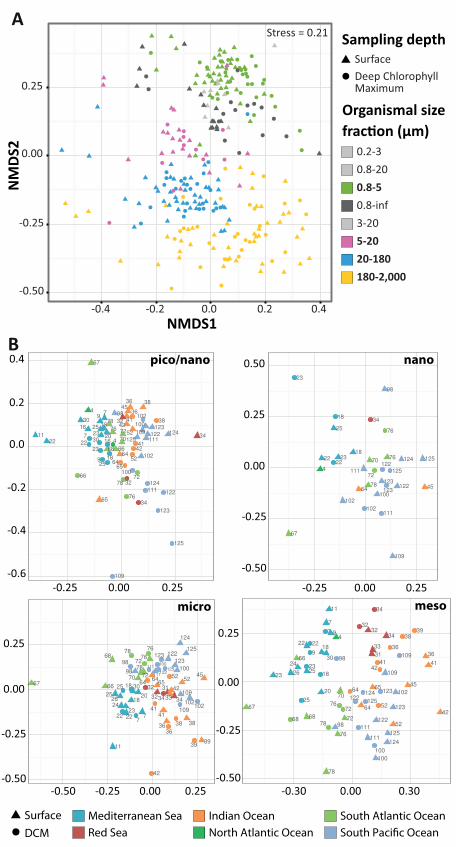
Community structuring of photic-zone eukaryotic plankton. Clustering of communities by their
compositional similarity revealed the primary influence of organism size (p-value = 10-3, r2 =
0.73) on community structuring, with piconano-plankton displaying stronger cohesiveness than
larger organismal size fractions (Fig. 6A). Filtered size fraction-specific communities separated
by thousands of kilometers were more similar in composition than they were to communities
from other size fractions at the same location. This was emphasized by the fact that ~36% of all
OTUs were restricted to a single size category (53). Further analyses within each organismal size
fraction indicated that geography plays a role in community structuring, with samples being
partially structured according to basin of origin, a pattern that was stronger in larger organismal
size fractions (p-value=0.001 in all cases, r2 = 0.255 for piconano-plankton, 0.371 for nano-
plankton, 0.473 for micro-plankton and 0.570 for meso-plankton) (Fig. 6B). Mantel correlograms
comparing Bray-Curtis community similarity to geographic distances between all samples
10
indicated significant positive correlations in all organismal size-fractions over the first ~6,000
km, the correlation breaking down at larger geographic distances (54). This positive correlation
between community dissimilarity and geographic distance, expected under neutral biodiversity
dynamics (55), challenges the classical niche model for photic-zone eukaryotic plankton
biogeography (56). The significantly stronger community differentiation by ocean basin in larger
organismal size fractions (Fig. 6B) suggests increasing dispersal limitation from piconano- to
nano-, micro-, and meso-plankton. Thus, larger-sized eukaryotic plankton communities,
containing the highest abundance and diversity of metazoans (Fig. 2A and Fig. 5B), were
spatially more heterogeneous in terms of both taxonomic (Fig. 6) and functional (Fig. 5A)
composition and abundance. The complex life-cycle and behaviors of metazooplankton, including
temporal reproductive and growth cycles and vertical migrations, together with putative rapid
adaptive evolution processes to mesoscale oceanographic features (57), may explain the stronger
geographic differentiation of meso-planktonic communities. By contrast, eukaryotic communities
in the piconano-plankton were richer (Fig. 1A) and more homogeneous in taxonomic
composition (Fig. 6), representing a stable compartment across the world’s oceans (58).
Even though protistan communities were diverse, the proportions of abundant (>1%) and rare
(<0.01%) OTUs were more or less constant across communities, as has been observed in coastal
waters (6). Only 2 to 17 OTUs (i.e. 0.2 to 8% of total OTUs per and across sample) dominated
each community (54), suggesting that a small proportion of eukaryotic taxa are key for local
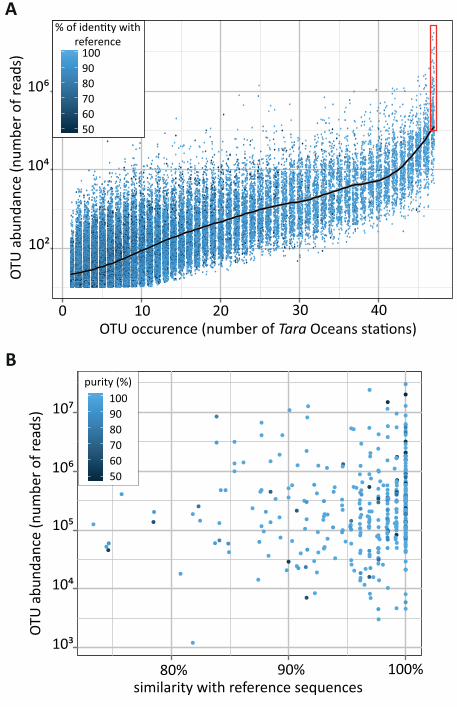
plankton ecosystem function. On a worldwide scale, an occurrence vs. abundance analysis of all
~110,000 Tara Oceans OTUs revealed the hyper-dominance of cosmopolitan taxa (Fig. 7A). The
381 (0.35% of the total) cosmopolitan OTUs represented ~68% of the total number of reads in the
dataset. Of these, 269 (71%) OTUs had >100,000 reads and accounted for nearly half (48%) of all
rDNA reads (Fig. 7A), a pattern reminiscent of hyper-dominance in the largest forest ecosystem
on Earth, where only 227 tree species out of an estimated total of 16,000 account for half of all
trees in Amazonia (59). The cosmopolitan OTUs belonged mainly (314 of 381) to the 11 hyper-
diverse eukaryotic planktonic lineages (Fig. 3C), and were essentially phagotrophic (40%) or
parasitic (21%), with relatively few (15%) phytoplanktonic taxa (54), 25% of the cosmopolitan
OTUs, which represent organisms that are likely amongst the most abundant eukaryotes on Earth,
had poor identity (<95%) to reference taxa, and 11 of these OTUs could not even by affiliated to
any available reference sequence (Fig. 7B and (54)).
11
Conclusions and perspectives. We used rDNA sequence data to explore the taxonomic and
ecological structure of total eukaryotic plankton from the photic oceanic biome, and integrated
these data with existing morphological knowledge. We found that eukaryotic plankton are more
diverse than previously thought, especially heterotrophic protists which may display a wide range
of trophic modes (60) and include an unsuspected diversity of parasites and photosymbiotic taxa.
Dominance of unicellular heterotrophs in plankton ecosystems likely emerged at the dawn of the
radiation of eukaryotic cells, together with arguably their most important innovation:
phagocytosis. The onset of eukaryophagy in the Neoproterozoic (61) likely led to adaptive
radiation in heterotrophic eukaryotes through specialization of trophic modes and symbioses,
opening novel serial biotic ecological niches. The extensive co-diversification of relatively large
heterotrophic eukaryotes and their associated parasites supports the idea that biotic interactions,
rather than competition for resources and space (62), are the primary forces driving organismal
diversification in marine plankton systems. Based on rDNA, heterotrophic protists may be even
more diverse than prokaryotes in the planktonic ecosystem (63). Given that organisms in highly
diverse and abundant groups such as the alveolates and rhizarians can have genomes more
complex than those of humans (64), eukaryotic plankton may contain a vast reservoir unknown
marine planktonic genes (65). Insights are developing into how heterotrophic protists contribute
to a multi-layered and integrated ecosystem. The protistan parasites and mutualistic symbionts
increase connectivity and complexity of pelagic food webs (66, 67) while contributing to the
carbon quota of their larger, longer-lived, often biomineralized, symbiotic hosts, which
themselves contribute to carbon export when they die. Decoding the ecological and evolutionary
rules governing plankton diversity remains essential for understanding how the critical ocean
biomes contribute to the functioning of the Earth system.
Materials & Methods.
V9-18S rDNA for eukaryotic metabarcoding
We used universal eukaryotic primers (68) to PCR amplify (25 cycles in triplicate) the V9-18S
rDNA genes from all Tara Oceans samples. This barcode presents a combination of advantages
for addressing general questions of eukaryotic biodiversity over extensive taxonomic and
ecological scales: (i) it is universally conserved in length (130±4bp) and simple in secondary
structure, thus allowing relatively unbiased PCR amplification across eukaryotic lineages
followed by Illumina sequencing, (ii) it includes both stable and highly-variable nucleotide
positions over evolutionary time frames, allowing discrimination of taxa over a significant
phylogenetic depth, (iii) it is extensively represented in public reference databases across the
12
eukaryotic tree of life, allowing taxonomic assignment amongst all known eukaryotic lineages
(13).
Biodiversity analyses
Our bioinformatic pipeline included quality-check (phred score filtering, elimination of reads
without perfect forward and reverse primers, chimera removal) and conservative filtering
(removal of metabarcodes present in less than 3 reads and 2 distinct samples). The ~2.3 million
metabarcodes (distinct reads) were clustered using an agglomerative, unsupervised single-linkage
clustering algorithm, allowing OTUs to reach their natural limits while avoiding arbitrary global
clustering thresholds (13, 14). This clustering limited overestimation of biodiversity due to errors
in PCR amplification or DNA sequencing as well as intragenomic polymorphism of rDNA gene
copies (13). Tara Oceans metabarcodes and OTUs were taxonomically assigned by comparison
to the 77,449 reference barcodes included in our V9_PR2 database (15). This database derives
from the Protist Ribosomal Reference (PR2) database (69) but focuses on the V9 region of the
gene and includes the following re-organizations: (i) extension of the number of ranks for groups
with finer taxonomy (e.g. animals), (ii) expert curation of the taxonomy and re-naming in novel
environmental groups and dinoflagellates, (iii) resolution of all taxonomic conflicts and inclusion
of environmental sequences only if they provide additional phylogenetic information, (iv)
annotation of basic trophic/symbiotic modes for all reference barcodes assigned to the genus level
(see (53) and (15) for details). The V9_PR2 reference barcodes represent 24,435 species and
13,432 genera from all known major lineages of the tree of eukaryotic life (15). Metabarcodes
with ≥80% identity to a reference V9 rDNA barcode were considered assignable. Below this
threshold it is not possible to discriminate between eukaryotic supergroups given the short length
of V9 rDNA sequences and the relatively fast rate accumulation of substitution mutations in the
DNA. In addition to assignment at the finest-possible taxonomic resolution, all assignable
metabarcodes were classified into a reference taxonomic framework consisting of 97 major
monophyletic groups comprising all known high-rank eukaryotic diversity. This framework,
primarily based on a synthesis of protistan biodiversity (19), also included all key, but still
unnamed planktonic clades revealed by previous environmental rDNA clone library surveys (70)
(e.g. MALV ‘marine alveolates’, MAST ‘marine stramenopiles’, MOCH ‘marine ochrophytes’,
RAD ‘radiolarians’ (15). Details of molecular and bioinformatics methods are available on a
companion web site at http://taraoceans.sb-roscoff.fr/EukDiv/ (53). We compiled our data into
two databases including the taxonomy, abundance, and size-fraction/biogeography information
associated to each metabarcode and OTU (71).
13
Ecological inferences
From our Tara Oceans metabarcoding dataset, we inferred patterns of eukaryotic plankton
functional ecology. Based on a literature survey, all reference barcodes assigned to at least the
genus level that recruited Tara Oceans metabarcodes were associated to basic trophic and
symbiotic modes of the organism they come from (15), and used for a taxo-functional annotation
of our entire metabarcoding dataset with the same set of rules used for taxonomic assignation
(53). False positive were minimized by (i) assigning ecological modes to all individual reference
barcodes in V9_PR2, (ii) inferring ecological modes to metabarcodes related to mono-modal
reference barcode(s) (otherwise transfer them to a ‘NA - non applicable’ category), and (iii)
exploring broad and complex trophic and symbiotic modes that involve fundamental
reorganization of the cell structure and metabolism, emerged relatively rarely in the evolutionary
history of eukaryotes, and most often concern all known species within monophyletic and ancient
groups (see (15) for details). In case of photo- versus hetero-trophy, >75% of the major, deep-
branching eukaryotic lineages considered (Fig. 3) are ‘mono-modal’ and recruit ~87% and ~69%
of all Tara Oceans V9 rDNA reads and OTUs, respectively. For parasitism, ~91% of Tara
Oceans metabarcodes are falling within monophyletic and major groups containing exclusively
parasitic species (essentially within the major MALVs groups). Although biases could arise in
functional annotation of metabarcodes relatively distant from reference barcodes in the few
complex poly-modal groups (e.g. the dinoflagellates that can be phototrophic, heterotrophic,
parasitic, or photosymbiotic), a conservative analysis of the trophic and symbiotic ecological
patterns presented in Fig. 3, using a ≥99% assignation threshold, shows that these are stable
across organismal size fractions and space independently of the similarity cutoff (80% or 99%),
demonstrating their robustness across evolutionary times (30).
Note that rDNA gene copy number varies from one to thousands in single eukaryotic genomes
(72, 73), precluding direct translation of rDNA read number into abundance of individual
organisms. However, the number of rDNA copies per genome correlates positively to the size
(73) and particularly to the biovolume (72) of the eukaryotic cell it represents. We compiled
published data from the last ca. 20 years, confirming the positive correlation between eukaryotic
cell size and rDNA copy number across a wide taxonomic and organismal size range (see (74),
note however the ~1 order of magnitude of cell size variation for a given of rDNA copy number.
To verify whether our molecular ecology protocol preserved this empirical correlation, light
microscopy counts of phytoplankton belonging to different eukaryotic supergroups
14
(coccolithophores, diatoms, dinoflagellates) were performed from 9 Tara Oceans stations from
the Indian, Atlantic, and Southern Oceans, transformed into biomass and biovolume data and then
compared with the relative number of V9 rDNA reads found for the identified taxa in the same
samples (74). Results confirmed the correlation between biovolume and V9 rDNA abundance
data (r2=0.97, p-value=1.e-16;), although we cannot rule out the possibility that some eukaryotic
taxa may not follow the general trend.
References and notes: 1. C. B. Field, M. J. Behrenfeld, J. T. Randerson, P. Falkowski, Primary Production of the Biosphere:
Integrating Terrestrial and Oceanic Components. Science (80-. ). 281, 237–240 (1998). 2. D. A. Caron, P. D. Countway, A. C. Jones, D. Y. Kim, A. Schnetzer, Marine Protistan Diversity.
Ann. Rev. Mar. Sci. 4, 467–493 (2012). 3. P. López-García, F. Rodríguez-Valera, Unexpected diversity of small eukaryotes in deep-sea
Antarctic plankton. Nature. 409, 603–607 (2001). 4. S. M. der Staay, R. De Wachter, D. Vaulot, Oceanic 18S rDNA sequences from picoplankton
reveal unsuspected eukaryotic diversity. Nature. 409, 607–610 (2001). 5. B. Dı́ez, C. Pedrós-Alió, R. Massana, Study of genetic diversity of eukaryotic picoplankton in
different oceanic regions by small-subunit rRNA gene cloning and sequencing. Appl. Environ. Microbiol. 67, 2932–2941 (2001).
6. R. Logares et al., Patterns of rare and abundant marine microbial eukaryotes. Curr. Biol. 24, 813–21 (2014).
7. V. Edgcomb et al., Protistan microbial observatory in the Cariaco Basin, Caribbean. I. Pyrosequencing vs Sanger insights into species richness. ISME J. 5, 1344–56 (2011).
8. R. Massana, J. Castresana, Phylogenetic and ecological analysis of novel marine stramenopiles. Appl. Environ. Microbiol. 70, 3528–3534 (2004).
9. L. Guillou et al., Widespread occurrence and genetic diversity of marine parasitoids belonging to Syndiniales (Alveolata). Environ. Microbiol. 10, 3349–3365 (2008).
10. H. Liu et al., Extreme diversity in noncalcifying haptophytes explains a major pigment paradox in open oceans. Proc. Natl. Acad. Sci. U. S. A. 106, 12803–8 (2009).
11. Companion website: Figure W1, Database W1, (available at http://taraoceans.sb-roscoff.fr/EukDiv/).
12. S. Pesant et al., Tara Oceans Data: A sampling strategy and methodology for the study of marine plankton in their environmental context. NPG Sci. Data.
13. Companion website: Text W1, Figure W2, (available at http://taraoceans.sb-roscoff.fr/EukDiv/). 14. F. Mahé, T. Rognes, C. Quince, C. de Vargas, M. Dunthorn, Swarm: robust and fast clustering
method for amplicon-based studies. PeerJ. 2, e593 (2014). 15. Companion website: Database W2, Database W3, Database W6, (available at http://taraoceans.sb-
roscoff.fr/EukDiv/). 16. Companion website: Text W3, Text W4, Text W5, Figure W4, Figure W5, Figure W6, Figure W7,
(available at http://taraoceans.sb-roscoff.fr/EukDiv/). 17. F. W. Preston, The commonness, and rarity, of species. Ecology. 29, 254–283 (1948). 18. R. Massana, Eukaryotic picoplankton in surface oceans. Annu. Rev. Microbiol. 65, 91–110 (2011). 19. J. Pawlowski et al., CBOL protist working group: barcoding eukaryotic richness beyond the
animal, plant, and fungal kingdoms. PLoS Biol. 10, e1001419 (2012). 20. C. Mora, D. P. Tittensor, S. Adl, A. G. B. Simpson, B. Worm, How many species are there on
Earth and in the ocean? PLoS Biol. 9, e1001127 (2011). 21. W. Appeltans et al., The magnitude of global marine species diversity. Curr. Biol. 22, 2189–202
(2012).
15
22. L. M. Márquez, D. J. Miller, J. B. MacKenzie, M. J. H. Van Oppen, Pseudogenes contribute to the extreme diversity of nuclear ribosomal DNA in the hard coral Acropora. Mol. Biol. Evol. 20, 1077–86 (2003).
23. S. Santos, R. Kinzie, Molecular characterization of nuclear small subunit (18S)-rDNA pseudogenes in a symbiotic dinoflagellate (Symbiodinium, Dinophyta). J. Eukaryot. Microbiol. 50, 417–421 (2003).
24. J. Decelle, S. Romac, E. Sasaki, F. Not, F. Mahé, Intracellular Diversity of the V4 and V9 Regions of the 18S rRNA in Marine Protists (Radiolarians) Assessed by High-Throughput Sequencing. PLoS One. 9, e104297 (2014).
25. A. Sournia, M.-J. Chrétiennot-Dinet, M. Ricard, Marine phytoplankton: how many species in the world ocean? J. Plankton Res. 13, 1093–1099 (1991).
26. P. H. Wiebe et al., Deep-sea sampling on CMarZ cruises in the Atlantic Ocean – an Introduction. Deep Sea Res. Part II Top. Stud. Oceanogr. 57, 2157–2166 (2010).
27. D. Boltovskoy, Diversity and endemism in cold waters of the South Atlantic: contrasting patterns in the plankton and the benthos. Sci. Mar. 69, 17–26 (2005).
28. C. de Vargas, R. Norris, Molecular evidence of cryptic speciation in planktonic foraminifers and their relation to oceanic provinces. Proc. Natl. Acad. Sci. U. S. A. 96, 2864–2868 (1999).
29. K. M. K. Halbert, E. Goetze, D. B. Carlon, High cryptic diversity across the global range of the migratory planktonic copepods Pleuromamma piseki and P. gracilis. PLoS One. 8, e77011 (2013).
30. Companion website: Figure W8, Figure W9, Figure W10, Figure W14, (available at http://taraoceans.sb-roscoff.fr/EukDiv/).
31. F. Burki, P. J. Keeling, Rhizaria. Curr. Biol. 24, R103–7 (2014). 32. N. R. Swanberg, thesis, Massachussetts Institute of Technology & Woods Hole Oceanographic
Institution (1974). 33. I. Probert et al., Brandtodinium gen. nov. and B . nutricula comb. Nov. (Dinophyceae), a
dinoflagellate commonly found in symbiosis with polycystine radiolarians. J. Phycol. 50, 388–399 (2014).
34. S. von der Heyden, E. E. Chao, K. Vickerman, T. Cavalier-Smith, Ribosomal RNA phylogeny of bodonid and diplonemid flagellates and the evolution of euglenozoa. J. Eukaryot. Microbiol. 51, 402–16 (2004).
35. E. Schnepf, Light and Electron Microscopical Observations in Rhynchopus coscinodiscivorus spec. nov., a Colorless, Phagotrophic Euglenozoon with Concealed Flagella. Arch. für Protistenkd. 144, 63–74 (1994).
36. M. R. Dennett, Video plankton recorder reveals high abundances of colonial Radiolaria in surface waters of the central North Pacific. J. Plankton Res. 24, 797–805 (2002).
37. L. Stemmann et al., Global zoogeography of fragile macrozooplankton in the upper 100-1000 m inferred from the underwater video profiler. ICES J. Mar. Sci. 65, 433–442 (2008).
38. A. F. Michaels, D. A. Caron, N. R. Swanberg, F. A. Howse, C. M. Michaels, Planktonic sarcodines (Acantharia, Radiolaria, Foraminifera) in surface waters near Bermuda: abundance, biomass and vertical flux. J. Plankton Res. 17, 131–163 (1995).
39. E. Haeckel, in Report on the Scientific Results of the Voyage of H.M.S. Challenger during the Years 1873–1876. Zoology (1887), pp. 1–1803.
40. R. Siano, M. Montresor, I. Probert, F. Not, C. de Vargas, Pelagodinium gen. nov. and P. béii comb. nov., a dinoflagellate symbiont of planktonic foraminifera. Protist. 161, 385–99 (2010).
41. J. Decelle et al., An original mode of symbiosis in open ocean plankton. Proc. Natl. Acad. Sci. U. S. A. 109, 18000–5 (2012).
42. Y. Shaked, C. de Vargas, Pelagic photosymbiosis: rDNA assessment of diversity and evolution of dinoflagellate symbionts and planktonic foraminiferal hosts. Mar. Ecol. Prog. Ser. 325, 59–71 (2006).
43. J. Decelle, New perspectives on the functioning and evolution of photosymbiosis in plankton: Mutualism or parasitism? Commun. Integr. Biol. 6, e24560 (2013).
44. R. Siano et al., Distribution and host diversity of Amoebophryidae parasites across oligotrophic waters of the Mediterranean Sea. Biogeosciences. 8, 267–278 (2011).
45. D. Coats, M. Park, Parasitism of photosynthetic dinoflagellates by three strains of Amoebophyra (Dinophyta): parasite survival, infectivity, generation time, and host specificity. J. Phycol. 528, 520–528 (2002).
16
46. K. E. Wommack, R. R. Colwell, Virioplankton: Viruses in Aquatic Ecosystems. Microbiol. Mol. Biol. Rev. 64, 69–114 (2000).
47. A. Skovgaard, Dirty Tricks in the Plankton: Diversity and Role of Marine Parasitic Protists. Acta Protozool., 51–62 (2014).
48. J. Bråte et al., Radiolaria associated with large diversity of marine alveolates. Protist. 163, 767–77 (2012).
49. T. R. Bachvaroff, S. Kim, L. Guillou, C. F. Delwiche, D. W. Coats, Molecular diversity of the syndinean genus Euduboscquella based on single-cell PCR analysis. Appl. Environ. Microbiol. 78, 334–45 (2012).
50. S. Rueckert, T. G. Simdyanov, V. V Aleoshin, B. S. Leander, Identification of a divergent environmental DNA sequence clade using the phylogeny of gregarine parasites (Apicomplexa) from crustacean hosts. PLoS One. 6, e18163 (2011).
51. A. Skovgaard, S. Karpov, L. Guillou, The Parasitic Dinoflagellates Blastodinium spp. Inhabiting the Gut of Marine, Planktonic Copepods: Morphology, Ecology, and Unrecognized Species Diversity. Front. Microbiol. 3, 305 (2012).
52. H. McCallum et al., Does terrestrial epidemiology apply to marine systems? Trends Ecol. Evol. 19, 585–591 (2004).
53. Companion website: Detailed Material and Methods, Database W9, Figure W11, (available at http://taraoceans.sb-roscoff.fr/EukDiv/).
54. Companion website: Figure W12, Figure W13, Database W7, Database W8, (available at http://taraoceans.sb-roscoff.fr/EukDiv/).
55. M. Holyoak, M. A. Leibold, R. D. Holt, Metacommunities: Spatial Dynamics and Ecological Communities (Chicago and London, The Univer., 2005).
56. L. G. M. Baas Becking, Geobiologie of inleiding tot de milieukunde (The Hague, the Netherlands: W.P. Van Stockum & Zoon, 1934).
57. K. T. C. a Peijnenburg, E. Goetze, High evolutionary potential of marine zooplankton. Ecol. Evol. 3, 2765–81 (2013).
58. V. Smetacek, The ocean’s veil. Nature. 419, 565 (2002). 59. H. ter Steege et al., Hyperdominance in the Amazonian tree flora. Science (80-. ). 342, 1243092
(2013). 60. D. Vaulot, K. Romari, F. Not, Are autotrophs less diverse than heterotrophs in marine
picoplankton%? 10, 266–267 (2002). 61. A. H. Knoll, Paleobiological perspectives on early eukaryotic evolution. Cold Spring Harb.
Perspect. Biol. 6, 1–14 (2014). 62. V. Smetacek, A watery arms race. Nature. 411, 745 (2001). 63. S. Sunagawa, T.-O. Consortium, Structure and function of the global ocean microbiome. Science
(80-. ). submitted (2014). 64. M. J. Oliver, D. Petrov, D. Ackerly, P. Falkowski, O. M. Schofield, The mode and tempo of
genome size evolution in eukaryotes. Genome Res. 17, 594–601 (2007). 65. H. Abida et al., Bioprospecting marine plankton. Mar. Drugs. 11, 4594–611 (2013). 66. G. Lima-Mendez, T.-O. Consortium, Top-down determinants of ocean plankton community
structure. Science (80-. ). submitted (2014). 67. K. D. Lafferty, A. P. Dobson, A. M. Kuris, Parasites dominate food web links. Proc. Natl. Acad.
Sci. U. S. A. 103, 11211–6 (2006). 68. L. Amaral-Zettler, E. McCliment, H. Ducklow, S. Huse, A method for studying protistan diversity
using massively parallel sequencing of V9 hypervariable regions of small-subunit ribosomal RNA genes. PLoS One. 4, e6372 (2009).
69. L. Guillou et al., The Protist Ribosomal Reference database (PR2): a catalog of unicellular eukaryote small sub-unit rRNA sequences with curated taxonomy. Nucleic Acids Res. 41, D597–604 (2013).
70. R. Massana, J. del Campo, M. E. Sieracki, S. Audic, R. Logares, Exploring the uncultured microeukaryote majority in the oceans: reevaluation of ribogroups within stramenopiles. ISME J. 8, 854–66 (2014).
71. Companion website: Database W4, Database W5, (available at http://taraoceans.sb-roscoff.fr/EukDiv/).
17
72. A. Godhe et al., Quantification of diatom and dinoflagellate biomasses in coastal marine seawater samples by real-time PCR. Appl. Environ. Microbiol. 74, 7174–82 (2008).
73. F. Zhu, R. Massana, F. Not, D. Marie, D. Vaulot, Mapping of picoeucaryotes in marine ecosystems with quantitative PCR of the 18S rRNA gene. FEMS Microbiol. Ecol. 52, 79–92 (2005).
74. Companion website: Text W2, Figure W3, (available at http://taraoceans.sb-roscoff.fr/EukDiv/). 75. M. Kim, S. Nam, W. Shin, D. W. Coats, M. Park, Dinophysis Caudata (dinophyceae) Sequesters
and Retains Plastids from the Mixotrophic Ciliate Prey Mesodinium Rubrum. J. Phycol. 48, 569–579 (2012).
Acknowledgements. We thank the commitment of the following people and sponsors: CNRS (in particular the GDR3280, EMBL, Genoscope/CEA, UPMC, VIB, Stazione Zoologica Anton Dohrn, UNIMIB, Rega Institute, KU Leuven; Fund for Scientific Research – The French Ministry of Research, the French Government 'Investissements d'Avenir' programmes OCEANOMICS (ANR-11-BTBR-0008), FRANCE GENOMIQUE (ANR-10-INBS-09-08), MEMO LIFE (ANR-10-LABX-54), PSL* Research University (ANR-11-IDEX-0001-02), ANR (projects POSEIDON/ANR-09-BLAN-0348, PROMETHEUS/ANR-09-PCS-GENM-217, PHYTBACK/ANR-2010-1709-01, TARA-GIRUS/ANR-09-PCS-GENM-218, EU FP7 (MicroB3/No.287589, IHMS/HEALTH-F4-2010-261376, ERC Advanced Grant Awards to CB (Diatomite:294823), GBMF grant #3790 to MBS, Spanish Ministry of Science and Innovation grant CGL2011-26848/BOS MicroOcean PANGENOMICS, and TANIT (CONES 2010-0036) grant from the AGAUR to SGA, JSPS KAKENHI Grant #26430184 to HO. We also thank the support and commitment of Agnès b., Etienne Bourgois, and Romain Troublé, Région Bretagne and Gilles Ricono, the Veolia Environment Foundation, Lorient Agglomération, World Courier, Illumina, the EDF Foundation, FRB, the Prince Albert II de Monaco Foundation, the Tara schooner and its captains and crew. We thank MERCATOR-CORIOLIS and ACRI-ST for providing daily satellite data during the expedition. We are also grateful to the French Ministry of Foreign Affairs for supporting the expedition and to the countries who graciously granted sampling permissions. Tara Oceans would not exist without continuous support from 23 institutes (http://oceans.taraexpeditions.org). We also acknowledge excellent assistance from EBI, in particular Guy Cochrane and Petra ten Hoopen, as well as the EMBL Advanced Light Microscopy Facility (ALMF), in particular Rainer Pepperkok. We thank Francoise Gaill, Bernard Kloareg, Francois Lallier, Demetrio Boltovskoy, Andy Knoll, Daniel Richter, and Emilie Médard, for their help and advice on the manuscript. The authors further declare that all data reported herein are fully and freely available from the date of publication, with no restrictions, and that all of the samples, analyses, publications, and ownership of data are free from legal entanglement or restriction of any sort by the various nations whose waters the Tara Oceans expedition sampled in. Data described herein is available at http://taraoceans.sb-roscoff.fr/EukDiv/, at EBI under the project ID PRJEB402 and PRJEB6610, and at PANGAEA (see Table S1). The data release policy regarding future public release of Tara Oceans data is described in Pesant et al. (12). All authors approved the final manuscript. This article is contribution number ZZZ of Tara Oceans. Supplement contains additional data. Tara Oceans Coordinators Silvia G. Acinas1, Peer Bork2, Emmanuel Boss3, Chris Bowler4, Colomban de Vargas5,6, Michael Follows7, Gabriel Gorsky8,9, Nigel Grimsley10,11, Pascal Hingamp12, Daniele Iudicone13, Olivier Jaillon14,15,16, Stefanie Kandels-Lewis2,17, Lee Karp-Boss3, Eric Karsenti4,17, Uros Krzic18, Fabrice Not5,6, Hiroyuki Ogata19, Stephane Pesant20,21, Jeroen Raes22,23,24, Emmanuel G. Reynaud25, Christian Sardet26,27, Mike Sieracki28, Sabrina Speich29,30, Lars Stemmann8, Matthew B. Sullivan31, Shinichi Sunagawa2, Didier Velayoudon32, Jean Weissenbach14,15,16, Patrick Wincker14,15,16
18
1Department of Marine Biology and Oceanography, Institute of Marine Science (ICM)-CSIC, Pg. Marítim de la Barceloneta, 37-49, Barcelona E08003, Spain.
2Structural and Computational Biology, European Molecular Biology Laboratory, Meyerhofstr. 1, 69117 Heidelberg, Germany.
3School of Marine Sciences, University of Maine, Orono, Maine, USA.
4Ecole Normale Supérieure, Institut de Biologie de l’ENS (IBENS), and Inserm U1024, and CNRS UMR 8197, Paris, F-75005 France.
5CNRS, UMR 7144, Station Biologique de Roscoff, Place Georges Teissier, 29680 Roscoff, France.
6Sorbonne Universités, UPMC Univ Paris 06, UMR 7144, Station Biologique de Roscoff, Place Georges Teissier, 29680 Roscoff, France.
7Dept of Earth, Atmospheric and Planetary Sciences, Massachusetts Institute of Technology, Cambridge, USA.
8CNRS, UMR 7093, LOV, Observatoire Océanologique, F-06230, Villefranche-sur-mer, France. 9Sorbonne Universités, UPMC Univ Paris 06, UMR 7093, LOV, Observatoire Océanologique, F-06230, Villefranche-sur-mer, France. 10CNRS UMR 7232, BIOM, Avenue du Fontaulé, 66650 Banyuls-sur-Mer, France.
11Sorbonne Universités Paris 06, OOB UPMC, Avenue du Fontaulé, 66650 Banyuls-sur-Mer France.
12Aix Marseille Université CNRS IGS UMR 7256 13288 Marseille France.
13Stazione Zoologica Anton Dohrn, Villa Comunale, 80121, Naples, Italy.
14CEA - Institut de Génomique, GENOSCOPE, 2 rue Gaston Crémieux, 91057 Evry, France. 15CNRS, UMR 8030, CP5706, Evry France.
16Université d'Evry, UMR 8030, CP5706, Evry France.
17Directors’ Research, European Molecular Biology Laboratory, Meyerhofstr. 1, 69117 Heidelberg, Germany.
18Cell Biology and Biophysics, European Molecular Biology Laboratory, Meyerhofstr. 1, 69117 Heidelberg, Germany.
19Institute for Chemical Research, Kyoto University, Gokasho, Uji, Kyoto, 611-001, Japan.
20PANGAEA, Data Publisher for Earth and Environmental Science, University of Bremen, Bremen, Germany.
21MARUM, Center for Marine Environmental Sciences, University of Bremen, Bremen, Germany. 22Department of Microbiology and Immunology, Rega Institute, KU Leuven, Herestraat 49, 3000 Leuven, Belgium. 23Center for the Biology of Disease, VIB, Herestraat 49, 3000 Leuven, Belgium. 24Department of Applied Biological Sciences, Vrije Universiteit Brussel, Pleinlaan 2, 1050 Brussels, Belgium. 25Earth Institute, University College Dublin, Dublin, Ireland.
26CNRS, UMR 7009 Biodev, Observatoire Océanologique, F-06230 Villefranche-sur-mer, France. 27Sorbonne Universités, UPMC Univ Paris 06, UMR 7009 Biodev, F-06230 Observatoire Océanologique, Villefranche-sur-mer, France.
28Bigelow Laboratory for Ocean Sciences, East Boothbay, USA. 29Department of Geosciences, Laboratoire de Météorologie Dynamique (LMD), Ecole Normale Supérieure, 24 rue Lhomond 75231 Paris Cedex 05 France.
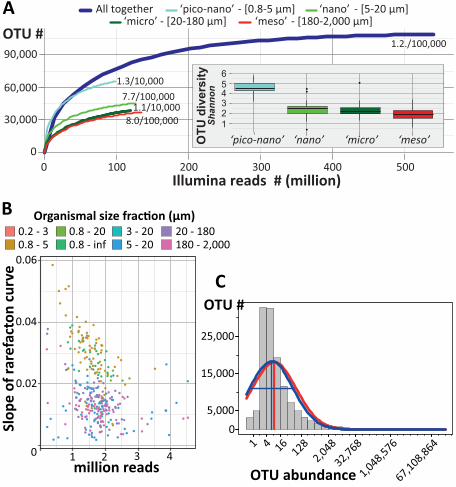
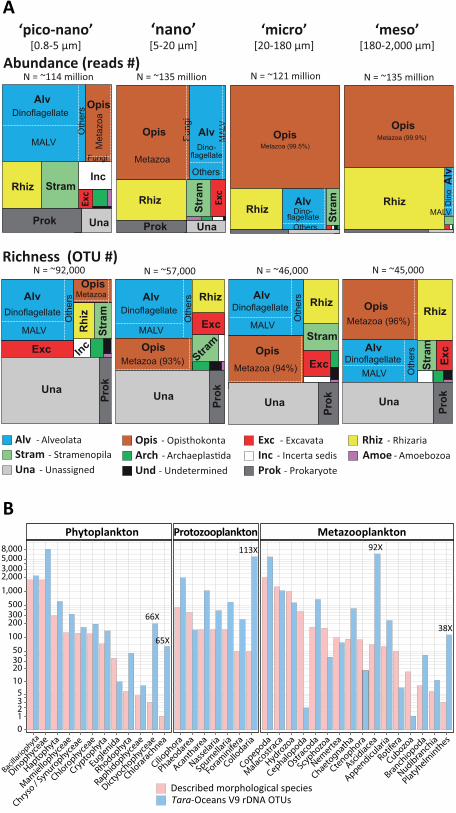
30Laboratoire de Physique des Océan UBO-IUEM Palce Copernic 29820 Polouzané, France. 31Department of Ecology and Evolutionary Biology, University of Arizona, 1007 E Lowell Street, Tucson, AZ, 85721, USA. 32DVIP Consulting, Sèvres, France. Fig. 1: Photic-zone eukaryotic plankton ribosomal diversity. A. V9 rDNA OTUs rarefaction curves and overall diversity (Shannon index, inset) for each plankton organismal size fraction. Proximity to saturation is indicated by weak slopes at the end of each rarefaction curve (e.g. 1.2/100,000 means 1.2 novel metabarcodes obtained every 100,000 rDNA reads sequenced). B. Saturation slope versus number of V9 rDNA reads for all of the 334 samples (dots) analyzed herein; a slope of 0.02 indicates that 2 novel barcodes can be recovered if 100 new reads are sequenced. Samples are colored according to size-fraction. C. Global OTU-abundance distribution and fit to the Preston log-normal model. Most OTUs in our dataset were represented by 3 to 16 reads, while fewer OTUs presented less or more abundances. Quasi-Poisson fit to octaves (red curve) and maximized likelihood to log2 abundances (blue curve) approximations were used to fit the OTU-abundance distribution to the Preston log-normal model. Overall, the global (A) and local (B) saturation values indicate that our extensive sampling effort -in terms of spatio-temporal coverage and sequencing depth- uncovered the majority of eukaryotic ribosomal diversity within the photic layer of the world tropical to temperate oceans. Calculation of the Preston Veil, which infers the number of OTUs that we missed (or were veiled) during our sampling (~40,000), confirmed that we captured most of protistan richness, thus allowing extraction of holistic and general patterns of eukaryotic plankton biodiversity from our dataset. Fig. 2: Unknown and known components of eukaryotic plankton biodiversity. A. Phylogenetic breakdown of the entire metabarcoding dataset at the eukaryotic supergroup level. All Tara Oceans V9 rDNA reads and OTUs were classified amongst the 7 recognized eukaryotic supergroups plus the known but unclassified deep-branching lineages (Incerta sedis). The treemaps display the relative abundance (upper part) and richness (lower part) of the different eukaryotic supergroups in each organismal size
19
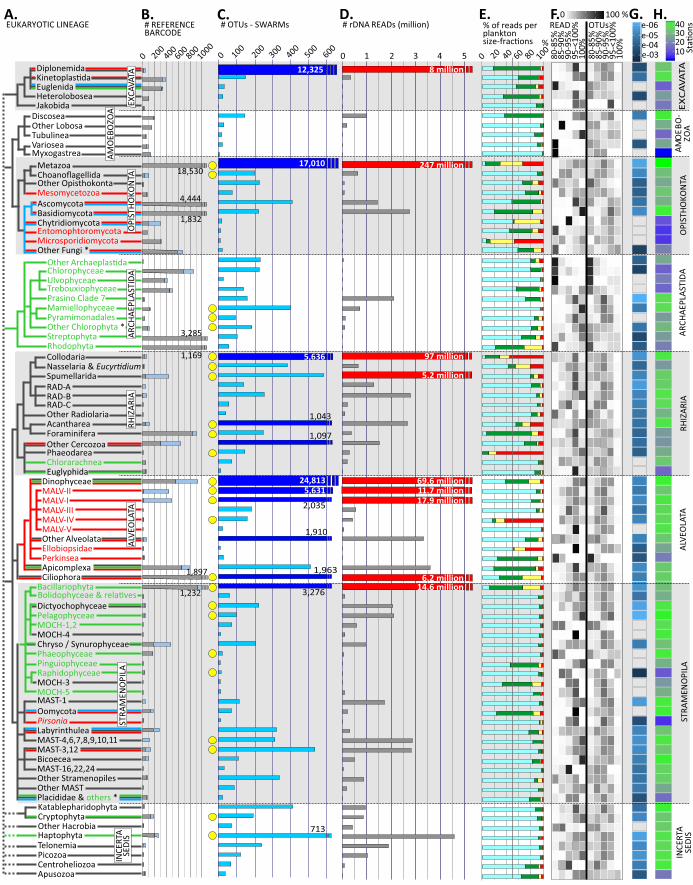
fraction. Note that ~5% of barcodes were assigned to prokaryotes, essentially in the "pico-nano" fraction, witnessing the universality of the eukaryotic primers used. Barcodes are "unassigned' when sequence similarity to a reference sequence is <80%, and "undetermined" when eukaryotic supergroups could not be discriminated (at similarity >80%). B. Ribosomal DNA diversity associated with the morphologically known and catalogued part of eukaryotic plankton. The total number of morphologically described species in the literature (red bars, based on (25–27)) and the corresponding total number of Tara Oceans V9 rDNA OTUs (blue bars) are indicated for each of the 35 classical lineages of eukaryotic phyto-, protozoo-, and metazoo- plankton. The 5 classical groups that were found to be significantly more diverse than previously thought (from 38 to 113-fold more OTUs than morphospecies) are highlighted. Note that in the classical, morphological view, phyto- and metazoo- plankton comprise ~88% of total eukaryotic plankton diversity. Fig. 3: Phylogenetic distribution of the assignable component of eukaryotic plankton ribosomal diversity. A. Schematic phylogeny of the 85 deep-branching eukaryotic lineages represented in our global-oceans metabarcoding dataset, with broad ecological traits based on current knowledge: red = parasitic; green = photoautotrophic; blue = osmo/saprotrophic; black = mostly hetero/phagotrophic lineages. Lineages known only from environmental sequence data were colored in black by default. For simplicity, 3 branches (*) artificially group a few distinct lineages (details in (15). B. Number of reference V9 rDNA barcodes used to annotate the metabarcoding dataset (grey = with known taxonomy at the genus and/or species level; light blue = from previous 18S rDNA environmental clone libraries). C. Tara Oceans V9 rDNA OTU richness; the dark-blue thicker bars indicate the 11 hyper-diverse lineages containing >1,000 OTUs. Yellow circles highlight the 25 lineages that have been recognized as significant in previous marine plankton biodiversity and ecology studies using morphological and/or molecular data (see also (15)). D. Eukaryotic plankton abundance expressed as numbers of rDNA reads (the red bars indicate the 9 most abundant lineages with >5 million reads). E. Proportion of rDNA reads per organismal size fraction, with light blue = piconano-; green = nano-; yellow = micro-; red = meso-plankton. F. Percentage of reads and OTUs with [80-85%], [85-90%], [90-95%], [95-<100%], [100%] sequence similarity to a reference sequence. G. Slope of OTU rarefaction curves. H. Mean geographic occupancy (average number of stations in which OTUs were observed, weighted by OTU abundance).
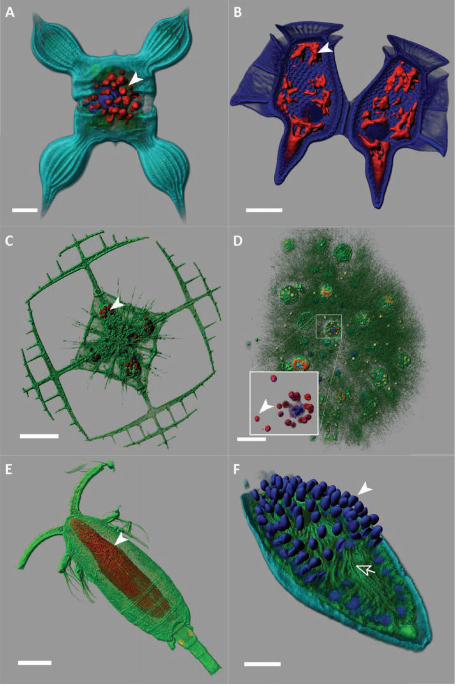
Fig. 4: Illustration of key eukaryotic plankton lineages. A. Stramenopila; a phototrophic diatom Chaetoceros bulbosus, with its chloroplasts in red (scale bar 10µm). B. Alveolata; a heterotrophic dinoflagellate Dinophysis caudata harboring kleptoplasts (in red, arrow head, scale bar 20µm (75)). C. Rhizaria; an acantharian Lithoptera sp. with endosymbiotic haptophyte cells from the genus Phaeocystis (in red, arrow head, scale bar 50µm (41)). D. Rhizaria; inside a colonial network of Collodaria, a cell surrounded by several captive dinoflagellate symbionts of the genus Brandtodinium (arrow head, scale bar 50µm (33)). E. Opisthokonta; a copepod whose gut is colonized by the parasitic dinoflagellate Blastodinium (red area are nuclei, arrow head, scale bar 100µm (51)). F. Alveolata; a cross-sectioned, dinoflagellate cell infected by the parasitoid alveolate Amoebophrya (MALV II). Each blue spot (arrow head) is the nucleus of future free-living dinospores; their flagella are visible in green inside the mastigocoel cavity (arrow) (scale bar 5µm). The cellular membranes were stained with DiOC6 (green), DNA and nuclei with Hoechst (blue) (the dinoflagellate theca in B was also stained by this dye), chlorophyll autofluorescence is shown in red (excepted for E), an unspecific fluorescent painting of the cell surface (cyan) was used to reveal cell shape for A and F. All specimens come from Tara Oceans samples preserved for confocal laser scanning fluorescent microscopy. Images were 3D reconstructed with Imaris (Bitplane). Fig. 5: Metabarcoding inference of trophic and symbiotic ecological diversity of photic-zone eukaryotic plankton. A. Richness (OTU number) and abundance (read number) of rDNA metabarcodes assigned to various trophic taxo-groups across plankton organismal size fractions and stations. Note that the nano- size fraction contained too scarce data to be used in this biogeographical analysis (for all size-fractions data, see (30). B. Relative abundance of major eukaryotic taxa across Tara Oceans stations for: (i) phytoplankton and all eukaryotes in piconano-plankton (above the map); (ii) all eukaryotes and symbiotic, sensu lato, protists in meso-plankton (below the map). Note the pattern of inverted relative abundance
20
between between collodarian colonies (Fig. 4) and copepods in respectively the oligotrophic and eu/meso-trophic systems. The dinoflagellates Brandtodinium and Pelagodinium are endophotosymbionts in Collodaria (33) and Foraminifera (40, 42), respectively. C. Richness and abundance of parasitic and photosymbiotic (microalgae) protists across organismal size fractions. The relative contribution (%) of parasites to total heterotrophic protists, and photosymbionts to total phytoplankton, are indicated above each symbol. Figure 6: Community structuring of eukaryotic plankton across temperate and tropical sunlit oceans. A. Grouping of local communities according to taxonomic compositional similarity (Bray-Curtis distances) using Non-linear Multi-Dimensional Scaling. Each symbol represents one sample or eukaryotic community, corresponding to a particular depth (shape) and organismal size fraction (color). B. Same as in A., but the different plankton organismal size-fractions were analyzed independently and communities are distinguished by depth (shape) and ocean basins’ origin (color). An increasing geographic community differentiation along increasing organismal size-fractions is visible and confirmed by Mantel test (p-value = 10-3, Rm=0.36, 0.49, 0.50, 0.51 for the highest, piconano- to meso-plankton correlations in Mantel correlograms; see also (54)). In addition, samples from the piconano-plankton only were discriminated by depth (Surface vs. DCM; p-value=0.001, r2 =0.2). The higher diversity and abundance of eukaryotic phototrophs in this fraction (Fig. 5A) may explain overall community structuring by light, and thus depth. Figure 7. Cosmopolitanism and abundance of eukaryotic marine plankton. A. Occurrence/Abundance (x/y axis) plot including the ~110,000 Tara Oceans V9 rDNA OTUs. OTUs are colored according to their identity with reference sequence, and a fitted curve indicates the median OTU size value for each OTU geographic occurrence value. The red rectangle encloses the cosmopolitan and hyper-dominant (>105 reads) OTUs. B. Similarity to reference barcode and taxonomic purity (a measure of taxonomic assignment consistency defined as the % of reads within an OTU assigned to the same taxon; see (13)) of the 381 cosmopolitan OTUs, along their abundance (y axis). Supplementary Materials: Table S1, list of samples analyzed.