Embed Size (px)
Citation preview

Data Monitoring and Adaptive Designs: Reflections, Controversies and Future Directions Stuart Pocock London School of Hygiene and Tropical Medicine
1

Statistician’s Role in Data Monitoring Statistical Stopping “Rules” are not rules! They are guidelines: an objective aid to DSMB wise judgement often guidelines for primary endpoint only:
stopping for efficacy, harm or futility DSMB uses totality of evidence:
primary, secondary and safety issues also external evidence (from other trials)
DSMB makes recommendations re stopping statistical guidelines ⇒ ethical needs
2
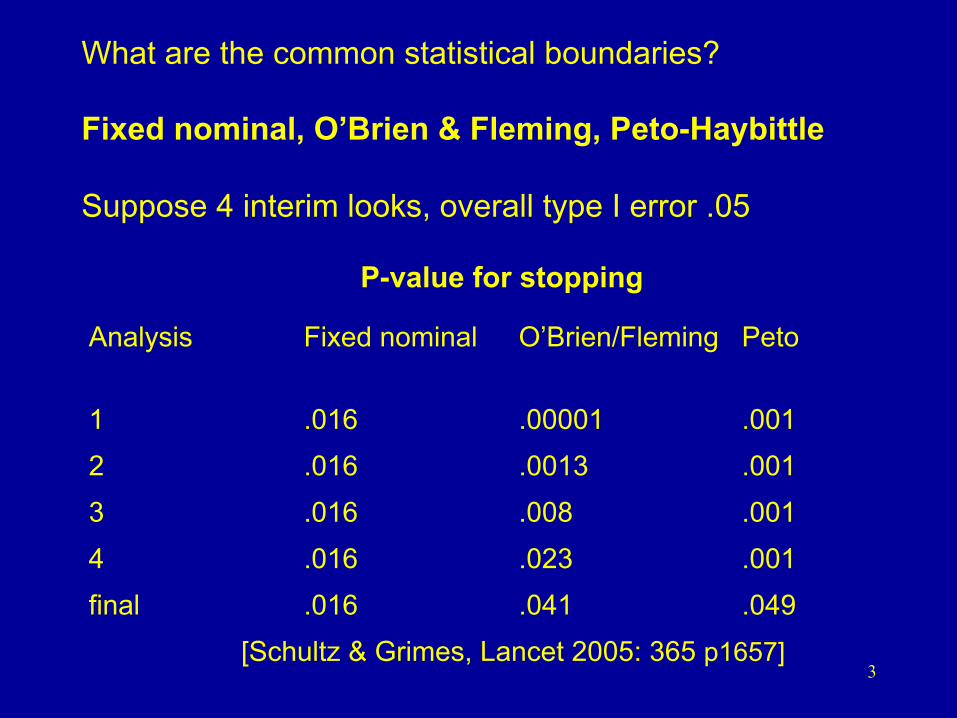
What are the common statistical boundaries? Fixed nominal, O’Brien & Fleming, Peto-Haybittle Suppose 4 interim looks, overall type I error .05
P-value for stopping
Analysis Fixed nominal O’Brien/Fleming Peto
1 .016 .00001 .001 2 .016 .0013 .001 3 .016 .008 .001 4 .016 .023 .001 final .016 .041 .049
[Schultz & Grimes, Lancet 2005: 365 p1657] 3
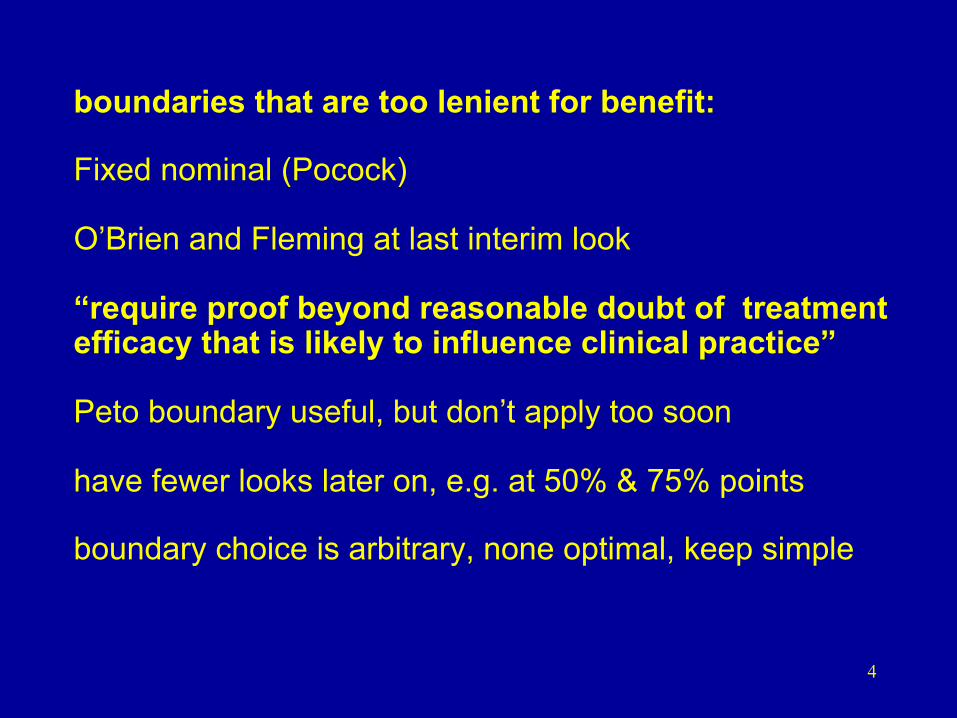
boundaries that are too lenient for benefit: Fixed nominal (Pocock) O’Brien and Fleming at last interim look “require proof beyond reasonable doubt of treatment efficacy that is likely to influence clinical practice” Peto boundary useful, but don’t apply too soon have fewer looks later on, e.g. at 50% & 75% points boundary choice is arbitrary, none optimal, keep simple
4

Lan & DeMets α spending function allows more flexibility, analyse data when you like monotonically increasing function α* (t) where t = proportion of data in trial so far α* (0) = 0 α* (1) = α eg. α* (t) = 2 – 2Ф(zα/2 / )
save most of α to the end, like O’Brien & Fleming
specify α* (t) and when analyses to occur obtain p-values for stopping at each analysis flexibility is more complex
t
5

SHIFT trial [Lancet online Aug 29, 2010] ivabradine vs placebo in 6558 heart failure patients second planned interim efficacy analysis June 2009 primary endpoint: CV death and CHF hospn hazard ratio 0.77 P<.0001 all cause death hazard ratio 0.77 P=.0014 DMC decided not to recommend stopping early: previous BEAUTIFUL trial “negative”, beta-blocker use issues, only a few months to go, event validation issues
Final Results: primary endpoint hazard ratio 0.82 P<.0001 all cause death hazard ratio 0.90 P=.092 6
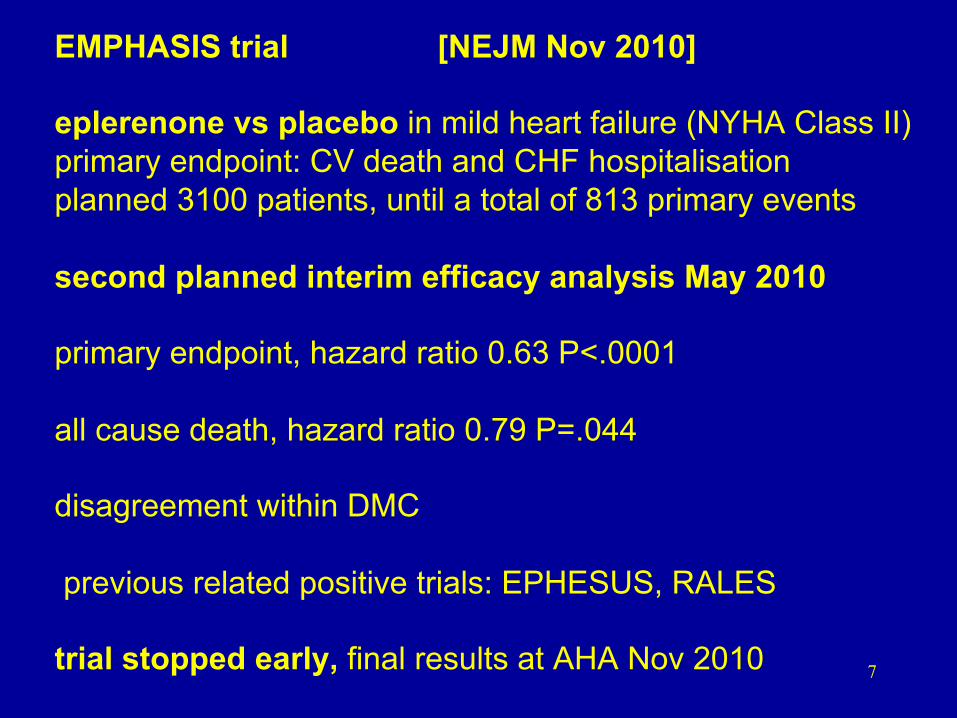
EMPHASIS trial [NEJM Nov 2010] eplerenone vs placebo in mild heart failure (NYHA Class II) primary endpoint: CV death and CHF hospitalisation planned 3100 patients, until a total of 813 primary events second planned interim efficacy analysis May 2010 primary endpoint, hazard ratio 0.63 P<.0001 all cause death, hazard ratio 0.79 P=.044 disagreement within DMC previous related positive trials: EPHESUS, RALES trial stopped early, final results at AHA Nov 2010
7

Stopping a trial too early : beware amiodarone vs placebo in heart failure [Lancet Aug ‘94] 87/260 106/256 deaths P= .022 at second interim analyses stopped too early and published stopping on a “random high”, regression to the truth risk of false positive, exaggerated effects trials stopped early: too good to be true
[Lancet 1999, 353 p 943-] when (not) to stop a trial for benefit
[JAMA 2005; 294 p 2228-] 8

Statistical Guidelines for Harm Primary endpoint (and all cause death?) If pre-licencing:
more frequent looks more lenient boundary, eg P<.01, fixed nominal
If treatments in widespread use: eg post-licencing safety trial same guidelines as for efficacy (symmetry) stop early ⇒ change to common practice
unexpected safety issues (SAEs): multiplicity, tough “clear, consistent and persistent evidence of net harm that overwhelms any benefit”?
9

PALLAS trial stopped early for harm Dronedarone vs Placebo in permanent atrial fibrillation Results as of June 30, 2011 when to stop? risk of over-reaction? eg. Heart. Org: “Deaths doubled with dronedarone”! await final data, EMA’s quick response
Placebo N=1577
Dronedarone N=1572
Hazard Ratio P
CV death, MI, stroke and systemic embolism
14 32 2.31 (1.23, 4.32) .009
Death, unplanned CV hospn. 81 118 1.49 (1.12, 1.97) .006
Death 7 16 2.31 (0.95, 5.61) .065
Heart Failure hospn. 15 34 2.29 (1.8, 4.20) .008
10

Stopping Guidelines for Futility stop early due to lack of efficacy one (or two) looks with substantial data 1) Conditional Power, given results so far what’s the chances of P<.05 at the end? 2) Confidence Interval, does the CI already exclude the minimum clinically important benefit? sponsors differ re wish for futility boundary stop for futility ⇒ end of new treatment
11

Stopping for Futility PERFORM trial terutroban vs aspirin for 18,976 stroke/TIA patients primary endpoint: ischaemic stroke, MI, CV death 20th interim Safety report Oct 2009 1908 primary endpoints, hazard ratio 1.04 (95% CI 0.95 to 1.13) Futility stopping guideline: CI excludes 7% benefit DSMB recommend trial stop for futility published in Lancet May 2011
12

Data Monitoring Committees When Needed Meetings Responsibilities Interim Reports Composition Decision Making Independence Interactions with Others Confidentiality Statistics, Philosophy, Ethics
Regulatory issues
All Documented in DMC Charter
13

Adaptive Designs for Clinical Trials unblinded interim results of ongoing trial
⇓ change some aspect of the trial design according to a pre-planned Adaptive Charter flexibility appeals to trial sponsors but breaks with convention need to preserve statistical rigour
and trial’s integrity
14

Types of Adaptive Design
After unblinded interim analysis: Increase sample size
sample size re-estimation Drop treatment arms/doses
seamless phase II/III Change entry criteria
enrichment design
Change randomization ratio play the winner
Change primary endpoint
challenging! 15

EMA Reflection Paper on Adaptive Designs Oct 2007
“to modify design of ongoing Phase III trial is a contradiction to its confirmatory nature” “rarely acceptable without further justification”
“adaptive designs should not alleviate rigorous planning” “best for difficult experimental situations” “ensure different stages can be justifiably combined” FDA Draft Guidance on Adaptive Designs Feb 2010
16

Sample Size Re-estimation (Non-Adaptive) DMC should not be involved best done by Trial Executive/Sponsor based on overall (blinded) outcome data no statistical penalty DMC Charter/monitoring plans affected
17

Adaptive Sample Size Re-estimation planned unblinded interim analysis if observed treatment difference somewhat less than expected, increase trial size conditional power calculation: eg. choose new size to achieve (say) 90% chance of eventual P<.05, assuming observed interim difference is the truth calculate CP(N) = power to achieve p<.05 with sample size N, conditional on estimated difference choose new N* so that CP(N*) = 90% (say) N* has an upper limit Nmax 18

Conceptual Outline of the Adaptive Options at a Planned Interim Analysis Interim Difference Decision → Amazing Stop now for efficacy Favorable Continue to original N, CP(N) > 90% ⇒ Hopeful Extend to new N* so that CP(N*)=90%(say) ⇒ Not brilliant Extend to Nmax so that P(Nmax)>30%(say) Disappointing Continue to original N → Hopeless Stop now for futility or harm → conventional data monitoring boundaries (optional) ⇒ adaptive options 19

CHAMPION trial uses adaptive design
cangrelor vs clopidogrel in 8750 ACS patients
primary endpoint: death, MI, revasc. at 48 hrs
interim analysis after 70% evaluated
5 options: stop early for efficacy
proceed to N = 8750 if ≥ 80% conditional power
expand up to N = 15000 to have 80% CP*
proceed to N = 8750 if less promising
stop early for futility if < 20% CP
*also enrich to high-risk (or also plavix naive only) if interaction
detailed adaptive charter approved by FDA
[Mehta et al Circulation 2009]
20
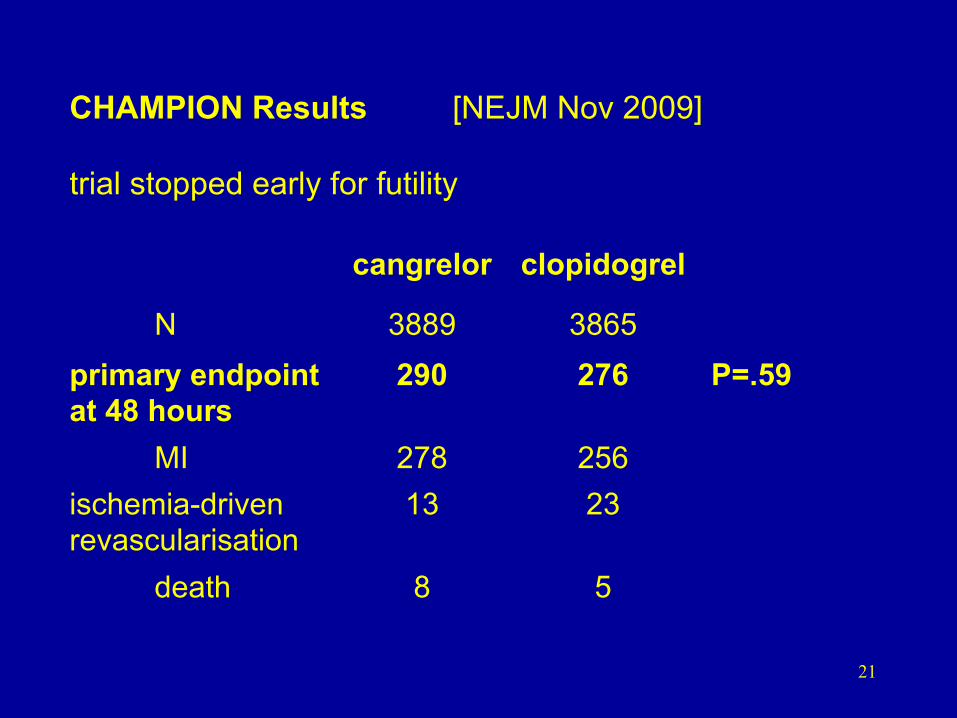
CHAMPION Results [NEJM Nov 2009] trial stopped early for futility
cangrelor clopidogrel
N 3889 3865 primary endpoint at 48 hours
290 276 P=.59
MI 278 256 ischemia-driven revascularisation
13 23
death 8 5
21

Active Drug vs Placebo in Schizophrenia [Mehta and Pocock, Stats in Med 2011]
primary endpoint: change in symptom score at 26 weeks planned size N = 442 patients δ = 2, σ = 7.5 2α = .05 80% power interim analysis: NI = 208 patients with 26 week outcome timed so that planned recruitment not yet complete sponsor sets Nmax = 884 no early stopping at N = 208 22

The Adaptive Design Specifications planned N = 442, δ = 2 = estimate of δ at NI = 208 calculate conditional CP(N) assuming true δ = 1) if CP(N) > 80%, continue to N = 442 2) if CP(N) lies between 36% and 80% interim outcome is deemed promising: extend to N* so that CP(N*) = 80% if N* exceeds 882, extend to Nmax = 882 instead 3) if CP(N) < 36%, continue to N = 442
δ̂
δ̂
23
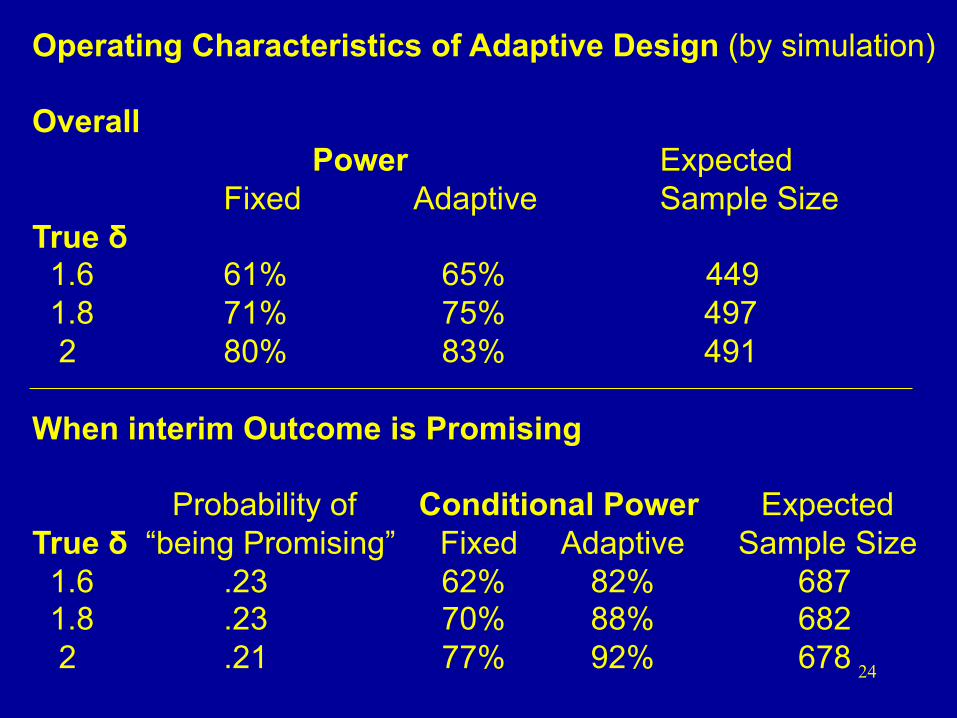
Operating Characteristics of Adaptive Design (by simulation) Overall
Power Expected Fixed Adaptive Sample Size
True δ 1.6 61% 65% 449 1.8 71% 75% 497 2 80% 83% 491 When interim Outcome is Promising
Probability of Conditional Power Expected True δ “being Promising” Fixed Adaptive Sample Size 1.6 .23 62% 82% 687 1.8 .23 70% 88% 682 2 .21 77% 92% 678 24

Conceptual Outline of Adaptive Design: nmax/n2 = 2, n1/n2 = 0.5, 2α = .05, 1-β = 0.9
25

Statistical Penalty for Sample Size Re-estimation? Cui et al [Biometrics ’99; 55 p853] “Increasing sample size based on interim treatment difference can substantially inflate type I error in most practical situations” give less weight to later data? illogical Chen et al [Stats in Med ’04 ; 23 p 1023] “Increasing sample size when unblinded interim result is promising will not inflate type I error. No statistical adjustment required” Who is right? 26

No inflation of type I error if: 1) Only increase sample size when conditional power at interim analysis already exceeds around 30% to 40% and/or 2) One stops for futility at interim analysis if conditional power is less than 10%
27

Adaptive Design vs Group Sequential Design adaptive: start smaller, expand if need to group sequential: plan big, stop early if “good news” group sequential is more statistically efficient? [Jennison and Turnbull Stats in Med 2006; 25 p917-] group sequential requires greater up-front commitment has overrun problems if outcome is long term debate in Statistics in Medicine 2011: Mehta and Pocock vs Emerson et al
28

Practicalities of the Adaptive Approach seek regulatory approval, show statistical rigor who sees unblinded data and decides:
Expert Panel (may be DMC or different) sponsor stays blinded throughout? If algorithm known, others can infer (guess) interim results risk of wider unblinding re: investigators, sponsor, investment analysts etc
could the trial itself be compromised?
29

Seamless Phase II/III Trials INHANCE trial: indacaterol in COPD patients Stage I (N = 115 per group, 7 groups) 75, 150, 300, 600 µg indacaterol vs placebo vs formoterol vs tiotropium 2 week efficacy outcome, which two doses proceed to Stage 2? Stage 2 (N=285 per group, 4 groups) dose A, dose B, placebo, tiotropium 26 week efficacy and safety
30

N=115 per group N=285 +115 per group 2 weeks efficacy 26 weeks efficacy and safety
Seamless Phase II/III trial: INHANCE in COPD
31

0
50
100
150
200
250
300
Interim analysis dataset (N=748)
Day 15 Trough FEV1
75 150 300 600 For Tio
Diff
eren
ce fr
om p
lace
bo (m
L)
Indacaterol doses (µg) Active Control
150
180
210
200
110
140
Dose Selection based on Short-Term Efficacy Criteria
32

INHANCE findings accepted by EMA, but not FDA [Barnes et al Pulm. Pharm and Therap 2010]
Statistical Adjustment Bonferroni, ie α/4 for each dose vs placebo, active control merit of simplicity, but too conservative? Advantages of Seamless Phase II/III use all data on doses selected gain in power, overall speed 33

Enrichment design unblinded interim subgroup analyses restrict recruitment to “promising subgroups” pre-define which subgroups & restriction criteria but subgroup analyses (at interim) lack power seriously avoid this one? exceptions: distinct disease types, genetic markers
34

AMIHOT trials intracoronary supersaturated oxygen therapy vs control after PCI in acute MI primary outcome: infarct size % AMIHOT I overall [N = 269 patients]
medians 11% vs 13% P = 0.6 Subgroup: anterior MI, treated within 6 hours [N = 105]
medians 9% vs 23% P = 0.07 AMIHOT II, only in subgroup [N = 301, 3 : 1 randomisation]
medians 20% vs 26.5% P = 0.10 “squeezing” the combined data Bayesian P =
0.023 35

Adaptive Designs are Intuitively Appealing, But…. Flexibility Lack of rigour Efficiency Too much haste Methodological stimulus Useless theoretical fun? Some adaptive ideas workable, others not for each application: attention to details
statistical rigour practical implementation avoidance of bias
Learn from real experiences
36
do adaptive designs show inconsistency in approach? Oscar Wilde “Consistency is the last refuge of the unimaginative” Aldous Huxley “Consistency is contrary to nature, contrary to life. The only completely consistent people are dead.”
37


![POCOCK[1]. the Transformation of Humanism](https://img.pdfslide.us/doc/110x75/577cde4d1a28ab9e78aed930/pocock1-the-transformation-of-humanism.jpg)