Embed Size (px)
Citation preview
FACT SHEET
The most reliable method for quantifying the pharmacodynamic properties of a new insulin preparation (onset of action; peak action; end of glucose-lowering action) is the euglycemic glucose clamp technique. Glucose is infused intravenously at a variable rate to maintain blood glucose at euglycemia following the administration of the test insulin preparation. Most often this will be a subcutaneous injection but the technique is adaptable for insulin delivered by other routes, e.g. pulmonary insulin, oral insulin. Clamp-derived time-action profiles are mandated by US and European regulators for market approval of new insulins and biosimilar insulins.
Subjects and Preparation
Subjects are studied in the fasting state. Admission to the clinical research facility prior to the clamp procedure helps ensure compliance with nutrition and exercise prescriptions and helps acclimate the subject to the clinical research environment. For patients with diabetes, an overnight intravenous infusion may be used to standardize blood glucose levels on the morning of the clamp procedure. The absence of endogenous insulin secretion in subjects with type 1 diabetes may be confirmed by prior measurement of stimulated C-peptide levels.
Procedure
Time-action euglycemic clamp studies can be performed manually or automatically using either a Biostator® or ProSciento’s second-generation semi-automated glucose clamp technology. Automated and semi-automated clamps utilize a validated algorithm to calculate the variable glucose infusion rate required to maintain blood glucose at the target concentration. This approach reduces the operator-dependency intrinsic to manual clamps. An arm vein is cannulated for the infusion of glucose. Another venous cannula is placed in the contralateral forearm for sampling of arterialized blood. Since the exogenous glucose requirement is influenced by the target value of blood glucose should be identical in all experiments, typically 90 mg/dL (5 mmol/L). A decline of blood glucose levels to hypoglycemic levels must be avoided since this will stimulate release of counterregulatory hormones (catecholamines, glucagon, growth hormone) that antagonize insulin action. In healthy subjects and subjects with type 2 diabetes a decline in the serum C-peptide concentrations demonstrates suppression of endogenous insulin secretion. For studies in healthy subjects a target blood glucose concentration may be set below the individual’s fasting glucose concentration in order to suppress endogenous insulin secretion during the clamp (see Example Data). In studies in which a basal insulin infusion is used to suppress endogenous insulin secretion in healthy volunteers this must be subtracted, either directly or after fitting a mathematical function.
Advantages of the Automated Euglycemic Clamp
• Closed-loop system with algorithm-driven glucose infusion reduces operator dependency and potential for bias
• Suitable for assessment of insulins ranging from ultra-rapid insulin analogs to ultra-long-acting basal insulin preparations
• Accurate measure of key measure of insulin action
• Sensitive and reproducible; co-efficient of variation of blood glucose <5% (see Key Variability Measures)
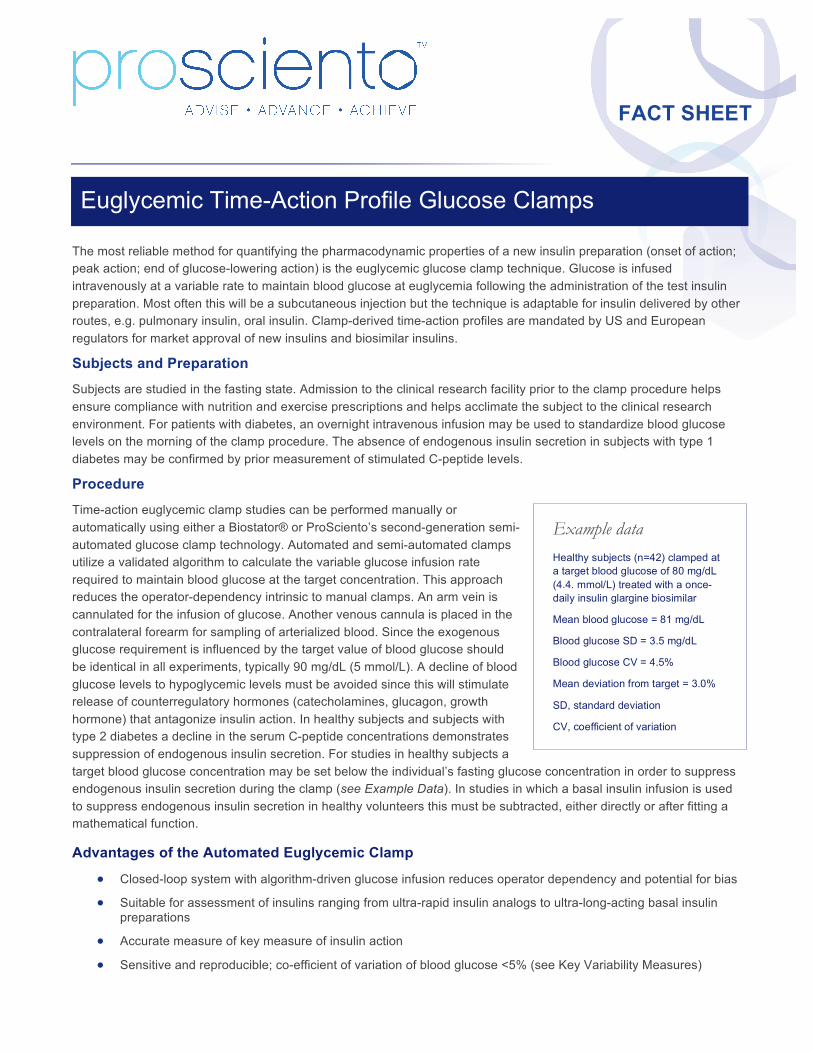
Euglycemic Time-Action Profile Glucose Clamps
Example data Healthy subjects (n=42) clamped at a target blood glucose of 80 mg/dL (4.4. mmol/L) treated with a once-daily insulin glargine biosimilar
Mean blood glucose = 81 mg/dL
Blood glucose SD = 3.5 mg/dL
Blood glucose CV = 4.5%
Mean deviation from target = 3.0%
SD, standard deviation
CV, coefficient of variation
About ProSciento Methodology Fact Sheets Each fact sheet describes one select technique from our wide scope of complex methodologies for metabolic clinical research. Contact us for fact sheets highlighting additional techniques.
Contact Us Business Development and Scientific Services US and Canada toll free +1 (866) 245-5445 International +1 (619) 419-2038 [email protected] www.prosciento.com
ProSciento, Inc. 855 3rd Avenue Suite 3340 Chula Vista, CA 91911. USA © 2017 ProSciento, Inc.
Interpretation
Pharmacokinetics - In order to measure pharmacokinetic (PK) parameters insulin concentrations are determined by means of assays utilizing antibodies that recognize specific amino acid sequences (epitopes) of the test insulin molecule. Summary pharmacokinetic measures typically obtained from time-action profile clamps include:
Cbasal Basal insulin concentration
Cmax Maximal concentration Tmax Time at which maximal
concentration is attained
AUC0-T Area under curve during a specified time period
Pharmacodynamics - The GIR represents the difference between peripheral glucose utilization (predominantly in skeletal muscle) and endogenous (primarily hepatic) glucose production resulting from the prevailing blood insulin level at the specific times after insulin delivery. If required, e.g. for a putative hepatoselective insulin, the proportion of endogenous glucose production can be quantified by measurement of glucose turnover using stable (non-radioactive) isotopes. Summary pharmacodynamics (PD) may include:
GIRmax Maximal glucose infusion rate (peak action)
AUC0-∞ Area under the action profile for the entire duration of action
Early/Late t50% Time points at which the first or second half of GIRmax is attained
AUC0-T Area under curve for insulin action during a specified time period
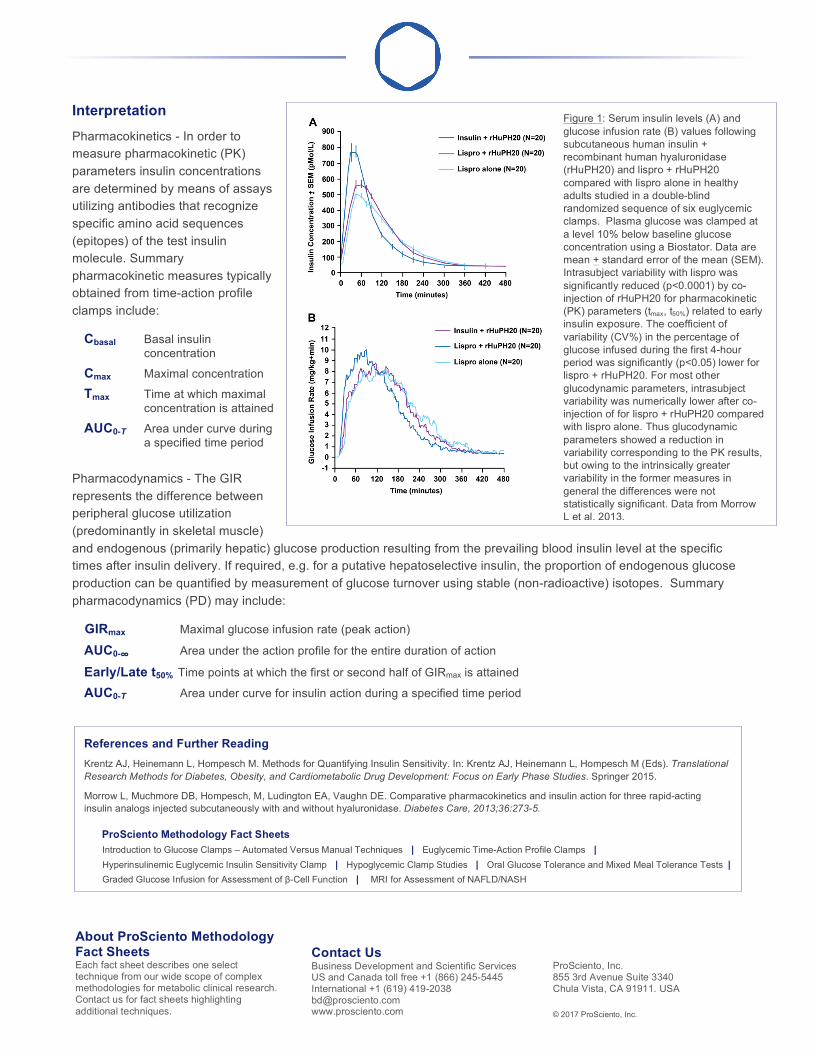
Figure 1: Serum insulin levels (A) and glucose infusion rate (B) values following subcutaneous human insulin + recombinant human hyaluronidase (rHuPH20) and lispro + rHuPH20 compared with lispro alone in healthy adults studied in a double-blind randomized sequence of six euglycemic clamps. Plasma glucose was clamped at a level 10% below baseline glucose concentration using a Biostator. Data are mean + standard error of the mean (SEM). Intrasubject variability with lispro was significantly reduced (p<0.0001) by co-injection of rHuPH20 for pharmacokinetic (PK) parameters (tmax, t50%) related to early insulin exposure. The coefficient of variability (CV%) in the percentage of glucose infused during the first 4-hour period was significantly (p<0.05) lower for lispro + rHuPH20. For most other glucodynamic parameters, intrasubject variability was numerically lower after co-injection of for lispro + rHuPH20 compared with lispro alone. Thus glucodynamic parameters showed a reduction in variability corresponding to the PK results, but owing to the intrinsically greater variability in the former measures in general the differences were not statistically significant. Data from Morrow L et al. 2013.
References and Further Reading Krentz AJ, Heinemann L, Hompesch M. Methods for Quantifying Insulin Sensitivity. In: Krentz AJ, Heinemann L, Hompesch M (Eds). Translational Research Methods for Diabetes, Obesity, and Cardiometabolic Drug Development: Focus on Early Phase Studies. Springer 2015.
Morrow L, Muchmore DB, Hompesch, M, Ludington EA, Vaughn DE. Comparative pharmacokinetics and insulin action for three rapid-acting insulin analogs injected subcutaneously with and without hyaluronidase. Diabetes Care, 2013;36:273-5.
ProSciento Methodology Fact Sheets Introduction to Glucose Clamps – Automated Versus Manual Techniques | Euglycemic Time-Action Profile Clamps | Hyperinsulinemic Euglycemic Insulin Sensitivity Clamp | Hypoglycemic Clamp Studies | Oral Glucose Tolerance and Mixed Meal Tolerance Tests | Graded Glucose Infusion for Assessment of β-Cell Function | MRI for Assessment of NAFLD/NASH