Embed Size (px)
Citation preview

Transport
StatiStical pocketbook 2015
transportin figures
EU

1
1.0 .0GENERAL DATA
Preface
EU TRANSPORT iN f igURES – STAT iST icAl POckETbOOk 2015
Transport represents a crucial sector of the economy. This publication provides an overview of the most recent and most pertinent annual transport-related statistics in Europe. It covers the European Union and its 28 Member States and, as far as possible, the current EU candidate countries and the EFTA countries.
The content of this pocketbook is based on a range of sources including Eurostat, international organisations, national statistics and, where no data were available, own estimates. Own estimates have mainly been produced to get an idea of the EU total. At the level of individual countries, they are merely indicative and should by no means be (mis-)interpreted as ‘official’ data.
The publication consists of three parts:(1) a general part with general economic and other relevant data,(2) a transport part covering both passenger and freight transport as well
as other transport-related data, and, finally,(3) an energy and environmental part with data on the impact which the
transport sector has on the environment.
Most of the tables have data up to 2013; where available, more recent data have been provided.
The tables of this pocketbook may also be found on the Europa site at: http://ec.europa.eu/transport/facts-fundings/statistics/index_en.htm
Many tables on the internet contain more data than could be presented in this pocketbook. Some tables may be updated on the web before the publication of the next paper version.
Eurostat, the main data provider, may be accessed directly on the internet at: http://epp.eurostat.ec.europa.eu/
Comments on this publication and suggestions for improving it are appreciated. They should be sent to [email protected]
Europe Direct is a service to help you find answers to your questions about the European Union.
freephone number (*):
00 800 6 7 8 9 10 11
(*) The information given is free, as are most calls (though some operators, phone boxes or hotels may charge you).
More information on the European Union is available on the Internet (http://europa.eu).
Illustrations: © Fotolia
Print ISBN 978-92-79-43915-5 ISSN 1831-998X doi:10.2832/91509 MI-AA-15-001-EN-C
PDF ISBN 978-92-79-43914-8 ISSN 2363-2739 doi:10.2832/90922 MI-AA-15-001-EN-N
Luxembourg: Publications Office of the European Union, 2015
© European Union, 2015Reproduction is authorised provided the source is acknowledged.
Printed in Belgium
Printed on elemental chlorine-free bleached paper (ECF)

2 3
contentscontents
PART 1 – gENERAl dATA
1.1 General Data . . . . . . . . . . . . . . . . . . . . . . . . . . . . . . . . . . . . . . . . . . . . . . . . . . . . . . . . . . . . . . . . . . . . . . . . . . . . . . . . . . . . 9
1.2 Growth in GDP and Industrial Production . . . . . . . . . . . . . . . . . . . . . . . . . . . . . . . . . . . . . . . . . 101.3 Employment and Unemployment . . . . . . . . . . . . . . . . . . . . . . . . . . . . . . . . . . . . . . . . . . . . . . . . . . . . . 111.4 Share of Gross Value Added and Employment by Sector . . . . . . . . . . . . . . . . . 121.5 Population . . . . . . . . . . . . . . . . . . . . . . . . . . . . . . . . . . . . . . . . . . . . . . . . . . . . . . . . . . . . . . . . . . . . . . . . . . . . . . . . . . . . . . . . 131.6a Member States External Trade of Goods: Imports . . . . . . . . . . . . . . . . . . . . . . . . . . . . 141.6b Member States External Trade of Goods: Exports . . . . . . . . . . . . . . . . . . . . . . . . . . . . 151.7 Comparison EU-28 – World: General data . . . . . . . . . . . . . . . . . . . . . . . . . . . . . . . . . . . . . . . . 16
PART 2 – TRANSPORT2.1 General . . . . . . . . . . . . . . . . . . . . . . . . . . . . . . . . . . . . . . . . . . . . . . . . . . . . . . . . . . . . . . . . . . . . . . . . . . . . . . . . . . . . . . . . . . . . . 19
2.1.1 Statistical overview eU transport . . . . . . . . . . . . . . . . . . . . . . . . . . . . . . . . . . . . . . . . . . . . . . . . . . . . . . . . . . . . 19
2.1.2 transport Growth eU-28 (graph) . . . . . . . . . . . . . . . . . . . . . . . . . . . . . . . . . . . . . . . . . . . . . . . . . . . . . . . . . . . . . . 21
2.1.3 Road transport: Speed limits, blood alcohol limits . . . . . . . . . . . . . . . . . . . . . . . . . . . . . . . . . . . . . 22
2.1.4 Road transport: Maximum Gross Vehicle Weight . . . . . . . . . . . . . . . . . . . . . . . . . . . . . . . . . . . . . . . . . 23
2.1.5 employment by Mode of transport . . . . . . . . . . . . . . . . . . . . . . . . . . . . . . . . . . . . . . . . . . . . . . . . . . . . . . . . . . . 24
2.1.6 Number of enterprises by Mode of transport . . . . . . . . . . . . . . . . . . . . . . . . . . . . . . . . . . . . . . . . . . . . . . 25
2.1.7 turnover by Mode of transport . . . . . . . . . . . . . . . . . . . . . . . . . . . . . . . . . . . . . . . . . . . . . . . . . . . . . . . . . . . . . . . . 26
2.1.8 Final consumption of Households for transport . . . . . . . . . . . . . . . . . . . . . . . . . . . . . . . . . . . . . . . . . . 27
2.1.9 eU-28 evolution of consumer prices for passenger transport . . . . . . . . . . . . . . . . . . . . . . . . 28
2.1.10 eU-28 external trade by Mode of transport . . . . . . . . . . . . . . . . . . . . . . . . . . . . . . . . . . . . . . . . . . . . . . . 29
2.1.11 environmental taxes and transport: as % of GDp – transport Fuel taxes . . . . . . . . . 30
2.1.12 environmental taxes and transport: as % of GDp – transport (excl. Fuel) . . . . . . . . . 31
2.1.13 environmental taxes and transport:
Fuel and other taxes as % of total taxation . . . . . . . . . . . . . . . . . . . . . . . . . . . . . . . . . . . . . . . . . . . . . 32
2.1.14 comparison eU-28 – World: infrastructure and Vehicles . . . . . . . . . . . . . . . . . . . . . . . . . . . . . . . 33
2.1.15 comparison eU-28 – World: passenger and Freight transport . . . . . . . . . . . . . . . . . . . . . . . . 34
2.2 Performance of Freight Transport expressed in tonne-kilometres . . . 35
2.2.1 eU-28 performance by Mode for Freight transport . . . . . . . . . . . . . . . . . . . . . . . . . . . . . . . . . . . . . 35
2.2.2 eU-28 performance by Mode . . . . . . . . . . . . . . . . . . . . . . . . . . . . . . . . . . . . . . . . . . . . . . . . . . . . . . . . . . . . . . . . . . 36
2.2.3 eU-28 performance by Mode – inland. . . . . . . . . . . . . . . . . . . . . . . . . . . . . . . . . . . . . . . . . . . . . . . . . . . . . . . 37
2.2.4a Road: National Haulage . . . . . . . . . . . . . . . . . . . . . . . . . . . . . . . . . . . . . . . . . . . . . . . . . . . . . . . . . . . . . . . . . . . . . . . . 38
2.2.4b Road: international Haulage . . . . . . . . . . . . . . . . . . . . . . . . . . . . . . . . . . . . . . . . . . . . . . . . . . . . . . . . . . . . . . . . . . . 39
2.2.4c Road: National and international Haulage . . . . . . . . . . . . . . . . . . . . . . . . . . . . . . . . . . . . . . . . . . . . . . . . . 40
2.2.5 Railways . . . . . . . . . . . . . . . . . . . . . . . . . . . . . . . . . . . . . . . . . . . . . . . . . . . . . . . . . . . . . . . . . . . . . . . . . . . . . . . . . . . . . . . . . . . 41
2.2.6 inland Waterways . . . . . . . . . . . . . . . . . . . . . . . . . . . . . . . . . . . . . . . . . . . . . . . . . . . . . . . . . . . . . . . . . . . . . . . . . . . . . . . . 42
2.2.7 pipelines (oil). . . . . . . . . . . . . . . . . . . . . . . . . . . . . . . . . . . . . . . . . . . . . . . . . . . . . . . . . . . . . . . . . . . . . . . . . . . . . . . . . . . . . . . 43
2.2.8 USa . . . . . . . . . . . . . . . . . . . . . . . . . . . . . . . . . . . . . . . . . . . . . . . . . . . . . . . . . . . . . . . . . . . . . . . . . . . . . . . . . . . . . . . . . . . . . . . . . . . 44
2.3 Performance of Passenger Transport expressed in passenger-kilometres . . . . . . . . . . . . . . . . . . . . . . . . . . . . . . . . . . . . . . . . . . . . . . . . . . . . . . . . . . . . . . . . . . . 45
2.3.1 eU-28 performance by Mode for passenger transport . . . . . . . . . . . . . . . . . . . . . . . . . . . . . . . . . 45
2.3.2 eU-28 performance by Mode . . . . . . . . . . . . . . . . . . . . . . . . . . . . . . . . . . . . . . . . . . . . . . . . . . . . . . . . . . . . . . . . . 46
2.3.3 Modal Split of passenger transport on land by country . . . . . . . . . . . . . . . . . . . . . . . . . . . . . . 47
2.3.4 passenger cars . . . . . . . . . . . . . . . . . . . . . . . . . . . . . . . . . . . . . . . . . . . . . . . . . . . . . . . . . . . . . . . . . . . . . . . . . . . . . . . . . . . 48
2.3.5 buses & coaches . . . . . . . . . . . . . . . . . . . . . . . . . . . . . . . . . . . . . . . . . . . . . . . . . . . . . . . . . . . . . . . . . . . . . . . . . . . . . . . . 49
2.3.6 tram & Metro . . . . . . . . . . . . . . . . . . . . . . . . . . . . . . . . . . . . . . . . . . . . . . . . . . . . . . . . . . . . . . . . . . . . . . . . . . . . . . . . . . . . . 50
2.3.7 Railways . . . . . . . . . . . . . . . . . . . . . . . . . . . . . . . . . . . . . . . . . . . . . . . . . . . . . . . . . . . . . . . . . . . . . . . . . . . . . . . . . . . . . . . . . . . . 51
2.3.8 Rail . . . . . . . . . . . . . . . . . . . . . . . . . . . . . . . . . . . . . . . . . . . . . . . . . . . . . . . . . . . . . . . . . . . . . . . . . . . . . . . . . . . . . . . . . . . . . . . . . . . 52
2.3.9 USa . . . . . . . . . . . . . . . . . . . . . . . . . . . . . . . . . . . . . . . . . . . . . . . . . . . . . . . . . . . . . . . . . . . . . . . . . . . . . . . . . . . . . . . . . . . . . . . . . . . 53
2.4 Performance of Freight and Passenger Transport Using Other Indicators . . . . . . . . . . . . . . . . . . . . . . . . . . . . . . . . . . . . . . . . . . . . . . . . . . . . . . . . . . . . . . . . . . . . . . 54
2.4.1 air: passenger traffic between Member States . . . . . . . . . . . . . . . . . . . . . . . . . . . . . . . . . . . . . . . . . . . . 55
2.4.2 air: Major european airlines . . . . . . . . . . . . . . . . . . . . . . . . . . . . . . . . . . . . . . . . . . . . . . . . . . . . . . . . . . . . . . . . . . . . . 56
2.4.3 air: passenger traffic at Major eU airports . . . . . . . . . . . . . . . . . . . . . . . . . . . . . . . . . . . . . . . . . . . . . . . . . . 57
2.4.4a air: Main intra-eU airport pairs in passenger transport . . . . . . . . . . . . . . . . . . . . . . . . . . . . . . . . . . 58
2.4.4b air: Main connections between eU and non-eU airports in passenger transport . . 59
2.4.5 air: Freight traffic at Major eU airports . . . . . . . . . . . . . . . . . . . . . . . . . . . . . . . . . . . . . . . . . . . . . . . . . . . . . . 60
2.4.6 air: Movements of aircraft at Major eU airports . . . . . . . . . . . . . . . . . . . . . . . . . . . . . . . . . . . . . . . . . . . 61
2.4.7 Sea: inward and outward Flow of passengers by country . . . . . . . . . . . . . . . . . . . . . . . . . . . . . . 62
2.4.8 Sea: passenger traffic at Major eU Seaports . . . . . . . . . . . . . . . . . . . . . . . . . . . . . . . . . . . . . . . . . . . . . . . 64
2.4.9 Sea: Freight traffic at Major eU Seaports . . . . . . . . . . . . . . . . . . . . . . . . . . . . . . . . . . . . . . . . . . . . . . . . . . . 65
2.4.10a Sea: intra-eU Maritime transport by country . . . . . . . . . . . . . . . . . . . . . . . . . . . . . . . . . . . . . . . . . . . . . . . 66
2.4.10b Sea: Main Routes in intra-eU Maritime transport . . . . . . . . . . . . . . . . . . . . . . . . . . . . . . . . . . . . . . . . . 67
2.4.11 Sea: container traffic at Major eU Seaports . . . . . . . . . . . . . . . . . . . . . . . . . . . . . . . . . . . . . . . . . . . . . . . . 68
2.4.12 combined transport traffic . . . . . . . . . . . . . . . . . . . . . . . . . . . . . . . . . . . . . . . . . . . . . . . . . . . . . . . . . . . . . . . . . . . . . . 69
2.4.13 Road: alps crossing Freight traffic . . . . . . . . . . . . . . . . . . . . . . . . . . . . . . . . . . . . . . . . . . . . . . . . . . . . . . . . . . . . 70
2.4.14 Road: pyrenees crossing traffic . . . . . . . . . . . . . . . . . . . . . . . . . . . . . . . . . . . . . . . . . . . . . . . . . . . . . . . . . . . . . . . . 71
2.4.15a Rail: Degree of Market opening – passengers . . . . . . . . . . . . . . . . . . . . . . . . . . . . . . . . . . . . . . . . . . . . . 72
2.4.15b Rail: Degree of Market opening – Freight . . . . . . . . . . . . . . . . . . . . . . . . . . . . . . . . . . . . . . . . . . . . . . . . . . . 73
2.4.16 Rail: alps and pyrenees crossing Freight traffic . . . . . . . . . . . . . . . . . . . . . . . . . . . . . . . . . . . . . . . . . . . 74
2.4.17 Rail: channel tunnel traffic . . . . . . . . . . . . . . . . . . . . . . . . . . . . . . . . . . . . . . . . . . . . . . . . . . . . . . . . . . . . . . . . . . . . . 75
2.5 Infrastructure . . . . . . . . . . . . . . . . . . . . . . . . . . . . . . . . . . . . . . . . . . . . . . . . . . . . . . . . . . . . . . . . . . . . . . . . . . . . . . . . . . . 76
2.5.1 Road: length of Motorways . . . . . . . . . . . . . . . . . . . . . . . . . . . . . . . . . . . . . . . . . . . . . . . . . . . . . . . . . . . . . . . . . . . 76
2.5.2 Road: length of Road Network . . . . . . . . . . . . . . . . . . . . . . . . . . . . . . . . . . . . . . . . . . . . . . . . . . . . . . . . . . . . . . . 77
2.5.3 Railways: length of lines in Use . . . . . . . . . . . . . . . . . . . . . . . . . . . . . . . . . . . . . . . . . . . . . . . . . . . . . . . . . . . . 78
2.5.4 Railways: High-Speed Rail Network . . . . . . . . . . . . . . . . . . . . . . . . . . . . . . . . . . . . . . . . . . . . . . . . . . . . . . . . . 79
2.5.5 Railways: Main Railway Gauge and electric current Used . . . . . . . . . . . . . . . . . . . . . . . . . . . . . 80
2.5.6 air: Number of airports . . . . . . . . . . . . . . . . . . . . . . . . . . . . . . . . . . . . . . . . . . . . . . . . . . . . . . . . . . . . . . . . . . . . . . . . . 81
2.5.7 inland Waterways: length in Use . . . . . . . . . . . . . . . . . . . . . . . . . . . . . . . . . . . . . . . . . . . . . . . . . . . . . . . . . . . . 82
2.5.8 pipelines . . . . . . . . . . . . . . . . . . . . . . . . . . . . . . . . . . . . . . . . . . . . . . . . . . . . . . . . . . . . . . . . . . . . . . . . . . . . . . . . . . . . . . . . . . . . . 83
2.6 Means of Transport . . . . . . . . . . . . . . . . . . . . . . . . . . . . . . . . . . . . . . . . . . . . . . . . . . . . . . . . . . . . . . . . . . . . . . . . . . 84
2.6.1 Road: Motorisation . . . . . . . . . . . . . . . . . . . . . . . . . . . . . . . . . . . . . . . . . . . . . . . . . . . . . . . . . . . . . . . . . . . . . . . . . . . . . . . 84
2.6.2 Road: passenger cars – Stock of Registered Vehicles . . . . . . . . . . . . . . . . . . . . . . . . . . . . . . . . . . . 85
2.6.3 Road: buses and coaches – Stock of Registered Vehicles . . . . . . . . . . . . . . . . . . . . . . . . . . . . 86
2.6.4 Road: Goods Vehicles – Stock of Registered Vehicles . . . . . . . . . . . . . . . . . . . . . . . . . . . . . . . . . . 87
2.6.5 Road: powered two-wheelers – Stock of Registered Vehicles . . . . . . . . . . . . . . . . . . . . . . . 88
2.6.6 Road: passenger cars – New Vehicle Registrations . . . . . . . . . . . . . . . . . . . . . . . . . . . . . . . . . . . . . . 89

4 5
12 estimates are printed in italic
% per cent
- not applicable, does not exist
blank data not available
0 zero or figure less than half of unit used
ca. circa = approximately
EUR, € euro
DG Directorate-General of the European Commission
dwt deadweight ton (shipping)
GDP Gross Domestic Product
grt gross registered tonnage (shipping)
mio 1 million
mtow maximum take-off weight (aircraft)
pkm passenger-kilometre: a unit of measure: 1 passenger transported a distance of 1 kilometre
PPS Purchasing Power Standards
rpk revenue passenger kilometres (air)
TEU Twenty foot Equivalent Unit
tkm tonne-kilometre: a unit of measure: 1 tonne transported a distance of 1 kilometre
break in horizontal time series
break in vertical time series
contents Symbols and abbreviations
2.6.7 Road: Goods Vehicles – New Vehicle Registrations . . . . . . . . . . . . . . . . . . . . . . . . . . . . . . . . . . . . . 90
2.6.8 Road: buses and coaches – New Vehicle Registrations . . . . . . . . . . . . . . . . . . . . . . . . . . . . . . . . 91
2.6.9 Road: Motorcycles – New Vehicle Registrations. . . . . . . . . . . . . . . . . . . . . . . . . . . . . . . . . . . . . . . . . . . 92
2.6.10 Road: Mopeds – New Vehicle Deliveries . . . . . . . . . . . . . . . . . . . . . . . . . . . . . . . . . . . . . . . . . . . . . . . . . . . 93
2.6.11 Sea: eU Merchant Fleet . . . . . . . . . . . . . . . . . . . . . . . . . . . . . . . . . . . . . . . . . . . . . . . . . . . . . . . . . . . . . . . . . . . . . . . . . 94
2.6.12a Sea: World Merchant Fleet . . . . . . . . . . . . . . . . . . . . . . . . . . . . . . . . . . . . . . . . . . . . . . . . . . . . . . . . . . . . . . . . . . . . . 95
2.6.12b Sea: World Merchant Fleet . . . . . . . . . . . . . . . . . . . . . . . . . . . . . . . . . . . . . . . . . . . . . . . . . . . . . . . . . . . . . . . . . . . . . 96
2.6.13 air: passenger aircraft . . . . . . . . . . . . . . . . . . . . . . . . . . . . . . . . . . . . . . . . . . . . . . . . . . . . . . . . . . . . . . . . . . . . . . . . . . 97
2.6.14 air: Freight, Special, business aircraft . . . . . . . . . . . . . . . . . . . . . . . . . . . . . . . . . . . . . . . . . . . . . . . . . . . . . . . 98
2.6.15 Rail: locomotives and Railcars . . . . . . . . . . . . . . . . . . . . . . . . . . . . . . . . . . . . . . . . . . . . . . . . . . . . . . . . . . . . . . . 99
2.6.16 Rail: passenger transport Vehicles . . . . . . . . . . . . . . . . . . . . . . . . . . . . . . . . . . . . . . . . . . . . . . . . . . . . . . . . 100
2.6.17 Rail: Goods transport Wagons . . . . . . . . . . . . . . . . . . . . . . . . . . . . . . . . . . . . . . . . . . . . . . . . . . . . . . . . . . . . . . 101
2.7 Safety . . . . . . . . . . . . . . . . . . . . . . . . . . . . . . . . . . . . . . . . . . . . . . . . . . . . . . . . . . . . . . . . . . . . . . . . . . . . . . . . . . . . . . . . . . . . . 102
2.7.1 Road Fatalities . . . . . . . . . . . . . . . . . . . . . . . . . . . . . . . . . . . . . . . . . . . . . . . . . . . . . . . . . . . . . . . . . . . . . . . . . . . . . . . . 102
2.7.2 Road Fatalities country Rankings . . . . . . . . . . . . . . . . . . . . . . . . . . . . . . . . . . . . . . . . . . . . . . . . . . . . . . . . . . 103
2.7.3a Road Fatalities by type of User . . . . . . . . . . . . . . . . . . . . . . . . . . . . . . . . . . . . . . . . . . . . . . . . . . . . . . . . . . . . 104
2.7.3b Road Fatalities of Vehicle occupants by type of Vehicle . . . . . . . . . . . . . . . . . . . . . . . . . . . 105
2.7.4 Road accidents . . . . . . . . . . . . . . . . . . . . . . . . . . . . . . . . . . . . . . . . . . . . . . . . . . . . . . . . . . . . . . . . . . . . . . . . . . . . . . . . . 106
2.7.5 Railway Fatalities . . . . . . . . . . . . . . . . . . . . . . . . . . . . . . . . . . . . . . . . . . . . . . . . . . . . . . . . . . . . . . . . . . . . . . . . . . . . . . 107
2.7.6 air: lives lost . . . . . . . . . . . . . . . . . . . . . . . . . . . . . . . . . . . . . . . . . . . . . . . . . . . . . . . . . . . . . . . . . . . . . . . . . . . . . . . . . . . 108
2.7.7 Sea: Ships lost (World) . . . . . . . . . . . . . . . . . . . . . . . . . . . . . . . . . . . . . . . . . . . . . . . . . . . . . . . . . . . . . . . . . . . . . . . 109
PART 3 – ENERgy ANd ENviRONmENT3.1 Energy . . . . . . . . . . . . . . . . . . . . . . . . . . . . . . . . . . . . . . . . . . . . . . . . . . . . . . . . . . . . . . . . . . . . . . . . . . . . . . . . . . . . . . . . . . . . 113
3.1.1 Glossary . . . . . . . . . . . . . . . . . . . . . . . . . . . . . . . . . . . . . . . . . . . . . . . . . . . . . . . . . . . . . . . . . . . . . . . . . . . . . . . . . . . . . . . . . . 113
3.1.2 average calorific Values – energy content . . . . . . . . . . . . . . . . . . . . . . . . . . . . . . . . . . . . . . . . . . . 115
3.1.3 conversion Factors . . . . . . . . . . . . . . . . . . . . . . . . . . . . . . . . . . . . . . . . . . . . . . . . . . . . . . . . . . . . . . . . . . . . . . . . . . . . . 116
3.1.4 energy Statistics for eU-28 . . . . . . . . . . . . . . . . . . . . . . . . . . . . . . . . . . . . . . . . . . . . . . . . . . . . . . . . . . . . . . . . . . 117
3.1.5 Final energy consumption by Sector . . . . . . . . . . . . . . . . . . . . . . . . . . . . . . . . . . . . . . . . . . . . . . . . . . . . . . 118
3.1.6 Final consumption of Motor Gasoline, Diesel and biofuels for transport by Fuel ..... 120
3.1.7 biofuels production by Fuel . . . . . . . . . . . . . . . . . . . . . . . . . . . . . . . . . . . . . . . . . . . . . . . . . . . . . . . . . . . . . . . . . 121
3.2 Environment . . . . . . . . . . . . . . . . . . . . . . . . . . . . . . . . . . . . . . . . . . . . . . . . . . . . . . . . . . . . . . . . . . . . . . . . . . . . . . . . . . . 122
3.2.1 total Greenhouse Gas (GHG) emissions . . . . . . . . . . . . . . . . . . . . . . . . . . . . . . . . . . . . . . . . . . . . . . 122
3.2.2 GHG emissions from transport . . . . . . . . . . . . . . . . . . . . . . . . . . . . . . . . . . . . . . . . . . . . . . . . . . . . . . . . . . . . . 123
3.2.3 GHG emissions by Sector – eU-28 . . . . . . . . . . . . . . . . . . . . . . . . . . . . . . . . . . . . . . . . . . . . . . . . . . . . . . . . 124
3.2.4 GHG emissions by Sector . . . . . . . . . . . . . . . . . . . . . . . . . . . . . . . . . . . . . . . . . . . . . . . . . . . . . . . . . . . . . . . . . . . . 128
3.2.5 GHG emissions from transport by Mode – eU-28 . . . . . . . . . . . . . . . . . . . . . . . . . . . . . . . . . . . . . 130
3.2.6 GHG emissions from transport by Mode . . . . . . . . . . . . . . . . . . . . . . . . . . . . . . . . . . . . . . . . . . . . . . . . . . 132
3.2.7 total co2 emissions . . . . . . . . . . . . . . . . . . . . . . . . . . . . . . . . . . . . . . . . . . . . . . . . . . . . . . . . . . . . . . . . . . . . . . . . . . . 134
3.2.8 co2 emissions from transport . . . . . . . . . . . . . . . . . . . . . . . . . . . . . . . . . . . . . . . . . . . . . . . . . . . . . . . . . . . . . . 135
3.2.9 co2 emissions by Sector – eU-28 . . . . . . . . . . . . . . . . . . . . . . . . . . . . . . . . . . . . . . . . . . . . . . . . . . . . . . . . . 136
3.2.10 co2 emissions by Sector . . . . . . . . . . . . . . . . . . . . . . . . . . . . . . . . . . . . . . . . . . . . . . . . . . . . . . . . . . . . . . . . . . . . . 140
3.2.11 co2 emissions from transport by Mode – eU-28 . . . . . . . . . . . . . . . . . . . . . . . . . . . . . . . . . . . . . . 142
3.2.12 co2 emissions from transport by Mode . . . . . . . . . . . . . . . . . . . . . . . . . . . . . . . . . . . . . . . . . . . . . . . . . . . 144
3.2.13 oil Spills at Sea . . . . . . . . . . . . . . . . . . . . . . . . . . . . . . . . . . . . . . . . . . . . . . . . . . . . . . . . . . . . . . . . . . . . . . . . . . . . . . . . . 146

6
1.0 .0GENERAL DATA
Titlesubtitle
country abbreviations
EUROPEAN UNiON cOUNTRiES (EU-28) (AlSO EEA mEmbERS)EU mEmbER STATE SiNcE:
AT Austria 1995 EU-15bE Belgium 1958 EU-15bg Bulgaria 2007 EU-13cy Cyprus 2004 EU-13cZ Czech Republic 2004 EU-13dE Germany 1958 EU-15dk Denmark 1973 EU-15EE Estonia 2004 EU-13El Greece 1981 EU-15ES Spain 1986 EU-15fi Finland 1995 EU-15
fR France 1958 EU-15HR Croatia 2013 EU-13HU Hungary 2004 EU-13iE Ireland 1973 EU-15iT Italy 1958 EU-15lT Lithuania 2004 EU-13lU Luxembourg 1958 EU-15lv Latvia 2004 EU-13mT Malta 2004 EU-13Nl Netherlands 1958 EU-15Pl Poland 2004 EU-13PT Portugal 1986 EU-15RO Romania 2007 EU-13SE Sweden 1995 EU-15Si Slovenia 2004 EU-13
Sk Slovak Republic 2004 EU-13Uk United Kingdom 1973 EU-15
OTHER EUROPEAN EcONOmic AREA (EEA) ANd iN EfTAiS Iceland EEA: 1994 EFTA: 1960li Liechtenstein EEA: 1994 EFTA: 1991
NO Norway EEA: 1994 EFTA: 1960OTHER EUROPEAN fREE TRAdE ASSOciATiON (EfTA) cOUNTRiEScH Switzerland EFTA: 1960
EUROPEAN UNiON cANdidATE cOUNTRiESAl AlbaniamE Montenegromk The former Yugoslav Republic of MacedoniaRS SerbiaTR Turkey
OTHER cOUNTRiEScS Czechoslovakia (until 1992)bR BrazilcA CanadacN ChinaiN IndiaJP JapankR KoreamX MexicoRU Russia
USA United States of America
Notes: the countries which were members of the eU in 1994 became members of the eea in 1994, those which joined the eU in 1995 had already been eea members since 1994 and those which joined the eU in 2004 and 2007 became members of the eea upon accession to the eU. croatia joined eea in 2014. the former GDR is always included in DE; unification on 3.10.1990.
PART 1
datageneral

8 9Sources : Eurostat , nat ional sources , provis ional or est imated data from Eurostat in i ta l ics
AREA POPUlA-TiON
gdP (NOmiNAl) gdP PER HEAd iN PPS
1 000 km2 million billion EUR EU-28 = 100on 1/1/2014 2013 2012 2013
EU-28 4 381.4 505.489 13 528.5 100 100 BE 30.5 11.204 395.3 118 118 BG 111.0 7.246 41.0 45 44 CZ 78.9 10.512 157.3 82 82 DK 43.1 5.627 252.9 125 124 DE 357.1 80.780 2 809.5 124 124 EE 45.2 1.316 18.7 71 73 IE 70.3 4.604 174.8 129 129
EL 132.0 10.993 182.4 74 73 ES 506.0 46.508 1 049.2 94 94 FR 544.0 63.929 2 113.7 107 106 HR 56.6 4.247 43.6 60 60
IT 301.3 60.783 1 618.9 102 100 CY 9.3 0.858 18.1 93 88 LV 64.6 2.001 23.3 60 64 LT 65.3 2.943 35.0 69 73 LU 2.6 0.550 45.3 263 257
HU 93.0 9.879 100.5 64 66 MT 0.3 0.425 7.5 84 86 NL 41.5 16.829 642.9 132 131 AT 83.9 8.508 322.6 128 127 PL 312.7 38.496 396.0 65 67 PT 92.1 10.427 171.2 76 79 RO 238.4 19.943 144.3 53 54
SI 20.3 2.061 36.1 81 82 SK 49.0 5.416 73.6 73 75 FI 338.4 5.451 201.3 115 112
SE 450.3 9.645 436.3 125 126 UK 243.8 64.308 2 017.2 107 108 AL 28.7 2.896 9.7
ME 13.8 0.624 3.3MK 25.7 2.066 8.1 34 35 RS 88.4 7.147 34.3 37 37 TR 785.3 76.668 617.8IS 103.0 0.326 11.5 116 116
NO 323.8 5.109 393.1 189 189 CH 41.3 8.137 516.1 160 160
Notes: CY: area refers to the whole island. FR: area and population only cover mainland France (‘France métropolitaine’). the four French overseas departments Guyane, Martinique, Guadeloupe and la Réunion, which are part of the eU, have a combined area of 88 794 km2 and a population of around 1.9 million. the total area of the eU therefore is 4 470.2 thousand km2, its total population on 1 January 2014 was 507.4 million. Data on GDp has been updated according to the new eSa2010 methodology when available, unless for AL, ME and TR which are based on national sources or according the previous eSa95.
PART 1SUMMARY
general data
GENERAL DATA
GENERAL DATA
1.1 GENERAL DATA . . . . . . . . . . . . . . . . . . . . . . . . . . . . . . . . . . . . . . . . . . . . . . . . . . . . . . . . . . . . . . . . . . . . . . . . . . . . 9
1.2 GROWTH IN GDP AND INDUSTRIAL PRODUCTION . . . 10
1.3 EMPLOYMENT AND UNEMPLOYMENT . . . . . . . . . . . . . . . . . . . . . . . . . . . . 11
1.4 SHARE OF GROSS VALUE ADDED AND
EMPLOYMENT BY SECTOR . . . . . . . . . . . . . . . . . . . . . . . . . . . . . . . . . . . . . . . . . . . . . . . . . . . 12
1.5 POPULATION . . . . . . . . . . . . . . . . . . . . . . . . . . . . . . . . . . . . . . . . . . . . . . . . . . . . . . . . . . . . . . . . . . . . . . . . . . . . . 13
1.6a MEMBER STATES EXTERNAL TRADE OF GOODS:
IMPORTS . . . . . . . . . . . . . . . . . . . . . . . . . . . . . . . . . . . . . . . . . . . . . . . . . . . . . . . . . . . . . . . . . . . . . . . . . . . . . . . . . . . . . 14
1.6b MEMBER STATES EXTERNAL TRADE OF GOODS:
EXPORTS . . . . . . . . . . . . . . . . . . . . . . . . . . . . . . . . . . . . . . . . . . . . . . . . . . . . . . . . . . . . . . . . . . . . . . . . . . . . . . . . . . . . . 15
1.7 COMPARISON EU-28 – WORLD:
GENERAL DATA . . . . . . . . . . . . . . . . . . . . . . . . . . . . . . . . . . . . . . . . . . . . . . . . . . . . . . . . . . . . . . . . . . . . . . . . . 16
1.1

10 11
1.0 .0 1.0 .0GENERAL DATAGENERAL DATA
GENERAL DATA
Sources : Eurostat , UNECE. Al : nat ional source for employment rate
GENERAL DATA
Sources : Eurostat , UNECE, OECD, nat ional sources , provis ional or est imated data from Eurostat in i ta l ics
gROwTH iN gdP Real growth
gROwTH iN iNdUSTRiAl PROdUcTiON
(excluding construction)
% cHANgE % cHANgE2010 2011 2012 2013 2010 2011 2012 2013
EU-28 2.1 1.7 -0.4 0.0 6.8 3.1 -2.2 -0.5BE 2.5 1.6 0.1 0.3 11.2 4.4 -3.3 0.8BG 0.7 2.0 0.5 1.1 2.0 5.9 -0.2 0.0CZ 2.3 2.0 -0.8 -0.7 8.2 5.9 -0.8 0.2DK 1.6 1.2 -0.7 -0.5 1.7 2.1 -0.1 0.8DE 4.1 3.6 0.4 0.1 11.0 7.2 -0.4 0.2EE 2.5 8.3 4.7 1.6 23.0 19.6 1.4 3.0IE -0.3 2.8 -0.3 0.2 7.6 -0.4 -1.4 -2.2
EL -5.4 -8.9 -6.6 -3.9 -6.6 -5.9 -2.1 -3.2ES 0.0 -0.6 -2.1 -1.2 0.8 -1.7 -6.9 -1.7FR 2.0 2.1 0.3 0.3 5.1 2.3 -2.7 -0.6HR -1.7 -0.3 -2.2 -0.9 -1.5 -1.2 -5.4 -1.9
IT 1.7 0.6 -2.3 -1.9 6.8 1.2 -6.4 -3.1CY 1.4 0.3 -2.4 -5.4 -1.7 -7.8 -9.6 -12.6LV -2.9 5.0 4.8 4.2 14.5 8.8 6.1 -0.3LT 1.6 6.1 3.8 3.3 6.1 6.5 3.6 3.5LU 5.1 2.6 -0.2 2.0 8.7 2.0 -4.3 -3.3
HU 0.8 1.8 -1.5 1.5 10.3 5.6 -1.4 1.5MT 3.5 2.2 2.5 2.5 8.7 -0.5 5.4 -5.3NL 1.1 1.7 -1.6 -0.7 7.7 -0.7 -0.6 0.6AT 1.9 3.1 0.9 0.2 6.7 6.8 -0.3 0.8PL 3.7 4.8 1.8 1.7 11.7 6.8 1.4 2.4PT 1.9 -1.8 -3.3 -1.4 1.6 -1.0 -6.1 0.5RO -0.8 1.1 0.6 3.4 3.8 7.8 2.4 7.8
SI 1.2 0.6 -2.6 -1.0 7.0 2.1 -0.5 -1.4SK 4.8 2.7 1.6 1.4 8.0 5.4 7.6 5.3FI 3.0 2.6 -1.5 -1.2 5.2 2.1 -1.6 -3.5
SE 6.0 2.7 -0.3 1.3 8.8 2.5 -1.2 -4.6UK 1.9 1.6 0.7 1.7 3.1 -0.6 -3.0 -0.2AL 3.7 2.5 1.6 1.4 19.9 -10.2 16.6 -13.1
ME 2.5 3.2 -2.5 3.3 17.8 -10.3 -7.0 10.6MK 2.9 2.8 -0.4 2.9 -4.8 6.9 -2.8 3.2RS 0.6 1.4 -1.0 2.6 1.0 2.5 -2.2 5.8TR 9.2 8.8 2.1 4.1 12.6 9.5 2.5 3.4IS -2.9 2.1 1.1 3.5 12.9 12.1 4.5 -4.0
NO 0.6 1.0 2.7 0.7 -5.4 -4.5 2.8 -5.0CH 3.0 1.8 1.1 1.9 7.2 2.7 2.3 0.8
Notes: industrial production: includes Nace Rev. 2 Sections b, c and D. Data adjusted by working days. Data has been extracted on 20/01/15. Growth GDP section: data for the 28 member states, RS, IS, NO and CH is provided according to the new eSa2010 methodology, while MK and ME according to eSa95. AL, TR and ME (2013) from national sources. Growth industrial production section: data for the 28 member states, NO, TR, RS and MK provided by eurostat. IS estimated by oecD. AL provided by UNece. ME from national source.
EmPlOymENT RATE UNEmPlOymENT RATE
% %2010 2011 2012 2013 2010 2011 2012 2013
EU-28 64.0 64.1 64.1 64.1 9.6 9.6 10.5 10.8BE 62.0 61.9 61.8 61.8 8.3 7.2 7.6 8.4 BG 59.7 58.4 58.8 59.5 10.3 11.3 12.3 13.0 CZ 65.0 65.7 66.5 67.7 7.3 6.7 7.0 7.0 DK 73.3 73.1 72.6 72.5 7.5 7.6 7.5 7.0 DE 71.1 72.7 73.0 73.5 7.0 5.8 5.4 5.2 EE 61.2 65.3 67.1 68.5 16.7 12.3 10.0 8.6 IE 59.6 58.9 58.8 60.5 13.9 14.7 14.7 13.1
EL 59.1 55.1 50.8 48.8 12.7 17.9 24.5 27.5 ES 58.8 58.0 55.8 54.8 19.9 21.4 24.8 26.1 FR 63.9 63.9 63.9 64.1 9.3 9.2 9.8 10.3 HR 54.0 52.4 50.7 52.5 12.3 13.9 16.1 17.3
IT 56.9 56.9 56.8 55.6 8.4 8.4 10.7 12.2 CY 68.9 67.6 64.6 61.7 6.3 7.9 11.9 15.9 LV 58.5 60.8 63.0 65.0 19.5 16.2 15.0 11.9 LT 57.6 60.2 62.0 63.7 17.8 15.4 13.4 11.8 LU 65.2 64.6 65.8 65.7 4.6 4.8 5.1 5.9
HU 55.4 55.8 57.2 58.4 11.2 11.0 11.0 10.2 MT 56.2 57.9 59.1 60.8 6.9 6.4 6.3 6.4 NL 74.7 74.9 75.1 74.3 4.5 4.4 5.3 6.7 AT 71.7 72.1 72.5 72.3 4.4 4.2 4.3 4.9 PL 58.9 59.3 59.7 60.0 9.7 9.7 10.1 10.3 PT 65.3 63.8 61.4 60.6 12.0 12.9 15.8 16.4 RO 58.8 58.5 59.5 59.7 7.0 7.2 6.8 7.1
SI 66.2 64.4 64.1 63.3 7.3 8.2 8.9 10.1 SK 58.8 59.3 59.7 59.9 14.5 13.7 14.0 14.2 FI 68.1 69.0 69.4 68.9 8.4 7.8 7.7 8.2
SE 72.1 73.6 73.8 74.4 8.6 7.8 8.0 8.0 UK 69.5 69.5 70.1 70.5 7.8 8.1 7.9 7.6 AL 53.5 58.7 56.3 50.2 13.6 13.3 13.4 15.6
ME 50.1 46.5 47.5 47.7 19.7 19.7 19.7 19.5 MK 43.5 43.9 44.0 46.0 32.0 31.4 31.0 29.0 RS 48.4 45.4 45.2 47.3 19.2 23.0 23.9 22.1 TR 46.3 48.4 48.9 49.5 11.1 9.1 8.4 9.0 IS 78.2 78.5 79.7 81.1 7.6 7.1 6.0 5.4
NO 75.3 75.3 75.7 75.4 3.6 3.3 3.2 3.5 CH 78.6 79.3 79.4 79.6 4.5 4.0 4.2 4.4
Notes: Employment rate: persons in employment as a percentage of the population of working age (15-64 years). Unemployment rate: persons unemployed as a percentage of the active population (between 15 and 64 years old).
Employment and Unemploymentgrowth in gdP and industrial Productioncompared to the previous year
EMPLOYMENT AND UNEMPLOYMENTGROWTH IN GDP AND INDUSTR IAL PRODUCT ION1.2 1 .3

12 13Source :
GENERAL DATAGENERAL DATA
Source : Eurostat
SHARE Of gROSS vAlUE AddEd (%) SHARE Of EmPlOymENT (%)
AgRi- cUlTURE iNdUSTRy SERvicES AgRi-
cUlTURE iNdUSTRy SERvicES
2013 2013EU-28 1.7 24.6 73.7 5.0 22.1 72.9
BE 0.8 22.5 76.7 1.3 18.6 80.1 BG 5.5 27.9 66.6 19.2 25.1 55.7 CZ 2.6 36.7 60.7 3.3 36.8 60.0 DK 1.4 22.9 75.8 2.7 17.3 80.0 DE 0.9 30.7 68.4 1.5 24.7 73.8 EE 3.6 28.9 67.5 4.1 29.3 66.6 IE 1.6 24.1 74.3 5.7 18.3 76.0
EL 3.8 13.8 82.4 12.6 14.4 73.0 ES 2.8 23.3 73.9 4.1 18.1 77.8 FR 1.7 19.8 78.5 2.8 18.0 79.2 HR 4.3 26.5 69.3 10.8 28.0 61.2
IT 2.3 23.3 74.4 3.6 24.3 72.0 CY 2.5 11.5 86.0 3.9 16.0 80.1 LV 3.6 23.3 73.1 7.6 24.0 68.4 LT 3.8 30.7 65.5 8.4 25.5 66.1 LU 0.3 12.2 87.5 1.2 19.8 79.0
HU 4.4 30.2 65.4 7.1 27.3 65.7 MT 1.5 17.3 81.2 1.8 20.6 77.6 NL 2.0 22.2 75.9 2.3 15.1 82.6 AT 1.4 28.2 70.3 4.4 23.3 72.4 PL 3.3 33.2 63.5 12.0 30.3 57.8 PT 2.3 21.1 76.7 11.0 21.7 67.3 RO 6.2 34.4 59.4 30.2 27.9 42.0
SI 2.1 32.0 65.8 8.4 29.4 62.2 SK 4.0 33.2 62.7 3.4 31.2 65.4 FI 2.7 26.9 70.5 4.5 22.9 72.6
SE 1.4 25.9 72.7 2.2 20.8 77.0 UK 0.7 20.1 79.2 1.2 16.0 82.9 AL 22.6 27.1 50.3
ME 9.8 18.8 71.4 4.5 17.8 77.7 MK 11.0 24.5 64.4 24.2 27.0 48.8 RS 9.4 31.7 59.0 21.3 25.9 52.8 TR 8.4 26.7 65.0 23.6 26.4 50.0 IS 7.7 24.4 67.9 4.6 18.9 76.6
NO 1.6 39.8 58.7 2.5 20.6 76.9 CH 0.7 25.7 73.6 3.5 22.3 74.2
Notes: Agriculture covers agriculture, hunting, forestry and fishing. Industry includes mining and quarrying, manufacturing, energy, gas and water supply as well as construction. all other sectors are included in services. Share of value added: based on Nace 2 classification, except for TR, ME based on iSic rev. 4. preliminary or estimated data for EL, ES, CY, NL, PT, RO, CH, MK. Share of employment: based on Nace 2 classification, except for TR, ME, IS, CH, RS based on iSic rev. 4. preliminary or estimated data for EL, ES, BG, NL, PT, RO, CH, MK.
AT 1 JANUARy
million %
1990 1995 2000 2005 2010 2013 2014 change '13/'14
EU-28 475.161 481.659 485.271 492.965 501.486 503.756 505.489 0.3BE 9.948 10.131 10.239 10.446 10.840 11.162 11.204 0.4BG 8.767 8.427 8.191 7.761 7.422 7.285 7.246 -0.5CZ 10.362 10.333 10.278 10.199 10.462 10.516 10.512 0.0DK 5.135 5.216 5.330 5.411 5.535 5.603 5.627 0.4DE 79.113 81.539 82.163 82.501 81.802 80.524 80.780 0.3EE 1.571 1.448 1.401 1.359 1.333 1.320 1.316 -0.3IE 3.507 3.598 3.778 4.112 4.549 4.591 4.604 0.3
EL 10.121 10.595 10.904 11.074 11.184 11.063 10.993 -0.6ES 38.826 39.343 40.050 43.296 46.487 46.728 46.508 -0.5FR 56.577 57.753 58.858 60.963 62.765 63.660 63.929 0.4HR 4.773 4.659 4.498 4.311 4.303 4.262 4.247 -0.4
IT 56.694 56.844 56.924 57.875 59.190 59.685 60.783 1.8CY 0.573 0.645 0.690 0.733 0.819 0.866 0.858 -0.9LV 2.668 2.501 2.382 2.250 2.121 2.024 2.001 -1.1LT 3.694 3.643 3.512 3.355 3.142 2.972 2.943 -1.0LU 0.379 0.406 0.434 0.461 0.502 0.537 0.550 2.4
HU 10.375 10.337 10.222 10.098 10.014 9.909 9.879 -0.3MT 0.352 0.369 0.380 0.403 0.414 0.421 0.425 1.0NL 14.893 15.424 15.864 16.306 16.575 16.780 16.829 0.3AT 7.645 7.943 8.002 8.201 8.352 8.452 8.508 0.7PL 38.038 38.581 38.263 38.174 38.167 38.533 38.496 -0.1PT 9.996 10.009 10.249 10.495 10.573 10.487 10.427 -0.6RO 23.211 22.712 22.455 21.382 20.295 20.020 19.943 -0.4
SI 1.996 1.989 1.988 1.998 2.047 2.059 2.061 0.1SK 5.288 5.356 5.399 5.373 5.390 5.411 5.416 0.1FI 4.974 5.099 5.171 5.237 5.351 5.427 5.451 0.5
SE 8.527 8.816 8.861 9.011 9.341 9.556 9.645 0.9UK 57.157 57.943 58.785 60.182 62.510 63.905 64.308 0.6AL 3.287 3.249 3.058 3.135 2.899 2.896 -0.1
ME 0.612 0.623 0.618 0.623 0.624 0.3MK 1.873 1.957 2.022 2.035 2.053 2.062 2.066 0.2RS 7.528 7.456 7.307 7.182 7.147 -0.5TR 55.495 61.204 66.889 71.610 72.561 75.627 76.668 1.4IS 0.254 0.267 0.279 0.294 0.318 0.322 0.326 1.2LI 0.028 0.031 0.032 0.035 0.036 0.037 0.037 0.8
NO 4.233 4.348 4.478 4.606 4.858 5.051 5.109 1.1CH 6.674 7.019 7.164 7.415 7.786 8.039 8.137 1.2
Notes: DE: population: includes DE-E: 1970 = 17.1, 1980 = 16.7, 1990 = 16.1. CY: from 1975 onwards: government-controlled area only. FR: metropolitan France only (i.e. no overseas territories or overseas departments).
Sources : Eurostat , UNECE, nat ional sources (Al , iS )
PopulationShare of gross value Added and Employment by Sector
POPULAT IONSHARE OF GROSS VALUE ADDED AND EMPLOYMENT BY SECTOR 1.5 1.4

14 15
GENERAL DATAGENERAL DATA
yEAR 2013 (vAlUE = billion EUR)imPORTS fROm:
wO
Rld
EU-2
8
EXTR
A-EU
-28 Of wHicH:
cAN
did
ATE
5
EfTA
USA
JAPA
N
RUSS
iA
cHiN
A
EU-28 4 455.851 2 771.023 1 684.829 61.049 188.523 196.149 56.602 206.913 280.088
BE 340.093 225.908 114.185 3.381 10.249 23.691 7.138 9.992 12.999
BG 25.829 15.423 10.405 2.061 0.214 0.197 0.066 4.782 0.767
CZ 108.621 83.457 25.164 0.941 0.949 1.513 1.028 5.383 6.281
DK 72.728 50.931 21.797 0.747 6.021 1.568 0.271 0.950 4.838
DE 897.187 578.806 318.382 13.378 57.471 36.720 14.481 39.127 57.583
EE 13.684 11.310 2.375 0.048 0.214 0.133 0.027 0.809 0.572
IE 49.584 34.991 14.593 0.210 1.926 4.931 0.773 0.141 2.041
EL 46.808 22.126 24.682 1.578 0.613 0.504 0.120 6.606 2.194
ES 256.455 141.695 114.760 3.822 5.135 8.647 1.815 8.103 14.419
FR 513.114 347.738 165.376 5.438 17.601 26.660 4.817 10.263 24.603
HR 16.581 11.090 5.491 0.583 0.225 0.279 0.091 1.069 0.956
IT 361.002 200.168 160.834 8.193 12.219 11.535 2.566 20.197 23.071
CY 4.754 3.350 1.404 0.008 0.066 0.043 0.026 0.053 0.202
LV 13.451 10.762 2.690 0.072 0.147 0.083 0.012 1.087 0.342
LT 26.208 15.809 10.399 0.130 0.205 0.308 0.026 7.368 0.565
LU 20.087 15.866 4.221 0.034 0.173 1.666 0.170 0.002 1.282
HU 75.379 54.060 21.319 1.150 0.366 1.326 0.924 6.395 5.169
MT 4.625 3.285 1.340 0.094 0.112 0.127 0.047 0.008 0.136
NL 444.015 205.614 238.402 3.131 20.478 28.958 10.006 28.974 53.375
AT 138.000 105.723 32.277 1.777 8.178 2.843 0.745 3.069 4.485
PL 156.319 107.822 48.497 1.471 2.968 2.847 0.975 18.654 8.469
PT 56.906 40.959 15.947 0.552 0.415 0.843 0.238 1.000 1.370
RO 55.280 41.866 13.414 2.215 0.572 0.626 0.218 2.372 1.972
SI 25.129 17.604 7.525 1.444 0.313 0.455 0.109 0.464 1.018
SK 61.543 45.727 15.815 0.598 0.337 0.256 0.302 6.064 2.468
FI 58.407 38.704 19.702 0.232 1.447 1.349 0.287 10.485 1.759
SE 120.254 82.649 37.605 1.028 11.024 3.291 1.296 5.528 6.171
UK 493.808 257.580 236.228 6.733 28.885 34.751 8.033 7.965 40.981
Notes: Candidate 5: albania, Serbia, the former Yugoslav Republic of Macedonia, Montenegro and turkey. EFTA: iceland, liechtenstein, Norway and Switzerland.
yEAR 2013 (vAlUE = billion EUR)EXPORTS TO:
wO
Rld
EU-2
8
EXTR
A-EU
-28 Of wHicH:
cAN
did
ATE
5
EfTA
USA
JAPA
N
RUSS
iA
cHiN
A
EU-28 4 579.096 2 842.505 1 736.591 94.131 222.354 289.462 54.016 119.458 148.154
BE 352.956 247.572 105.383 4.911 6.843 18.036 3.479 5.114 7.230
BG 22.272 13.351 8.921 2.808 0.195 0.304 0.028 0.583 0.651
CZ 122.185 99.119 23.066 2.147 2.557 2.660 0.656 4.474 1.446
DK 82.905 52.569 30.337 0.765 6.492 5.267 1.461 1.562 2.578
DE 1 093.160 623.719 469.441 23.709 55.757 89.622 17.221 35.789 67.153
EE 12.311 8.730 3.581 0.168 0.514 0.359 0.065 1.419 0.099
IE 86.105 48.996 37.109 0.491 5.476 18.219 1.684 0.633 1.408
EL 27.559 12.837 14.722 4.655 0.162 0.934 0.046 0.406 0.419
ES 239.314 150.517 88.798 5.073 5.196 8.758 2.253 2.813 3.942
FR 437.439 259.827 177.613 6.705 14.705 27.216 6.878 7.721 14.813
HR 9.531 5.899 3.632 0.767 0.158 0.244 0.044 0.282 0.057
IT 390.233 209.829 180.404 13.236 22.095 27.047 6.023 10.772 9.843
CY 1.520 0.881 0.640 0.005 0.020 0.054 0.001 0.024 0.033
LV 10.893 7.236 3.657 0.137 0.316 0.120 0.045 1.760 0.086
LT 24.545 13.612 10.932 0.145 0.599 0.682 0.035 4.869 0.088
LU 13.880 11.245 2.635 0.331 0.690 0.353 0.056 0.156 0.197
HU 80.945 63.004 17.941 2.792 0.927 2.095 0.376 2.526 1.435
MT 2.738 1.229 1.509 0.018 0.026 0.156 0.128 0.036 0.047
NL 505.651 382.559 123.093 5.726 10.641 17.581 3.380 7.956 8.628
AT 131.885 92.433 39.452 2.021 7.600 6.691 1.230 4.308 2.772
PL 154.344 115.755 38.588 3.024 4.390 3.628 0.506 8.113 1.589
PT 47.266 33.235 14.032 0.396 0.539 1.999 0.139 0.263 0.658
RO 49.571 34.506 15.065 3.207 0.866 0.826 0.233 1.382 0.499
SI 25.615 19.170 6.445 1.409 0.361 0.371 0.040 1.190 0.169
SK 64.566 53.557 11.009 1.439 1.212 1.161 0.135 2.555 1.596
FI 56.048 30.979 25.069 0.717 2.415 3.561 0.994 5.359 2.766
SE 126.297 72.915 53.382 1.661 15.240 7.852 1.702 2.728 4.571
UK 407.363 177.226 230.137 5.668 56.360 43.666 5.176 4.667 13.381
Notes: Candidate 5: albania, Serbia, the former Yugoslav Republic of Macedonia, Montenegro and turkey. EFTA: iceland, liechtenstein, Norway and Switzerland.
Source : EurostatSource : Eurostat
member States External Trade of goods EXPORTS
member States External Trade of goods IMPORTS
MEMBER STATES EXTERNAL TRADE OF GOODS : EXPORTSMEMBER STATES EXTERNAL TRADE OF GOODS : IMPORTS1.6a 1 .6b

16 17
Titlesubtitle
Sources : Eurostat , Wor ld Bank . Relat ive GDP per capita and currency convers ion rates : own calculat ions based on World Bank data
GENERAL DATA
comparison EU-28 – world GENERAL DATA
dATA fOR 2013EU-28 USA JAPAN cHiNA RUSSiA
Populationmillion 506. 52 316. 13 127. 34 1357. 38 143. 50
Population growth % change since previous year 0.3 0.7 -0.2 0.5 0.2
Urban population % of total 74 81 92 53 74
Area1 000 km2 4 470 9 629 378 9 597 17 075
Population densityPersons/km2 113 33 337 141 8
gdP (nominal)billion EUR 13 529 12 629 3 705 6 959 1 579
Real gdP growth % 0.0 2.2 1.6 7.7 1.3
Relative gdP per capitain PPP (EU-28 = 100) 100 149 103 34 68
Exports of goodsbillion EUR 1 737 1 200 523 1 617 394
imports of goodsbillion EUR 1 685 1 728 591 1 352 257
Notes: EU-28: area, population: including French overseas departments. EU-28: trade: only extra-eU trade.
1.7 COMPARISON EU-28 – WORLD : GENERAL DATA
PART 2
Transport

18 19
Titlesubtitle
TRANSPORT
PART 2SUMMARY
Gross Value Added:
With around € 562 billion in Gross Value added (GVa) at basic prices, the transport and storage services sector (including postal and courier activities) accounted for about 4.9 % of total GVa in the eU-28 in 2012 (1). it should be noted, however, that this figure only includes the GVa of companies whose main activity is the provision of transport (and transport-related) services and that own account transport operations are not included.
Employment:
in 2013, the transport and storage services sector (including postal and courier activities) in the eU-28 employed around 11 million persons (2), some 5.1 % of the total workforce (3). around 53 % of them worked in land transport (road, rail and pipelines), 3 % in water transport (sea and inland waterways), 4 % in air transport and 25 % in warehousing and supporting and transport activities (such as cargo handling, storage and warehousing) and the remaining 16 % in postal and courier activities.
Household expenditure:
in 2013, it is estimated that private households in the eU-28 spent € 961 billion or roughly 12.8 % of their total consumption on transport-related items.
close to 26 % of this sum (around € 248 billion) was used to purchase vehicles, more than half (€ 520 billion) was spent on the operation of personal transport equipment (e.g. to buy fuel for the car) and the rest (€ 193 billion) was spent for transport services (e.g. bus, train, plane tickets).
goods transport:
in 2013 total goods transport activities in the eU-28 are estimated to amount to 3 481 billion tkm. this figure includes intra-eU air and sea transport but not transport activities between the eU and the rest of the world. Road transport accounted for 49.4 % of this total, rail for 11.7 %, inland waterways for 4.4 % and oil pipelines for 3.2 %. intra-eU maritime transport was the second most important mode with a share of 31.3 % while intra-eU air transport only accounted for 0.1 % of the total.
Passenger transport:
in 2013, total passenger transport activities in the eU-28 by any motorized means of transport are estimated to amount to 6 465 billion pkm or on average around 12 700 km per person. this figure includes intra-eU air and sea transport but not transport activities between the eU and the rest of the world. passenger cars accounted for 72.3 % of this total, powered two-wheelers for 1.9 %, buses & coaches for 8.1 %, railways for 6.6 % and tram and metro for 1.5 %. intra-eU air and intra-eU maritime transport contributed for 9 % and 0.6 % respectively.
Notes: (1) it is estimated that the transport share amounts of 4.4 % of total GVa if postal and courier activities are not included. (2) Figures on number of persons employed in transport, total workforce and
shares per mode based on eurostat labour Force Survey. (3) 4.3 % of total employment if postal and courier activities are not included.
2.1 GENERAL . . . . . . . . . . . . . . . . . . . . . . . . . . . . . . . . . . . . . . . . . . . . . . . . . . . . . . . . . . . . . . . . . . . . . . . . . . . . . . . . . . . . . 19
2.2 PERFORMANCE OF FREIGHT TRANSPORT
EXPRESSED IN TONNE-KILOMETRES . . . . . . . . . . . . . . . . . . 35
2.3 PERFORMANCE OF PASSENGER TRANSPORT
EXPRESSED IN PASSENGER-KILOMETRES . . . . . . . . . . . . . . . . 45
2.4 PERFORMANCE OF FREIGHT AND PASSENGER
TRANSPORT USING OTHER INDICATORS . . . . . . . . . . . . . . . . . . . . . 54
2.5 INFRASTRUCTURE . . . . . . . . . . . . . . . . . . . . . . . . . . . . . . . . . . . . . . . . . . . . . . . . . . . . . . . . . . . . . . . . . . . 76
2.6 MEANS OF TRANSPORT . . . . . . . . . . . . . . . . . . . . . . . . . . . . . . . . . . . . . . . . . . . . . . . . . . . . . . . . 84
2.7 SAFETY . . . . . . . . . . . . . . . . . . . . . . . . . . . . . . . . . . . . . . . . . . . . . . . . . . . . . . . . . . . . . . . . . . . . . . . . . . . . . . . . . . . . . . . 102
2.1 .1
Statistical Overview EU Transport
TRANSPORT
2.1 GENERAL

20 21
Titlesubtitle
Titlesubtitle
TRANSPORT
GENERAL
Transport growth EU-28
2.1 .2
Safety:
Road: 25 938 persons were killed in road accidents (fatalities within 30 days) in 2013, 7.8 % fewer than in 2012 (when 28 143 people lost their lives). in comparison with 2001, the number of road fatalities was lower by more than half (-52.8 %).
Rail: 97 passengers lost their lives in 2013; this figure does not include casualties among railway employees or other people run over by trains.
Air: 120 lives were lost in 2013.
2 .1 .1 TRANSPORT
GENERAL
ANNUAl gROwTH RATES EU-28
1995–2013 p.a. 2000–2013 p.a. 2012–2013
GDP at year 2000 prices and exchange rates 1.6 % 1.2 % 0.0 %
Passenger transport (pkm) 1.0 % 0.6 % 1.1 %
Freight transport (tkm) 1.1 % 0.5 % 0.1 %
PASSENGERS (1) (pkm)
GOODS (2) (tkm)
GDP (AT CONSTANT YEAR 2000 PRICES)
YEAR 1995
= 100PASSENgERS, gOOdS, gdP 1995–2013
140
135
130
125
120
115
110
105
100
1995
1996
1997
1998
1999
2000
2001
2002
2003
2004
2005
2006
2007
2008
2009
2010
2011
2012
2013
Statistical Overview EU Transport
Sources : Eurostat , Tables 2 .2 .2 and 2 .3 .2
Notes: (1) passenger cars, powered two-wheelers, buses & coaches, tram & metro, railways, intra-eU air, intra-eU sea.
(2) Road, rail, inland waterways, oil pipelines, intra-eU air, intra-eU sea. GDP: at constant year 2005 prices and exchange rates.

22 23
Titlesubtitle
Titlesubtitle
TRANSPORT
GENERAL
TRANSPORT
GENERAL 2.1 .4 2 .1 .3
Road Transport: SPEED LIMITS, BLOOD ALCOHOL LIMITS
SPEEd limiT, cARS (iN gENERAl), km/h: Blood alcohol limit, grams of
alcohol in 1 litre of bloodBuilt-up areas
Outside built-up areas Motorways
BE 30-50 90-120 120 0.5BG 50 90 130 0.5CZ 50 90 130 0.0DK 50 80 130 0.5DE 50 100 (130) 0.5EE 50 90-110 - 0.2IE 50 80-100 120 0.5
EL 50 90-110 130 0.5ES 50 90-100 120 0.5FR 50 80-110 110-130 0.5HR 50 90-110 130 0.5
IT 50 90-110 130 0.5CY 50 80 100 0.5LV 50 90 110 0.5LT 50 70-90 110-130 0.4LU 50 90 110-130 0.5
HU 50 90-110 130 0.0MT 50 80 - 0.8NL 50 80-100 130 0.5AT 50 100 130 0.5PL 50-60 90-120 140 0.2PT 50 90-100 120 0.5RO 50 90-100 130 0.0
SI 30-50 90-100 130 0.5SK 50 90 130 0FI 40-50 80-100 100-120 0.5
SE 50 70 110 0.2UK 32-48 96-112 112 0.8AL 40 80-90 110 0.5
ME 50 80-100 130 0.5MK 60 80-100 120 0.5RS 50 80-100 120 0.3TR 50 90-110 120 0.5IS 50 80-90 - 0.5
NO 50 80 90-100 0.2CH 50 80-100 120 0.5
Notes: UK, IE, CY and MT drive on the left hand side of the road, the other Member States drive on the right hand side (Sweden since 3 September 1967). Signs in UK are in miles per hour. the higher figure shown in the ‘outside built-up areas’ column generally refers to the speed limit on dual carriageways that are not motorways. Speed limits: DE: motorways: no general speed limit, recommended speed limit is 130 km/h (more than half the network has a speed limit of 120 km/h or less). FR: dual carriageways 110 km/h. if the road is wet: motorways 110 km/h, dual carriageways 90 km/h, other roads outside built-up areas 80 km/h. IT: 150 km/h on certain 2x3 lane motorways if the operator so requests. FI: in winter 100 km/h on motorways, 80 km/h on other roads. PL: built-up areas: 50 km/h from 05h to 23h, 60 km/h from 23h to 05h. blood alcohol limits: in many countries, special (more restrictive) rules apply to novice (i.e. new, unexperienced) and professional drivers.
Sources : Nat ional sources , Internat ional Transport Forum, EC Road Safety website , T IPSOL, World Health Organisat ion
Road Transport: MAXIMUM GROSS VEHICLE WEIGHT
wEi
gH
T
PER
bEA
RiN
g
AXlE
wEi
gH
T
PER
dRi
vE
AXlE
lORRiES ROAd TRAiN
ARTicU-lATEd vEHi-clES
tonnes 2 axles 3 axles 4 axles5 axles
and more5 axles
and moreBE 10 12 19 26 39 44 44 (2)BG 10 11.5 18 26 (1) 36 40 40CZ 10 11.5 18 26 (1) 36 44 (1) 42 - 48DK 10 10 / 11.5 (3) 18 24 / 26 (1) (3) 38 42 - 48 42 - 48DE 10 11.5 18 26 (1) 36 40 40EE 10 11.5 18 26 (1) 36 (10) 40 (11) 40IE 10 11.5 (7) 18 26 (1) 36 44 (1) 44 (1)
EL 7 / 10 13 19 26 33 40 40ES 10 11.5 18 26 36 40 42 - 44FR 13 13 19 26 38 40 40HR 10 11.5 18 24 36 40 40
IT 12 12 18 26 (1) 40 44 44CY 10 11,5 18 25 36 40 40 (6)LV 10 11.5 18 26 (1) 40 40 40LT 10 11.5 18 26 (1) 36 40 40 - 44 (8)LU 10 12 (9) 19 26 44 44 44
HU 10 11.5 18 25 30 40 40 (6)MT 10 11.5 18 25 36 40 40 (6)NL 10 11.5 21.5 33 40 50 50AT 10 11.5 18 26 36 40 40PL 10 11.5 18 26 (1) 36 40 40PT 10 12 19 26 37 (10) 40 40RO 10 11.5 18 25 36 40 40
SI 10 11.5 18 26 (1) 36 40 40SK 10 11.5 18 26 (1) 36 40 40FI 10 11.5 18 26 (1) 36 44 - 60 (4) 42 - 48
SE 10 11.5 18 26 (1) 38 48 - 60 (5) 48 - 60 (5)UK 10 11.5 18 26 (1) 36 40 40 - 44 (8)AL 10 11.5 (12) 18 26 (1) 36 40 44
ME 10 11.5 18 26 (1) 36 40 40 - 44 (8)MK 10 11.5 18 24 31 40 40RS 10 11.5 18 26 32 40 40TR 10 11.5 18 25 / 26 36 40 40 - 44 (8)IS 10 11.5 18 26 (1) 36 40 44
NO 10 11.5 19 26 37 42 44CH 10 11.5 18 26 (1) 36 40 40
LI 10 11.5 18 26 36 40 40
Notes: an articulated vehicle consists of a road tractor coupled to a semi-trailer. a road train is a goods road motor vehicle coupled to one or more trailers. (1) For axles equipped with air suspension or equivalent. (2) 2 axles tractor + 3 axles semi-trailer: mechancial suspension = 43 t, pneumatic suspension = 44 t. (3) National traffic / international traffic. (4) 5 axles = 44 t; 6 axles = 56 t; 7 axles = 60 t. (5) 5 axles = 48 t; 6 axles = 58 t; 7 axles = 60 t. (6) 44 t for 40 feet long iSo containers. (7) 10.5 t for vehicles with mechanical suspension in national traffic. (8) Higher value for vehicles engaged in combined transport. (9) 11.5 t if mechanical suspension. (10) 35 t for 3-axle tractor + 1-axle trailer. (11) 44 t for 3 and + axles tractor + 3 and + axles trailer. (12) Weight per drive axle: national traffic = 10 t; international traffic = 11.5 t; lorry 3 axles: national traffic = 24 t; international traffic = 26 t.
Sources : Internat ional Transport Forum, nat ional sources

24 25
Titlesubtitle
Titlesubtitle
TRANSPORT
GENERAL
TRANSPORT
GENERAL2.1 .5 2 .1 .6
Employment by mode of Transport (*)(in 1 000) – 2012
TOTA
L
ROA
D
frei
ght t
rans
port
ROA
D
pass
enge
r tra
nspo
rt (*
*)
Railw
ays
Pipe
lines
Inla
nd w
ater
tr
ansp
ort
Sea
tran
spor
t
Air
tran
spor
t
War
ehou
sing
an
d su
ppor
t act
ivit
ies
Post
al a
nd c
ouri
er
acti
viti
es
EU-28 10 546.6 2 945.7 1 988.5 577.0 28.4 40.1 164.0 366.5 2 601.9 1 834.3
BE 211.9 62.1 18.0 1.3 0.1 0.6 1.1 5.2 90.4 32.9
BG 153.9 51.8 33.6 9.8 0.5 0.9 3.4 2.2 32.5 19.2
CZ 267.4 116.4 38.3 28.6 1.0 0.5 0.0 2.5 38.9 41.3
DK 150.6 34.0 23.9 6.7 0.0 0.2 21.0 11.0 28.3 25.4
DE 2 012.4 396.4 366.1 47.0 3.3 8.3 19.1 62.0 599.9 510.1
EE 38.6 14.4 5.7 1.7 0.0 0.0 0.8 0.4 11.8 3.6
IE 75.9 18.2 12.5 3.1 0.0 0.1 2.5 7.9 15.3 16.4
EL 162.3 30.9 65.0 1.1 0.2 0.0 13.0 3.6 35.5 13.1
ES 861.3 321.2 179.1 19.6 1.9 0.4 6.6 29.7 215.0 87.7
FR 1 382.3 351.5 250.4 171.1 4.9 3.7 11.0 42.3 262.8 284.6
HR 77.3 19.8 10.5 2.8 0.4 0.2 4.1 3.0 23.7 12.7
IT 1 076.0 316.2 169.2 40.1 2.2 2.5 26.7 24.6 333.4 161.2
CY 17.8 2.1 3.0 0.0 0.0 0.0 1.8 1.1 8.4 1.4
LV 72.8 22.7 12.4 3.7 0.2 0.1 0.7 1.5 25.7 5.7
LT 103.3 49.0 15.1 10.8 0.0 0.0 1.6 0.4 17.9 8.6
LU 23.0 7.9 4.6 0.5 0.0 0.2 0.0 2.6 3.7 3.5
HU 219.5 65.1 48.0 11.7 0.8 0.9 0.0 1.0 53.7 38.3
MT 9.6 1.0 1.5 0.0 0.0 0.0 0.5 2.9 2.7 1.0
NL 411.0 117.0 51.3 30.7 0.1 13.3 13.0 25.3 82.6 77.8
AT 207.8 58.7 54.7 12.0 0.5 0.5 0.0 6.9 49.0 25.6
PL 729.5 290.0 138.9 58.2 3.4 0.9 2.4 5.4 128.7 101.5
PT 153.4 59.8 34.1 3.6 0.1 0.6 0.9 10.6 28.4 15.3
RO 330.6 105.5 78.1 31.9 6.7 2.3 0.4 3.9 60.4 41.6
SI 44.3 20.8 5.1 1.3 0.1 0.3 0.2 0.6 8.3 7.6
SK 120.5 37.6 18.4 13.5 1.0 0.4 0.0 0.4 33.1 16.1
FI 147.2 44.7 32.2 8.5 0.2 0.4 9.1 9.9 29.0 13.2
SE 271.7 77.5 68.5 10.3 0.0 1.5 14.3 24.9 48.7 26.1
UK 1 214.5 253.4 250.1 47.6 0.6 1.3 9.7 74.8 334.1 242.6
Notes: (*) Data refer to transportation and storage activities (including postal and courier services, removal services). Data are based on Structural business Statistics and therefore total transport employment differs from value on overview 2.1.1. the values above in italics are not from eStat or other official source, but are merely indicative estimates made by DG MoVe.
(**) including all urban and suburban land transport modes (motor bus, tramway, streetcar, trolley bus, underground and elevated railways). the above figures refer to those companies whose main activity lies in the mode concerned.economic activity according to Nace Rev. 2 classification.
Source : Eurostat , est imates ( in i ta l ics)
Number of Enterprises by mode of Transport (*) – 2012
TOTA
L
ROA
D
frei
ght t
rans
port
ROA
D
pass
enge
r tra
nspo
rt (*
*)
Railw
ays
Pipe
lines
Inla
nd w
ater
tr
ansp
ort
Sea
tran
spor
t
Air
tran
spor
t
War
ehou
sing
an
d su
ppor
t act
ivit
ies
Post
al a
nd c
ouri
er
acti
viti
es
EU-28 1 134 371 573 148 343 094 804 209 9 430 11 538 4 130 136 888 55 126
BE 17 070 7 760 2 701 11 33 336 123 262 3 200 2 644
BG 19 003 9 943 6 461 11 3 28 24 47 1 979 507
CZ 40 064 31 331 3 610 27 2 84 2 39 4 643 326
DK 11 812 5 500 3 067 18 4 22 332 63 1 402 1 404
DE 87 820 35 662 23 546 144 38 984 2 112 491 15 595 9 248
EE 4 479 2 729 436 7 0 4 35 10 1 182 76
IE 9 152 4 116 1 109 8 0 0 743 45 1 120 2 011
EL 65 823 20 432 35 421 5 3 0 2 187 22 7 392 361
ES 200 928 113 925 63 606 12 7 67 267 81 16 743 6 220
FR 98 575 36 131 46 597 51 53 1 104 655 511 10 228 3 245
HR 9 208 6 136 1 358 2 2 14 603 32 1 018 43
IT 131 755 75 565 28 937 25 13 968 782 233 22 810 2 422
CY 3 137 998 1 189 0 0 0 53 1 719 177
LV 6 303 3 234 826 23 1 13 46 23 1 837 300
LT 9 843 4 511 2 833 5 0 13 11 13 1 637 820
LU 974 486 194 2 0 27 0 20 193 52
HU 28 578 15 099 8 388 32 5 108 12 93 3 621 1 220
MT 1 401 407 705 0 0 0 17 9 235 24
NL 31 485 10 134 5 371 28 10 4 235 777 320 5 463 5 147
AT 13 855 6 587 5 191 26 6 79 0 177 1 338 451
PL 141 739 81 512 46 277 105 5 283 212 221 10 342 2 782
PT 22 899 8 694 11 186 5 3 43 172 67 2 307 422
RO 34 064 21 452 9 053 74 3 119 43 61 2 353 906
SI 8 491 5 661 1 064 6 2 35 39 61 1 064 559
SK 16 734 8 349 4 530 15 5 31 0 15 3 367 422
FI 22 541 10 682 9 170 4 2 80 246 81 1 921 355
SE 29 899 15 202 8 983 54 0 493 800 277 3 655 435
UK 66 739 30 910 11 285 104 9 260 1 245 855 9 524 12 547
Notes: (*) Data refer to transportation and storage activities (including postal and courier services, removal services). the values above in italics are not from eStat or other official source, but are merely indicative estimates made by DG MoVe.
(**) including all urban and suburban land transport modes (motor bus, tramway, streetcar, trolley bus, underground and elevated railways). the above figures refer to those companies whose main activity lies in the mode concerned. economic activity according to Nace Rev. 2 classification.
Source : Eurostat , est imates ( in i ta l ics)

26 27
Titlesubtitle
Titlesubtitle
Turnover by mode of Transport (*)2012 (million EUR)
TRANSPORT
GENERAL
TRANSPORT
GENERAL2.1 .7 2 .1 .8
TOTA
L
ROA
D
frei
ght t
rans
port
ROA
D
pass
enge
r tra
nspo
rt (*
*)
Railw
ays
Pipe
lines
Inla
nd w
ater
tr
ansp
ort
Sea
tran
spor
t
Air
tran
spor
t
War
ehou
sing
an
d su
ppor
t act
ivit
ies
Post
al a
nd c
ouri
er
acti
viti
es
EU-28 1 359 850 312 121 121 292 70 992 13 757 7 162 109 978 133 878 478 761 111 889
BE 48 704 11 624 1 388 1 818 158 311 5 153 3 137 21 589 3 527
BG 5 390 2 672 479 142 50 51 159 372 1 215 252
CZ 21 614 7 797 1 379 1 407 303 70 0 1 160 8 237 1 261
DK 49 280 5 742 2 740 274 21 97 25 683 2 934 9 326 2 463
DE 262 616 37 905 27 185 11 071 3 437 2 161 26 865 20 547 106 643 26 801
EE 5 324 1 100 159 172 0 9 522 135 3 143 83
IE 16 579 2 337 845 449 0 0 525 7 298 3 753 1 372
EL 11 602 2 452 2 019 91 256 0 1 618 1 083 3 305 779
ES 98 024 31 726 8 961 1 931 1 751 21 1 740 8 555 39 140 4 200
FR 204 000 42 997 18 484 20 761 2 302 785 13 940 21 196 69 967 13 568
HR 3 671 1 164 296 243 125 6 316 253 1 144 126
IT 144 636 44 310 11 863 5 183 701 169 11 240 9 110 50 338 11 723
CY 1 605 148 141 0 0 0 131 185 942 58
LV 5 402 1 333 171 386 173 0 27 405 2 812 95
LT 7 165 3 028 237 508 0 5 169 121 2 984 113
LU 5 054 1 210 186 138 0 176 0 2 333 924 86
HU 14 277 4 469 1 360 488 666 96 1 998 5 339 862
MT 1 050 74 53 0 0 0 84 121 551 166
NL 73 924 19 657 3 769 2 960 417 2 291 5 424 10 330 23 906 5 171
AT 40 137 9 493 3 972 2 774 757 90 0 3 590 16 859 2 603
PL 40 178 19 893 3 590 2 666 846 144 384 1 708 8 953 1 994
PT 17 424 4 709 1 168 308 143 34 315 3 761 6 123 865
RO 11 962 5 451 1 066 895 373 149 45 533 2 841 609
SI 4 632 2 059 231 90 36 31 166 225 1 491 304
SK 7 468 2 435 392 1 040 302 60 0 123 2 592 525
FI 23 178 5 935 2 377 760 158 139 2 732 2 905 6 618 1 534
SE 49 269 11 373 7 694 1 850 0 167 3 721 2 999 18 033 3 433
UK 185 686 29 031 19 089 12 586 785 102 9 020 27 762 59 993 27 319
Notes: (*) Data refer to transportation and storage activities (including postal and courier services, removal services). the values above in italics are not from eStat or other official source, but are merely indicative estimates made by DG MoVe.
(**) including all urban and suburban land transport modes (motor bus, tramway, streetcar, trolley bus, underground and elevated railways). the above figures refer to those companies whose main activity lies in the mode concerned. economic activity according to Nace Rev. 2 classification.
Source : Eurostat , est imates ( in i ta l ics)
final consumption of Households for Transport
by TyPE Of EXPENdiTURE – 2013
fiN
Al
cON
SUm
PTiO
N
Of
HO
USE
HO
ldS
fO
R TR
ANSP
ORT
of which:
TRAN
SPO
RT A
S
A %
Of
TOTA
l fi
NAl
cO
NSU
mPT
iON
O
f H
OU
SEH
Old
S
EXPE
Nd
iTU
RE
PER
HEA
d O
N
TRAN
SPO
RTpurchase of personal transport
equipment
operation of personal transport
equipment
purchased transport services
million EUR % EUREU-28 961 458 248 213 520 171 193 074 12.8 1 900
BE 22 804 6 093 14 690 2 021 11.7 2 100
BG 4 226 879 1 958 1 389 15.4 600
CZ 7 286 2 194 3 787 1 305 9.1 700
DK 13 883 4 369 7 786 1 728 11.6 2 500
DE 205 400 68 166 95 486 41 748 13.8 2 500
EE 1 269 211 801 258 12.9 1 000
IE 9 609 2 157 4 944 2 507 12.7 2 100
EL 15 348 2 870 6 304 6 173 11.3 1 400
ES 68 147 13 871 42 837 11 439 10.9 1 500
FR 148 216 38 327 83 852 26 037 13.0 2 200
HR 3 332 846 1 804 696 12.6 783
IT 118 024 19 360 79 666 18 998 11.9 1 900
CY 1 260 263 793 204 9.3 1 500
LV 1 621 243 1 074 304 11.4 800
LT 3 319 539 2 339 441 15.0 1 100
LU 2 794 880 1 809 105 16.4 5 100
HU 7 019 1 372 4 720 927 13.0 700
MT 619 119 360 141 12.5 1 500
NL 36 146 8 162 22 052 5 932 12.8 2 200
AT 22 481 5 420 12 888 4 174 12.8 2 700
PL 28 275 7 653 16 557 4 066 11.9 700
PT 13 653 3 154 8 615 1 884 12.0 1 300
RO 9 051 2 041 5 367 1 630 10.7 453
SI 3 328 631 2 441 255 16.0 1 600
SK 3 036 545 1 418 1 073 7.4 600
FI 13 063 3 124 7 542 2 397 12.3 2 400
SE 24 280 6 204 12 519 5 557 12.3 2 500
UK 173 970 48 521 75 762 49 687 14.0 2 700
Sources : Eurostat , est imates ( in i ta l ics) . F inal consumption der ived from the new ESA2010 Nat ional Accounts Methodology

28 29
Titlesubtitle
Titlesubtitle
EU-28 Evolution of consumer Prices for Passenger Transport
TRANSPORT
GENERAL
TRANSPORT
GENERAL2.1 .9 2 .1 .10
YEAR 2005
= 100
OPERATiON Of
PERSONAl TRANSPORT EqUiPmENT
of which:Spare parts
and accessories for personal
transport equipment
Fuels and lubricants
for personal transport
equipment
Maintenance and repair
of personal transport
equipment
Other services
in respect of personal transport
equipment2014 133.8 122.8 138.5 132.7 120.52013 135.2 122.3 143.2 129.9 118.92012 135.6 121.3 146.3 126.9 116.82011 129.2 118.6 136.7 123.7 114.82010 119.2 115.5 120.3 120.2 112.92009 109.9 112.8 105.1 117.1 110.82008 115.3 109.6 119.0 112.8 107.72007 107.5 105.8 108.1 107.9 104.92006 104.3 102.5 105.5 103.7 102.22005 100.0 100.0 100.0 100.0 100.02004 93.7 97.7 90.6 96.3 97.82003 89.3 95.4 84.9 92.4 95.9
YEAR 2005
= 100TRANS-PORT
SERvicES
of which:
Passenger transport by railway
Passenger transport by road
Passenger transport
by air
Passenger transport
by sea and inland
waterway
Combined passenger transport
Other purchased transport services
2014 141.7 141.1 136.3 132.4 148.7 138.7 112.92013 138.8 138.1 133.9 131.3 144.6 135.1 112.22012 134.4 134.2 130.8 126.2 144.5 130.6 111.72011 128.1 128.5 125.7 120.3 140.3 124.5 109.82010 121.3 123.9 120.9 112.2 128.9 119.5 108.82009 117.2 118.0 117.9 110.0 128.0 116.5 109.42008 113.2 112.8 113.3 110.9 117.8 111.9 109.02007 106.6 108.4 107.8 100.3 113.2 107.0 105.72006 103.2 103.4 103.8 100.7 106.2 103.6 102.62005 100.0 100.0 100.0 100.0 100.0 100.0 100.02004 95.4 96.5 95.5 94.5 100.2 96.5 97.82003 92.3 93.2 92.0 93.4 102.3 92.2 95.2
Source : Eurostat
HARmONiSEd iNdEX Of cONSUmER PRicES
YEAR 2005
= 100 All iTEmS TRANSPORTPURcHASE
Of vEHiclES
of which:
Motor cars
Motorcycles, bicycles and
animal drawn vehicles
2014 120.9 125.9 103.4 102.9 108.82013 120.2 126.0 102.8 102.3 108.02012 118.4 125.5 102.6 102.2 107.12011 115.4 121.0 102.3 101.9 106.72010 111.9 114.3 101.7 101.4 105.12009 109.6 108.4 101.2 100.9 103.72008 108.6 110.7 101.3 101.3 100.72007 104.7 105.6 101.6 101.7 100.32006 102.3 103.0 100.6 100.7 99.52005 100.0 100.0 100.0 100.0 100.02004 97.8 95.7 99.7 99.6 100.42003 95.6 92.6 98.9 98.7 100.3
EU-28 External Trade by mode of Transport2013
vAlUE (billion EUR)PARTNER: EXTRA-EU-28
ExPORT IMPORT ExPORT + IMPORT
Sea 827.8 47.7 % 905.8 53.8 % 1 733.7 50.7 %
Road 339.7 19.6 % 215.6 12.8 % 555.3 16.2 %
Rail 23.6 1.4 % 18.4 1.1 % 42.0 1.2 %
Inland waterway 5.5 0.3 % 3.0 0.2 % 8.5 0.2 %
Pipeline 3.9 0.2 % 113.0 6.7 % 116.9 3.4 %
Air 482.2 27.8 % 305.0 18.1 % 787.1 23.0 %
Self propulsion 47.2 2.7 % 14.5 0.9 % 61.6 1.8 %
Post 1.0 0.1 % 1.5 0.1 % 2.5 0.1 %
Unknown 5.7 0.3 % 108.1 6.4 % 113.8 3.3 %
TOTAL 1 736.6 100.0 % 1 684.8 100.0 % 3 421.4 100.0 %
wEigHT (million tonnes)PARTNER: EXTRA-EU-28
ExPORT IMPORT ExPORT + IMPORT
Sea 503.8 79.0 % 1 186.5 73.9 % 1 690.2 75.3 %
Road 87.1 13.7 % 56.1 3.5 % 143.2 6.4 %
Rail 19.3 3.0 % 65.5 4.1 % 84.9 3.8 %
Inland waterway 9.4 1.5 % 10.7 0.7 % 20.1 0.9 %
Pipeline 3.0 0.5 % 219.3 13.7 % 222.3 9.9 %
Air 13.6 2.1 % 3.4 0.2 % 17.1 0.8 %
Self propulsion 1.2 0.2 % 3.3 0.2 % 4.5 0.2 %
Post 0.0 0.0 % 0.0 0.0 % 0.0 0.0 %
Unknown 0.5 0.1 % 61.6 3.8 % 62.1 2.8 %
TOTAL 638.0 100.0 % 1 606.4 100.0 % 2 244.4 100.0 %
Note: Data for intra-eU trade are no longer available by mode of transport used.
Source : Eurostat

30 31
Titlesubtitle
Titlesubtitle
Environmental Taxes and Transport AS % OF GDP – TRANSPORT FUEL TAXES (*)
2.1 .12 2 .1 .11 TRANSPORT
GENERAL
TRANSPORT
GENERAL
%RANKING
IN 2012 2005 2006 2007 2008 2009 2010 2011 2012EU-28 1.5 1.5 1.4 1.4 1.4 1.4 1.4 1.4
BE 1.3 1.2 1.2 1.1 1.1 1.2 1.2 1.1 26
BG 2.9 2.9 2.6 2.5 2.5 2.4 2
CZ 2.2 2.1 2.1 2.0 2.1 2.0 2.0 1.9 6
DK 1.2 1.2 1.1 1.1 1.1 1.0 1.0 1.0 28
DE 1.6 1.5 1.4 1.4 1.5 1.4 1.4 1.3 20
EE 1.8 1.7 1.7 1.7 2.2 2.1 1.9 2.1 4
IE 1.2 1.2 1.1 1.2 1.3 1.3 1.2 1.2 23
EL 1.1 1.1 1.1 1.1 1.1 1.7 1.8 1.9 7
ES 1.3 1.2 1.2 1.1 1.1 1.1 1.1 1.0 27
FR 1.4 1.3 1.3 1.2 1.2 1.2 1.2 1.1 24
HR 2.2 2.1 2.0 1.7 1.8 2.1 1.8 1.7 12
IT 1.6 1.6 1.5 1.5 1.5 1.5 1.5 1.8 9
CY 1.6 1.5 1.5 1.4 1.4 1.7 1.8 1.7 11
LV 2.2 2.0 1.7 1.7 2.0 2.0 1.9 1.8 8
LT 1.7 1.6 1.6 1.5 1.9 1.7 1.6 1.5 15
LU 2.8 2.5 2.3 2.4 2.4 2.2 2.2 2.2 3
HU 1.8 1.9 1.8 1.8 1.8 1.9 1.8 1.8 10
MT 1.2 1.2 1.7 1.4 1.2 1.4 1.6 1.5 16
NL 1.3 1.3 1.3 1.2 1.3 1.3 1.3 1.3 22
AT 1.4 1.3 1.3 1.3 1.3 1.3 1.4 1.3 21
PL 1.8 1.9 2.0 2.0 1.9 1.9 2.0 2.0 5
PT 1.9 1.9 1.9 1.7 1.8 1.7 1.7 1.6 13
RO 1.3 1.3 1.6 1.6 1.4 1.5 17
SI 2.1 2.1 2.1 2.2 2.7 2.7 2.6 2.9 1
SK 2.1 2.0 1.8 1.8 1.7 1.6 1.6 1.5 18
FI 1.4 1.4 1.3 1.3 1.4 1.4 1.3 1.3 19
SE 1.4 1.3 1.2 1.2 1.3 1.2 1.1 1.1 25
UK 1.7 1.6 1.6 1.6 1.7 1.7 1.6 1.6 14
ALMEMKRSTRIS
NO 0.9 0.8 0.8 0.7 0.8 0.8 0.7 0.7
CH
Notes: (*) transport fuel taxes include those taxes which are levied on the transport use of fuels/energy products. eU aggregates are weighted averages.
Source : Commission serv ices Source : Commission serv ices
Environmental Taxes and Transport AS % OF GDP – TRANSPORT (EXCL. FUEL) (*)
%RANKING
IN 2012 1995 2000 2005 2008 2009 2010 2011 2012EU-28 0.5 0.5 0.5 0.5 0.5 0.5
BE 0.8 0.8 0.8 0.7 0.8 0.7 0.8 0.7 9
BG 0.2 0.2 0.2 0.3 0.3 0.3 0.2 0.3 19
CZ 0.3 0.2 0.2 0.2 0.1 0.1 0.1 0.1 26
DK 2.1 1.8 2.2 1.8 1.5 1.5 1.5 1.4 1
DE 0.4 0.3 0.4 0.4 0.3 0.3 0.4 0.4 18
EE 0.3 0.2 0.1 0.0 0.0 0.0 0.1 0.1 27
IE 1.3 1.4 1.2 1.1 0.9 1.0 0.9 0.9 5
EL 0.7 0.8 0.9 0.8 0.8 0.7 0.7 0.7 10
ES 0.4 0.4 0.4 0.3 0.3 0.3 0.3 0.3 20
FR 0.4 0.3 0.2 0.2 0.2 0.2 0.2 0.2 21
HR 1.1 1.1 0.9 0.9 0.8 0.8 6
IT 0.5 0.6 0.6 0.6 0.6 0.6 0.6 0.6 11
CY 2.3 2.0 1.6 1.6 1.3 1.1 0.9 0.8 7
LV 0.0 0.3 0.3 0.2 0.2 0.3 0.5 0.4 15
LT 0.7 0.7 0.5 0.0 0.0 0.0 0.0 0.0 28
LU 0.1 0.1 0.1 0.2 0.2 0.2 0.2 0.1 25
HU 0.2 0.4 0.5 0.6 0.5 0.5 0.5 0.4 16
MT 2.3 2.2 1.7 1.6 1.6 1.4 1.4 1.3 2
NL 1.3 1.4 1.3 1.3 1.2 1.2 1.2 1.1 3
AT 0.7 0.8 0.8 0.7 0.8 0.8 0.8 0.8 8
PL 0.2 0.2 0.3 0.3 0.2 0.2 0.2 0.2 23
PT 0.9 1.1 0.9 0.7 0.6 0.7 0.6 0.5 13
RO 0.0 0.1 0.1 0.4 0.3 0.2 0.2 0.2 24
SI 1.0 0.4 0.5 0.5 0.4 0.4 0.4 0.4 17
SK 0.2 0.2 0.2 0.2 0.2 0.2 0.2 0.2 22
FI 0.8 1.1 1.2 0.9 0.8 0.9 1.0 0.9 4
SE 0.3 0.3 0.4 0.5 0.5 0.5 0.5 0.4 14
UK 0.6 0.6 0.5 0.5 0.6 0.6 0.6 0.6 12
ALMEMKRSTRIS 1.1 1.7 1.6 0.6 0.3 0.3 0.3 0.3
NO 1.4 1.2 1.4 1.1 1.1 1.2 1.2 1.1
CH
Notes: (*) transport taxes (excl. fuel) mainly include taxes related to the ownership and use of motor vehicles. eU aggregates are weighted averages.

32 33
Titlesubtitle
Titlesubtitle
Source : Commission serv ices
2.1 .14 2 .1 .13
Environmental Taxes and Transport (FUEL AND OTHER TAXES) AS % OF TOTAL TAXATION (*)
TRANSPORT
GENERAL
TRANSPORT
GENERAL
%RANKING
IN 2012 2005 2006 2007 2008 2009 2010 2011 2012EU-28 5.3 5.1 5.0 4.9 5.1 5.0 4.9 4.8
BE 4.8 4.5 4.4 4.2 4.4 4.4 4.4 4.1 25
BG 9.6 10.0 9.9 10.1 9.9 9.6 1
CZ 6.7 6.5 6.3 6.2 6.8 6.3 6.1 5.8 16
DK 6.8 6.9 6.8 6.1 5.5 5.4 5.2 5.0 22
DE 5.2 5.0 4.7 4.6 4.6 4.6 4.5 4.3 24
EE 6.2 5.8 5.7 5.4 6.3 6.3 6.2 6.5 10
IE 7.9 7.5 7.8 7.7 8.0 8.0 7.6 7.3 6
EL 6.2 6.0 6.1 5.8 6.2 7.5 7.6 7.6 5
ES 4.8 4.5 4.3 4.3 4.6 4.3 4.2 4.0 26
FR 3.6 3.5 3.5 3.4 3.5 3.3 3.3 3.1 28
HR 8.9 8.6 8.2 7.4 7.3 8.2 7.4 6.9 8
IT 5.5 5.2 4.9 4.8 4.9 4.9 5.0 5.6 19
CY 9.2 8.3 7.7 7.7 7.7 7.7 7.6 7.0 7
LV 8.7 7.5 6.5 6.5 8.5 8.5 8.5 8.0 4
LT 7.4 5.6 5.5 5.0 6.3 6.3 6.0 5.9 15
LU 7.7 7.2 7.0 6.9 6.5 6.2 6.3 6.0 14
HU 6.3 6.8 6.1 5.8 5.7 6.2 6.1 5.6 20
MT 9.0 9.1 9.8 9.2 8.4 8.7 9.0 8.3 3
NL 6.9 6.8 6.7 6.6 6.7 6.5 6.4 6.1 13
AT 5.2 5.0 4.8 4.8 4.9 4.8 5.0 4.9 23
PL 6.4 6.2 6.5 6.4 6.7 6.8 6.6 6.7 9
PT 9.0 8.6 8.3 7.4 7.7 7.6 6.8 6.4 11
RO 5.8 6.1 6.8 6.6 5.7 5.8 18
SI 6.8 6.8 7.0 7.1 8.5 8.3 8.0 8.8 2
SK 7.4 7.4 6.9 6.8 6.5 6.3 6.1 5.8 17
FI 5.9 5.8 5.4 5.2 5.1 5.4 5.2 5.1 21
SE 3.6 3.5 3.5 3.8 3.9 3.8 3.6 3.5 27
UK 6.0 5.7 5.9 5.6 6.6 6.5 6.3 6.3 12
ALMEMKRSTRIS
NO 5.2 5.1 5.0 4.4 4.6 4.7 4.4 4.3
CH
Notes: (*) including taxes on fuel and other transport taxes. eU aggregates are weighted averages.
comparison EU-28 – world: INFRASTRUCTURE AND VEHICLES
Sources : Eurostat , Internat ional Road Federat ion , Union Internat ionale des Chemins de Fer, nat ional stat ist ics , est imates ( in i ta l ics)
TRANSPORT iNfRASTRUcTURE
EU-28 USA JAPAN CHINA RUSSIA
1 000 km 2012 2012 2012 (1) 2012 2012
Road network (paved) 5 000 4 258 983 3 610 1 038
Motorway network 73.2 92.0 (2) 8.1 (3) 96.2 50.9 (4)
Railway network 215.3 205.5 (5) 20.1 97.6 85.6
Electrified rail lines 115.7 12.4 35.5 43.0
Navigable inland waterways 41.9 40.2 125.0 102.0
Oil pipelines 37.3 298.6 91.6 (6) 55.0 (7)
vEHiclE STOck
EU-28 USA JAPAN CHINA RUSSIA
2013 2012 2013 2013 2013
Passenger cars stock million 248.0 234 (8) 70.9 (9) 71.3 39.2
Motorisation cars / 1 000 persons 491 739 557 53 273
Commercial freight vehicles
million 35.54 10.66 6.04 18.95 6.05
TRANSPORT SAfETy
EU-28 USA JAPAN CHINA RUSSIA
2013 2013 2013 2013 2013
Road fatalities
number 25 938 32 719 5 152 58 316 27 000
per million inhabitants 51 103 40 43 188
Notes: (1) Japan: data on the railway network and on the electrified rail lines are of 2010 and refer to Japan Railways only. (2) Divided highways with 4 or more lanes (rural or urban interstate, freeways, expressways, arterial and collector) with full access control by the authorities. (3) Japan: national expressways. (4) Russia: federal roads. (5) USA: a sum of partly overlapping networks. class i rail and amtrak mileage refer to 2011. (6) China: both oil and gas pipelines. (7) Russia: only crude oil pipelines. 20 thousand km of oil products pipelines are not included. (8) USA: light duty vehicles, short wheel and long wheel base. (9) Japan: including 31.1 million light motor vehicles (engine capacity up to 660 cubic centimetres).

34 35
Titlesubtitle
comparison EU-28 – world: PASSENGER AND FREIGHT TRANSPORT
2.1 .15 TRANSPORT
GENERAL
Sources: Eurostat, Japan Statistics Bureau, US Bureau of Transportation Statisitics, Goskom STAT (Russia), National Bureau of Statistics of China, International Transport Forum, estimates (in italics)
PASSENgER TRANSPORT
EU-28 USA JAPAN CHINA RUSSIA
billion pkm 2013 2013 2012 2013 2013
Passenger car 4 672.3 5 935.6 (1) 1 125.1 (2)
Bus + trolley bus + coach 526.5 517.7 75.7 130.6
Railway 424.2 39.9 404 1 055.0 138.5
Tram + metro 95.4 23.0 (3) 50.9
Waterborne 39.0 0.6 3.1 6.8 0.6
Air (domestic / intra-EU-28) 582.5 949.0 78.0 565.7 225.2
fREigHT TRANSPORT
EU-28 USA JAPAN CHINA RUSSIA
billion tkm 2013 2012 2013 2013 2013
Road 1 719.4 3 886.0 210.6 5 573.8 250.0
Rail 406.3 2 536.2 (4) 20.5 2 917.4 2 196.0
Inland waterways 152.7 470.4 3 073.1 80.0
Oil pipeline 111.8 1 367.8 349.6 (5) 2 513.0
Sea (domestic / intra-EU-28) 1 088.6 263.1 (6) 184.9 4 870.5 39.0
Notes: (1) USA: including light trucks / vans. (2) China: including buses and coaches. (3) Japan: included in railway pkm. (4) USA: class i rail. (5) China: oil and gas pipelines. (6) USA: coastwise transport refers to 2011.
billion tonne-kilometres
1 800
1 600
1 400
1 200
1 000
800
400
300
200
100
0
Source : Tables 2 .2 .4c to 2 .2 .7 , est imates
EU-28 Performance by mode for freight Transport – 1995–2013
TRANSPORT
2.2 .1
RAIL
INLAND WATERWAYS
OIL PIPELINE
AIR
1995
1999
2003
1996
2000
2004
2007
1997
2001
2005
2008
1998
2002
2006
2009
2011
2013
2012
2010
SEA
ROAD
2.2 PERFORMANCE OF FREIGHT TRANSPORT EXPRESSED IN TONNE-KILOMETRES

36 37
TRANSPORT
PERFORMANCE OF FREIGHT TRANSPORT EXPRESSED IN TONNE-KILOMETRES
TRANSPORT
PERFORMANCE OF FREIGHT TRANSPORT EXPRESSED IN TONNE-KILOMETRES
Source : Tables 2 .2 .4c to 2 .2 .7 , est imates ( in i ta l ics)
fREigHT TRANSPORTbillion tonne-kilometres
ROAd RAiliNlANd
wATERwAyS PiPEliNES SEA (*) AiR TOTAl1995 1 289 388 122 115 930 2 2 846 2000 1 509 405 134 127 1 067 2 3 245 2001 1 553 388 133 134 1 083 2 3 292 2002 1 603 386 133 130 1 100 2 3 353 2003 1 608 394 124 132 1 119 2 3 378 2004 1 751 419 137 133 1 159 2 3 601 2005 1 795 416 139 138 1 198 2 3 687 2006 1 858 438 139 137 1 224 2 3 798 2007 1 925 452 145 128 1 190 2 3 843 2008 1 891 443 146 125 1 164 2 3 771 2009 1 700 364 131 122 1 062 2 3 380 2010 1 755 394 156 121 1 118 2 3 546 2011 1 744 422 142 118 1 133 2 3 562 2012 1 693 407 150 115 1 113 2 3 480 2013 1 719 407 153 112 1 089 2 3 481
1995–2013per year
33.4 % 4.7 % 25.1 % -2.7 % 17.0 % 27.0 % 22.3 %1.6 % 0.3 % 1.3 % -0.2 % 0.9 % 1.3 % 1.1 %
2000–2013per year
13.9 % 0.2 % 14.1 % -12.0 % 2.0 % 3.7 % 7.3 %1.0 % 0.0 % 1.0 % -1.0 % 0.2 % 0.3 % 0.5 %
2012–2013 1.6 % 0.0 % 1.8 % -2.7 % -2.2 % -1.0 % 0.1 %
mOdAl SPliT(%)
ROAd RAiliNlANd
wATERwAyS PiPEliNES SEA (*) AiR1995 45.3 13.6 4.3 4.0 32.7 0.12000 46.5 12.5 4.1 3.9 32.9 0.12001 47.2 11.8 4.0 4.1 32.9 0.12002 47.8 11.5 4.0 3.9 32.8 0.12003 47.6 11.7 3.7 3.9 33.1 0.12004 48.6 11.6 3.8 3.7 32.2 0.12005 48.7 11.3 3.8 3.7 32.5 0.12006 48.9 11.5 3.6 3.6 32.2 0.12007 50.1 11.8 3.8 3.3 31.0 0.12008 50.1 11.7 3.9 3.3 30.9 0.12009 50.3 10.8 3.9 3.6 31.4 0.12010 49.5 11.1 4.4 3.4 31.5 0.12011 49.0 11.9 4.0 3.3 31.8 0.12012 48.6 11.7 4.3 3.3 32.0 0.12013 49.4 11.7 4.4 3.2 31.3 0.1
Notes: (*) in the 2015 edition, the time series for maritime transport performance has been revised, for the period from 2005 to 2013, by replacing previous estimates
on port-to port distances with more accurate measurements by eurostat. the time series from 1995 to 2004 has been recalibrated by DG MoVe in line with the new eurostat figures to avoid break in series. the revision of tkm figures mainly concerns the calculation of distance travelled and not the tonnages transported by sea.
Air and Sea: only domestic and intra-eU-28 transport; estimates for air and for sea (1995-2004). Road: national and international haulage by vehicles registered in the eU-28.
fREigHT TRANSPORT fOR iNlANd mOdESbillion tonne-kilometres
ROAd RAiliNlANd
wATERwAyS PiPEliNES TOTAl1995 1 289 388 122 115 1 914 2000 1 509 405 134 127 2 176 2001 1 553 388 133 134 2 207 2002 1 603 386 133 130 2 251 2003 1 608 394 124 132 2 257 2004 1 751 419 137 133 2 440 2005 1 795 416 139 138 2 487 2006 1 858 438 139 137 2 571 2007 1 925 452 145 128 2 650 2008 1 891 443 146 125 2 605 2009 1 700 364 131 122 2 316 2010 1 755 394 156 121 2 425 2011 1 744 422 142 118 2 426 2012 1 693 407 150 115 2 364 2013 1 719 407 153 112 2 391
1995–2013per year
33.4 % 4.7 % 25.1 % -2.7 % 24.9 %1.6 % 0.3 % 1.3 % -0.2 % 1.2 %
2000–2013per year
13.9 % 0.3 % 14.1 % -12.0 % 9.9 %1.0 % 0.0 % 1.0 % -1.0 % 0.7 %
2012–2013 1.6 % 0.0 % 1.8 % -2.7 % 1.1 %
mOdAl SPliT(%)
ROAd RAiliNlANd
wATERwAyS PiPEliNES1995 67.3 20.3 6.4 6.0 2000 69.4 18.6 6.2 5.8 2001 70.3 17.6 6.0 6.1 2002 71.2 17.1 5.9 5.8 2003 71.2 17.5 5.5 5.8 2004 71.7 17.2 5.6 5.5 2005 72.2 16.7 5.6 5.5 2006 72.3 17.0 5.4 5.3 2007 72.6 17.1 5.5 4.8 2008 72.6 17.0 5.6 4.8 2009 73.4 15.7 5.6 5.3 2010 72.4 16.2 6.4 5.0 2011 71.9 17.4 5.9 4.9 2012 71.6 17.2 6.3 4.9 2013 71.9 17.0 6.4 4.7
Note: Road: national and international haulage by vehicles registered in the eU-28.
Source : Tables 2 .2 .4c to 2 .2 .7 , Eurostat , est imates ( in i ta l ics)
EU-28 Performance by mode
2.2 .2 2 .2 .3
EU-28 Performance by mode – inland

38 39
Titlesubtitle
TitlesubtitleRoad:
INTERNATIONAL HAULAGE (*)Road:
NATIONAL HAULAGE
Sources : Eurostat , Internat ional Transport Forum, nat ional stat ist ics (cH – unt i l 2007) , est imates ( in i ta l ics)
Sources : Eurostat , Internat ional Transport Forum, nat ional stat ist ics (cH ) , est imates ( in i ta l ics)
2.2 .4a 2 .2 .4b TRANSPORT
PERFORMANCE OF FREIGHT TRANSPORT EXPRESSED IN TONNE-KILOMETRES
TRANSPORT
PERFORMANCE OF FREIGHT TRANSPORT EXPRESSED IN TONNE-KILOMETRES
HAUlAgE by vEHiclES REgiSTEREd iN THE REPORTiNg cOUNTRy
billion tkm % Of TOTAl HAUlAgE
2013
%
1995 2000 2005 2010 2012 2013CHANGE ‘12/ ‘13
EU-28 1 086.4 1 225.8 1 176.9 1 120.9 1 112.4 64.7 -0.8BE 18.6 19.8 19.3 17.8 18.2 19.0 57.9 4.4BG 3.1 5.0 6.1 6.3 7.2 26.5 14.4CZ 14.2 15.5 14.8 14.4 15.4 28.0 6.9DK 9.3 11.0 11.1 10.6 12.3 12.2 76.0 -0.6DE 201.3 226.5 237.6 252.5 254.5 256.7 84.0 0.9EE 0.4 0.7 1.8 1.4 1.6 1.6 26.6 -0.4IE 4.7 8.3 14.0 8.2 7.4 7.2 78.3 -2.7
EL 20.0 23.0 19.6 25.3 16.5 14.6 76.7 -11.7ES 78.7 106.9 166.4 146.2 133.4 127.0 65.9 -4.8FR 135.3 163.2 177.3 164.3 156.4 155.7 90.8 -0.5HR 1.9 4.4 4.5 4.1 4.3 46.9 3.4
IT 150.3 158.3 171.6 149.2 111.8 112.0 88.0 0.2CY 1.3 1.4 1.1 0.9 0.6 97.5 -29.8LV 1.5 2.7 2.6 2.6 2.8 21.9 7.1LT 1.5 2.1 2.3 2.4 2.5 9.6 4.2LU 0.5 0.4 0.5 0.6 1.0 0.8 9.0 -25.6
HU 12.1 11.4 11.3 9.2 9.2 25.8 0.7MT 0.2 0.2 0.2 0.2 0.2 80.0 0.0NL 26.7 31.5 31.8 33.8 31.4 29.9 42.6 -4.8AT 11.1 12.4 12.5 13.9 14.1 13.9 57.2 -1.9PL 48.0 60.9 82.2 89.0 100.3 40.5 12.7PT 16.5 14.2 17.4 12.9 11.2 9.8 26.7 -12.6RO 9.9 19.4 12.1 12.7 12.5 36.8 -1.3
SI 1.9 2.4 2.3 1.8 1.9 11.9 2.2SK 5.1 5.6 5.2 5.1 4.6 15.1 -10.0FI 21.8 27.7 27.8 25.2 21.9 21.0 85.8 -4.4
SE 28.4 31.5 34.7 32.7 30.4 30.7 91.6 1.1UK 146.7 150.3 151.2 137.8 150.0 139.0 94.4 -7.4AL
MEMK RSTR 112.5 161.6 166.8 190.4 216.1 224.0 3.7IS 0.5 0.6 0.7 0.8 0.8 0.8 2.8
NO 12.1 15.4 16.3 17.0 18.3 86.0 8.0CH 8.4 8.9 9.2 9.6 10.0 10.2 79.3 1.7
Note: only haulage of heavy goods vehicles (usually >3.5 tonnes load capacity).
HAUlAgE by vEHiclES REgiSTEREd iN THE REPORTiNg cOUNTRy
billion tkm % Of TOTAl HAUlAgE
2013
%
1995 2000 2005 2010 2012 2013CHANGE ‘12 / ‘13
EU-28 421.6 568.8 578.4 571.7 607.0 35.3 6.2BE 27.0 31.3 24.6 17.2 13.9 13.8 42.1 -0.7BG 3.3 9.3 13.3 18.1 19.9 73.5 10.1CZ 23.1 27.9 37.1 36.8 39.5 72.0 7.3DK 13.1 13.0 12.2 4.4 4.4 3.9 24.0 -12.1DE 36.5 54.2 72.5 60.6 52.5 49.0 16.0 -6.6EE 1.1 3.2 4.0 4.2 4.2 4.4 73.4 4.8IE 0.8 3.9 3.9 2.7 2.6 2.0 21.7 -21.8
EL 4.0 4.5 4.2 4.6 4.4 4.4 23.3 1.5ES 22.9 41.8 66.8 63.9 65.8 65.6 34.1 -0.4FR 42.9 40.8 28.0 17.9 16.0 15.8 9.2 -1.5HR 1.0 4.9 4.2 4.5 4.8 53.1 7.7
IT 24.1 26.4 40.2 26.5 12.2 15.3 12.0 24.8CY 0.0 0.0 0.0 0.0 0.0 2.5 -5.9LV 3.3 5.7 8.0 9.6 10.0 78.1 4.7LT 6.2 13.8 17.1 21.0 23.8 90.4 13.3LU 5.0 7.2 8.3 8.1 6.9 7.8 91.0 13.4
HU 7.0 13.8 22.4 24.6 26.6 74.2 8.2MT 0.1 0.1 0.1 0.1 0.1 20.0 0.0NL 40.4 48.0 52.3 42.0 36.4 40.3 57.4 10.7AT 15.4 22.7 24.5 14.7 12.0 10.4 42.8 -13.5PL 27.0 50.9 120.1 133.3 147.3 59.5 10.5PT 15.5 12.6 25.2 22.5 21.8 26.8 73.3 23.1RO 4.4 32.1 13.8 17.0 21.5 63.2 26.7
SI 3.4 8.7 13.6 14.0 14.0 88.1 -0.2SK 9.3 16.9 22.4 24.6 25.6 84.9 3.9FI 2.7 4.3 4.0 4.4 3.5 3.5 14.2 -2.0
SE 3.2 4.2 3.9 3.5 3.1 2.8 8.4 -9.5UK 14.8 15.3 10.1 8.9 8.5 8.2 5.6 -2.8AL
MEMKRSTRIS
NO 3.0 2.9 3.4 3.2 3.0 14.0 -6.4CH (1) 0.7 0.9 1.0 3.7 3.0 2.7 20.7 -10.6
Notes: (*) including cross-trade and cabotage. only haulage of heavy goods vehicles (usually >3.5 tonnes load capacity).
(1) CH: in contrast to the data for other countries, until 2007 the Swiss data do not include that part of international journeys by Swiss hauliers that takes place outside Switzerland.

40 41
Titlesubtitle
Titlesubtitle
RailwaysRoad: NATIONAL AND INTERNATIONAL HAULAGE (*)
Sources : Eurostat , Internat ional Transport Forum,nat ional stat ist ics (cH , mE , mk , RS , TR ) , est imates ( in i ta l ics)
Sources : Eurostat , Internat ional Transport Forum, Union Internat ionale des Chemins de Fer, nat ional stat ist ics
2.2 .4c 2 .2 .5 TRANSPORT
PERFORMANCE OF FREIGHT TRANSPORT EXPRESSED IN TONNE-KILOMETRES
TRANSPORT
PERFORMANCE OF FREIGHT TRANSPORT EXPRESSED IN TONNE-KILOMETRES
HAUlAgE by vEHiclES REgiSTEREd iN THE REPORTiNg cOUNTRy
billion tkm %
1995 2000 2005 2010 2012 2013CHANGE ‘12 / ‘13
EU-28 1 288.7 1 509.5 1 794.6 1 755.3 1 692.6 1 719.4 1.6BE 45.6 51.0 43.8 35.0 32.1 32.8 2.2BG 5.2 6.4 14.4 19.4 24.4 27.1 11.2CZ 31.3 37.3 43.4 51.8 51.2 54.9 7.2DK 22.4 24.0 23.3 15.0 16.7 16.1 -3.6DE 237.8 280.7 310.1 313.1 307.0 305.7 -0.4EE 1.5 3.9 5.8 5.6 5.8 6.0 3.4IE 5.5 12.3 17.9 10.9 10.0 9.2 -7.6
EL 24.0 29.0 23.8 29.8 20.8 19.0 -9.0ES 101.6 148.7 233.2 210.1 199.2 192.6 -3.3FR 178.2 204.0 205.3 182.2 172.4 171.5 -0.6HR 2.9 9.3 8.8 8.6 9.1 5.6
IT 174.4 184.7 211.8 175.8 124.0 127.2 2.6CY 1.2 1.3 1.4 1.1 0.9 0.6 -29.2LV 1.8 4.8 8.4 10.6 12.2 12.8 5.2LT 5.2 7.8 15.9 19.4 23.4 26.3 12.3LU 5.5 7.6 8.8 8.7 8.0 8.6 8.3
HU 13.8 19.1 25.2 33.7 33.7 35.8 6.2MT 0.3 0.3 0.3 0.3 0.3 0.3 0.0NL 67.1 79.6 84.2 75.8 67.8 70.2 3.5AT 26.5 35.1 37.0 28.7 26.1 24.2 -7.2PL 51.2 75.0 111.8 202.3 222.3 247.6 11.4PT 32.0 26.8 42.6 35.4 32.9 36.6 11.0RO 19.7 14.3 51.5 25.9 29.7 34.0 14.7
SI 3.3 5.3 11.0 15.9 15.9 15.9 0.1SK 15.9 14.3 22.6 27.6 29.7 30.1 1.5FI 24.5 32.0 31.9 29.5 25.5 24.4 -4.0
SE 31.6 35.6 38.6 36.3 33.5 33.5 0.1UK 161.5 165.6 161.3 146.7 158.5 147.2 -7.1AL 2.1 2.2 3.2 4.6 3.2 3.5 8.5
ME 0.1 0.2 0.1 0.1 -11.8MK 3.5 5.6 4.2 5.8 5.1 -11.3RS 0.6 0.7 1.7 2.5 2.8 14.1
TR (1) 112.5 161.6 166.8 190.4 216.1 224.0 3.7IS (1) 0.5 0.6 0.7 0.8 0.8 0.8 2.8
NO 9.7 15.1 18.2 19.8 20.2 21.3 5.7CH (2) 9.1 9.8 10.2 13.2 13.0 12.8 -1.1
Notes: (*) including cross-trade and cabotage. only haulage of heavy goods vehicles (usually >3.5 tonnes load capacity).
(1) TR, IS: national transport only. (2) CH: in contrast to the data for other countries, until 2007 the Swiss data do not
include that part of international journeys by Swiss hauliers that takes place outside Switzerland.
billion tkm %
1990 1995 2000 2005 2010 2012 2013CHANGE ‘12/ ‘13
EU-28 526.3 388.1 405.5 416.0 393.5 406.7 406.5 0.0BE 8.4 7.3 7.7 8.1 7.5 7.3 7.3 0.0BG 14.1 8.6 5.5 5.2 3.1 2.9 3.2 11.7CZ 22.6 17.5 14.9 13.8 14.3 14.0 -2.1DK 1.7 2.0 2.0 2.0 2.2 2.3 2.4 7.5DE 101.7 70.5 82.7 95.4 107.3 110.1 112.6 2.3EE 7.0 3.8 8.1 10.6 6.6 5.1 4.7 -7.9IE 0.6 0.6 0.5 0.3 0.1 0.1 0.1 8.8
EL 0.6 0.3 0.4 0.6 0.6 0.3 0.2 -16.3ES 11.2 11.0 11.6 11.6 8.9 9.5 9.3 -1.3FR 52.2 48.3 57.7 40.7 30.0 32.6 32.0 -1.7HR 2.0 1.8 2.8 2.6 2.3 2.1 -10.5
IT 19.4 21.7 22.8 22.8 18.6 20.2 19.0 -6.0CY - - - - - - - -LV 18.5 9.8 13.3 19.8 17.2 21.9 19.5 -10.7LT 19.3 7.2 8.9 12.5 13.4 14.2 13.3 -5.8LU 0.6 0.5 0.6 0.4 0.3 0.2 0.2 -7.5
HU 16.8 8.4 8.8 9.1 8.8 9.2 9.7 5.3MT - - - - - - - -NL 3.1 3.1 4.5 5.9 5.9 6.2 6.1 -1.3AT 12.2 13.2 16.6 19.0 19.8 19.5 19.3 -1.1PL 81.6 68.2 54.0 50.0 48.7 48.9 50.9 4.0PT 1.5 2.0 2.2 2.4 2.3 2.4 2.3 -5.4RO 48.9 17.9 16.4 16.6 12.4 13.5 12.9 -3.9
SI 4.2 3.1 2.9 3.2 3.4 3.5 3.8 9.5SK 13.8 11.2 9.5 8.1 7.6 8.5 11.9FI 8.4 9.6 10.1 9.7 9.8 9.3 9.5 2.1
SE 19.1 19.4 19.5 21.7 23.5 22.0 21.0 -4.9UK 16.0 13.3 18.1 21.4 18.6 21.4 22.4 4.5AL 0.6 0.1 0.0 0.0 0.1 0.0 0.0 -8.0
ME 0.2 0.1 0.1 43.8MK 0.5 0.5 0.5 0.4 0.4 -0.5RS 3.5 2.8 3.0 9.1TR 7.9 8.5 9.8 9.1 11.3 11.2 10.8 -4.2IS - - - - - - - -
NO 2.6 2.7 3.0 3.1 3.5 3.5 3.4 -3.0CH 9.0 8.9 11.1 11.7 11.1 11.1 11.8 6.8
Notes: LU values based on quarterly data. DE: includes De-e: 1970=41.5, 1980=56.4, 1990=39.8. CS: 1970: 55.9, 1980: 66.2, 1990: 59.4, 1991: 45.8, 1992: 44.0 (these are included in eU-28 and eU-13 totals).

42 43
Titlesubtitle
Titlesubtitle
inland waterways Pipelines (Oil)
Sources : Nat ional stat ist ics , Internat ional Transport Forum, Eurostat , est imates ( in i ta l ics)
Sources : Eurostat , Internat ional Transport Forum,nat ional stat ist ics , UNECE, est imates ( in i ta l ics)
2.2 .7 2 .2 .6 TRANSPORT
PERFORMANCE OF FREIGHT TRANSPORT EXPRESSED IN TONNE-KILOMETRES
TRANSPORT
PERFORMANCE OF FREIGHT TRANSPORT EXPRESSED IN TONNE-KILOMETRES
billion tkm %
1990 1995 2000 2005 2010 2012 2013CHANGE ‘12 / ‘13
EU-28 118.8 122.1 133.9 138.8 155.5 150.0 152.7 1.8BE 5.4 5.7 7.2 8.6 9.1 10.4 10.4 -0.5BG 1.6 0.5 0.3 0.8 6.0 5.3 5.4 0.5CZ 0.3 0.1 0.1 0.0 0.0 0.0 -34.2DK - - - - - - - -DE 54.8 64.0 66.5 64.1 62.3 58.5 60.1 2.7EE 0.0 0.0 - - - - - -IE - - - - - - - -
EL - - - - - - - -ES - - - - - - - -FR 7.6 6.6 9.1 8.9 9.5 8.9 9.2 3.3HR 0.5 0.0 0.1 0.1 0.9 0.8 0.8 -0.1
IT 0.1 0.1 0.2 0.1 0.1 0.1 0.1 9.9CY - - - - - - - -LV - - - - - - - -LT 0.2 0.0 0.0 0.0 0.0 0.0 0.0 -LU 0.4 0.3 0.4 0.3 0.4 0.3 0.3 7.9
HU 2.0 1.2 0.9 2.1 2.4 2.0 1.9 -2.9MT - - - - - - - -NL 35.7 35.5 41.3 42.2 46.6 47.5 48.6 2.3AT 1.7 2.0 2.4 1.8 2.4 2.2 2.4 7.4PL 1.0 0.9 1.2 0.3 0.1 0.1 0.1 -30.5PT - - - - - - - -RO 2.1 3.1 2.6 8.4 14.3 12.5 12.2 -2.2
SI - - - - - - - -SK 1.5 1.4 0.7 1.2 1.0 1.0 2.0FI 1.1 0.1 0.1 0.1 0.1 0.1 0.1 -2.4
SE - - - - - - - -UK 0.3 0.2 0.2 0.2 0.2 0.2 0.2 0.0AL - - - - - - - -
ME - - - - - - - -MK - - - - - - - -RS 0.9 0.6 0.7 16.1TR - - - - - - - -IS - - - - - - - -
NO - - - - - - - -CH 0.2 0.0 0.1 0.0 0.0 0.1 0.0 -15.7
Notes: FI: only shipborne transport (i.e. no floating). CS: 1970: 2.43, 1980: 3.59, 1990: 4.42, 1991: 3.89, 1992: 2.98 (these are included in eU-28 and eU-13 totals). IT, LT, FI and UK: data include only national traffic. BG and RO: data include transit traffic from 2009 (and partially in 2008). HR: data include transit traffic from 2008 onward.
billion tkm %
1990 1995 2000 2005 2010 2012 2013CHANGE ‘12 / ‘13
EU-28 114.9 127.1 137.6 121.1 114.9 111.8 -2.7BE 1.0 1.4 1.6 1.5 1.5 1.6 1.7 3.8BG 0.6 0.4 0.4 0.4 0.4 0.6 0.6 10.5CZ 2.3 1.6 2.3 2.2 1.9 1.9 1.4DK 2.0 3.1 4.7 5.1 3.5 3.1 2.7 -11.0DE 13.3 14.8 15.0 16.7 16.3 16.2 18.2 12.2EE - - - - - - - -IE - - - - - - - -
EL - - - 0.2 0.2 0.2 0.2 -11.1ES 4.2 5.9 7.5 9.2 8.2 8.9 8.7 -2.3FR 19.6 22.3 21.7 20.9 17.6 15.2 11.1 -26.6HR 3.6 0.4 1.5 1.3 0.8 1.1 34.5
IT 9.2 9.7 10.3 11.4 10.4 10.1 10.0 -0.4CY - - - - - - - -LV 5.3 6.5 3.4 2.4 2.6 2.3 -13.4LT 2.0 3.5 4.4 0.6 0.6 0.6 -10.9LU - - - - - - - -
HU 5.3 2.2 2.3 2.7 3.2 2.8 2.7 -2.1MT - - - - - - - -NL 4.9 5.3 5.9 5.9 5.6 5.6 5.4 -3.0AT 6.4 6.8 7.6 7.8 7.0 7.1 8.4 17.4PL 13.9 13.5 20.4 25.4 24.2 22.3 20.1 -9.9PT - 0.5 0.5 0.4 0.4 0.4 -2.6RO 5.1 2.9 1.4 2.2 1.0 0.8 0.8 5.6
SI - - - - - - - -SK 6.1 4.6 5.3 5.0 4.2 4.9 16.3FI - - - - - - - -
SE - - - - - - - -UK 11.1 11.1 11.4 10.8 10.2 9.9 10.0 0.5AL - - - - - - - -
ME - - - - - - - -MK - - - 0.1 0.1 0.0 0.0 -15.1RS - - - - 0.4 0.3 0.4 29.2TR 3.2 53.1 5.7 39.6 37.3 26.7 -28.3IS - - - - - - - -
NO 2.1 5.3 3.5 4.6 3.5 3.1 2.7 -12.6CH 1.2 1.2 0.2 0.2 0.2 0.2 0.2 24.6
Notes: Data are not harmonised and therefore not fully comparable; in most countries, only pipelines longer than 40 km are included. Data refers to oil pipelines. CS: 1990: 7.5. DE: from 1995 onwards: only crude oil (i.e. no refined petroleum products).

44 45
TRANSPORT
TRANSPORT 2.0 .0
Titlesubtitle
billion passenger-kilometres
4 500
3 500
600
500
400
300
150
100
50
0
TRANSPORT
2.3 TRANSPORT
PERFORMANCE OF FREIGHT TRANSPORT EXPRESSED IN TONNE-KILOMETRES2.2 .8
EU-28 Performance by mode for Passenger Transport – 1995–2013
USA
PERfORmANcE by mOdE Of TRANSPORT: fREigHTbillion tkm
ROAd RAiliNlANd
wATERwAyS PiPEliNES TOTAl1990 2 492.7 1 554.0 515.8 1 519.9 6 082.51995 3 036.8 1 922.8 534.4 1 564.1 7 058.12000 3 396.7 2 257.6 526.2 1 413.0 7 593.52005 3 581.8 2 530.6 476.4 1 263.9 7 852.72006 3 512.4 2 709.6 486.0 1 256.7 7 964.72007 3 643.8 2 656.6 472.3 1 249.5 8 022.22008 4 018.8 2 525.4 454.3 1 432.7 8 431.22009 3 576.2 2 309.8 406.6 1 383.0 7 675.62010 3 668.1 2 491.5 450.5 1 395.7 8 005.82011 3 859.5 2 524.7 464.7 1 486.4 8 335.22012 3 886.0 2 536.2 470.4 1 367.8 8 260.5
AvERAgE ANNUAl cHANgE% PER yEAR
ROAd RAiliNlANd
wATERwAyS PiPEliNES TOTAl2005 1.1 2.9 -4.0 -0.6 1.12006 -1.9 7.1 2.0 -0.6 1.42007 3.7 -2.0 -2.8 -0.6 0.72008 10.3 -4.9 -3.8 14.7 5.12009 -11.0 -8.5 -10.5 -3.5 -9.02010 2.6 7.9 10.8 0.9 4.32011 5.2 1.3 3.1 6.5 4.12012 0.7 0.5 1.2 -8.0 -0.9
1990–1995 4.0 4.4 0.7 0.6 3.01995–2000 2.3 3.3 -0.3 -2.0 1.52000–2010 0.8 1.0 -1.5 -0.1 0.52010–2012 2.9 0.9 2.2 -1.0 1.6
mOdAl SPliT%
ROAd RAiliNlANd
wATERwAyS PiPEliNES1990 41.0 25.5 8.5 25.0 1995 43.0 27.2 7.6 22.2 2000 44.7 29.7 6.9 18.6 2005 45.6 32.2 6.1 16.1 2006 44.1 34.0 6.1 15.8 2007 45.4 33.1 5.9 15.6 2008 47.7 30.0 5.4 17.0 2009 46.6 30.1 5.3 18.0 2010 45.8 31.1 5.6 17.4 2011 46.3 30.3 5.6 17.8 2012 47.0 30.7 5.7 16.6
Note: time series for road transport revised according to the estimates based on the Freight analysis Framework (FaF).
2 .3 .1
PASSENGER CARS
POWERED 2-WHEELERS
BUS & COACH
RAILWAY
TRAM & METRO
AIR
SEA
1995
1999
2003
1996
2000
2004
2007
1997
2001
2005
2008
1998
2002
2006
2009
2013
2012
2011
2010
Source : U .S . Department of Transportat ion , Internat ional Transport Forum, est imates ( in i ta l ics)
Sources : Tables 2 .3 .4 , 2 .3 .5 , 2 .3 .6 , 2 .3 .7 , est imates
PERFORMANCE OF PASSENGER TRANSPORT EXPRESSED IN PASSENGER-KILOMETRES

46 47
Titlesubtitle
Titlesubtitle
Sources : Tables 2 .3 .4 , 2 .3 .5 , 2 .3 .6 , 2 .3 .7 , est imates ( in i ta l ics)Sources : Tables 2 .3 .4 , 2 .3 .5 , 2 .3 .6 , 2 .3 .7 , est imates ( in i ta l ics)
2.3 .3 2 .3 .2
modal Split of Passenger Transport on land by country – 2013
EU-28 Performance by mode
PASSENgER TRANSPORTbillion pkm
PASSEN-gER cARS P2w
bUS & cOAcH RAilwAy
TRAm & mETRO AiR SEA TOTAl
1995 3 935 116 503 350 72 348 44 5 3682000 4 355 108 548 372 78 460 42 5 9632001 4 454 112 547 374 79 455 42 6 0642002 4 542 114 539 366 80 447 43 6 1322003 4 586 117 543 362 81 466 43 6 1972004 4 652 121 544 369 83 496 43 6 3072005 4 591 123 541 377 84 530 42 6 2882006 4 636 123 537 389 86 552 42 6 3662007 4 690 119 549 396 88 575 43 6 4602008 4 698 124 554 411 91 563 43 6 4862009 4 774 122 534 404 91 525 43 6 4922010 4 717 123 528 405 92 539 40 6 4452011 4 698 125 530 415 93 580 39 6 4802012 4 614 126 524 420 95 574 42 6 3942013 4 672 125 526 424 95 583 39 6 465
'95/'13/year
18.7 % 7.4 % 4.8 % 21.1 % 32.7 % 67.4 % -12.1 % 20.4 %1.0 % 0.4 % 0.3 % 1.1 % 1.6 % 2.9 % -0.7 % 1.0 %
'00/'13/year
7.3 % 16.1 % -4.0 % 14.2 % 21.7 % 26.8 % -6.4 % 8.4 %0.5 % 1.2 % -0.3 % 1.0 % 1.5 % 1.8 % -0.5 % 0.6 %
'12/'13 1.3 % -0.5 % 0.5 % 1.1 % 0.8 % 1.6 % -7.0 % 1.1 %
mOdAl SPliT%
PASSEN-gER cARS P2w
bUS & cOAcH RAilwAy
TRAm & mETRO AiR SEA
1995 73.3 2.2 9.4 6.5 1.3 6.5 0.82000 73.0 1.8 9.2 6.2 1.3 7.7 0.72001 73.5 1.8 9.0 6.2 1.3 7.5 0.72002 74.1 1.9 8.8 6.0 1.3 7.3 0.72003 74.0 1.9 8.8 5.8 1.3 7.5 0.72004 73.8 1.9 8.6 5.8 1.3 7.9 0.72005 73.0 2.0 8.6 6.0 1.3 8.4 0.72006 72.8 1.9 8.4 6.1 1.3 8.7 0.72007 72.6 1.8 8.5 6.1 1.4 8.9 0.72008 72.4 1.9 8.5 6.3 1.4 8.7 0.72009 73.5 1.9 8.2 6.2 1.4 8.1 0.72010 73.2 1.9 8.2 6.3 1.4 8.4 0.62011 72.5 1.9 8.2 6.4 1.4 8.9 0.62012 72.2 2.0 8.2 6.6 1.5 9.0 0.72013 72.3 1.9 8.1 6.6 1.5 9.0 0.6
Notes: Air and Sea: only domestic and intra-eU-28 transport; provisional estimates. P2W: powered two-wheelers.
pkm as %
PASSENgER cARS
bUSES & cOAcHES RAilwAyS
TRAm & mETRO
EU-28 81.7 9.2 7.4 1.7BE 76.8 15.0 7.3 0.9BG 79.6 16.0 2.8 1.6CZ 66.3 16.1 7.7 9.8DK 79.6 9.8 10.2 0.4DE 84.4 5.7 8.4 1.6EE 80.3 17.2 1.6 0.9IE 83.0 14.0 2.7 0.3
EL 80.1 17.6 0.9 1.4ES 79.6 13.0 6.0 1.4FR 83.9 5.4 9.1 1.6HR 84.0 11.3 3.0 1.7
IT 79.7 13.2 6.3 0.9CY 81.5 18.5 - -LV 78.7 15.6 4.8 0.9LT 91.4 7.8 0.8 -LU 82.9 12.4 4.7 -
HU 65.3 21.6 9.9 3.2MT 83.0 17.0 - -NL 82.5 6.6 10.0 0.8AT 74.2 9.4 12.2 4.1PL 78.4 13.9 6.1 1.5PT 88.2 6.8 3.9 1.0RO 76.2 12.3 4.2 7.4
SI 86.3 11.4 2.3 -SK 77.2 14.9 7.1 0.8FI 84.3 9.8 5.2 0.7
SE 82.4 6.6 9.1 1.9UK 84.6 5.6 8.2 1.6AL 87.6 12.3 0.1 -
ME 95.7 2.6 1.7 -MK 80.3 18.6 1.1 -RS 77.7 20.2 1.8 0.3TRIS 88.6 11.4 - -
NO 88.8 5.4 4.7 1.1CH 77.1 5.0 16.9 1.0
Note: If powered two-wheelers are included, they account for 2.14 % of the total in eU-28, while the share of the other modes becomes:
EU-28 80.0 9.0 7.3 1.6
TRANSPORT
PERFORMANCE OF PASSENGER TRANSPORT EXPRESSED IN PASSENGER-KILOMETRES
TRANSPORT
PERFORMANCE OF PASSENGER TRANSPORT EXPRESSED IN PASSENGER-KILOMETRES

48 49
Titlesubtitle
Titlesubtitle
Passenger cars
Sources : Nat ional stat ist ics , Internat ional Transport Forum, Eurostat , est imates ( in i ta l ics)
Sources : Nat ional stat ist ics , Internat ional Transport Forum, Eurostat , study for DG Energy and Transport , est imates ( in i ta l ics)
billion pkm %
1990 1995 2000 2005 2010 2012 2013CHANGE ‘12 / ‘13
EU-28 3 934.8 4 355.4 4 591.3 4 716.8 4 614.1 4 672.3 1.3BE 89.5 96.4 102.5 102.8 109.4 110.2 109.8 -0.3BG 25.0 26.9 35.1 46.9 49.7 51.4 3.3CZ 54.5 63.9 68.6 63.6 64.6 64.7 0.0DK 47.2 48.4 50.6 49.8 51.7 52.6 53.2 1.2DE 683.1 815.3 831.3 856.9 887.0 896.3 899.3 0.3EE 5.1 6.7 9.9 10.1 10.8 11.2 4.0IE 28.5 31.6 34.6 44.4 48.1 46.6 48.0 3.1
EL 35.0 44.0 63.0 85.0 99.6 96.9 95.8 -1.2ES 174.4 250.4 302.6 337.8 341.6 321.0 316.5 -1.4FR 611.1 671.7 744.5 788.1 796.9 801.1 805.5 0.6HR 12.5 20.0 24.0 25.7 26.1 26.1 0.0
IT 522.6 614.7 713.9 677.0 698.4 578.7 620.4 7.2CY 3.4 3.9 4.8 5.9 6.0 5.9 -0.5LV 7.5 11.5 12.1 12.3 11.5 11.7 1.8LT 16.0 26.0 34.8 32.6 34.2 33.3 -2.5LU 4.0 4.7 5.6 6.3 6.5 6.7 6.9 1.7
HU 47.0 45.4 46.2 49.4 52.6 51.8 51.8 0.1MT 1.7 1.8 2.0 2.2 2.2 2.3 2.3NL 137.3 131.4 141.1 148.8 135.1 136.4 145.4 6.6AT 55.7 62.2 66.7 70.6 73.5 74.2 74.8 0.9PL 110.7 130.1 152.3 188.8 208.5 213.1 2.2PT 40.0 52.5 71.0 85.0 83.7 82.1 81.9 -0.3RO 40.0 51.0 61.0 75.5 77.0 80.4 4.3
SI 13.3 16.3 20.3 22.5 25.6 25.3 25.2 -0.5SK 18.0 23.9 25.8 26.9 26.9 27.2 0.8FI 51.2 50.0 55.7 61.9 64.7 65.3 65.1 -0.2
SE 85.9 87.6 101.4 107.4 108.0 109.6 107.6 -1.8UK 588.0 617.9 638.6 667.2 644.0 641.6 637.7 -0.6AL 4.8 5.1 6.6 5.5 6.7 7.6 14.0
ME 4.1 4.0 4.1 2.4MK 3.7 4.2 4.5 5.5 5.3 6.0 14.6RS 30.6 26.5 27.1 2.2TR 34.3 52.7 79.0 100.0 137.9 162.3 173.3 6.8IS 3.0 3.8 4.6 5.0 4.8 5.0 2.9
NO 43.5 44.7 51.2 54.0 58.8 60.7 61.5 1.3CH 73.3 69.6 75.0 77.8 83.8 86.7 88.3 1.9
Notes: Data are not harmonised and therefore not fully comparable. 2013 data may be provisional. Generally vans are not considered in this table, but there may be exceptions. FR: passenger-km include transport activity on the territory of vehicles not registered
in France. includes foreign vans. UK: data refer to Great britain only; include pkm by vans. DE: incl. De-e: 1970=24.5, 1980=56.0, 1990=90.3.
billion pkm %
1990 1995 2000 2005 2010 2012 2013CHANGE ‘12 / ‘13
EU-28 502.5 548.3 540.7 527.8 524.1 526.5 0.5BE 11.4 13.1 13.3 17.5 17.4 17.9 21.5 20.1BG 26.0 11.6 14.6 13.7 10.6 10.5 10.3 -1.6CZ 18.6 16.2 15.6 17.0 15.3 15.7 2.6DK 6.4 7.3 7.4 7.2 6.8 6.5 6.5 0.3DE 73.1 68.5 69.0 67.1 61.8 59.4 60.5 1.9EE 4.5 2.0 2.6 2.7 2.1 2.2 2.4 8.1IE 3.9 5.2 7.0 7.9 8.5 8.1 8.1 0.3
EL 17.7 20.2 21.7 21.7 21.1 21.1 21.0 -0.3ES 33.4 39.6 50.3 53.2 50.9 54.5 51.8 -4.9FR 40.7 41.2 42.0 42.5 49.9 51.6 52.3 1.4HR 7.0 4.1 3.3 3.4 3.2 3.2 3.5 7.9
IT 84.0 87.1 93.4 101.0 102.2 101.2 102.6 1.3CY 1.0 1.1 1.3 1.3 1.4 1.3 -1.4LV 5.9 1.8 2.3 2.9 2.3 2.4 2.3 -1.7LT 7.9 4.2 2.8 3.7 2.7 2.7 2.8 4.1LU 0.5 0.5 0.6 0.8 0.9 1.0 1.0 2.1
HU 19.3 16.6 18.7 17.8 16.5 17.1 17.1 0.4MT 0.4 0.5 0.5 0.5 0.5 0.5 -1.7NL 13.0 12.0 11.3 11.8 12.1 11.3 11.7 3.8AT 8.0 8.7 9.2 9.3 9.6 9.5 9.5 0.2PL 46.3 34.0 59.2 49.2 41.7 39.4 37.8 -4.1PT 10.3 11.3 11.8 6.4 6.1 6.0 6.3 4.4RO 24.0 12.3 12.0 11.8 12.0 12.6 12.9 2.7
SI 6.5 4.1 3.5 3.1 3.2 3.2 3.3 2.6SK 14.4 9.3 8.5 5.3 5.4 5.3 -3.2FI 8.5 8.0 7.7 7.5 7.5 7.5 7.5 0.0
SE 9.7 9.7 9.5 8.8 8.6 8.7 8.7 0.2UK 47.1 44.8 48.0 44.0 46.2 43.7 41.9 -4.1AL 2.2 0.2 0.2 0.3 2.4 1.0 1.1 8.1
ME 0.1 0.1 0.1 -2.9MK 0.9 0.9 1.1 1.4 1.4 1.4 -0.6RS 7.1 7.1 7.1 -0.9TR 85.7 87.4 95.0 89.1 96.6 94.8 -1.8IS 0.4 0.5 0.6 0.6 0.6 0.6 2.9
NO 3.9 3.8 4.1 4.3 4.5 3.8 3.7 -1.3CH 3.3 5.5 4.8 5.3 5.5 5.7 5.8 1.2
Notes: Data are not harmonised and therefore not fully comparable. Many data for 2013 are provisional. CS: 1990: 43.4. UK: Gb data + 1.5 bln pkm throughout to account for Northern ireland.
2 .3 .5 2 .3 .4 TRANSPORT
PERFORMANCE OF PASSENGER TRANSPORT EXPRESSED IN PASSENGER-KILOMETRES
TRANSPORT
PERFORMANCE OF PASSENGER TRANSPORT EXPRESSED IN PASSENGER-KILOMETRES
buses & coaches

50 51
Titlesubtitle
Titlesubtitle
RailwaysTram & metro
2.3 .7 2 .3 .6 TRANSPORT
PERFORMANCE OF PASSENGER TRANSPORT EXPRESSED IN PASSENGER-KILOMETRES
TRANSPORT
PERFORMANCE OF PASSENGER TRANSPORT EXPRESSED IN PASSENGER-KILOMETRES
billion pkm % UNDER PSO (*)
2013
%
1990 1995 2000 2005 2010 2012 2013CHANGE ‘12 / ‘13
EU-28 404.1 350.3 371.5 377.4 405.3 419.6 424.2 66.3 1.1BE 6.5 6.8 7.7 8.5 10.6 10.3 10.5 89.3 2.0BG 7.8 4.7 3.5 2.4 2.1 1.9 1.8 88.1 -2.6CZ 13.3 8.0 7.3 6.7 6.6 7.2 7.5 4.4DK 5.1 4.9 5.5 6.0 6.3 6.7 6.8 96.0 0.6DE 61.0 71.0 75.4 76.8 83.9 88.8 89.0 60.3 0.2EE 1.5 0.4 0.3 0.2 0.2 0.2 0.2 90.0 -5.1IE 1.2 1.3 1.4 1.8 1.7 1.6 1.6 100.0 -0.6
EL 2.0 1.6 1.9 1.9 1.4 0.8 1.1 100.0 26.9ES 15.5 16.6 20.1 21.2 22.3 22.5 23.8 5.8FR 63.7 54.2 69.4 76.0 85.6 88.0 87.4 37.1 -0.7HR 3.4 1.1 1.3 1.2 1.7 1.1 0.9 67.4 -13.4
IT 44.7 46.7 49.6 50.1 47.2 46.8 48.7 61.1 4.2CY - - - - - - - - -LV 5.4 1.4 0.7 0.9 0.7 0.7 0.7 88.5 0.6LT 3.6 1.1 0.6 0.3 0.2 0.3 0.3 64.5 0.0LU 0.2 0.3 0.3 0.3 0.3 0.4 0.4 100.0 2.9
HU 11.4 8.4 9.7 9.9 7.7 7.8 7.8 95.3 0.5MT - - - - - - - - -NL 11.1 16.4 14.7 15.2 15.4 17.8 17.7 96.3 -0.6AT 8.9 10.1 8.7 8.7 10.3 10.9 12.3 13.2PL 50.4 26.6 24.1 17.9 17.5 17.7 16.7 86.5 -5.7PT 5.7 4.8 4.0 3.8 4.1 3.8 3.6 67.8 -4.0RO 30.6 18.9 11.6 8.0 5.4 4.6 4.4 96.4 -3.7
SI 1.4 0.6 0.7 0.7 0.7 0.7 0.7 98.3 3.0SK 6.4 4.2 2.9 2.2 2.3 2.5 2.5 90.2 1.1FI 3.3 3.2 3.4 3.5 4.0 4.0 4.1 31.1 0.4
SE 6.6 6.8 8.2 8.9 11.2 11.8 11.9 50.0 0.6UK 33.4 30.3 38.4 44.6 55.8 61.0 62.0 95.5 1.7AL 0.8 0.2 0.1 0.1 0.0 0.0 0.0 -25.0
ME 0.1 0.1 0.1 17.0MK 0.1 0.1 0.1 0.2 0.1 0.1 -19.2RS 0.5 0.5 0.6 13.3TR 6.4 5.8 5.8 5.0 5.5 4.6 3.8 -17.9IS - - - - - - - - -
NO 2.1 2.4 2.6 2.7 3.1 3.1 3.3 74.6 4.4CH 12.7 11.7 12.6 16.1 19.2 19.3 19.4 0.6
Notes: (*) public Service obligation (pSo) means a requirement defined or determined by a competent authority in order to ensure public passenger transport services
in the general interest that an operator, if it were considering its own commercial interests, would not assume or would not assume to the same extent or under the same conditions without reward. BE: 2010 and 2012 pkm values based on quarter data from eurostat. these figures
may exclude some railway undertakings not obliged to detailed quarter reporting. UK: share of pSo excludes Northern ireland.
billion pkm %
1990 1995 2000 2005 2010 2012 2013CHANGE ‘12 / ‘13
EU-28 71.9 78.4 83.9 92.2 94.6 95.4 0.8BE 0.7 0.8 0.9 0.9 1.1 1.2 1.2 1.7BG 0.6 0.3 0.4 0.4 0.9 1.0 1.0 -1.0CZ 7.7 8.1 7.9 9.0 9.5 9.6 0.8DK - - - 0.2 0.2 0.3 0.3 3.6DE 15.1 14.4 14.6 15.5 16.3 16.6 16.7 0.6EE 0.1 0.1 0.1 0.1 0.1 0.1 31.2IE - - - 0.1 0.1 0.1 0.1 4.0
EL 0.8 0.7 1.2 1.5 1.7 1.7 1.7 -0.3ES 4.4 4.3 5.2 6.0 6.3 6.0 5.7 -4.9FR 10.5 9.3 11.6 13.3 14.7 15.2 15.2 -0.2HR 0.5 0.5 0.5 0.5 0.5 0.5 2.0
IT 4.2 5.2 5.6 6.0 7.1 6.5 6.9 5.8CY - - - - - - - -LV 0.7 0.3 0.3 0.3 0.1 0.1 0.1 9.0LT - - - - - - - -LU - - - - - - - -
HU 2.5 2.6 2.4 2.5 2.5 2.5 0.5MT - - - - - - - -NL 1.3 1.4 1.4 1.5 1.6 1.4 1.5 3.8AT 2.8 3.3 3.6 3.8 4.1 4.1 4.2 2.4PL 5.0 4.7 4.4 4.3 4.4 4.1 -6.7PT 0.7 0.5 0.5 0.8 1.1 1.0 0.9 -8.4RO 6.0 6.0 6.6 7.1 7.5 7.8 2.7
SI - - - - - - - -SK 0.4 0.4 0.4 0.3 0.3 0.3 -4.9FI 0.4 0.4 0.5 0.5 0.5 0.5 0.5 -0.2
SE 2.0 1.9 2.0 2.0 2.3 2.4 2.5 4.0UK 6.5 6.8 8.3 8.7 10.2 11.6 11.9 3.4AL - - - - - - - -
ME - - - - - - - -MK - - - - - - - -RS 0.1 0.1 0.1 4.0TRIS - - - - - - - -
NO 0.4 0.4 0.5 0.5 0.6 0.7 0.7 10.4CH 1.5 1.4 0.8 1.0 1.1 1.1 -0.9
Notes: Data are not harmonised and therefore not fully comparable across countries. FR: data refer to the paris Metro and ReR (Réseau express Régional) systems and to metros in other French cities. PT: data refer only to lisbon and porto Metro.
Sources: Eurostat, International Transport Forum, UNECE, Union Internationale des Chemins de Fer, national statistics, estimates (in italics). Shares under PSO from Rail Market Monitoring Scheme (DG MOVE) and DG MOVE estimates
Sources : Nat ional stat ist ics , Internat ional Union of Publ ic Transport , study for DG Energy and Transport , est imates ( in i ta l ics)

52 53
Titlesubtitle
TitlesubtitleUSARail
TRANSPORT
PERFORMANCE OF PASSENGER TRANSPORT EXPRESSED IN PASSENGER-KILOMETRES
TRANSPORT
PERFORMANCE OF PASSENGER TRANSPORT EXPRESSED IN PASSENGER-KILOMETRES 2.3 .9 2 .3 .8
HigH-SPEEd RAil TRANSPORT (*)billion pkm %
BE CZ DE ES FR IT NL PT SI FI SE UK EU-2
8
CHA
NG
E
1990 - - - - 14.92 0.30 - - - - 0.01 - 15.23
1995 - - 8.70 1.29 21.43 1.10 - - - - 0.42 - 32.94 7.2
1996 0.32 - 8.85 1.10 24.79 1.30 0.03 - - 0.02 1.10 - 37.52 13.9
1997 0.56 - 10.07 1.30 27.58 2.40 0.07 - - 0.05 1.33 - 43.36 15.6
1998 0.79 - 10.16 1.52 29.98 3.64 0.09 - - 0.06 1.61 - 47.83 10.3
1999 0.80 - 11.59 1.67 32.36 4.46 0.10 - - 0.05 1.81 - 52.86 10.5
2000 0.87 - 13.93 1.94 34.75 5.09 0.11 - - 0.07 2.05 - 58.80 11.2
2001 0.89 - 15.52 2.08 37.40 6.76 0.19 - - 0.06 2.23 - 65.13 10.8
2002 0.91 - 15.26 2.18 39.86 7.08 0.20 - - 0.14 2.39 - 68.01 4.4
2003 0.88 - 17.46 2.03 39.60 7.43 0.66 - - 0.20 2.40 - 70.66 3.9
2004 0.94 0.00 19.60 2.09 41.44 7.93 0.66 0.44 - 0.16 2.42 0.44 76.11 7.7
2005 0.98 0.01 20.85 2.32 43.13 8.55 0.69 0.49 - 0.31 2.33 0.45 80.11 5.3
2006 1.00 0.15 21.64 2.70 44.85 8.91 0.73 0.51 - 0.44 2.49 0.90 84.32 5.2
2007 1.02 0.33 21.92 2.59 47.97 8.82 0.80 0.51 - 0.58 2.78 1.39 88.70 5.2
2008 1.08 0.25 23.33 5.48 52.56 8.88 0.87 0.53 0.01 0.62 2.99 0.99 97.60 10.0
2009 1.06 0.24 22.56 11.51 51.86 10.75 0.92 0.53 0.02 0.60 3.05 1.01 104.10 6.7
2010 1.06 0.27 23.90 11.72 51.89 11.61 0.29 0.52 0.02 0.65 2.94 1.01 105.87 1.7
2011 0.91 0.29 23.31 11.23 52.04 12.28 0.31 0.47 0.01 0.71 2.83 4.36 108.73 2.7
2012 0.91 0.27 24.75 11.18 51.09 12.79 0.32 0.46 0.01 0.71 2.95 4.36 109.80 1.0
2013 0.91 0.25 25.18 12.74 50.79 12.79 0.36 0.47 0.01 0.76 3.06 4.36 111.67 1.7
Notes: in this table, high-speed rail transport covers all traffic with high-speed rolling stock (incl. tilting trains able to run 200 km/h). this does not necessarily require high-speed infrastructure as defined in table 2.5.4.
SHARE Of HigH-SPEEd RAil TRANSPORT iN TOTAl PASSENgER-kilOmETRES iN RAil TRANSPORT (**)
%BE CZ DE ES FR IT NL PT SI FI SE UK EU-28
2000 11.2 - 18.5 9.6 49.7 10.3 0.8 - - 2.1 24.8 - 15.9
2001 11.1 - 20.5 10.0 52.3 13.5 1.3 - - 1.8 25.5 - 17.5
2002 11.0 - 21.5 10.3 54.2 14.4 1.4 - - 4.1 26.9 - 18.6
2003 10.6 - 24.5 9.6 55.2 15.3 4.8 - - 6.0 27.2 - 19.5
2004 10.8 0.0 27.0 10.2 55.8 16.1 4.5 11.8 - 4.8 28.0 1.0 20.7
2005 10.7 0.1 27.8 10.7 56.6 16.9 4.5 12.9 - 8.9 26.1 1.0 21.2
2006 10.4 2.1 27.8 12.2 56.4 17.5 4.6 13.1 - 12.4 25.9 1.9 21.6
2007 10.2 4.8 27.7 11.9 58.8 17.7 4.9 12.7 - 15.4 27.0 2.8 22.4
2008 10.4 3.7 28.8 22.9 60.7 17.9 5.3 12.5 1.7 15.4 27.0 1.9 23.8
2009 10.2 3.6 27.4 49.7 60.3 22.3 5.6 12.7 1.9 15.6 27.0 1.9 25.7
2010 10.0 4.1 28.8 52.3 60.4 24.5 1.9 12.6 1.9 16.4 26.3 1.8 26.1
2011 8.7 4.2 27.4 49.3 58.5 26.2 1.8 11.2 1.7 18.3 24.8 7.4 26.2
2012 8.8 3.7 28.0 49.7 57.4 28.7 1.9 12.1 1.6 17.5 25.0 7.2 26.2
2013 8.6 3.3 28.3 53.6 58.1 26.3 2.1 12.7 1.6 18.7 25.8 7.0 26.3
PERfORmANcE by mOdE Of TRANSPORT: PASSENgERSbillion pkm
PASSENgER cARS (*)
mOTOR- cyclES RAilwAy bUS
ligHT ANd cOmmUTER
RAil AiR TOTAl1990 5 280.5 20.0 28.2 195.7 12.3 556.6 6 093.31995 5 702.0 17.3 25.9 219.3 14.7 650.0 6 629.22000 6 372.2 24.9 31.1 505.5 17.3 834.6 7 785.62001 6 481.2 22.7 31.8 443.2 17.7 783.0 7 779.62002 6 626.4 22.8 30.8 455.3 17.6 778.2 7 931.22003 6 689.0 23.3 31.0 456.9 17.8 813.6 8 031.52004 6 884.5 30.6 32.0 461.7 18.2 898.3 8 325.22005 6 952.4 28.2 31.9 449.1 18.0 939.5 8 418.92006 6 972.4 39.2 32.4 479.3 19.7 947.0 8 489.92007 6 987.7 43.7 35.3 495.5 21.0 977.8 8 561.12008 6 837.8 42.5 37.1 506.0 21.1 938.7 8 383.22009 5 834.8 36.1 36.6 491.1 21.4 887.9 7 308.02010 5 866.7 32.0 36.7 470.7 20.8 908.8 7 335.72011 5 874.5 32.1 38.6 470.5 22.0 926.4 7 364.02012 5 905.1 37.1 39.1 504.6 21.9 934.2 7 442.02013 5 935.6 35.3 39.9 517.7 23.0 949.0 7 500.6
AvERAgE ANNUAl cHANgE% per year
PASSENgER cARS (*)
mOTOR- cyclES RAilwAy bUS
ligHT ANd cOmmUTER
RAil AiR TOTAl2001 1.7 -8.7 2.0 -12.3 2.2 -6.2 -0.12005 1.0 -8.0 -0.3 -2.7 -1.1 4.6 1.12010 0.5 -11.3 0.5 -4.2 -2.8 2.3 0.42011 0.1 0.2 5.1 0.0 5.6 1.9 0.42012 0.5 15.6 1.4 7.2 -0.5 0.8 1.12013 0.5 -4.8 2.0 2.6 5.1 1.6 0.8
'90/'95 1.5 -2.8 -1.7 2.3 3.5 3.2 1.7'95/'00 2.2 7.5 3.7 18.2 3.4 5.1 3.3'00/'13 -0.5 2.7 1.9 0.2 2.2 1.0 -0.3
mOdAl SPliT%
PASSENgER cARS (*)
mOTOR- cyclES RAilwAy bUS
ligHT ANd cOmmUTER
RAil AiR
1990 86.7 0.3 0.5 3.2 0.2 9.1 1995 86.0 0.3 0.4 3.3 0.2 9.8 2000 81.8 0.3 0.4 6.5 0.2 10.7 2005 82.6 0.3 0.4 5.3 0.2 11.2 2006 82.1 0.5 0.4 5.6 0.2 11.2 2007 81.6 0.5 0.4 5.8 0.2 11.4 2008 81.6 0.5 0.4 6.0 0.3 11.2 2009 79.8 0.5 0.5 6.7 0.3 12.2 2010 80.0 0.4 0.5 6.4 0.3 12.4 2011 79.8 0.4 0.5 6.4 0.3 12.6 2012 79.3 0.5 0.5 6.8 0.3 12.6 2013 79.1 0.5 0.5 6.9 0.3 12.7
Note: (*) it includes: light duty vehicles, short wheel base and long wheel base.
Sources : ( * ) Union Internat ionale des Chemins de Fer, nat ional stat ist ics , est imates ( in i ta l ics) ; ( * * ) Table 2 .3 .7
Source : US Department of Transportat ion

54 55
Titlesubtitle
Titlesubtitle
Source : Eurostat , est imates ( in i ta l ics)
TRANSPORT
PERFORMANCE OF FREIGHT AND PASSENGER TRANSPORT USING OTHER INDICATORS
Air: PASSENGER TRAFFIC BETWEEN MEMBER STATES
2.4 .1 TRANSPORT
2.4
2013iNclUdiNg dOmESTic fligHTS (1 000)
LT LU HU MT NL AT PL PT RO SI SK FI SE UK
112.3 1.3 423.0 82.5 207.9 413.0 427.4 820.2 297.6 87.1 64.5 183.1 424.6 1 286.7
29.2 25.2 35.1 14.6 207.2 430.9 249.7 0.6 49.5 3.6 71.0 50.8 42.4 978.8
3.3 0.1 62.4 12.0 519.5 159.7 154.5 100.5 77.0 0.0 56.2 181.2 184.6 1 387.4
204.8 62.8 135.6 67.3 1 257.9 472.5 456.2 301.9 31.1 18.3 9.2 832.9 1 696.6 2 791.5
374.0 332.7 1 387.0 579.9 3 497.8 6 547.3 3 223.5 3 124.8 1 493.8 216.0 1.9 1 647.9 2 853.7 12 190.1
37.2 0.0 0.0 0.4 87.0 5.3 25.4 2.2 218.8 136.0 143.7
162.3 0.0 163.5 59.1 804.5 126.1 858.7 685.3 76.1 95.7 35.9 150.0 9 643.8
76.8 50.9 126.4 17.3 1 170.8 781.6 699.7 3.5 230.1 42.6 85.4 375.6 791.4 4 953.6
150.2 290.9 323.3 166.3 5 510.3 1 335.2 1 152.8 2 767.3 1 032.6 5.0 102.0 1 397.4 2 764.3 32 734.2
79.8 120.4 448.3 237.4 3 021.8 1 017.1 944.8 4 134.0 706.2 77.3 31.8 591.1 1 131.1 11 051.6
4.7 3.6 51.1 4.1 105.0 274.3 60.7 22.5 0.1 1.0 5.5 100.0 219.5 892.3
218.4 160.3 714.0 730.0 3 526.6 1 172.0 1 259.4 1 245.6 2 116.1 2.2 193.0 483.3 803.3 11 033.5
12.8 0.4 61.3 22.8 71.3 168.1 97.4 0.0 111.2 5.5 3.3 54.1 223.5 2 330.5
214.9 0.1 21.8 5.4 139.5 75.1 65.6 1.4 0.0 1.1 285.8 205.8 544.3
0.1 0.0 21.2 75.4 55.4 95.2 1.8 0.1 1.0 0.0 100.5 49.1 739.9
1.0 0.0 3.2 124.5 68.8 0.6 193.3 0.0 0.3 0.3 370.1
0.0 0.0 0.3 35.1 627.9 104.1 184.0 68.1 85.7 0.0 0.0 214.7 335.7 1 330.0
21.2 3.9 35.2 0.3 103.6 81.5 47.5 0.2 7.9 5.3 2.5 1.4 81.3 1 160.3
75.4 123.6 598.3 102.6 1.2 744.7 627.5 1 533.2 418.5 23.4 0.2 492.9 982.1 8 176.8
55.3 68.6 104.3 81.0 747.1 621.3 295.9 109.9 503.2 53.2 55.1 157.4 347.9 1 544.4
94.8 0.7 189.0 47.8 640.1 295.7 1 217.2 137.4 84.2 0.3 0.5 227.2 712.9 5 312.2
2.0 187.5 77.6 0.1 1 526.3 109.0 135.7 2 837.9 57.3 0.7 118.4 160.4 5 446.6
0.0 0.1 84.9 7.6 420.0 505.6 78.4 54.5 565.9 0.2 0.3 0.9 0.4 826.3
1.0 0.0 0.0 5.3 23.4 53.2 0.1 0.0 0.2 0.0 31.4 0.2 139.2
0.0 0.1 0.6 2.5 0.6 55.2 0.6 0.8 0.0 0.1 19.7 1.0 0.6 439.5
100.4 0.3 215.9 1.4 496.4 157.7 228.3 127.2 0.4 31.8 1.1 2 439.5 1 498.9 1 021.1
48.8 0.1 335.5 80.4 1 090.6 347.5 692.7 166.2 0.2 0.4 0.3 1 503.0 7 063.7 2 568.1
731.8 369.8 1 264.7 1 156.9 8 196.3 1 537.7 5 125.8 5 505.9 821.5 138.9 431.7 1 013.0 2 576.2 21 318.3
REPO
RTER TOTAl PASSENgERS cARRiEd (*)
PARTNER
BE BG CZ DK DE EE IE EL ES FR HR IT CY LV
BE 40.4 151.5 250.4 479.7 1 493.9 48.1 422.1 793.2 4 468.1 1 795.3 129.6 2 956.8 56.5 107.3
BG 160.0 182.4 210.0 77.9 1 313.9 23.2 28.4 89.7 268.7 201.5 0.6 337.3 59.4 20.0
CZ 250.4 208.7 83.0 222.0 1 068.2 0.8 106.2 583.7 665.6 964.7 38.5 883.8 23.1 26.3
DK 479.4 78.2 222.1 1 890.1 2 485.1 117.7 252.7 671.8 2 353.6 1 325.0 130.7 1 230.5 60.3 169.0
DE 1 504.1 1 302.6 1 095.5 2 499.7 22 616.9 273.1 1 503.3 4 295.9 23 128.9 8 336.7 1 416.7 11 320.4 261.1 623.8
EE 48.2 22.6 0.8 118.0 271.1 19.2 21.6 16.0 64.2 12.1 0.3 51.9 2.5 198.0
IE 423.2 28.0 106.8 252.9 1 495.7 21.8 57.1 56.4 3 048.9 1 553.4 78.9 963.7 7.1 107.7
EL 797.1 89.1 584.0 674.0 4 361.0 16.6 56.5 5 111.5 357.8 1 758.2 25.1 2 223.7 970.2 32.7
ES 4 423.8 267.6 664.2 2 353.0 22 867.0 63.8 3 038.0 356.7 28 599.5 10 251.4 138.3 9 609.1 19.7 92.5
FR 1 819.3 203.3 968.6 1 336.0 7 185.0 12.6 1 568.3 1 773.7 9 394.8 28 730.4 474.8 9 959.9 67.2 130.9
HR 146.4 0.6 39.5 130.4 1 469.6 0.4 78.6 13.2 139.8 468.8 441.2 138.3 0.1 6.6
IT 2 966.4 337.2 886.0 1 229.3 11 303.0 54.4 964.8 2 222.1 9 662.2 9 937.6 178.9 28 416.3 116.3 237.5
CY 54.6 59.4 23.4 61.2 269.5 2.5 7.1 960.3 19.7 68.2 0.1 117.0 0.0 7.8
LV 107.5 19.6 26.5 168.8 619.3 196.1 107.8 32.5 98.6 130.1 0.1 239.7 8.1 0.3
LT 113.3 29.2 3.4 205.6 373.2 37.7 166.8 76.5 146.1 79.7 0.2 219.1 13.1 217.3
LU 1.0 24.7 0.1 63.3 330.3 53.4 295.9 117.8 3.5 162.4 0.4 0.1
HU 424.4 38.4 68.1 136.0 1 404.0 0.1 163.4 125.4 321.5 502.9 0.4 720.3 60.8 23.1
MT 83.5 17.1 12.1 66.8 579.2 0.3 59.6 15.3 167.2 242.5 4.1 731.5 22.6 5.5
NL 210.8 206.5 519.6 1 254.5 3 480.1 87.2 806.3 1 173.6 5 545.1 2 994.5 105.2 3 528.0 71.1 139.2
AT 415.2 431.9 161.8 474.9 6 534.6 5.4 126.8 778.7 1 344.8 1 064.7 266.2 1 174.1 168.6 75.3
PL 454.4 239.6 155.6 458.1 3 213.8 25.7 927.7 696.4 1 172.4 951.1 63.0 1 306.5 90.0 65.7
PT 816.4 0.6 89.1 294.4 3 086.5 2.2 683.4 3.7 2 723.3 3 984.3 25.5 1 239.5 0.0 1.2
RO 297.1 36.1 79.5 29.4 1 493.7 0.3 74.5 243.3 1 033.0 703.2 0.1 2 229.7 108.9 0.0
SI 87.2 3.5 0.5 18.2 214.8 47.6 7.7 76.5 1.0 2.3 0.9 0.0
SK 65.4 94.5 59.1 10.2 2.5 98.3 86.4 106.3 32.2 4.0 192.4 3.2 1.1
FI 184.4 50.8 182.3 841.1 1 648.9 205.6 36.5 379.4 1 415.5 594.1 101.1 486.1 55.5 285.8
SE 427.5 42.8 184.6 1 723.8 2 859.3 140.6 150.1 822.0 2 904.5 1 123.0 216.9 789.4 236.0 205.0
UK 1 294.7 927.0 1 393.2 2 775.8 12 211.4 145.3 9 668.5 4 937.6 32 959.2 10 768.6 882.4 11 023.1 2 346.4 548.9
Note: (*) passengers carried are fewer than passengers on board, due to transit passengers staying on board the aircraft not being counted.
PERFORMANCE OF FREIGHT AND PASSENGER TRANSPORT USING OTHER INDICATORS
Air: PASSENGER TRAFFIC BETWEEN MEMBER STATES

56 57
Titlesubtitle
Titlesubtitle
Sources : Eurostat , a i rportsSources : Associat ion of European Air l ines , Ascend, Internat ional A i r Transport Associat ion , a i r companies , own est imates
Air: MAJOR EUROPEAN AIRLINES
Air: PASSENGER TRAFFIC AT MAJOR EU AIRPORTS
2.4 .3 TRANSPORT
PERFORMANCE OF FREIGHT AND PASSENGER TRANSPORT USING OTHER INDICATORS
TRANSPORT
PERFORMANCE OF FREIGHT AND PASSENGER TRANSPORT USING OTHER INDICATORS2.4 .2
dOmESTic + iNTERNATiONAl
RAN
kiN
g billiON REvENUE PASSENgER-kilOmETRES %
AiRliNE 2000 2005 2010 2012 2013 CHA
NG
E '1
2 / '
13
1 Deutsche Lufthansa DE 94.289 112.794 129.671 149.780 153.334 2.42 Air France (1) FR 91.848 115.879 125.048 135.824 136.435 0.53 British Airways UK 119.385 110.939 105.554 126.436 131.333 3.94 Ryanair (2) IE 3.386 24.008 72.165 94.262 96.324 2.25 THY Turkish Airlines TR 17.396 20.452 46.538 74.638 92.000 23.3
6 KLM Royal Dutch Airlines (1) NL 60.331 68.322 76.065 86.281 89.039 3.2
7 Easyjet (3) UK 4.730 27.448 56.128 65.227 67.573 3.68 Air Berlin DE 7.813 20.530 45.244 48.720 48.575 -0.39 Iberia ES 40.043 48.917 51.274 49.663 41.493 -16.5
10 Virgin Atlantic Airways UK 29.471 32.118 38.158 39.406 39.538 0.3
11 Alitalia (4) IT 40.846 37.236 32.906 36.192 35.570 -1.712 SWISS Intern. Airlines CH 3.481 20.471 29.522 33.527 35.093 4.7
13 SAS Scandinavian Airlines
SE/DK/NO
22.922 27.724 23.495 27.798 32.658 17.5
14 Thomson Airways UK 23.337 32.714 32.073 31.575 -1.615 TAP Portugal PT 10.414 14.536 23.649 27.226 28.152 3.416 Norwegian NO 2.703 13.774 20.353 26.881 32.117 Finnair FI 7.467 16.735 19.222 23.563 24.776 5.118 Condor DE 22.245 19.888 23.779 24.621 3.519 Thomas Cook Airlines UK 14.220 27.385 22.541 19.809 -12.120 Air Europa ES 8.831 13.442 17.180 17.429 19.427 11.521 Wizz Air HU 12.278 16.000 18.017 12.622 Austrian Airlines AT 17.967 22.894 17.494 17.952 17.705 -1.423 Vueling ES 1.661 9.932 13.693 17.109 24.924 Pegasus Airlines TR 5.123 10.662 12.070 16.231 34.525 Monarch UK 13.658 13.549 15.127 14.854 15.281 2.926 Aer Lingus IE 8.900 13.100 13.895 14.523 14.807 2.027 Transavia Airlines NL 8.726 10.644 11.250 12.254 8.928 Tuifly DE 17.213 10.708 11.428 11.000 -3.729 Jet2 UK 3.105 6.219 9.405 10.807 14.930 Sunexpress TU 3.938 10.840 10.398 9.777 -6.031 SN Brussels Airlines BE 2.347 4.559 7.314 9.215 9.772 6.0
32 Thomas Cook Scandinavia DK 10.118 7.500 8.354 9.446 9.083 -3.8
Notes: Scheduled and non-scheduled flights. (1) Air France and KLM merged in 2004 to build air France klM Group. (2) Ryanair: year up to 30 March of the following year. (3) Easyjet: financial year up to 30 September of the year indicated.
(4) Air One merged with alitalia at the end of 2008.
PASSENgERS cARRiEd (*)
RAN
kiN
g (arriving + departing + in transit) milliON PASSENgERS %
AiRPORT ANd cOUNTRy 2000 2005 2010 2012 2013 CHA
NG
E ‘1
2 / ’
13
1 London / Heathrow UK 64.29 67.68 65.74 69.98 72.33 3.362 Paris / Charles de Gaulle FR 49.67 53.38 57.95 61.38 61.89 0.843 Frankfurt (Main) DE 48.96 51.79 52.65 57.26 57.88 1.084 Amsterdam / Schiphol NL 39.27 44.08 45.15 50.99 52.54 3.055 Madrid / Barajas ES 32.71 41.72 49.80 45.12 39.66 -12.116 München DE 22.87 28.45 34.52 38.19 38.52 0.877 Roma / Fiumicino IT 25.94 27.78 35.95 36.74 35.94 -2.198 London / Gatwick UK 31.95 32.69 31.34 34.21 35.43 3.559 Barcelona ES 19.44 27.02 29.18 35.07 35.18 0.30
10 Paris / Orly FR 23.83 24.85 25.16 27.19 28.25 3.8811 København / Kastrup DK 18.11 19.82 21.39 23.22 23.97 3.2212 Palma de Mallorca ES 19.25 21.22 21.08 22.61 22.74 0.5813 Wien / Schwechat AT 11.92 15.85 19.68 22.20 22.04 -0.7114 Düsseldorf DE 15.91 15.39 18.91 20.80 21.20 1.9115 Manchester UK 18.32 22.08 17.66 19.65 20.68 5.2216 Stockholm / Arlanda SE 18.61 17.16 16.96 19.69 20.67 5.0217 Dublin IE 13.66 18.33 18.41 19.08 20.14 5.5518 Berlin / Tegel DE 10.24 11.47 14.97 18.15 19.58 7.8719 Brussel-Bruxelles / Brussels BE 21.60 15.95 16.98 18.82 18.98 0.9020 London / Stansted UK 11.86 21.99 18.56 17.46 17.84 2.2021 Milano / Malpensa IT 20.55 19.49 18.71 18.33 17.78 -2.9922 Lisboa PT 9.21 11.24 14.05 15.31 16.03 4.6423 Helsinki / Vantaa FI 10.00 11.13 12.86 14.85 15.27 2.8324 Hamburg DE 9.82 10.57 12.88 13.68 13.48 -1.4125 Malaga ES 9.36 12.61 12.02 12.52 12.87 2.7826 Athinai / Eleftherios Venizelos EL 13.35 14.27 15.30 12.86 12.47 -3.0727 Nice / Côte d'Azur FR 9.33 9.74 9.59 11.18 11.54 3.2428 Praha / Ruzyne CZ 5.55 10.72 11.51 10.77 10.95 1.6329 Warszawa / Okecie PL 4.33 7.08 8.73 9.61 10.70 11.3530 Edinburgh UK 5.37 8.45 8.59 9.19 9.77 6.3231 London / Luton UK 6.16 9.13 8.73 9.61 9.69 0.8332 Alicante ES 5.98 8.93 9.37 8.84 9.62 8.8733 Stuttgart DE 7.98 9.25 9.14 9.68 9.55 -1.3734 Las Palmas / Gran Canaria ES 9.12 9.69 9.28 9.66 9.54 -1.3035 Birmingham UK 7.49 9.31 8.56 8.92 9.11 2.2236 Köln-Bonn DE 6.19 9.39 9.79 9.26 9.05 -2.2337 Milano / Linate IT 6.02 9.09 8.30 9.18 8.98 -2.0938 Bergamo / Orio al Serio IT 1.24 4.29 7.66 8.88 8.95 0.8639 Tenerife Sur / Reina Sofia ES 8.72 8.78 7.19 8.38 8.57 2.1740 Lyon / Saint-Exupéry FR 5.92 6.46 7.79 8.37 8.50 1.61
Notes: (*) ‘passengers carried’ do not include direct transit passengers, i.e. transit passengers who stay on board the aircraft and continue their flight with the same flight number. Where the number of passengers carried was not available, the number of ‘passengers on board’ (i.e. incl. direct transit passengers) is given in italics.

58 59
Titlesubtitle
Titlesubtitle
2.4 .4b 2 .4 .4a
Air: MAIN CONNECTIONS BETWEEN EU AND NON-EU AIRPORTS IN PASSENGER TRANSPORT
Air: MAIN INTRA-EU AIRPORT PAIRS IN PASSENGER TRANSPORT
Source : EurostatSource : Eurostat
TRANSPORT
PERFORMANCE OF FREIGHT AND PASSENGER TRANSPORT USING OTHER INDICATORS
TRANSPORT
PERFORMANCE OF FREIGHT AND PASSENGER TRANSPORT USING OTHER INDICATORS
TOTAl PASSENgERS cARRiEd
RAN
kiN
g
(arriving + departing from first named airport) 1 000 %
AIRPORT PAIRS 2005 2010 2012 2013 CHA
NG
E ‘1
2/’1
3
1 Toulouse / Blagnac - Paris / Orly 2 327.1 2 193.7 2 330.0 2 379.1 2.1
2 Barcelona - Madrid / Barajas 4 301.0 3 083.8 2 550.2 2 213.2 -13.2
3 Nice / Côte d'Azur - Paris / Orly 2 262.9 2 104.6 2 175.0 2 160.3 -0.7
4 Frankfurt (Main) - Berlin / Tegel 1 545.6 1 609.4 1 813.1 1 845.6 1.8
5 München - Berlin / Tegel 1 419.2 1 580.0 1 731.1 1 831.7 5.8
6 Hamburg - München 1 450.5 1 653.0 1 719.2 1 713.2 -0.3
7 London / Heathrow - Dublin 2 089.4 1 493.1 1 577.6 1 663.9 5.5
8 Catania / Fontanarossa - Roma / Fiumicino 1 368.7 1 717.8 1 694.4 1 566.8 -7.5
9 Düsseldorf - München 1 381.5 1 533.4 1 553.4 1 558.2 0.3
10 Frankfurt (Main) - London / Heathrow 1 522.5 1 259.8 1 474.5 1 488.6 1.0
11 London / Heathrow - Amsterdam / Schiphol 1 895.0 1 332.9 1 429.8 1 443.4 1.0
12 Milano / Linate - Roma / Fiumicino 2 414.6 1 522.8 1 378.8 1 416.1 2.7
13 Barcelona - Palma De Mallorca 1 684.0 1 532.5 1 460.1 1 388.9 -4.9
14 Frankfurt (Main) - Hamburg 1 288.3 1 480.6 1 385.9 1 362.4 -1.7
15 London / Heathrow - Edinburgh 1 659.9 1 244.4 1 254.8 1 355.7 8.0
16 København / Kastrup - Stockholm / Arlanda 1 194.1 1 166.0 1 269.2 1 325.7 4.4
17 Frankfurt (Main) - Wien / Schwechat 676.2 952.4 1 182.2 1 307.9 10.6
18 Köln-Bonn - Berlin / Tegel 916.6 1 026.9 1 088.7 1 288.2 18.3
19 London / Heathrow - Madrid / Barajas 1 118.9 1 093.4 1 197.7 1 264.8 5.6
20 Palermo / Punta Raisi - Roma / Fiumicino 1 106.7 1 406.8 1 360.4 1 264.1 -7.1
21 Madrid / Barajas - Palma de Mallorca 1 640.0 1 698.9 1 442.5 1 224.7 -15.1
22 London / Heathrow - Paris / Charles de Gaulle 2 011.1 1 300.1 1 168.4 1 209.9 3.6
23 Amsterdam / Schiphol - Barcelona 1 103.9 1 066.9 1 250.2 1 186.8 -5.1
24 München - London / Heathrow 913.7 970.4 1 104.3 1 156.6 4.7
25 Las Palmas / Gran Canaria - Madrid / Barajas 1 388.1 1 553.7 1 301.5 1 152.9 -11.4
26 Amsterdam / Schiphol - Paris / Charles de Gaulle 1 038.7 990.2 1 124.3 1 126.7 0.2
27 London / Gatwick - Barcelona 558.1 375.9 744.0 1 126.3 51.4
28 Paris / Orly - Pointe-à-Pitre (Guadeloupe) / Pôle Caraïbes 983.3 1 036.0 1 073.2 1 111.8 3.6
29 Paris / Charles de Gaulle - Roma / Fiumicino 1 238.4 1 191.2 1 192.8 1 104.4 -7.4
30 Tenerife Norte - Madrid / Barajas 1 359.4 1 319.7 1 167.7 1 102.7 -5.6
31 Frankfurt (Main) - München 1 303.1 958.4 1 068.9 1 099.9 2.9
32 Düsseldorf - Palma De Mallorca 968.6 900.1 985.5 1 089.8 10.6
33 Düsseldorf - Berlin / Tegel 657.8 930.2 1 012.0 1 082.7 7.0
34 Frankfurt (Main) - Paris / Charles de Gaulle 961.7 928.8 1 107.7 1 039.5 -6.2
35 Madrid / Barajas - Roma / Fiumicino 929.7 1 268.5 1 129.3 1 012.3 -10.4
36 London / Gatwick - Malaga 982.6 909.2 979.0 1 007.2 2.9
37 Barcelona - Paris / Charles de Gaulle 876.3 860.8 1 028.0 1 006.8 -2.1
38 Madrid / Barajas - Paris / Orly 964.3 1 105.9 1 127.3 990.7 -12.1
39 Lulea / Kallax - Stockholm / Arlanda : 850.1 976.7 988.2 1.2
40 London / Heathrow - Roma / Fiumicino 972.6 1 033.1 1 037.4 980.1 -5.5
TOTAl PASSENgERS cARRiEd
RAN
kiN
g
(arriving + departing from first named airport) 1 000 %
AIRPORT PAIRS 2005 2010 2012 2013 CHA
NG
E ‘1
2/’1
3
1 London / Heathrow - New York / J.F. Kennedy Intl, NY, USA 2 940 2 517 2 839 3 015 6.2
2 London / Heathrow - Dubai Intl, United Arab Emirates 1 183 1 787 1 959 2 240 14.3
3 Paris / Charles de Gaulle - New York / J.F. Kennedy Intl, NY, USA 1 730 1 190 1 362 1 407 3.3
4 London / Heathrow - Hong Kong Intl, China 1 258 1 386 1 387 1 382 -0.3
5 London / Heathrow - Los Angeles Intl, CA, USA 1 383 1 189 1 313 1 340 2.0
6 København / Kastrup - Oslo / Gardermoen, Norway 1 247 1 132 1 287 1 315 2.2
7 Stockholm / Arlanda - Oslo / Gardermoen, Norway 937 1 007 1 193 1 195 0.1
8 London / Heathrow - Chicago / O'Hare Intl, IL, USA 1 522 1 137 1 188 1 182 -0.5
9 London / Heathrow - Newark / Liberty Intl, NJ, USA 740 1 092 1 168 1 180 1.0
10 London / Heathrow - Singapore / Changi, Singapore 996 1 022 1 167 1 150 -1.4
11 Paris / Charles de Gaulle - Montreal / Pierre Elliot Trudeau Intl, Canada 929 1 148 1 087 1 099 1.1
12 London / Heathrow - Mumbai / Chhatrapati Shivaji Intl, India 725 957 891 1 046 17.4
13 London / Heathrow - New Delhi / Indira Gandhi Intl, India 384 918 919 1 043 13.5
14 London / Heathrow - Zürich, Switzerland 905 877 1 012 1 039 2.6
15 London / Heathrow - Toronto / Lester B. Pearson Intl, Canada 1 067 941 951 1 014 6.6
16 London / Heathrow - Miami Intl, FL, USA 878 822 1 031 1 010 -2.0
17 London / Heathrow - San Francisco Intl, CA, USA 1 005 861 966 978 1.3
18 London / Heathrow - Genève / Cointrin, Switzerland 570 859 955 971 1.7
19 Paris / Charles de Gaulle - Dubai Intl, United Arab Emirates 439 716 843 969 14.9
20 Wien / Schwechat - Zürich, Switzerland 597 778 908 934 2.8
21 London / Heathrow - Washington / Dulles Intl, DC, USA 1 074 921 954 932 -2.3
22 Berlin / Tegel - Zürich, Switzerland 467 801 905 931 2.9
23 London / Heathrow - Johannesburg Intl, South Africa 995 886 862 915 6.1
24 London / Heathrow - Istanbul / Atatürk, Turkey 525 725 874 906 3.6
25 London / Heathrow - Boston / Gen. E. Lawrence Logan Intl, MA, USA 929 866 996 894 -10.3
26 Düsseldorf - Antalya, Turkey 802 684 884 865 -2.1
27 Frankfurt (Main) - Dubai Intl, United Arab Emirates 491 679 740 828 12.0
28 Paris / Charles de Gaulle - Tel Aviv / Ben Gurion, Israel 608 710 740 818 10.5
29 Frankfurt (Main) - Istanbul / Atatürk, Turkey 661 638 801 817 2.0
30 London / Heathrow - Doha Intl, United Arab Emirates 332 640 805 816 1.4
31 Paris / Charles de Gaulle - Tokio Intl, Japan - 849 801 815 1.7
32 Paris / Charles de Gaulle - Moscow/Sheremetyevo, Russia 515 642 802 797 -0.6
33 London / Gatwick - Genève, Switzerland 643 624 740 783 5.8
34 Paris / Charles de Gaulle - Istanbul / Atatürk, Turkey 415 688 781 776 -0.6
35 Madrid / Barajas - Buenos Aires / Ezeiza Ministro Pistarini, Argentina 873 858 782 773 -1.1
36 Manchester - Dubai Intl, United Arab Emirates 370 566 693 769 11.0
37 Paris / Orly - Alger, Algeria 640 577 703 767 9.1
38 Amsterdam / Schiphol - Antalya, Turkey 753 614 701 746 6.3
39 Paris / Orly - Casablanca / Mohammed V - 598 627 718 14.5
40 London / Gatwick - Dubai Intl, United Arab Emirates 483 629 621 716 15.4

60 61
Titlesubtitle
Titlesubtitle
Sources : Eurostat , a i rportsSources : Eurostat , a i rport websites ( in i ta l ics)
2.4 .6 2 .4 .5
Air: MOVEMENTS OF AIRCRAFT AT MAJOR EU AIRPORTS
Air: FREIGHT TRAFFIC AT MAJOR EU AIRPORTS
TRANSPORT
PERFORMANCE OF FREIGHT AND PASSENGER TRANSPORT USING OTHER INDICATORS
TRANSPORT
PERFORMANCE OF FREIGHT AND PASSENGER TRANSPORT USING OTHER INDICATORS
cARgO ANd mAil lOAdEd ANd UNlOAdEd
RAN
kiN
g 1 000 TONNES %
AIRPORT AND COUNTRY 2000 2005 2010 2012 2013 CHA
NG
E '1
2/'1
3
1 Frankfurt (Main) DE 1 703.4 1 950.6 2 270.2 2 065.5 2 094.7 1.422 Amsterdam / Schiphol NL 1 222.5 1 495.6 1 538.0 1 510.9 1 566.0 3.643 London / Heathrow UK 1 306.8 1 389.3 1 551.3 1 556.0 1 513.7 -2.724 Paris / Charles de Gaulle FR 1 067.0 1 217.8 1 292.5 1 513.9 1 494.9 -1.265 Leipzig-Halle DE 13.7 12.3 637.8 845.9 877.3 3.716 Köln-Bonn DE 438.3 646.8 638.2 730.1 721.7 -1.157 Luxembourg LU 499.9 624.8 705.8 615.3 673.4 9.448 Liège / Bierset BE 270.3 325.7 508.5 510.3 534.2 4.699 Milano / Malpensa IT 295.7 383.8 432.7 414.3 430.3 3.87
10 Brussel-Bruxelles / Brussels BE 687.4 694.5 385.0 405.3 378.7 -6.5611 Madrid / Barajas ES 305.2 360.3 400.5 385.4 367.0 -4.7512 Nottingham East Midlands UK 178.8 292.1 304.0 300.0 296.9 -1.0413 München DE 148.4 218.2 291.1 290.3 287.7 -0.8814 London / Stansted UK 167.8 254.8 229.8 241.4 236.3 -2.1215 Wien / Schwechat AT 132.6 180.1 231.8 191.1 190.5 -0.3516 Helsinki / Vantaa FI 96.1 114.9 157.5 188.5 187.2 -0.7017 Roma / Fiumicino IT 153.3 131.9 164.4 143.2 141.9 -0.9318 København / Kastrup DK 419.4 355.1 138.1 152.4 136.8 -10.2219 Frankfurt / Hahn DE 75.0 100.9 164.5 175.5 133.3 -24.0420 Bergamo / Orio al Serio IT 98.9 135.1 105.8 116.7 115.9 -0.6721 Dublin IE 35.5 64.1 105.3 111.1 113.5 2.1722 London / Gatwick UK 318.8 232.1 108.6 101.1 100.4 -0.6523 Barcelona ES 88.1 94.5 105.9 94.9 98.2 3.4024 Lisboa PT 114.6 100.0 105.2 91.0 96.8 6.4225 Manchester UK 116.6 150.0 116.6 98.3 96.7 -1.5926 Düsseldorf DE 59.4 56.5 87.1 86.7 90.6 4.4827 Zaragoza ES 3.5 3.8 42.1 70.9 71.6 0.9228 Stockholm / Arlanda SE 154.0 158.0 99.4 74.2 71.3 -3.9229 Warszawa / Okecie PL 44.6 31.1 57.1 62.5 64.2 2.7130 Budapest / Ferihegy HU 43.5 55.5 65.3 61.9 64.2 3.6631 Paris / Orly FR 107.3 80.0 53.7 63.8 63.7 -0.1132 Athinai / Eleftherios Venizelos EL 123.4 100.7 82.3 66.9 62.7 -6.2233 Toulouse / Blagnac FR 37.8 56.2 52.3 59.9 61.0 1.8334 Marseille / Provence FR 36.0 51.0 59.6 58.2 56.2 -3.5535 Maastricht-Aachen NL 44.3 54.6 62.0 52.5 54.0 2.8536 Riga LV 15.4 11.3 31.5 52.5 66.7937 Praha / Ruzyne CZ 51.6 58.2 52.9 51.9 -1.9738 Lyon / Saint Exupéry FR 27.4 38.7 35.2 37.2 45.4 22.0839 Belfast UK 30.9 51.3 43.9 44.8 44.0 -1.7140 Oostende BE 93.5 108.3 60.0 47.6 43.8 -7.98
Notes: Significant underreporting of paris airports. Data from airport websites (in italics) often include air cargo which in reality is transported by lorry. the figures from airport websites are therefore not always fully comparable with those collected by eurostat. the extraordinary growth rate for the leipzig airport in 2008 is mainly due to DHl moving its hub there during 2008.
(TAkE-Off + lANdiNg, PASSENgER ANd cARgO)
RAN
kiN
g (not including general aviation) 1 000 %
AIRPORT AND COUNTRY 2005 2010 2011 2012 2013 CHA
NG
E ‘1
2/’1
3
1 Paris / Charles de Gaulle FR 543.4 491.9 506.8 491.7 472.6 -3.9 2 London / Heathrow UK 472.0 449.2 476.3 471.5 469.6 -0.4 3 Frankfurt (Main) DE 475.6 456.0 480.9 475.5 465.7 -2.1 4 Amsterdam / Schiphol NL 408.2 390.4 425.2 427.5 430.1 0.6 5 München DE 382.3 368.2 399.4 387.9 368.4 -5.0 6 Madrid / Barajas ES 406.3 426.9 422.8 368.6 326.0 -11.6 7 Roma / Fiumicino IT 299.6 327.3 323.6 309.3 298.0 -3.6 8 Barcelona ES 294.3 268.5 293.6 281.6 267.7 -4.9 9 London / Gatwick UK 252.0 233.5 244.5 240.4 244.3 1.6
10 København / Kastrup DK 262.1 240.6 248.6 238.3 240.5 0.9 11 Paris / Orly FR 230.8 215.6 228.5 230.6 229.8 -0.3 12 Wien / Schwechat AT 227.0 242.3 243.4 242.3 228.9 -5.5 13 Stockholm / Arlanda SE 222.2 185.4 204.3 201.7 210.7 4.5 14 Düsseldorf DE 189.0 211.4 216.6 212.2 205.8 -3.0 15 Brussel-Bruxelles / Brussels BE 228.7 205.2 214.2 205.6 198.7 -3.4 16 Berlin / Tegel DE 137.2 150.5 161.3 163.7 168.5 2.9 17 Helsinki / Vantaa FI 163.1 169.9 191.8 169.8 165.8 -2.3 18 Dublin IE 169.6 156.4 160.0 158.6 162.0 2.1 19 Palma De Mallorca ES 170.5 165.2 172.1 166.1 161.7 -2.6 20 Manchester UK 218.0 148.9 158.0 160.5 161.1 0.4 21 Nice / Côte d'Azur FR 158.1 145.2 140.4 161.8 159.0 -1.7 22 Milano / Malpensa IT 222.2 187.8 183.5 167.6 157.9 -5.8 23 Lisboa PT 125.9 136.9 139.2 140.7 142.6 1.4 24 Warszawa / Okecie PL 131.0 133.0 136.5 134.6 138.4 2.8 25 Athinai / Eleftherios Venizelos EL 170.3 186.6 164.8 148.2 134.7 -9.1 26 London / Stansted UK 178.0 143.0 136.9 131.4 131.9 0.4 27 Hamburg DE 134.2 138.4 141.1 137.1 129.4 -5.6 28 Praha / Ruzyne CZ 150.2 147.9 142.6 124.5 121.5 -2.4 29 Stuttgart DE 135.0 111.7 124.0 121.6 117.5 -3.4 30 Lyon / Saint Exupéry FR 130.1 116.6 117.9 116.7 113.4 -2.8 31 Köln-Bonn DE 139.9 120.6 117.6 112.6 107.0 -4.9 32 Edinburgh UK 116.0 100.6 105.1 102.9 103.8 0.9 33 Aberdeen UK 89.5 88.0 94.8 98.8 99.9 1.1 34 Marseille / Provence FR 90.3 97.3 95.6 101.0 97.1 -3.8 35 Malaga ES 111.1 97.3 99.2 94.2 94.1 -0.1 36 Milano / Linate IT 93.1 91.5 93.8 95.5 90.6 -5.1 37 Las Palmas / Gran Canaria ES 98.4 93.2 101.6 90.8 86.1 -5.2 38 Birmingham UK 113.0 84.8 83.8 84.1 84.9 0.9 39 Toulouse / Blagnac FR 80.2 79.8 85.1 89.7 84.5 -5.8 40 Bucureşti / Henri Coandă RO 90.2 128.1 99.5 84.0 83.2 -1.0
Note: one movement per minute for 18 hours per day = 394 200 per year.

62 63
Titlesubtitle
Titlesubtitle
Source : EurostatSource : Eurostat
Sea: INWARD AND OUTWARD FLOW OF PASSENGERS BY COUNTRY
Sea: INWARD AND OUTWARD FLOW OF PASSENGERS BY COUNTRY
2.4 .7 2 .4 .7 TRANSPORT
PERFORMANCE OF FREIGHT AND PASSENGER TRANSPORT USING OTHER INDICATORS
TRANSPORT
PERFORMANCE OF FREIGHT AND PASSENGER TRANSPORT USING OTHER INDICATORS
iNwARdS1 000 PASSENGERS CRUISE PASSENGERS CRUISE PASSENGERS
excluding cruise passengers
starting and ending a cruise on excursion
2011 2012 2013 2011 2012 2013 2011 2012 2013
EU-28 200 465 192 418 193 449 5 939 6 860 6 773
BE 243 229 194 164 191 236
BG 0 0 0 0 0 1 17 23 29
CZ - - - - - - - - -
DK 20 562 20 302 20 302 216 216 438 438 438
DE 14 187 14 250 14 085 430 559 645
EE 5 905 6 186 6 432 3 8 8 436 425 509
IE 1 443 1 383 1 361 3 0 1 203 162 208
EL 39 307 36 250 36 254 258 211 234
ES 9 571 9 547 10 455 1 348 1 252 1 174 4 760 4 424 4 540
FR 12 539 11 991 12 493 240 390 392 1 630 2 031 2 263
HR 13 395 13 358 13 659 6 6 7 1 345 1 390 1 436
IT 38 566 35 485 34 107 2 239 2 934 2 458 2 509 3 993 4 869
CY 0 1 2 46 44 49 211 157 169
LV 389 408 432 64 84 68
LT 137 142 138 21 27 33
LU - - - - - - - - -
HU - - - - - - - - -
MT 4 263 4 224 4 537 56 46 51 446 519 382
NL 924 863 940
AT - - - - - - - - -
PL 1 252 1 176 1 089 1 0 0
PT 305 254 249 33 28 30 472
RO 27 30 49
SI 14 16 14 2 0 0 98 65 68
SK - - - - - - - - -
FI 9 079 9 202 9 309 15 1 2 364 368 425
SE 15 255 14 892 14 701 44 48 42 499 524 527
UK 13 129 12 259 12 696 834 925 1 006
IS
NO 2 691 2 736 2 790 203 208 264 814 986 1 072
TR 749 726 789 194 184 230
OUTwARdS1 000 PASSENGERS CRUISE PASSENGERS
excluding cruise passengers starting and ending a cruise
2011 2012 2013 2011 2012 2013
EU-28 200 301 191 812 193 102 6 039 6 858 6 663
BE 254 237 197 164 193 232
BG 0 1 1 1
CZ - - - - - -
DK 20 530 20 228 20 228 219 219
DE 14 186 14 114 14 497 430 558 622
EE 5 935 6 252 6 468 4 8 8
IE 1 458 1 374 1 383 2 0 1
EL 39 269 36 218 36 218 349 220 212
ES 9 616 9 618 10 457 1 333 1 211 1 167
FR 12 535 12 022 12 357 238 413 394
HR 13 540 13 333 13 681 6 8 8
IT 38 808 35 413 33 830 2 282 2 903 2 842
CY 0 0 0 46 46 49
LV 397 418 441
LT 144 145 142
LU - - - - - -
HU - - - - - -
MT 4 246 4 219 4 532 56 46 51
NL 846 843 833
AT - - - - - -
PL 1 274 1 183 1 112 1 0 0
PT 305 254 249 34 29 28
RO
SI 17 18 14 3
SK - - - - - -
FI 8 965 9 059 9 211 15 2 2
SE 14 779 14 483 14 382 15 49 21
UK 13 198 12 382 12 870 841 951 1 026
IS
NO 3 085 3 027 2 912 151 32 9
TR 697 726 790 202 193 248

64 65
Titlesubtitle
Titlesubtitle
Source : EurostatSource : Eurostat
2.4 .9 2 .4 .8
Sea: FREIGHT TRAFFIC AT MAJOR EU SEAPORTS
Sea: PASSENGER TRAFFIC AT MAJOR EU SEAPORTS
TRANSPORT
PERFORMANCE OF FREIGHT AND PASSENGER TRANSPORT USING OTHER INDICATORS
TRANSPORT
PERFORMANCE OF FREIGHT AND PASSENGER TRANSPORT USING OTHER INDICATORS
PASSENgERS EmbARkEd ANd diSEmbARkEd
RAN
kiN
g 1 000 %
PORT, COUNTRY 2000 2005 2010 2012 2013 CHA
NG
E ‘1
2/’1
3
1 Dover UK 16 197 13 501 13 361 12 076 12 938 7.1
2 Helsinki FI 9 251 8 854 9 849 10 637 10 756 1.1
3 Paloukia Salaminas EL 11 663 12 705 11 430 10 724 -6.2
Perama EL 11 663 12 705 11 430 10 724 -6.2
5 Calais FR 15 066 11 695 10 237 9 345 10 372 11.0
6 Stockholm SE 7 746 8 211 9 147 9 108 8 889 -2.4
7 Tallinn EE 6 701 7 523 8 417 8 727 3.7
8 Helsingør (Elsinore) DK 13 322 11 023 8 534 7 822 7 822 0.0
9 Helsingborg SE 13 525 11 102 8 540 7 841 7 763 -1.0
10 Piraeus EL 7 289 11 076 9 598 7 924 7 704 -2.8
11 Napoli IT 6 748 6 084 8 356 7 964 7 360 -7.6
12 Messina IT 11 898 9 802 10 765 8 126 7 256 -10.7
13 Reggio Calabria IT 11 839 9 645 9 891 7 760 6 758 -12.9
14 Capri IT 5 404 3 860 6 517 6 744 6 488 -3.8
15 Rødby (Færgehavn) DK 5 430 6 761 6 261 6 000 6 000 0.0
16 Puttgarden DE 5 430 6 760 6 261 5 963 5 944 -0.3
17 Algeciras ES 4 828 4 663 4 849 5 218 7.6
18 Palma Mallorca ES 1 864 4 611 4 496 4 292 4 756 10.8
19 Santa Cruz de Tenerife ES 4 927 4 564 3 807 3 923 4 523 15.3
20 Cirkewwa MT 3 463 4 031 4 093 4 395 7.4
Mgarr, Gozo MT 3 463 4 031 4 093 4 395 7.4
22 Split HR 1 952 3 267 3 523 3 769 3 807 1.0
23 Piombino IT 3 161 3 277 3 477 3 618 3 532 -2.4
24 Turku FI 3 514 3 697 3 498 3 224 3 452 7.1
25 Mariehamn FI 1 885 3 192 3 302 3 191 3 011 -5.6
26 Portoferraio IT 2 641 2 829 2 769 2 981 2 839 -4.8
27 Civitavecchia IT 2 241 2 099 2 440 2 376 2 524 6.2
28 Igoumenitsa EL 933 2 338 2 726 2 262 2 471 9.2
29 Olbia IT 2 359 3 253 3 863 2 514 2 458 -2.2
30 Norddeich DE 2 253 2 257 2 287 2 437 2 410 -1.1
31 Norderney I. DE 2 015 1 990 2 093 2 309 2 408 4.3
32 Barcelona ES 1 424 2 208 2 358 2 310 2 373 2.7
33 Genova IT 2 444 2 406 2 991 2 501 2 358 -5.7
34 Dunkerque FR 96 813 2 533 2 499 2 302 -7.9
35 Rostock DE 1 767 2 417 2 195 2 344 2 300 -1.9
36 Hirtshals DK 1 855 1 959 2 178 2 246 2 246 0.0
37 Bastia FR 1 916 2 028 2 524 2 173 2 162 -0.5
38 Antirio EL 2 414 1 725 2 115 2 139 1.1
Rio EL 2 414 1 725 2 115 2 139 1.1
40 Zadar - passenger port HR 1 376 1 924 2 145 2 144 2 136 -0.4
TONNES lOAdEd ANd UNlOAdEd
RAN
kiN
g milliON %
PORT, COUNTRY 2000 2005 2010 2012 2013 CHA
NG
E ‘1
2/’1
3
1 Rotterdam NL 302.545 345.819 395.763 405.260 406.549 0.3
2 Antwerpen BE 116.003 145.835 160.012 164.547 171.984 4.5
3 Hamburg DE 76.950 108.253 104.520 113.531 120.568 6.2
4 Amsterdam NL 42.044 47.133 72.702 69.606 93.204 33.9
5 Marseille FR 91.279 93.308 82.427 81.846 76.248 -6.8
6 Algeciras ES 55.184 58.565 74.613 73.822 -1.1
7 Le Havre FR 63.885 70.801 65.771 59.246 64.395 8.7
8 Immingham UK 52.501 60.686 54.029 60.091 62.614 4.2
9 Bremerhaven DE 24.835 33.728 45.943 58.250 54.506 -6.4
10 Valencia ES 21.958 34.990 53.075 54.217 53.470 -1.4
11 Trieste IT 44.015 43.355 40.557 42.144 45.986 9.1
12 London UK 47.892 53.843 48.062 43.742 43.205 -1.2
13 Milford Haven UK 33.768 37.547 42.788 39.832 41.105 3.2
14 Genova IT 43.797 42.640 41.428 42.453 40.830 -3.8
15 Piraeus EL 16.513 18.688 13.058 35.218 40.192 14.1
16 Göteborg SE 33.261 36.479 42.938 41.148 38.380 -6.7
17 Tees & Hartlepool UK 51.472 55.790 35.697 33.967 37.641 10.8
18 Dunkerque FR 44.318 48.503 36.309 40.363 36.634 -9.2
19 Southampton UK 34.773 39.947 39.365 38.107 35.797 -6.1
20 Constanta RO 44.377 30.396 31.938 35.650 11.6
21 Sines PT 19.957 24.929 24.728 27.423 34.600 26.2
22 Barcelona ES 25.787 37.061 35.326 34.342 34.372 0.1
23 Riga LV 24.421 29.057 34.848 34.040 -2.3
24 Liverpool UK 30.421 33.775 30.020 32.924 31.149 -5.4
25 Klaipeda LT 20.019 28.851 32.514 30.790 -5.3
26 Cartagena ES 17.157 26.716 19.044 29.969 29.211 -2.5
27 Bilbao ES 26.623 32.219 32.440 27.406 28.063 2.4
28 Tallinn EE 38.816 36.264 29.151 28.012 -3.9
29 Tarragona ES 27.175 30.967 32.071 32.694 27.644 -15.4
30 Nantes Saint-Nazaire FR 31.263 34.043 30.582 29.228 27.561 -5.7
31 Gioia Tauro IT 21.638 29.634 35.371 27.399 27.447 0.2
32 Zeebrugge BE 32.660 28.442 33.878 28.908 27.355 -5.4
33 Gdansk PL 22.478 26.421 24.379 27.335 12.1
34 Ventspils LV 29.358 23.825 29.118 26.927 -7.5
35 Forth UK 41.143 34.218 34.335 25.332 26.365 4.1
36 Huelva ES 17.224 20.931 22.122 28.451 26.314 -7.5
37 Felixstowe UK 29.686 23.144 25.756 26.268 26.214 -0.2
38 Gent (Ghent) BE 24.717 22.133 27.572 25.972 25.924 -0.2
39 Dover UK 17.434 21.145 24.093 22.902 25.295 10.4
40 Porto Foxi IT 23.751 22.760 23.935 24.635 24.797 0.7
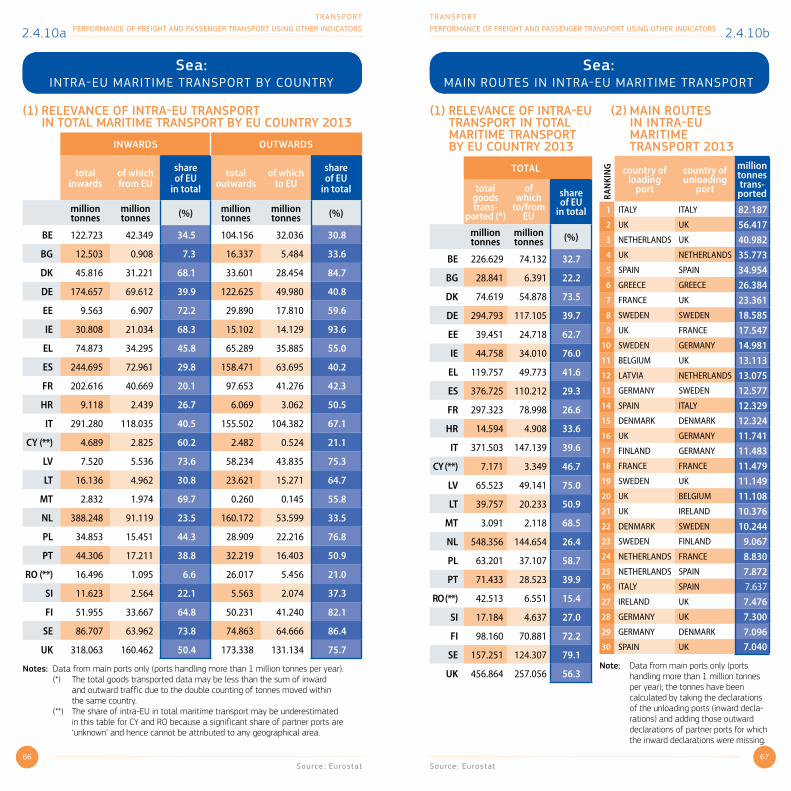
66 67
Titlesubtitle
Titlesubtitle
Source : EurostatSource : Eurostat
Sea: MAIN ROUTES IN INTRA-EU MARITIME TRANSPORT
Sea: INTRA-EU MARITIME TRANSPORT BY COUNTRY
2.4.10b2.4.10a
(1) RElEvANcE Of iNTRA-EU TRANSPORT iN TOTAl mARiTimE TRANSPORT by EU cOUNTRy 2013
iNwARdS OUTwARdS
total inwards
of which from EU
share of EU
in total
total outwards
of which to EU
share of EU
in total
million tonnes
million tonnes (%) million
tonnesmillion tonnes (%)
BE 122.723 42.349 34.5 104.156 32.036 30.8
BG 12.503 0.908 7.3 16.337 5.484 33.6
DK 45.816 31.221 68.1 33.601 28.454 84.7
DE 174.657 69.612 39.9 122.625 49.980 40.8
EE 9.563 6.907 72.2 29.890 17.810 59.6
IE 30.808 21.034 68.3 15.102 14.129 93.6
EL 74.873 34.295 45.8 65.289 35.885 55.0
ES 244.695 72.961 29.8 158.471 63.695 40.2
FR 202.616 40.669 20.1 97.653 41.276 42.3
HR 9.118 2.439 26.7 6.069 3.062 50.5
IT 291.280 118.035 40.5 155.502 104.382 67.1
CY (**) 4.689 2.825 60.2 2.482 0.524 21.1
LV 7.520 5.536 73.6 58.234 43.835 75.3
LT 16.136 4.962 30.8 23.621 15.271 64.7
MT 2.832 1.974 69.7 0.260 0.145 55.8
NL 388.248 91.119 23.5 160.172 53.599 33.5
PL 34.853 15.451 44.3 28.909 22.216 76.8
PT 44.306 17.211 38.8 32.219 16.403 50.9
RO (**) 16.496 1.095 6.6 26.017 5.456 21.0
SI 11.623 2.564 22.1 5.563 2.074 37.3
FI 51.955 33.667 64.8 50.231 41.240 82.1
SE 86.707 63.962 73.8 74.863 64.666 86.4
UK 318.063 160.462 50.4 173.338 131.134 75.7
Notes: Data from main ports only (ports handling more than 1 million tonnes per year). (*) the total goods transported data may be less than the sum of inward
and outward traffic due to the double counting of tonnes moved within the same country. (**) the share of intra-eU in total maritime transport may be underestimated in this table for cY and Ro because a significant share of partner ports are
‘unknown’ and hence cannot be attributed to any geographical area.
(1) RElEvANcE Of iNTRA-EU TRANSPORT iN TOTAl mARiTimE TRANSPORT by EU cOUNTRy 2013
TOTAl
total goods trans-
ported (*)
of which
to/from EU
share of EU
in total
million tonnes
million tonnes (%)
BE 226.629 74.132 32.7
BG 28.841 6.391 22.2
DK 74.619 54.878 73.5
DE 294.793 117.105 39.7
EE 39.451 24.718 62.7
IE 44.758 34.010 76.0
EL 119.757 49.773 41.6
ES 376.725 110.212 29.3
FR 297.323 78.998 26.6
HR 14.594 4.908 33.6
IT 371.503 147.139 39.6
CY (**) 7.171 3.349 46.7
LV 65.523 49.141 75.0
LT 39.757 20.233 50.9
MT 3.091 2.118 68.5
NL 548.356 144.654 26.4
PL 63.201 37.107 58.7
PT 71.433 28.523 39.9
RO (**) 42.513 6.551 15.4
SI 17.184 4.637 27.0
FI 98.160 70.881 72.2
SE 157.251 124.307 79.1
UK 456.864 257.056 56.3
(2) mAiN ROUTES iN iNTRA-EU mARiTimE TRANSPORT 2013
RAN
KIN
G country of loading
port
country of unloading
port
million tonnes trans-
ported
1 ITALY ITALY 82.1872 UK UK 56.4173 NETHERLANDS UK 40.9824 UK NETHERLANDS 35.7735 SPAIN SPAIN 34.9546 GREECE GREECE 26.3847 FRANCE UK 23.3618 SWEDEN SWEDEN 18.5859 UK FRANCE 17.547
10 SWEDEN GERMANY 14.98111 BELGIUM UK 13.11312 LATVIA NETHERLANDS 13.07513 GERMANY SWEDEN 12.57714 SPAIN ITALY 12.32915 DENMARK DENMARK 12.32416 UK GERMANY 11.74117 FINLAND GERMANY 11.48318 FRANCE FRANCE 11.47919 SWEDEN UK 11.14920 UK BELGIUM 11.10821 UK IRELAND 10.37622 DENMARK SWEDEN 10.24423 SWEDEN FINLAND 9.06724 NETHERLANDS FRANCE 8.83025 NETHERLANDS SPAIN 7.87226 ITALY SPAIN 7.63727 IRELAND UK 7.47628 GERMANY UK 7.30029 GERMANY DENMARK 7.09630 SPAIN UK 7.040
Note: Data from main ports only (ports handling more than 1 million tonnes per year); the tonnes have been calculated by taking the declarations of the unloading ports (inward decla-rations) and adding those outward declarations of partner ports for which the inward declarations were missing.
TRANSPORT
PERFORMANCE OF FREIGHT AND PASSENGER TRANSPORT USING OTHER INDICATORS
TRANSPORT
PERFORMANCE OF FREIGHT AND PASSENGER TRANSPORT USING OTHER INDICATORS

68 69
Titlesubtitle
Titlesubtitle
Source : Internat ional Union of Combined Road-Rai l Transport CompaniesSource : Eurostat
combined Transport TrafficSea: CONTAINER TRAFFIC AT MAJOR EU SEAPORTS
RAN
kiN
g 1 000 TEU %
PORT, COUNTRY 2005 2010 2012 2013 CHA
NG
E '1
2/'1
3
1 Rotterdam NL 9 194.6 11 017.5 10 938.5 10 937.7 0.0
2 Hamburg DE 8 084.3 7 905.5 8 890.7 9 302.2 4.6
3 Antwerpen BE 6 220.9 8 144.4 8 174.4 8 255.6 1.0
4 Bremerhaven DE 3 696.1 4 858.3 6 111.2 5 822.4 -4.7
5 Valencia ES 2 415.2 4 211.2 4 470.5 4 339.0 -2.9
6 Algeciras ES 3 183.9 2 776.9 4 098.7 4 331.9 5.7
7 Gioia Tauro IT 3 123.2 3 896.7 3 725.2 3 651.8 -2.0
8 Felixstowe UK 2 759.7 3 415.1 3 367.7 3 433.8 2.0
9 Piraeus EL 1 401.1 850.3 2 815.1 3 199.3 13.7
10 Le Havre FR 2 144.3 2 369.3 2 114.8 2 299.2 8.7
11 Barcelona ES 2 071.4 1 928.0 1 745.4 1 696.9 -2.8
12 Genova IT 1 037.6 1 020.0 1 577.6 1 545.7 -2.0
13 Southampton UK 1 384.2 1 566.5 1 489.3 1 489.2 0.0
14 La Spezia IT 915.6 1 180.6 1 180.8 1 206.7 2.2
15 Marseille FR 910.6 1 030.9 1 155.3 1 204.8 4.3
16 Gdansk PL 63.3 509.9 933.4 1 189.0 27.4
17 Las Palmas ES 1 222.4 1 118.0 1 194.3 1 002.0 -16.1
18 London UK 765.1 732.7 686.7 944.4 37.5
19 Sines PT 51.0 382.1 553.1 931.0 68.3
20 Zeebrugge BE 682.3 1 436.8 930.1 879.6 -5.4
21 Göteborg SE 771.7 891.5 921.8 867.7 -5.9
22 Gdynia PL 392.9 477.0 658.7 727.8 10.5
23 Constanta RO 867.0 548.1 675.4 659.4 -2.4
24 Liverpool UK 613.1 662.0 635.3 626.8 -1.3
25 Leixões PT 351.8 481.8 632.8 620.0 -2.0
26 Cagliari IT 583.7 486.6 580.2 619.0 6.7
27 Bilbao ES 862.9 532.0 610.0 605.5 -0.7
28 Koper SI 210.3 481.0 556.4 596.4 7.2
29 Lisboa PT 512.2 512.0 486.5 550.5 13.1
30 Hamina-Kotka FI 376.5 402.4 531.8 546.1 2.7
31 Dublin IE 590.2 554.0 526.7 515.8 -2.1
32 Livorno IT 461.4 369.9 412.4 513.1 24.4
33 Trieste IT 182.7 261.1 427.1 438.2 2.6
34 Århus DK 397.2 446.3 404.3 405.8 0.4
35 Dunkerque FR 201.6 200.8 353.5 404.7 14.5
36 Klaipeda LT 214.3 295.2 381.4 402.7 5.6
37 Riga LV 157.8 254.6 362.3 381.0 5.2
38 Thessaloniki EL 372.5 289.2 359.3 379.0 5.5
39 Helsinki FI 460.2 400.7 361.0 364.8 1.1
40 Venezia IT 196.0 237.7 272.8 346.1 26.9
Notes: in 2011 the ports of Hamina and kotka merged into a single legal entity. older values refer to kotka only.
UiRR cOmPANiESTONNE-kilOmETRES
% of which:
YEAR Billion < 300 km 300 - 900 km > 900 km
1990 18.7 1 % 68 % 31 %
1995 25.0 2 % 56 % 42 %
2000 35.2 2 % 71 % 27 %
2005 38.8 3 % 63 % 34 %
2006 45.4 3 % 53 % 44 %
2007 46.1 3 % 56 % 41 %
2008 46.0 3 % 52 % 45 %
2009 38.9 4 % 52 % 44 %
2010 42.4 5 % 58 % 37 %
2011 42.6 7 % 56 % 37 %
2012 39.1 3 % 59 % 38 %
2013 40.7 2 % 60 % 38 %
TRAffic % Of cONSigNmENTS (*)
YEAR Semi-trailersRolling
motorway Swap bodies
1990 20 % 18 % 61 %
1995 14 % 19 % 67 %
2000 9 % 23 % 68 %
2005 7 % 13 % 80 %
2006 7 % 14 % 79 %
2007 7 % 13 % 79 %
2008 8 % 14 % 77 %
2009 8 % 15 % 77 %
2010 10 % 15 % 75 %
2011 10 % 14 % 76 %
2012 13 % 5 % 82 %
2013 14 % 5 % 81 %
Notes: (*) Consignment = equivalent to 2.0 teU, meaning: - one semi-trailer; - two swap bodies less than 8.30 m and under 16 t; - one swap body more than 8.30 m or over 16 t; - one vehicle on the rolling motorway.
2 .4 .12 2 .4 .11 TRANSPORT
PERFORMANCE OF FREIGHT AND PASSENGER TRANSPORT USING OTHER INDICATORS
TRANSPORT
PERFORMANCE OF FREIGHT AND PASSENGER TRANSPORT USING OTHER INDICATORS

70 71
Titlesubtitle
Titlesubtitle
2.4 .14 2 .4 .13
Sources : Observator io h ispano-francés de Tráf ico en los P i r ineos , Spain and own est imates ( in i ta l ics)
Sources : Swiss Department of the Environment , Transport , Energy and Communicat ions (UVEK)
Road: PYRENEES CROSSING TRAFFIC
Road: ALPS CROSSING FREIGHT TRAFFIC
AlPiNE ARc: mONTgENèvRE TO bRENNERmilliON TONNES
Switzerland Austria France
TOTAL
St. Gotthard SimplonGr. St. BernardSt. Bernardino
Brenner Reschen
Montgenèvre Fréjus
Mont-Blanc
1985 1.9 0.8 15.0 12.3 30.01990 3.1 1.1 14.6 21.8 40.61995 5.5 1.1 21.0 25.8 53.42000 7.6 1.3 26.6 27.2 62.72001 7.4 3.0 26.3 27.2 63.92002 7.5 3.0 27.3 26.3 64.12003 9.2 2.4 28.7 25.8 66.12004 9.9 2.6 33.5 22.3 68.32005 10.2 2.8 33.6 20.8 67.42006 10.0 2.9 36.1 22.3 71.32007 10.9 3.3 36.4 22.4 73.02008 10.8 3.3 35.1 21.5 70.72009 10.2 3.2 27.0 18.5 58.92010 10.8 3.5 28.7 20.2 63.22011 10.6 3.8 29.3 20.7 64.42012 10.0 3.6 30.5 19.5 63.62013 9.5 3.5 30.1 18.8 61.9
AvERAgE ANNUAl cHANgE'85/'00 9.7 % 3.3 % 3.9 % 5.4 % 5.0 %'00/'13 1.7 % 7.9 % 0.9 % - 2.8 % - 0.1 %'12/'13 - 5.2 % - 2.7 % - 1.4 % - 3.3 % - 2.7 %
Note: France: Montgenèvre: from 1999 onwards.
NUmbER Of HEAvy gOOdS vEHiclES (1 000)Switzerland Austria France
TOTAL
St. Gotthard SimplonGr. St. BernardSt. Bernardino
Brenner Reschen
Montgenèvre Fréjus
Mont-Blanc
1999 1 101 216 1 639 1 674 4 6302000 1 187 217 1 653 1 672 4 7292005 925 279 2 121 1 435 4 7602006 856 326 2 268 1 529 4 9792007 963 299 2 277 1 531 5 0702008 973 302 2 200 1 474 4 9492009 900 280 1 842 1 253 4 2752010 943 313 1 947 1 356 4 5592011 927 332 1 980 1 389 4 6282012 886 322 2 058 1 307 4 5732013 837 307 2 026 1 264 4 433
Note: internal, import, export and transit traffic.
gOOdS TRAfficvEHiclES PER dAy
West coast Irun
Biriatou
East coast La JonqueraLe Perthus
Other crossings TOTAL
1997 5 657 6 729 880 13 266
1998 6 447 7 413 905 14 765
1999 6 914 8 018 914 15 846
2000 8 224 8 200 1 519 17 943
2001 8 806 8 050 1 172 18 028
2002 8 864 8 535 1 505 18 904
2003 9 276 8 920 1 758 19 954
2004 10 655 9 302 1 875 21 832
2005 9 970 9 243 1 825 21 038
2006 10 390 9 602 1 939 21 931
2008 10 670 9 484 1 334 21 488
2009 9 712 8 610 1 367 19 688
2011 9 414 8 945 1 044 19 402
2013 9 165 9 163 1 050 19 377
PASSENgER cAR TRAfficvEHiclES PER dAy
West coastIrun
Biriatou
East coastLa JonqueraLe Perthus
Other crossings TOTAL
1997 30 200 19 400 27 800 77 400
1998 30 230 20 601 33 168 83 999
1999 33 188 20 678 33 412 87 278
2000 40 923 24 390 31 962 97 275
2001 41 847 25 201 34 096 101 144
2002 41 812 28 544 37 654 108 010
2003 44 165 29 201 41 267 114 633
2004 45 041 30 923 41 196 117 160
2005 47 142 31 896 42 465 121 503
2006 47 172 32 180 43 228 122 580
2008 47 266 30 847 41 924 120 037
2009 47 907 31 465 42 452 121 823
2011 48 787 30 900 40 508 120 194
2013 47 110 30 529 38 612 116 250
Note: Since 2006, these statistics are available every two years.
TRANSPORT
PERFORMANCE OF FREIGHT AND PASSENGER TRANSPORT USING OTHER INDICATORS
TRANSPORT
PERFORMANCE OF FREIGHT AND PASSENGER TRANSPORT USING OTHER INDICATORS

72 73
Titlesubtitle
Source : DG MOVE Rai l Market Monitor ing , est imates ( in i ta l ics)Source : DG MOVE Rai l Market Monitor ing
Rail: DEGREE OF MARKET OPENING – FREIGHT
2.4.15b 2.4.15a
Rail: DEGREE OF MARKET OPENING – PASSENGERS
SHARE Of All bUT THE PRiNciPAl UNdERTAkiNgS%
2006 2008 2010 2012 2013BE 0.00 0.00 0.20 0.60 0.00
BG 0.00 0.00 2.60 0.00 0.00
CZ 0.00 0.24 2.94 5.13
DK 9.00 18.00 10.00 11.00
DE 3.80 10.10 8.00 10.00 11.50
EE 40.00 57.70 50.00 56.00 43.40
IE 0.00 0.00 0.00 0.00 0.00
EL 0.00 0.00 0.00 0.00
ES 0.00 0.00 0.00 0.00
FR 0.00 1.00
HR 0.00
IT 9.80 8.30 8.30
CY - - - - -
LV 10.10 9.08 10.54 11.70 12.30
LT 0.00 0.00 0.00 0.00 0.00
LU 0.00
HU 1.40 1.80 1.80 2.90 3.30
MT - - - - -
NL 1.90 2.00 4.80 5.00
AT 6.50 5.40 5.70
PL 9.17 36.80 48.31 51.40 57.82
PT 9.00 9.00 5.90
RO 0.53 1.10 3.93 20.61 9.60
SI 0.00 0.00 0.01 0.00 0.00
SK 0.00 0.03 0.03 3.38 3.85
FI 0.00 0.00 0.00 0.00 0.00
SE 19.00 36.00
UK 89.50 89.90 90.20 89.70
NO 12.00 12.00 10.00 10.00
Note: total market share of all but the principal railway undertakings (as a percentage of passenger-km). RO: 2013 value based on train-km.
SHARE Of All bUT THE PRiNciPAl UNdERTAkiNgS%
2006 2008 2010 2012 2013BE 0.03 6.10 11.82 13.39 18.54
BG 3.18 14.32 21.60 36.50 44.70
CZ 13.16 13.66 23.67
DK 25.00 27.00 25.00
DE 16.40 22.00 25.00 28.60 32.60
EE 30.60 49.00 45.00 30.00 35.00
IE 0.00 0.00 0.00 0.00 0.00
EL 0.00 0.00
ES 4.90 5.00 8.08 16.75 19.05
FR 0.60 10.00 20.00 32.00 36.00
HR 0.00
IT 11.50 24.10 24.10
CY - - - - -
LV 10.60 9.57 23.30 22.60 23.30
LT 0.00 0.00 0.00 0.00 0.00
LU 0.00 0.00 0.00
HU 9.00 14.40 19.47 31.80 34.80
MT - - - - -
NL 14.00 25.00 40.00 36.00 41.40
AT 10.00 14.00 14.60 17.60
PL 16.90 23.97 35.82 32.93 41.15
PT 0.00 9.00 13.40
RO 26.70 40.99 54.70 53.68 57.60
SI 0.00 0.00 0.00 9.50 9.19
SK 2.90 2.00 2.03 11.76 13.47
FI 0.00 0.00 0.00 0.00 0.00
SE 32.50 40.00 56.00
UK 44.20 51.40 53.60 54.50
NO 21.00 25.00 38.00 42.00
Note: total market share of all but the principal railway undertakings (as a percentage of tonnes-km).
TRANSPORT
PERFORMANCE OF FREIGHT AND PASSENGER TRANSPORT USING OTHER INDICATORS
TRANSPORT
PERFORMANCE OF FREIGHT AND PASSENGER TRANSPORT USING OTHER INDICATORS

74 75
Titlesubtitle
Sources : Eurotunnel , est imates ( in i ta l ics)
UNiTEd kiNgdOm – fRANcESHUTTlE
Vehicles PassengersPASSENGER FREIGHT (1)
cars (1 000) coaches (1 000) 1 000 million1995 1 223 23.0 391 4.2 2000 2 784 79.5 1 133 10.1 2001 2 530 75.5 1 198 9.3 2002 2 336 71.9 1 231 8.7 2003 2 279 71.9 1 285 8.5 2004 2 101 63.5 1 281 7.8 2005 2 047 77.3 1 309 8.2 2006 2 022 67.2 1 296 7.8 2007 2 142 65.3 1 415 7.9 2008 1 907 55.8 1 254 7.0 2009 1 917 54.5 769 6.9 2010 2 125 56.5 1 089 7.5 2011 2 263 56.1 1 263 9.3 2012 2 424 59.0 1 465 10.0 2013 2 481 64.5 1 363 10.3 2014 2 572 63.1 1 440 10.6
THROUgH-TRAiNPASSENGER FREIGHT
million 1 000 tonnes1995 2.920 1 4112000 7.130 2 9472001 6.947 2 4472002 6.603 1 4642003 6.315 1 7442004 7.277 1 8992005 7.454 1 5882006 7.858 1 5692007 8.261 1 2142008 9.113 1 2392009 9.220 1 1812010 9.529 1 1282011 9.680 1 3252012 9.912 1 2272013 10.133 1 3602014 10.398 1 650
Notes: the channel tunnel opened in 1994. (1) From 2000 to 2005, estimates based on 2.52 passengers per car and 38.75 passengers per coach.
Rail: CHANNEL TUNNEL TRAFFIC
2.4 .17
Rail: ALPS AND PYRENEES CROSSING FREIGHT TRAFFIC
2.4 .16
AlPS cROSSiNg fREigHT TRAffic (*)Alpine Arc: mont-cenis to brenner milliON TONNES
Switzerland Austria FranceTOTALSt. Gotthard Simplon Brenner Mont-Cenis
1985 11.2 2.8 4.7 7.5 26.21990 13.6 4.3 5.5 7.2 30.61995 13.6 4.4 8.4 8.0 34.42000 16.8 3.8 8.7 8.6 37.92001 15.8 4.8 10.7 8.6 39.92002 14.2 4.8 10.5 8.6 38.12003 14.3 5.6 10.7 7.8 38.42004 16.1 6.8 10.7 6.4 40.02005 15.6 8.1 10.0 5.2 38.92006 16.2 9.0 11.6 4.8 41.62007 15.5 9.7 13.3 5.7 44.22008 15.5 9.9 14.0 4.6 44.02009 11.6 9.2 13.1 2.4 36.32010 14.4 9.6 14.4 3.0 41.42011 14.4 11.3 14.1 3.4 43.22012 13.9 9.8 11.2 3.4 38.32013 15.0 10.1 11.7 3.2 40.1
AvERAgE ANNUAl cHANgE'85/'00 2.7 % 2.1 % 4.2 % 0.9 % 2.5 %'00/'13 - 0.8 % 7.8 % 2.3 % - 7.2 % 0.4 %'12/'13 8.2 % 3.4 % 4.5 % - 4.6 % 4.8 %
PyRENEES cROSSiNg fREigHT TRAffic (**)Spain – france milliON TONNES
West coast East coast Total pure rail
Intermodal rail
Hendaye – Irun Cerbère / Port Bou
1995 1.333 2.220 3.553 1.9702000 1.800 2.800 4.583 2.9952001 1.800 2.400 4.188 2.7392002 1.739 2.413 4.161 3.0332003 1.766 2.518 4.284 2.8412004 1.900 2.663 4.563 3.0502005 1.833 2.670 4.503 3.0742006 1.866 2.605 4.471 3.3662007 1.586 2.114 3.700 1.5752008 1.251 1.877 3.128 1.4432009 0.934 1.751 2.685 1.1812010 2.511 1.1712011 2.843 1.4372012 2.868 1.5622013 3.336 1.758
Sources: (*) Swiss Department of the Environment, Transport, Energy and Communications (UVEK) (**) Observatorio hispano-francés de Trafico en los Pirineos, Spain, estimates (in italics)
TRANSPORT
PERFORMANCE OF FREIGHT AND PASSENGER TRANSPORT USING OTHER INDICATORS
TRANSPORT
PERFORMANCE OF FREIGHT AND PASSENGER TRANSPORT USING OTHER INDICATORS

76 77Sources : Eurostat , Internat ional Road Federat ion , nat ional stat ist ics , est imates ( in i ta l ics)
Sources: Eurostat, International Road Federation, United Nations Economic Commis-sion for Europe, ASECAP statistical bulletin, national statistics, estimates (in italics)
km (at end of 2012)
MotorwaysMain or
national roadsSecondary or
regional roads Other roads (*)
BE 1 763 13 229 1 349 138 869BG 541 2 975 4 035 12 051CZ 751 6 250 48 715 74 919DK 1 195 2 596 70 318DE 12 879 39 604 178 034EE 124 3 887 12 458 42 299IE 900 4 513 11 631 78 958
EL 1 659 9 299 30 864 75 600ES 14 701 15 110 135 784 501 053FR 11 465 9 784 377 965 666 343HR 1 254 6 581 9 809 9 046
IT 6 726 19 861 153 588 73 555CY 257 2 203 2 307 4 998LV - 1 669 5 318 61 302LT 309 6 366 14 567 51 055LU 152 837 1 891
HU 1 515 6 386 23 341 170 429MT - 2 361NL 2 666 2 525 7 778 125 230AT 1 719 9 997 23 640 88 759PL 1 365 17 817 154 202 238 651PT 2 988 6 505 4 791RO 550 16 690 35 374 31 639
SI 769 820 5 149 32 247SK 419 3 546 14 051 36 852FI 810 12 522 13 565 51 213
SE 2 013 13 507 82 988 117 974UK 3 756 49 038 122 966 245 189AL
ME - 7 905MK 259 911 3 772 9 355RS 603 4 856 9 863 29 278TR 2 127 31 375 31 880 320 366IS 11 4 919 2 950 5 010
NO 392 10 581 44 317 38 970CH 1 419 390 18 013 51 697
Notes: (*) the definition of road types varies from country to country, the data are therefore not comparable. ‘other roads’ sometimes includes roads without a hard surface.
BE end of 2009, EL end of 2010, UK 1st of april 2013, IS end of 2011.
Road: LENGTH OF ROAD NETWORK
2.5 .2 TRANSPORT
INFRASTRUCTURE
TRANSPORT
2.5 INFRASTRUCTURE
Road: LENGTH OF MOTORWAYS
2.5 .1
km (at end of year)
1990 1995 2000 2005 2010 2011 2012EU-28 42 207 48 297 55 116 63 140 71 192 71 902 73 246
BE 1 666 1 666 1 702 1 747 1 763 1 763 1 763BG 273 277 319 331 437 458 541CZ 357 414 501 564 734 745 751DK 611 796 923 1 032 1 130 1 143 1 195DE 10 854 11 190 11 712 12 363 12 819 12 845 12 879EE 41 65 93 99 115 115 124IE 26 70 103 247 900 900 900
EL 190 421 615 917 1 659 1 659 1 659ES 4 976 6 962 9 049 11 432 14 262 14 554 14 701FR 6 824 8 275 9 766 10 798 11 392 11 412 11 465HR 291 302 411 1 016 1 244 1 254 1 254
IT 6 193 6 435 6 478 6 542 6 668 6 668 6 726CY 120 167 257 276 257 257 257LV - - - - - - -LT 421 394 417 417 309 309 309LU 78 123 114 147 152 152 152
HU 267 335 448 859 1 477 1 516 1 515MT - - - - - - -NL 2 092 2 208 2 265 2 600 2 651 2 658 2 666AT 1 445 1 596 1 633 1 677 1 719 1 719 1 719PL 257 246 358 552 857 1 070 1 365PT 316 687 1 482 2 341 2 737 2 737 2 988RO 113 113 113 228 332 350 550
SI 228 293 427 569 771 768 769SK 192 198 296 328 416 419 419FI 225 394 549 693 779 779 810
SE 939 1 262 1 499 1 700 1 927 1 920 2 013UK 3 212 3 408 3 586 3 665 3 686 3 733 3 756AL
ME - - - - - - -MK 83 216 251 259 259RS 603 603 603 603TR 281 1 667 2 080 2 119 2 127IS - - - 11 11 11 11
NO 73 107 144 264 381 393 392CH 1 148 1 197 1 270 1 358 1 406 1 415 1 419
Notes: ES: ‘autopistas de peaje’ and ‘autovías y autopistas libres’. CY: from 2006: without urban M-ways. NL: all national roads (‘Rijkswegen’) with dual carriageways.
UK: data refers to the 1st of april of the next year.

78 79
Titlesubtitle
Titlesubtitle
Railways: LENGTH OF LINES IN USE
Railways: HIGH-SPEED RAIL NETWORK
2.5 .4 2 .5 .3 TRANSPORT
INFRASTRUCTURE
TRANSPORT
INFRASTRUCTURE
Sources : Union Internat ionale des Chemins de Fer, nat ional stat ist ics , Eurostat , est imates ( in i ta l ics)
Sources : Union Internat ionale des Chemins de Fer (updated September 2014) , h igh speed department ; nat ional sources
km %
1990 1995 2000 2005 2010 2012 2013
OF WHICH: ELECTRIFIED
2013 EU-28 237 671 229 435 220 583 215 110 216 232 216 507 215 298 115 734 53.8
BE 3 479 3 368 3 471 3 544 3 582 3 582 3 582 3 064 85.5
BG 4 299 4 294 4 320 4 154 4 097 4 070 4 032 2 869 71.2
CZ 9 430 9 444 9 614 9 468 9 469 9 459 3 216 34.0
DK 2 838 2 863 2 787 2 646 2 606 2 615 2 615 621 23.7
DE 40 981 41 718 36 588 34 221 33 707 33 509 33 446 19 876 59.4
EE 1 026 1 021 968 968 1 540 1 540 1 510 132 8.7
IE 1 944 1 954 1 919 1 919 1 919 1 919 1 919 52 2.7
EL 2 484 2 474 2 385 2 576 2 552 2 554 2 265 437 19.3
ES 14 539 14 308 14 347 15 015 15 837 15 922 15 937 9 768 61.3
FR 34 070 31 939 29 272 29 286 29 871 30 581 30 581 16 583 54.2
HR 2 429 2 296 2 726 2 726 2 722 2 722 2 722 985 36.2
IT 16 066 16 003 16 187 16 545 17 022 17 060 17 070 12 164 71
CY - - - - - - - - -
LV 2 397 2 413 2 331 2 270 1 897 1 860 1 859 250 13.4
LT 2 007 2 002 1 905 1 771 1 767 1 767 1 767 122 6.9
LU 271 275 274 275 275 275 275 262 95.3
HU 7 838 7 714 8 005 7 950 7 893 7 877 7 898 3 010 38
MT - - - - - - - - -
NL 2 798 2 739 2 802 2 797 3 013 3 013 3 032 2 307 76.1
AT 5 624 5 672 5 665 5 691 5 039 4 894 4 894 3 468 70.9
PL 26 228 23 986 22 560 19 507 19 702 19 617 18 959 11 817 62.3
PT 3 064 2 850 2 814 2 844 2 842 2 541 2 544 1 630 64.1
RO 11 348 11 376 11 015 10 948 10 777 10 777 10 768 4 029 37.4
SI 1 196 1 201 1 201 1 228 1 228 1 209 1 209 500 41.4
SK 3 660 3 665 3 662 3 658 3 622 3 631 3 631 1 586 43.7
FI 5 867 5 880 5 854 5 732 5 919 5 944 5 944 3 172 53.4
SE 11 193 10 925 11 037 11 017 11 160 11 136 10 957 8 214 75.0
UK 16 914 17 069 17 044 16 208 16 175 16 423 16 423 5 600 34.1
AL 423 423 423 0 0.0
ME 248 249 249 249 224 90.1
MK 696 699 699 699 699 699 699 234 33.5
RS 3 809 3 809 3 809 3 809 1 275 33.5
TR 8 429 8 549 8 671 8 697 9 594 9 642 9 718 2 922 30.1
IS - - - - - - - - -
NO 4 044 4 023 4 413 4 334 4 199 4 264 4 224 2 500 59.2
CH 3 215 3 232 3 216 3 399 3 597 3 551 3 588 3 587 100.0
Notes: DE: includes DE-E: 1970=14 250, 1980=14 248, 1990=14 031, CS: 1970: 13 308, 1980: 13 131, 1990: 13 111. these are included in eU-28 totals.
lENgTH Of liNESkm (at end of year)
BE DE ES FR IT NL AT UK EU
1985 - - - 419 224 - - - 6431990 - 90 - 710 224 - - - 1 0241995 - 447 471 1 281 248 - - - 2 4472000 72 636 471 1 281 248 - - - 2 7082005 137 1 196 1 090 1 540 248 - - 74 4 2852006 137 1 285 1 272 1 540 876 - - 74 5 1842007 137 1 285 1 511 1 872 562 - - 113 5 4802008 137 1 285 1 599 1 872 744 - - 113 5 7502009 209 1 285 1 604 1 872 923 120 - 113 6 1262010 209 1 285 2 056 1 896 923 120 - 113 6 6022011 209 1 285 2 144 2 036 923 120 - 113 6 8302012 209 1 334 2 144 2 036 923 120 - 113 6 8792013 209 1 334 2 515 2 036 923 120 48 113 7 2982014 209 1 352 2 515 2 036 923 120 48 113 7 316
Note: length of lines or of sections of lines on which trains can go faster than 250 km/h at some point during the journey.
HigH-SPEEd liNES cURRENTly UNdER cONSTRUcTiON
LINE LENGTH kmSTART OF
OPERATIONDE Offenburg - Riegel (Basel) 39 2029DE Gröbers - Erfurt 98 2015DE Nürnberg - Ebensfeld 83 2017DE Ebensfeld - Erfurt 100 2017DE Stuttgart - Wendlingen 57 2021DE Buggingen - Katzenberg tunnel (Basel) 12 2021DE Wendlingen - Ulm 60 2021DE Tunnel Rastatt 17 2022ES (Madrid-Valencia)/Alicante - Murcia/Castellon 231 ES Vitoria - Bilbao - San Sebastian 175 ES Variante de Pajares 50 ES Bobadilla - Granada 109 ES La Coruña - Vigo 158 ES Navalmoral-Cacere-Badajoz-Fr. Port 278 ES Sevilla - Cadiz 152 ES Hellin - Cieza (Variante de Camarillas) 27 ES Sevilla-Antequera 128 FR LGV EST - Européenne (second phase) 122 2016FR LGV Bretagne - Pays de la Loire 214 2016FR LGV Sud Europe Atlantique 341 2017FR Counternement Nimes - Montpellier 80 2017IT Milan (Treviglio) - Brescia 58 2016IT Genoa - Milan (Tortona) 67 2020
AT Gloggnitz - Mürzzuschlag (Sermmering-Basistunnel) 27 2024AT Graz-Klagenfurt (Koralmtunnel) 110 2024AT Brennerachse 64 2012
Note: the length indicated above is the length of the line under construction and not necessarily the distance between the places named.

80 81
Titlesubtitle
Titlesubtitle
Air: NUMBER OF AIRPORTS
Railways: MAIN RAILWAY GAUGE AND ELECTRIC CURRENT USED
2.5 .6 2 .5 .5 TRANSPORT
INFRASTRUCTURE
TRANSPORT
INFRASTRUCTURE
TRAck gAUgE ElEcTRic cURRENTmm DC volts AC volts
BE 1 435 3 000 25 000 50 HzBG 1 435 25 000 50 HzCZ 1 435 3 000 25 000 50 HzDK 1 435 3 000 25 000 50 Hz
DE 1 435 800-1 200 (contact rail) 15 000 16.7 Hz
EE 1 520 3 000IE 1 600 1 500
EL600
1 000 1 435
25 000 50 Hz
ES (*)
1 000 1 435 1 668
1 500 3 000 25 000 50 Hz
FR 1 000 1 435
750-850 (contact rail)
1 50025 000 50 Hz
HR 1 435 3 000 25 000 50 HzIT 1 435 3 000 25 000 50 Hz
CY - - - -LV 1 520 3 000LT 1 520 25 000 50 HzLU 1 435 25 000 50 Hz
HU 1 435 25 000 50 HzMT - - - -NL 1 435 1 500AT 1 435 15 000 16.7 HzPL 1 435 3 000
PT 1 0001 668 25 000 50 Hz
RO 1 435 25 000 50 HzSI 1 435 3 000
SK 1 435 3 000 25 000 50 HzFI 1 524 25 000 5 Hz
SE 1 435 15 000 16.7 Hz
UK (**)
1 4351 600
(N-IRL)
750(contact rail) 25 000 50 Hz
Notes: 1 435 mm = standard gauge. (*) ES: new lines have a gauge of 1 435 mm and
an electric current of 25 000 volts, 50 Hz. (**) UK: (N-iRl): Northern ireland.
Sources : Eurostat , A i rports Counci l Internat ional Europe, nat ional sourcesSources : Union Internat ionale des Chemins de Fer, ra i lway companies
by NUmbER Of PASSENgERS cARRiEd (*) PER yEARmorethan
10 million5 to
10 million 1 to
5 million 500 000 to 1 million
100 000 to 500 000
15 000 to 100 000
EU-28 29 31 95 36 108 40BE 1 1 3BG 3CZ 1 4DK 1 2 4 1DE 5 4 8 3 7EE 1IE 1 2 1 1
EL 1 1 6 2 11 12ES 4 5 10 8 6FR 3 4 12 3 21 6HR 3 2
IT 2 6 15 4 6 1CY 2LV 1LT 1 1 1LU 1
HU 1MT 1NL 1 2 2AT 1 1 3 1PL 1 5 1 3PT 1 2 1 1 2 6RO 1 1 1 4
SI 1SK 1 1FI 1 1 8 9
SE 1 1 4 2 11UK 4 5 11 5 10 5AL 1
ME 2MK 1 1RS 1 1TR 5 9 6 15 10IS 1
NO 1 1 8 2 6CH 2 1 2 1
Notes: (*) ‘passengers carried’ do not include direct transit passengers (i.e. transit passengers who stay on board and continue their flight with the same flight number). airports are grouped according to 2013 passenger volumes. in this table, blank means none.

82 83
Titlesubtitle
Titlesubtitle
2.5 .7
Pipelines
2.5 .8
inland waterways: LENGTH IN USE
TRANSPORT
INFRASTRUCTURE
TRANSPORT
INFRASTRUCTURE
Sources : Eurostat , nat ional stat ist ics , est imates ( in i ta l ics) Sources : Eurostat , nat ional stat ist ics , est imates ( in i ta l ics)
NAvigAblE cANAlS, RivERS ANd lAkES REgUlARly USEd fOR TRANSPORT
km
1990 1995 2000 2005 2010 2011 2012EU-28 38 611 40 811 41 820 41 789 41 919 41 862
BE 1 515 1 540 1 534 1 516 1 516 1 516 1 516BG 470 470 470 470 470 470 470CZ 677 664 664 676 676 676DK - - - - - - -DE 4 350 6 663 6 754 7 565 7 728 7 728 7 675EE 520 320 320 335 335 335IE - - - - - - -
EL - - - - - - -ES - - - - - - -FR 6 197 5 962 5 789 5 788 5 110 5 019 4 996HR 933 933 720 804 805 1 017 1 017
IT 1 366 1 466 1 477 1 562 1 562 1 562 1 562CY - - - - - - -LV - - - - - - -LT 369 369 380 290 448 452 452LU 37 37 37 37 37 37 37
HU 1 373 1 373 1 373 1 587 1 864 1 864 1 864MT - - - - - - -NL 5 046 5 046 6 183 6 183 6 220 6 219 6 237AT 351 351 351 351 351 351 351PL 3 997 3 980 3 813 3 638 3 659 3 659 3 659PT - - - - - - -RO 1 782 1 779 1 779 1 779 1 779 1 779 1 779
SI - - - - - - -SK 2 379 172 172 172 172 172 172FI 6 072 6 120 7 842 8 029 8 006 8 013 8 014
SE - - - - - - -UK 1 631 1 153 1 153 1 065 1 050 1 050 1 050AL - - - - - - -
ME - - - - - - -MK - - - - - - -RS 1 600 1 600 1 600TR - - - - - - -IS - - - - - - -
NO - - - - - - -CH - - - - - - -
Note: DE: includes DE-E: 1970 = 2 300, 1980 = 2 302, 1990 = 2 319.
lENgTH Of Oil PiPEliNESkm
1990 1995 2000 2005 2010 2011 2012EU-28 34 532 35 839 36 057 37 808 37 319
BE 301 294 294 294 294 294 294BG 578 578 578 578 578 578 570CZ 581 675 675 674 674 674DK 444 330 330 330 330 330 330DE 2 222 2 460 2 370 2 370 2 370 2 370 2 370EE - - - - - - -IE - - - - - - -
EL - - - 267 267 267 267ES 2 678 3 691 3 780 3 833 4 365 4 722 4 743FR 4 948 4 983 5 746 5 746 6 293 7 600 7 493HR 865 601 601 610 610 610 610
IT 4 086 4 235 4 346 4 328 4 291 4 290 4 290CY - - - - - - -LV 766 766 766 860 860 860 860LT 400 500 500 500 500 500LU - - - - - - -
HU 2 574 2 071 2 061 2 032 2 209 2 215 2 215MT - - - - - - -NL 391 391 391 391 391 391 391AT 777 777 777 777 1 214 1 214 1 214PL 2 039 2 278 2 278 2 278 2 362 2 444 2 444PT - - 147 147 147 147 147RO 3 694 3 546 4 423 4 807 3 346 3 346 2 951
SI - - - - - - -SK 515 515 515 510 510 510FI - - - - - - -
SE - - - - - - -UK 2 462 3 470 3 954 4 501 4 446 4 446 4 446AL - - - - - - -
ME - - - - - - -MK 155 144 144 144RS 374 434 434TR 1 126 2 112 3 065 3 038 3 038 3 038IS - - - - - - -
NO 3 701 7 908 1 189 1 260 1 244 1 245CH 239 239 108 108 108 108 108
Notes: including oil pipelines under the sea. DE: crude oil pipelines only; includes DE-E: 1970 = 1 300, 1980 = 1 301, 1990 = 1 323 km. CS: 1970 = 1 090, 1980 = 1 090, 1990 = 1 090, 1991 = 1 090, 1992 = 1 083 km.

84 85Sources: Eurostat, National statistics, United Nations Economic Commission for Europe, estimates ( in i ta l ics)
NUmbER Of PASSENgER cARS PER 1 000 iNHAbiTANTS %
1990 1995 2000 2005 2010 2012 2013CHANGE ‘12 / ‘13
EU-28 343 378 415 448 478 488 491 0.5BE 387 421 456 468 480 487 491 0.8BG 152 196 245 329 353 385 402 4.2CZ 234 295 336 387 429 448 450 0.5DK 309 320 347 362 389 399 405 1.4DE 461 495 475 493 517 539 543 0.6EE 154 269 333 366 416 456 478 4.7IE 228 276 348 400 416 415 420 1.1
EL 170 207 292 387 469 467 466 -0.2ES 309 360 431 460 475 476 474 -0.5FR 476 481 503 497 502 505 504 -0.1HR 121 155 262 321 353 339 341 0.6
IT 483 533 572 597 619 621 608 -2.1CY 304 335 384 477 551 549 553 0.7LV 106 134 237 333 307 305 317 3.8LT 133 199 336 442 554 590 615 4.2LU 477 556 622 655 659 663 661 -0.3
HU 187 218 232 287 299 301 308 2.1MT 337 487 483 525 581 592 602 1.6NL 367 364 409 434 464 472 471 -0.1AT 388 452 511 504 530 542 546 0.6PL 138 195 261 323 447 486 504 3.5PT 185 255 333 400 424 429 430 0.2RO 56 97 124 158 214 224 235 5.1
SI 294 357 435 479 518 518 516 -0.3SK 166 189 237 243 310 337 347 2.9FI 388 371 412 462 535 563 574 1.8
SE 419 411 450 459 460 465 466 0.2UK 361 378 425 467 465 464 468 0.8AL 18 37 62 104 103 118 15.0
ME 266 279 286 2.5MK 145 148 124 151 146 168 14.7RS 0 200 216 240 248 3.0TR 49 65 80 102 114 121 5.9IS 468 445 561 625 643 653 654 0.3
NO 380 386 411 437 469 484 489 1.2CH 442 457 492 518 518 529 531 0.3
Note: passenger car stock at end of year n divided by the population on 1 January of year n+1.
Source : Tables 2 .6 .2 and 1 .5
TRANSPORT
2.6 MEANS OF TRANSPORT
Road: MOTORISATION
2.6 .1
TRANSPORT
MEANS OF TRANSPORT 2.6 .2
Road: PASSENGER CARS
STOck Of REgiSTEREd vEHiclES1 000 %
1990 1995 2000 2005 2010 2012 2013CHANGE ‘12 / ‘13
EU-28 163 628 182 462 201 993 221 608 240 427 245 906 247 997 0.9BE 3 864 4 273 4 678 4 919 5 276 5 441 5 505 1.2BG 1 317 1 648 1 993 2 538 2 602 2 807 2 910 3.7CZ 2 410 3 043 3 439 3 959 4 496 4 706 4 729 0.5DK 1 590 1 679 1 854 1 965 2 164 2 237 2 278 1.8DE 36 772 40 499 39 059 40 660 42 302 43 431 43 851 1.0EE 241 383 464 494 553 602 629 4.4IE 801 998 1 333 1 684 1 899 1 907 1 933 1.4
EL 1 736 2 205 3 195 4 303 5 217 5 168 5 124 -0.8ES 11 996 14 212 17 449 20 250 22 147 22 248 22 025 -1.0FR 27 072 27 872 29 808 30 497 31 657 32 132 32 244 0.3HR 580 711 1 125 1 385 1 515 1 445 1 448 0.2
IT 27 416 30 301 32 584 34 667 36 751 37 078 36 963 -0.3CY 179 220 268 355 463 475 475 -0.2LV 283 332 557 742 637 618 635 2.6LT 493 718 1 172 1 455 1 692 1 753 1 809 3.2LU 183 229 273 307 337 356 363 2.1
HU 1 944 2 245 2 365 2 889 2 984 2 986 3 041 1.8MT 120 181 189 213 241 250 256 2.6NL 5 509 5 633 6 539 7 092 7 736 7 916 7 932 0.2AT 2 991 3 594 4 097 4 157 4 441 4 584 4 641 1.2PL 5 261 7 517 9 991 12 339 17 240 18 744 19 389 3.4PT 1 849 2 560 3 443 4 200 4 480 4 497 4 480 -0.4RO 1 292 2 197 2 778 3 364 4 320 4 487 4 696 4.6
SI 587 711 866 960 1 062 1 066 1 064 -0.2SK 880 1 016 1 274 1 304 1 669 1 824 1 880 3.0FI 1 939 1 901 2 135 2 430 2 877 3 057 3 127 2.3
SE 3 601 3 631 3 999 4 154 4 335 4 447 4 495 1.1UK 20 722 21 951 25 067 28 326 29 334 29 644 30 075 1.5AL 59 115 195 295 297 342 14.9
ME 165 174 179 2.8MK 286 300 253 310 302 347 14.9RS 1 481 1 566 1 726 1 770 2.5TR 3 059 4 422 5 773 7 545 8 649 9 284 7.3IS 120 119 159 187 205 210 213 1.4
NO 1 613 1 685 1 852 2 029 2 309 2 443 2 500 2.3CH 2 985 3 229 3 545 3 861 4 076 4 255 4 321 1.5
LI 17 19 22 24 27 28 28 0.3
Notes: Stock at end of year, except for BE: 1 august (1 July in 2012), CH: 30 September, LI: 1 July. taxis are usually included. HR: from 2009 light vans are considered as passenger cars and no longer as Goods Vehicles.

86 87
Titlesubtitle
Titlesubtitle
Sources: Eurostat, national statistics, United Nations Economic Commission for Europe, estimates ( in i ta l ics)
Sources: Eurostat, national statistics, United Nations Economic Commission for Europe, estimates ( in i ta l ics)
TRANSPORT
MEANS OF TRANSPORT
TRANSPORT
MEANS OF TRANSPORT 2.6 .4 2 .6 .3
Road: GOODS VEHICLES
Road: BUSES AND COACHES
STOck Of REgiSTEREd vEHiclES1 000 %
1990 1995 2000 2005 2010 2012 2013CHANGE ‘12 / ‘13
EU-28 744.0 756.8 781.5 795.2 817.7 818.4 822.9 0.5BE 15.6 14.6 14.7 15.4 16.2 16.1 16.3 1.3BG 34.6 41.8 43.0 37.8 24.5 23.3 23.3 0.0CZ 20.5 20.5 19.0 20.9 20.4 20.6 20.3 -1.4DK 8.1 13.7 14.0 14.4 14.5 13.5 13.3 -1.6DE 100.4 85.4 77.2 75.2 76.5 76.0 76.8 1.0EE 7.9 7.0 6.1 5.2 4.2 4.3 4.5 4.4IE 4.0 5.3 7.0 7.6 8.2 8.3 8.5 2.7
EL 21.4 24.6 27.0 26.8 27.3 27.0 26.8 -0.7ES 45.8 47.4 54.7 58.2 62.4 61.1 59.9 -2.0FR 73.7 81.8 85.7 90.1 90.0 93.1 95.2 2.3HR 5.8 3.9 4.7 4.9 4.9 4.7 4.8 2.9
IT 77.7 75.0 88.0 94.4 99.9 99.5 98.6 -1.0CY 2.3 2.7 2.9 3.2 3.4 3.6 3.5 -1.7LV 12.1 16.5 11.5 10.6 5.4 5.0 5.0 -1.1LT 15.2 17.6 15.5 15.3 13.7 13.1 13.1 -0.3LU 0.8 0.9 1.1 1.3 1.6 1.7 1.8 1.8
HU 26.4 20.5 17.9 17.5 17.6 17.3 17.6 1.5MT 1.0 1.0 1.1 1.1 1.8 1.7 1.7 -2.0NL 12.1 11.6 11.4 11.0 11.3 10.5 9.9 -5.2AT 9.4 9.8 9.9 9.3 9.6 9.5 9.6 0.3PL 92.4 85.4 82.6 79.6 97.0 99.9 102.6 2.7PT 12.1 15.0 19.8 14.7 15.4 15.1 14.8 -2.0RO 28.3 42.0 40.7 39.3 40.9 42.0 42.8 2.0
SI 3.1 2.5 2.3 2.3 2.4 2.4 2.5 2.3SK 14.3 11.8 10.9 9.1 9.4 9.0 8.8 -1.5FI 9.3 8.1 9.9 10.9 13.7 14.9 15.5 4.1
SE 14.6 14.6 14.4 13.5 13.9 14.2 14.0 -1.5UK 75.0 75.9 88.6 105.6 111.5 111.1 111.6 0.5AL 6.7 16.8 29.5 7.0 5.3 5.7 8.1
ME 1.2 1.2 3.9MK 2.3 2.5 2.5 2.3 2.7 2.7 3.0 11.1RS 9.7 8.0 8.8 9.0 2.1TR 188.1 263.2 354.3 501.9 595.5 632.1 641.7 1.5IS 1.3 1.3 1.7 1.9 1.9 2.1 2.2 4.6
NO 21.2 32.5 36.7 28.8 20.3 18.2 17.6 -3.5CH 31.2 36.5 40.3 45.8 52.8 58.3 60.2 3.2
LI 0.1 0.1 0.1 0.1 0.1 -3.8
Notes: Stock at end of year, except for BE: 1 august, CH: 30 September, LI: 1 July. Data include buses, coaches, minibuses and sometimes also trolleybuses.
STOck Of REgiSTEREd vEHiclES1 000 %
1990 1995 2000 2005 2010 2012 2013CHANGE ‘12 / ‘13
EU-28 22 672.2 26 957.1 30 941.7 34 868.7 35 322.3 35 537.7 0.6BE 380.4 442.5 588.8 662.3 747.3 778.7 791.5 1.6BG 161.6 223.2 259.4 333.9 333.5 367.0 388.0 5.7CZ 219.3 298.3 439.2 598.0 604.2 601.1 - 0.5DK 286.6 333.8 384.9 469.5 485.1 459.6 444.4 - 3.3DE 1 653.0 2 378.7 2 419.1 2 404.9 2 619.4 2 761.4 2 813.8 1.9EE 67.7 65.6 82.1 86.2 81.2 88.0 92.2 4.7IE 143.2 141.8 205.6 286.5 327.1 309.2 317.8 2.8
EL 766.4 883.8 1 057.4 1 186.5 1 318.8 1 318.9 1 315.8 - 0.2ES 2 401.1 3 024.2 3 923.2 4 849.6 5 303.5 5 171.7 5 070.2 - 2.0FR 4 670.0 4 926.0 5 151.7 5 346.7 6 365.3 6 439.9 6 553.7 1.8HR 73.5 122.5 162.9 157.7 141.6 141.5 - 0.1
IT 2 207.9 2 509.9 3 087.0 3 785.9 4 141.8 4 143.8 4 087.6 - 1.4CY 74.3 101.2 114.7 118.4 120.7 113.7 109.1 - 4.1LV 68.7 97.1 113.1 71.6 76.3 79.9 4.7LT 83.0 108.9 98.6 122.5 133.9 138.9 143.0 3.0LU 11.3 15.8 24.7 29.6 35.6 37.3 37.7 0.9
HU 262.0 278.0 352.6 412.9 451.3 454.3 462.6 1.8MT 40.8 51.5 44.4 42.5 42.7 43.4 1.6NL 553.0 654.0 899.0 1 004.5 1 004.0 969.6 951.3 - 1.9AT 261.8 302.9 344.5 358.0 396.8 416.5 424.8 2.0PL 1 354.1 1 879.1 2 304.5 2 981.6 3 178.0 3 242.5 2.0PT 781.0 912.3 1 313.2 1 308.0 1 337.0 1 295.0 1 258.4 - 2.8RO 258.7 343.1 427.2 493.8 667.2 719.9 761.6 5.8
SI 30.8 42.9 54.3 66.4 84.1 84.4 84.9 0.6SK 92.0 102.6 114.0 174.2 276.0 286.0 289.4 1.2FI 264.2 252.0 304.3 363.6 464.4 508.0 526.1 3.6
SE 309.5 307.7 374.2 461.2 526.4 556.8 565.2 1.5UK 2 706.0 2 565.0 2 928.3 3 552.4 3 796.9 3 860.7 3 940.3 2.1AL 29.1 45.6 47.3 84.3 60.2 65.3 8.5
ME 13.7 13.8 1.0MK 22.6 24.6 18.0 33.3 30.8 35.1 14.1RS 118.3 151.7 144.1 140.8 - 2.3TR 830.0 1 351.8 2 152.0 3 125.4 3 546.3 3 689.0 4.0IS 13.1 14.8 19.4 25.5 30.4 30.3 30.7 1.1
NO 308.3 349.5 414.3 465.4 527.0 542.5 548.3 1.1CH 252.1 262.4 278.5 307.2 335.2 361.9 371.4 2.6
LI 2.5 2.6 2.8 3.0 3.1 2.1
Notes: Stock at end of year, except for CH: 30 September, LI: 1 July. as a rule, data include heavy and light goods vehicles, lorries and road tractors; due to varying concepts of such vehicles, data are not fully comparable between countries. HR: from 2009 light vans are included in passenger cars and no longer in Goods Vehicles.

88 89
Titlesubtitle
Titlesubtitle
Sources : Associat ion des constructeurs européens d ’automobi les (ACEA) , nat ional sources , est imates ( in i ta l ics)
Sources : Nat ional stat ist ics , Associat ion des constructeurs européens de motocycles (ACEM)
Road: PASSENGER CARS
Road: POWERED TWO-WHEELERS
TRANSPORT
MEANS OF TRANSPORT
TRANSPORT
MEANS OF TRANSPORT 2.6 .6 2 .6 .5
STOck Of REgiSTEREd vEHiclES1 000 %
1995 2000 2005 2010 2012 2013CHANGE ‘12 / ‘13
EU-28 23 389.2 29 831.9 34 395.3 34 497.9 34 581.1 0.2BE 277.8 346.3 413.0 438.6 444.7 1.4BG 519.3 520.5 146.5 125.4 139.8 147.9 5.8CZ 915.2 748.1 794.0 924.3 976.9 977.2 0.0DK 58.0 138.3 171.9 203.6 199.2 198.1 -0.6DE 3 995.5 4 438.1 5 202.9 5 870.9 6 071.6 6 031.2 -0.7EE 3.3 6.7 10.2 19.7 35.3 38.7 9.7IE 23.5 30.6 34.3 38.1 35.1 36.6 4.3
EL 781.4 1 124.2 1 499.1 1 556.4 1 568.6 0.8ES 1 301.2 1 445.6 4 117.6 4 997.7 5 022.0 4 998.3 -0.5FR 2 289.0 2 410.0 2 475.3 3 561.0 3 089.1 2 894.3 -6.3HR 9.9 21.9 128.4 176.8 157.0 154.8 -1.4
IT 6 228.3 7 826.9 9 298.4 8 855.0 8 582.3 8 737.8 1.8CY 50.4 43.3 40.4 40.7 41.1 40.0 -2.8LV 15.8 20.7 32.5 36.7 41.1 43.6 6.1LT 20.0 19.8 24.0 56.3 64.2 68.2 6.1LU 28.4 32.8 37.7 42.1 44.5 25.8 -
HU 91.2 122.7 142.3 151.4 157.2 3.8MT 17.4 12.4 12.0 14.7 15.8 16.9 6.9NL 855.0 970.8 1 112.9 1 659.8 1 733.8 1 751.2 1.0AT 546.4 632.7 627.7 727.9 762.4 776.3 1.8PL 929.0 803.0 1 091.2 1 935.1 2 207.6 2 316.6 4.9PT 216.3 345.9 588.4 498.0 492.5 485.0 -1.5RO 327.7 239.2 197.4 85.2 95.5 101.6 6.5
SI 8.5 11.2 48.7 91.0 93.1 93.0 -0.1SK 81.8 45.6 56.4 59.6 68.1 74.1 8.9FI 159.5 193.4 301.8 486.8 538.0 554.3 3.0
SE 264.2 310.1 453.1 570.2 593.8 605.6 2.0UK 714.0 971.0 1 235.0 1 264.4 1 251.8 1 243.7 -0.6AL 6.9 3.8 7.2 24.0 25.5 26.7 4.6
ME 4.6 5.0 10.3MK 1.7 7.8 8.5 8.1 -4.5RS 16.0 37.9 47.2 59.5 25.9TR 819.9 1 011.3 1 441.1 2 389.5 2 657.7 2 722.8 2.4IS 1.9 2.3 4.2 9.7 10.1 10.2 0.8
NO 158.6 201.6 257.5 315.5 331.7 337.9 1.9CH 704.1 732.6 771.1 815.6 851.4 862.9 1.3
LI 2.6 3.1 3.7 3.9 4.0 1.7
Notes: Stock at end of year, except for BE: 1 august, CH: 30 September, LI: 1 July. National vehicle stock data do not always include all powered two-wheelers and are therefore not fully comparable between countries. tricycles and quads are sometimes included in the data. break in time series due to inclusion of mopeds from 2001 in ES, from 2002 in SI and HR, from 2004 in LV, from 2005 in PL, from 2007 in LT, from 2011 in EE.
NEw vEHiclE REgiSTRATiONS1 000 %
2000 2005 2010 2012 2013 2014CHANGE
‘13/’14
EU-28 15 194.3 13 438.2 12 103.9 11 884.3 12 557.1 5.7BE 515.2 480.1 547.3 487.4 486.1 482.9 -0.6BG 32.7 15.6 19.8 19.4 20.4 5.2CZ 151.7 169.6 174.0 164.7 192.3 16.7DK 112.7 146.9 153.6 170.5 182.2 189.1 3.8DE 3 378.3 3 319.3 2 916.3 3 082.6 2 952.4 3 036.8 2.9EE 19.6 10.3 19.4 19.5 20.9 7.0IE 230.8 171.7 88.4 79.5 74.4 96.3 29.6
EL 290.2 269.7 141.5 58.5 58.7 71.2 21.3ES 1 381.3 1 528.9 982.0 699.6 722.7 855.3 18.4FR 2 133.9 2 067.8 2 251.7 1 898.8 1 790.5 1 795.9 0.3HR 92.4 102.1 46.2 40.8 27.8 33.9 22.0
IT 2 423.1 2 237.4 1 961.6 1 402.1 1 304.6 1 359.6 4.2CY 8.2 19.2 15.1 11.0 7.1 8.3 16.6LV 16.6 6.4 10.7 10.6 12.5 17.1LT 10.5 8.0 12.2 12.2 14.5 19.3LU 41.9 48.5 49.7 53.0 46.6 49.8 6.8
HU 199.0 43.5 50.4 56.1 67.5 20.2MT 6.6 4.1 5.9 5.7 6.5 12.2NL 597.6 465.2 482.6 502.7 416.7 387.8 -6.9AT 309.4 307.9 328.6 336.0 319.0 303.3 -4.9PL 235.5 333.5 271.2 288.9 327.2 13.3PT 257.8 206.5 223.5 95.3 105.9 142.8 34.8RO 172.5 106.3 72.1 57.7 70.2 21.6
SI 59.3 61.1 50.1 50.9 53.3 4.8SK 57.1 64.0 69.2 66.0 72.2 9.5FI 134.6 147.9 107.3 107.2 103.5 106.2 2.7
SE 290.5 274.3 289.7 279.5 269.6 303.9 12.8UK 2 221.7 2 439.7 2 030.8 2 044.6 2 264.7 2 476.4 9.3AL
ME 8.6 11.2 12.4 13.0 5.1MK 15.9 49.3 32.9 31.9 32.4 1.5RS 129.2 139.5 82.5 -40.8TR 406.8 485.6 565.8 668.3 589.1 -11.9IS 13.6 18.1 3.1 7.9 7.3 9.5 31.1
NO 97.4 109.9 127.8 138.0 142.2 144.2 1.4CH 316.5 264.9 292.5 326.1 307.9 301.9 -1.9
Note: RO based on sales.

90 91
Titlesubtitle
Titlesubtitle
Sources : Associat ion des constructeurs européens d ’automobi les (ACEA) , Eurostat , nat ional sources
Sources: Association des constructeurs européens d’automobiles (ACEA), national sources
Road: BUSES AND COACHES
Road: GOODS VEHICLES
TRANSPORT
MEANS OF TRANSPORT
TRANSPORT
MEANS OF TRANSPORT 2.6 .8 2 .6 .7
NEw vEHiclE REgiSTRATiONSligHT cOmmERciAl
vEHiclES cOmmERciAl
vEHiclES HEAvy cOmmERciAl
vEHiclES
<3.5 t % >3.5 t & <16 t % >16 t %
2013 2014 CHA
NG
E '1
3/'1
4
2013 2014 CHA
NG
E ‘1
3/’1
4
2013 2014 CHA
NG
E ‘1
3/’1
4
EU-28 1 385 737 1 541 727 11.3
BE 55 793 55 807 0.0 1 888 2 039 8.0 6 314 6 518 3.2
BG 9 446 10 749 13.8 (1) (1) (1) (1)
CZ 11 658 13 196 13.2 1 532 1 448 -5.5 6 556 8 150 24.3
DK 24 007 28 471 18.6 440 363 -17.5 3 871 3 329 -14.0
DE 212 831 228 414 7.3 31 417 27 299 -13.1 55 215 58 581 6.1
EE 2 885 3 243 12.4 48 64 33.3 808 712 -11.9
IE 10 808 16 456 52.3 441 474 7.5 1 302 1 447 11.1
EL 3 431 4 707 37.2 176 121 -31.3 169 232 37.3
ES 85 388 113 787 33.3 2 123 2 320 9.3 11 081 13 970 26.1
FR 364 989 370 361 1.5 7 339 6 086 -17.1 37 626 32 698 -13.1
HR 5 268 5 214 -1.0 159 182 14.5 479 780 62.8
IT 100 378 116 945 16.5 3 026 3 101 2.5 10 503 9 132 -13.1
CY 966 1 176 21.7 (1) (1) (1) (1)
LV 2 175 2 539 16.7 71 57 -19.7 1 229 843 -31.4
LT 1 823 1 991 9.2 193 134 -30.6 3 228 2 117 -34.4
LU 3 276 3 529 7.7 163 170 4.3 848 918 8.3
HU 11 424 15 937 39.5 434 366 -15.7 4 546 4 473 -1.6
MT 536 544 1.5 (1) (1) (1) (1)
NL 50 246 51 539 2.6 1 757 1 259 -28.3 11 810 9 342 -20.9
AT 30 714 31 171 1.5 794 791 -0.4 6 636 6 035 -9.1
PL 41 143 43 986 6.9 2 928 2 316 -20.9 16 775 15 881 -5.3
PT 18 202 26 166 43.8 345 565 63.8 2 049 2 562 25.0
RO 8 880 10 252 15.5 299 454 51.8 3 032 3 698 22.0
SI 6 165 6 318 2.5 132 149 12.9 1 063 1 343 26.3
SK 5 076 5 628 10.9 454 448 -1.3 3 429 3 201 -6.6
FI 10 621 10 750 1.2 767 575 -25.0 2 720 1 947 -28.4
SE 37 370 41 935 12.2 363 527 45.2 4 505 4 722 4.8
UK 270 238 320 916 18.8 15 196 11 004 -27.6 37 987 27 604 -27.3
IS 583 851 46.0 39 54 38.5 52 74 42.3
NO 30 854 29 613 -4.0 1 732 1 337 -22.8 4 046 4 106 1.5
CH 31 199 31 013 -0.6 1 005 973 -3.2 2 843 3 778 32.9
Note: (1) Data included under ‘light commercial vehicles’.
NEw vEHiclE REgiSTRATiONSligHT bUSES &
cOAcHESbUSES & cOAcHES
HEAvy bUSES & cOAcHES
TOTAl<3.5 t >3.5 t & <16 t >16 t %
2013 2014 2013 2014 2013 2014 2013 2014 CHA
NG
E ‘1
3/’1
4
EU-28 38 330 38 368 0.1BE 2 2 305 301 458 839 765 1 142 49.3BG 246 361 (1) (1) (1) (1) 246 361 46.7CZ 2 0 194 86 613 816 809 902 11.5DK 338 467 137 192 259 269 734 928 26.4DE 18 14 1 321 1 009 4 485 4 628 5 824 5 651 -3.0EE 4 1 74 124 158 62 236 187 -20.8IE 32 22 53 48 157 205 242 275 13.6
EL 52 98 38 44 10 30 100 172 72.0ES 443 510 1 212 1 386 1 655 1 896 14.6FR 1 1 518 1 145 5 445 4 751 6 963 5 897 -15.3HR 2 1 55 38 54 58 111 97 -12.6
IT 99 27 926 745 1 676 1 212 2 701 1 984 -26.5CY 64 47 (1) (1) (1) (1) 64 47 -26.6LV 2 1 201 145 25 57 228 203 -11.0LT 3 3 125 163 51 125 179 291 62.6LU 0 30 13 141 146 171 159 -7.0
HU 7 14 33 55 392 309 432 378 -12.5MT 12 8 0 0 3 2 15 10 -33.3NL 48 128 547 538 595 666 11.9AT 6 2 97 119 610 779 713 900 26.2PL 2 633 3 002 435 534 3 068 3 536 15.3PT 2 5 51 97 119 135 172 237 37.8RO 634 480 474 630 30 53 1 138 1 163 2.2
SI 2 46 65 108 103 154 170 10.4SK 82 89 184 358 266 447 68.0FI 4 5 211 395 172 291 387 691 78.6
SE 71 304 275 1 007 1 060 1 382 1 335 -3.4UK 2 286 2 440 4 564 4 065 2 130 2 138 8 980 8 643 -3.8
IS 20 39 19 10 35 20 74 69 -6.8NO 36 39 438 377 785 599 1 259 1 015 -19.4CH 347 174 129 122 452 456 928 752 -19.0
Note: (1) Figures included in other categories.

92 93
Titlesubtitle
Titlesubtitle
Sources : Associat ion des constructeurs européens de motocycles (ACEM) , Eurostat , nat ional sources , est imates ( in i ta l ics)
Road: MOPEDS
Road: MOTORCYCLES
TRANSPORT
MEANS OF TRANSPORT
TRANSPORT
MEANS OF TRANSPORT 2.6 .10 2 .6 .9
NEw vEHiclE REgiSTRATiONS1 000 %
1995 2000 2005 2010 2012 2013CHANGE
‘12/’13
EU-28 1 337.1 1 099.4 834.2 748.1 -10.3BE 25.3 25.0 26.4 23.4 20.6 -11.9BG 1.2 0.6 0.9 0.7 0.6 -17.0CZ 6.9 3.9 7.6 5.4 7.0 7.0 0.3DK 2.3 3.3 5.8 3.1 2.0 1.9 -5.7DE 218.2 252.6 168.7 122.3 127.5 129.6 1.7EE 0.1 0.3 0.5 0.4 0.4 12.4IE 3.8 2.4 1.1 0.7 0.4 -33.5
EL 64.0 83.1 61.5 31.8 28.5 -10.3ES 72.0 205.6 135.3 97.9 92.7 -5.4FR 179.6 196.6 231.6 169.6 147.9 -12.8HR 6.7 2.9 2.4 2.0 -14.6
IT 524.6 420.5 320.4 206.3 153.9 -25.4CY 2.5 3.1 2.1 1.7 -19.2LV 0.4 0.4 0.5 0.5 -3.4LT 0.4 1.7 0.3 0.5 0.2 -51.2LU 1.0 1.3 1.3 1.6 1.2 1.6 30.4
HU 12.5 3.2 2.0 1.8 -9.1MT 0.4 0.6 0.8 0.9 7.5NL 17.8 19.6 16.8 15.2 10.6 9.6 -9.9AT 18.7 23.8 19.1 21.4 24.8 26.0 4.8PL 3.8 8.7 7.8 7.4 -4.7PT 12.1 17.7 11.2 18.9 17.1 14.5 -15.3RO 0.8 5.7 0.6 0.5 -6.1
SI 1.2 2.5 2.7 2.0 2.4 16.6SK 1.2 2.3 1.9 2.8 47.9FI 5.2 9.2 9.5 5.0 3.9 -20.9
SE 18.4 22.8 13.2 7.6 7.8 2.6UK 121.9 108.1 81.3 80.0 81.0 1.2AL
ME 0.8 0.6 -28.6MK 1.0 0.5 0.1 3.2 3.4 2.8 -17.9RS 8.0 5.1 4.9 -4.4TR 227.7 106.9 176.9 163.6 -7.5IS 0.2 1.1
NO 6.2 4.0 4.0 4.0 0.7CH 50.8 45.1 33.7 39.0 37.9 -2.7
Notes: CY: new and used. IT: all two-wheelers over 50cc.
NEw vEHiclE dElivERiES1 000 %
2000 2005 2010 2012 2013CHANGE ‘12 / ‘13
EU-28 646.8 493.5 396.2 -19.7BE 33.2 17.3 14.2 10.4 8.8 -15.0BG 2.1 1.1 2.1 1.7 1.3 -26.3CZ 8.0 2.9 2.3 2.3 -0.3DK 9.8 4.9 16.5 10.8 8.2 -24.5DE 108.7 97.3 64.9 50.6 41.4 -18.2EE 8.0 0.0 0.7 0.7 0.0IE 3.0 0.8 0.2 0.2 0.2 -6.6
EL 19.2 24.1 18.9 13.3 8.6 -35.1ES 248.6 115.1 34.2 18.7 15.4 -17.6FR 192.3 154.9 144.5 127.2 106.1 -16.6HR 13.2 6.4 4.1 3.1 -23.0
IT 311.8 128.3 88.4 51.7 33.6 -35.1CY 2.1 0.5 0.3 0.2 -21.6LV 0.6 1.0 1.7 1.6 -5.9LT 1.2 1.0 1.0 1.9LU 0.5 0.5 0.7 1.0 1.1 10.2
HU 3.6 3.2 3.4 6.7MT 0.2 0.1 0.1 -13.8NL 66.9 40.9 93.7 68.5 59.4 -13.3AT 21.3 27.7 24.9 21.1 16.9 -19.8PL 23.3 72.2 60.0 48.7 -18.7PT 15.0 4.6 3.2 2.5 -24.2RO 3.0 1.5 -48.8
SI 3.1 3.5 2.7 2.9 8.7SK 2.0 1.8 1.5 0.5 -65.9FI 6.4 20.9 17.9 12.5 8.3 -34.2
SE 10.0 15.4 13.3 8.8 7.9 -9.8UK 48.2 24.7 14.5 13.4 10.7 -20.1AL
MEMKRS 8.8 6.6 5.7 -14.6TR 1.5 0.6 0.5 -13.1IS
NO 11.9 8.1 9.0 7.5 -16.1CH 3.1 8.4 8.9 7.9 -11.7
Note: CY: new and used.
Sources : Associat ion des constructeurs européens de motocycles (ACEM) , national sources, est imates ( in i tal ics) . Offic ial stat ist ics on mopeds are often unavai lable , therefore data and est imates should be considered as indicat ive

94 95
Titlesubtitle
Source : ISL , based on quarter ly updates from IHS Fairp lay
Sea: WORLD MERCHANT FLEET
TRANSPORT
MEANS OF TRANSPORT 2.6 .12a
Source : ISL , up to 2011 based on quarter ly updates from IHS Fairp lay, s ince 2012 on Clarkson Research Serv ices L imited (CRSL)
Sea: EU MERCHANT FLEET
TRANSPORT
MEANS OF TRANSPORT2.6 .11
TOTAl cONTROllEd flEET by wORld REgiONdwt (million)
On 1 January:
World region 1995 2000 2005 2010 2013 2014
Europe (*) 311.246 350.136 400.947 518.276 669.864 696.400
of which: EU-28 (**) 223.564 257.975 316.850 432.246 545.012 575.031
North America 51.024 49.413 45.414 50.539 69.064 70.211
Latin America 18.691 15.679 14.422 30.867 22.651 31.838
Asia / Oceania 246.722 292.722 361.311 532.446 748.366 780.826
Africa 6.742 7.121 5.142 6.981 12.753 13.640
Unknown 37.956 38.115 52.687 86.555 8.178 3.007
TOTAL 672.381 753.226 879.923 1 225.665 1 530.876 1 595.922
SHARE Of EU iN TOTAl ANd Of fOREigN flAg iN EUEU-28 (**) control of total 33.2 34.2 36.0 35.3 35.6 36.0
EU-28: Foreign flag share (***) 56.5 68.1 67.8 69.4 74.0
Note: only ships of 1 000 gt and over. (*) in this table europe includes eU-28, eFta, Monaco, Gibraltar, andorra,
turkey, Western balkan countries, Russia, Ukraine and Moldova. (**) eU-28 since 2012. (***) Foreign flag share includes ships registered by eU countries
in other eU countries.
SHiPS Of 1 000 gt ANd OvERON 1 JANUARy 2014
TOTAl flEET cONTROllEd
NATiONAl flAg (1)
fOREigN flAg (iNclUdiNg OTHER EU)
% Of fOREigN flAg iN TOTAl flEET
Number mio dwt Number mio dwt Number mio dwt Number mio dwt
EU-28 13 163 575.032 3 646 149.394 9 517 425.638
BE 169 13.613 53 4.980 116 8.633 68.6 63.4
BG 72 1.266 21 0.247 51 1.019 70.8 80.5
CZ - - - - - - - -
DK 902 41.136 330 13.459 572 27.677 63.4 67.3
DE 3 811 126.977 333 15.882 3 478 111.095 91.3 87.5
EE 91 0.546 17 0.050 74 0.496 81.3 90.8
IE 65 0.680 30 0.252 35 0.428 53.8 62.9
EL 3 989 282.200 816 73.737 3 173 208.463 79.5 73.9
ES 192 2.481 98 0.592 94 1.889 49.0 76.1
FR 278 9.982 125 3.349 153 6.633 55.0 66.4
HR 100 3.256 67 2.228 33 1.028 33.0 31.6
IT 1 036 41.064 553 17.752 483 23.312 46.6 56.8
CY 181 6.152 72 2.141 109 4.011 60.2 65.2
LV 82 1.198 8 0.041 74 1.157 90.2 96.6
LT 59 0.355 24 0.202 35 0.153 59.3 43.1
LU - - - - - - - -
HU - - - - - - - -
MT 34 0.350 22 0.144 12 0.206 35.3 58.9
NL 879 8.939 637 5.390 242 3.549 27.5 39.7
AT 7 0.050 - - 7 0.050 100.0 100.0
PL 115 2.712 11 0.032 104 2.680 90.4 98.8
PT 43 0.915 21 0.099 22 0.816 51.2 89.2
RO 78 0.990 3 0.039 75 0.951 96.2 96.1
SI 6 0.023 - - 6 0.023 100.0 100.0
SK - - - - - - - -
FI 99 1.697 67 0.805 32 0.892 32.3 52.6
SE 327 6.638 95 1.172 232 5.466 70.9 82.3
UK 548 21.812 243 6.801 305 15.011 55.7 68.8
AL 19 0.073 13 0.042 6 0.031 31.6 42.5
ME 4 0.073 3 0.072 1 0.001 25.0 1.4
MKRSTR 1 381 27.572 583 8.421 798 19.151 57.8 69.5
IS 22 0.125 1 0.000 21 0.125 95.5 100.0
NO 1 542 58.805 504 15.284 1 038 43.521 67.3 74.0
CH 179 5.968 47 1.402 132 4.566 73.7 76.5
Notes: (1) including international registers like NiS and DiS. including vessels registered at territorial dependencies.
Russia: 1547 ships, 22.498 mio dwt; Monaco: 38 ships, 2.234 mio dwt;
Ukraine: 352 ships, 3.387 mio dwt; Gibraltar: 6 ships, 0.030 mio dwt.

96 97
Titlesubtitle
Titlesubtitle
Air: PASSENGER AIRCRAFT
Sea: WORLD MERCHANT FLEET
TRANSPORT
MEANS OF TRANSPORT
TRANSPORT
MEANS OF TRANSPORT 2.6 .13 2 .6 .12b
fOR TRANSPORT Of gOOdS ANd PASSENgERS: flEET by TyPE Of SHiP ANd cOUNTRy Of dOmicilEON 1 JANUARy 2014 NUmbERS ANd dEAdwEigHT
Number dwt (1 000)
(ships of 1 000 gt and over) WORLD EU-28 % WORLD EU-28 %
TOTAL FLEET 40 246 13 166 33 1 595 922 575 030 36
Tankers 10 839 3 401 31 565 025 205 145 36
OF WHICH: Crude oil and oil product tankers 5 174 1 451 28 429 660 153 275 36
Oil / chemical tankers 4 181 1 537 37 88 208 40 212 46
Liquid gas tankers 1 399 395 28 46 183 10 571 23
Bulk carriers 9 971 2 855 29 705 358 208 108 30
Container ships 5 103 2 771 54 216 272 127 970 59
General cargo 12 250 3 391 28 103 282 31 309 30
OF WHICH: Conventional cargo 8 690 2 259 26 48 720 13 882 28
Special cargo (*) 1 215 505 42 31 179 10 270 33
Pure car carriers 754 94 12 11 867 1 499 13
Reefer 734 227 31 4 574 1 951 43
Ro-Ro cargo 857 306 36 6 942 3 708 53
Passenger and passenger cargo 2 083 748 36 5 985 2 498 42
fOR TRANSPORT Of gOOdS ANd PASSENgERS / cARgO SHiPS / cRUiSE SHiPS by REgiSTEREd flAg NUmbERS ANd gROSS TONS
Number gt (1 000)
(ships of 300 gt and over) WORLD EU-28 % WORLD EU-28 %
ON 1 JANUARy 2014 TOTAL 4 005 1 218 30 35 866 15 303 43
Cargo passenger and Ro-Ro passenger ships 2 432 824 34 16 849 9 527 57
Passenger (not Ro-Ro) 1 573 394 25 19 017 5 776 30
ON mid 2014 Cruise ships by registered flag (ships of 1 000 gt and over) 292 96 33 18 130 5 568 31
Notes: No deadweight figure is given for cruise ships, since dwt is a measure of the weight admissible in the vessel. Ro-Ro: vehicles roll on to embark, vehicles roll off to disembark. Reefer: refrigerated ships. (*) including open hatch carriers.
Source : AscendSource : Inst i tute for Shipping Economics and Logist ics , Bremen
NUmbER Of civil AiRcRAfT iN SERvicEON 31 dEcEmbER 2014 PASSENgER AiRcRAfT
50 seats or less
51 to 150 seats
151 to 250 seats
251 seats and more TOTAL
EU-28 351 1 259 1 816 518 3 944BE 4 38 17 10 69BG 6 11 11 1 29CZ 6 15 10 1 32DK 20 42 39 6 107DE 17 231 292 97 637EE 11 8 1 20IE 9 34 336 6 385
EL 10 19 35 1 65ES 16 97 155 49 317FR 61 136 114 102 413HR 1 11 2 14
IT 2 118 45 18 183CY 6 6LV 1 25 7 33LT 7 5 6 18LU 6 9 2 17
HU 4 53 57MT 5 4 7 16NL 9 76 70 54 209AT 4 50 39 8 101PL 6 39 22 6 73PT 14 31 49 9 103RO 7 21 9 37
SI 6 8 14SK 2 8 10FI 42 21 15 78
SE 25 34 12 3 74UK 92 155 448 132 827AL
MEMKRSTR 2 43 301 42 388IS 13 24 37
NO 32 57 116 12 217CH 27 41 97 165
LI
Notes: More than 30 000 small private planes not included. in this table blank means none.

98 99
Titlesubtitle
TitlesubtitleRail:
LOCOMOTIVES AND RAILCARSAir:
FREIGHT, SPECIAL, BUSINESS AIRCRAFT
Source : Union Internat ionale des Chemins de Fer, est imates ( in i ta l ics)Source : Ascend
TRANSPORT
MEANS OF TRANSPORT
TRANSPORT
MEANS OF TRANSPORT 2.6 .15 2 .6 .14
NUmbER Of civil AiRcRAfT iN SERvicEON 31 dEcEmbER 2014
FREIGHT / CARGO
QUICK-CHANGE
CONVERTIBLE
SPEC
IAL
PU
RPO
SE /
AM
BULA
NCE
BUSI
NES
S /
CORP
ORA
TE /
ExEC
UTI
VE
under 100 000 lbs
mtow
over 100 000 lbs
mtow(pass./cargo)
Multi-role
EU-28 169 202 36 84 1 961BE 5 20 60BG 3 5 1 14CZ 3 37DK 3 15 6 1 67DE 9 58 27 382EE 5 10IE 17 3 26
EL 5 2 21ES 39 9 6 84FR 15 5 17 121HR 1 3
IT 5 2 3 4 98CY 8LV 6 6LT 2 1 9LU 1 19 4 78
HU 7 2 9MT 88NL 10 2 25AT 4 226PL 16 2 1 18PT 1 2 122RO 11
SI 1 2 18SK 2 11FI 4 2 25
SE 32 4 39UK 13 35 13 9 345AL
MEMKRSTR 18 6 103IS 6
NO 9CH 13 4 168
LI 2Notes: Special purpose / Ambulance: contains data about Hospital /
ambulance / Medevac and Special Role / operations / Mission aircraft. mtow: maximum take-off weight. in this table blank means none.
STOck Of vEHiclES%
1990 2000 2005 2010 2012 2013CHANGE ‘12 / ‘13
EU-28 66 278 47 923 59 851 56 953 58 054 1.9BE 1 727 1 670 1 518 1 341 1 266 1 188 -6.2BG 1 119 762 669 624 451 504 11.8CZ 3 596 3 163 2 258 2 124 2 274 7.1DK 524 415 464 495 347 317 -8.6DE 14 437 9 656 7 742 15 613 15 103 15 887 5.2EE 300 194 170 81 75 75 0.0IE 166 172 412 572 374 620 65.8
EL 400 244 289 301 301 301 0.0ES 1 922 1 693 1 946 1 732 1 785 1 782 -0.2FR 7 279 7 158 7 354 6 768 5 895 5 692 -3.4HR 563 480 377 284 296 301 1.7
IT 4 818 4 697 4 674 4 494 3 650 3 243 -11.2CY - - - - - - -LV 739 433 358 196 205 205 0.0LT 389 419 365 275 262 277 5.7LU 97 124 145 104 43 43 0.0
HU 2 040 1 453 1 385 1 275 1 286 1 225 -4.7MT - - - - - - -NL 2 372 1 965 2 078 2 411 2 443 2 416 -1.1AT 1 543 1 530 1 500 1 233 1 072 1 607 49.9PL 6 801 5 293 4 723 4 421 4 103 3 996 -2.6PT 530 589 439 275 401 417 4.0RO 4 515 3 440 2 186 2 229 2 280 2 211 -3.0
SI 358 300 261 267 405 405 0.0SK 1 570 1 204 1 035 1 033 1 029 -0.4FI 669 735 702 644 652 652 0.0
SE 1 350 887 622 213 221 211 -4.5UK 5 610 3 177 10 710 11 082 11 176 0.8AL
ME - - - - - - -MK 92 101 73 63 69 53 -23.2RS 485 487 0.4TR 897 849 735 673 783 780 -0.4IS - - - - - - -
NO 502 299 289 544 629 816 29.7CH 1 254 1 528 2 198 1 745 1 680 1 645 -2.1
Notes: Data relates to main railways (Uic members). From 2010 a new split between ‘railcars’ and ‘trainset’ has been introduced by Uic. Values on this table consider the declared values of locomotives (diesel + electric) and railcars (diesel + electric).
DE: includes DE-E: 1970 = 5 000, 1980 = 4 506, 1990 = 6 331. CS: 1970 = 4 998, 1990 = 6 010.

100 101
Titlesubtitle
TitlesubtitleRail:
GOODS TRANSPORT WAGONSRail:
PASSENGER TRANSPORT VEHICLES
TRANSPORT
MEANS OF TRANSPORT
TRANSPORT
MEANS OF TRANSPORT 2.6 .17 2 .6 .16
Sources : Union Internat ionale des Chemins de Fer, nat ional stat ist ics (own est imates in i ta l ics )
Sources : Union Internat ionale des Chemins de Fer, nat ional stat ist ics , est imates ( in i ta l ics)
STOck Of cOAcHES, RAilcARS ANd TRAilERS
%
1990 2000 2005 2010 2012 2013CHANGE ‘12 / ‘13
EU-28 110 111 99 508 102 691 97 249 96 206 -1.1BE 3 286 3 494 3 251 3 412 3 290 2 345 -28.7BG 2 386 2 099 1 558 1 369 1 777 744 -CZ 5 252 4 895 4 514 4 419 4 312 -2.4DK 1 594 1 590 1 473 1 307 1 002 1 983 97.9DE 24 139 21 097 20 169 18 565 17 743 18 290 3.1EE 596 241 183 189 189 189 0.0IE 314 421 581 592 592 653 10.3
EL 810 505 564 718 718 718 0.0ES 3 839 3 765 5 239 5 665 4 944 5 225 5.7FR 15 748 15 656 15 879 16 890 16 626 17 130 3.0HR 1 052 720 579 523 519 541 4.2
IT 14 025 11 914 10 066 12 465 10 041 9 510 -5.3CY - - - - - - -LV 1 226 702 490 491 491 491 0.0LT 664 563 467 337 262 264 0.8LU 114 149 185 214 210 210 0.0
HU 4 385 3 232 2 787 3 136 3 086 2 458 -20.3MT - - - - - - -NL 2 268 2 742 852 2 824 2 948 2 895 -1.8AT 3 689 3 468 3 112 2 974 2 839 2 843 0.1PL 11 928 9 761 7 725 6 926 5 987 5 963 -0.4PT 1 232 1 303 1 125 965 980 973 -0.7RO 6 352 6 234 3 310 3 037 2 511 2 304 -8.2
SI 606 461 401 355 355 355 0.0SK 2 273 1 808 1 530 1 516 1 467 -3.2FI 957 1 003 1 084 1 071 1 131 1 163 2.8
SE 1 747 1 000 791 871 839 839 0.0UK 10 466 10 934 11 751 12 234 12 341 0.9AL
ME - - - - - - -MK 175 164 125 64 61 68 11.5RS 767 769 0.3TR 1 443 1 415 1 312 1 342 1 365 1 381 1.2IS - - - - - - -
NO 900 918 191 210 209 175 -16.3CH 4 136 3 333 4 293 4 949 4 911 4 997 1.8
Notes: Data relate to main railways (Uic members). DE: includes DE-E: 1970 = 10 000, 1980 = 10 761, 1990 = 9 635. CS: 1970 = 10 145, 1990 = 8 597.
STOck Of vEHiclES
1990 2000 2005 2010 (*) 2011 (*) 2012 (*) 2013 (*)EU-28
BE 30 332 18 790 17 375 11 612 11 612 11 612 11 612BG 42 459 29 720 16 511 11 751 16 458 16 576 5 483CZ 58 524 44 545 27 416 27 314 27 066 26 281DK 4 632 2 236DE 366 724 189 558 158 247 108 840 106 727 104 460 96 868EE 5 857 18 971 2 958 2 981 2 931 2 931IE 1 830 1 856 926 502 502 502 450
EL 10 967 3 453 3 491 3 158 3 158 3 158 3 158ES 37 687 26 452 23 842 14 337 13 732 14 148 14 900FR 148 100 94 789 95 738 25 314 20 322 17 830 16 333HR 13 720 9 986 7 330 6 674 6 063 6 063 5 959
IT 99 728 70 115 45 730 30 331 28 493 22 140 20 625CY - - - - - - -LV 11 085 9 146 8 871 6 038 6 126 6 320 6 815LT 12 860 13 155 13 192 9 238 9 212 9 112 9 202LU 2 719 2 626 3 222 3 895 3 895 3 895 3 895
HU 23 528 19 130 11 700 11 700 11 700 11 700MT - - - - - - -NL 6 697 4 700AT 34 330 23 970 22 655 28 605 17 412 18 104 17 477PL 275 582 130 116 75 164 68 151 65 102 63 269 62 255PT 4 579 4 162 3 495 3 194 3 170 3 170 3 170RO 166 086 117 982 65 175 72 605 69 285 72 638 42 571
SI 8 692 6 258 4 465 3 211 3 142 3 120 3 142SK 26 975 16 370 16 964 17 319 17 145 17 522FI 15 200 12 630 11 216 10 464 10 364 9 817 9 457
SE 27 470 17 596 13 649UK 34 403AL
ME - - - - - - -MK 1 525 1 144 1 007 1 011 1 011RS 8 447 8 449 8 452TR 21 941 17 872 17 499 17 773 18 200 18 167 18 607IS - - - - - - -
NOCH 27 104 19 894 18 339 8 794 8 289 7 869 7 360
Notes: Data relate to main railways (Uic members). (*) Not including private-owners' vehicles; not fully comparable with data from previous years.
DE: includes DE-E: 1970 = 137 984; 1980 = 142 202; 1990 = 163 158.

102 103Sources : Tables 1 .5 , 2 .3 .4 , 2 .6 .2 , 2 .7 .1 and est imates as wel l as nat ional stat ist ics for powered two-wheeler pkm
TRANSPORT
SAFETY 2.7 .2
Road fatalities country Rankings
Sources : From 1991: CARE database (DG Mobi l i ty and Transport ) , Internat ional Transport Forum, nat ional sources . 1990: IRTAD (OECD)
%
1990 2000 2005 2010 2012 2013CHANGE '12 / '13
CHANGE '01 / '13
EU-28 77 337 57 082 45 943 31 490 28 143 25 938 -7.8 -52.8 BE 1 976 1 470 1 089 840 770 723 -6.1 -51.3 BG 1 567 1 012 957 776 601 601 0.0 -40.6 CZ 1 291 1 486 1 286 802 742 655 -11.7 -50.9 DK 634 498 331 255 167 191 14.4 -55.7 DE 11 046 7 503 5 361 3 648 3 600 3 339 -7.3 -52.1 EE 436 204 170 79 87 81 -6.9 -59.3 IE 478 418 400 212 162 190 17.3 -53.9
EL 2 050 2 037 1 658 1 258 988 874 -11.5 -53.5 ES 9 032 5 777 4 442 2 479 1 903 1 680 -11.7 -69.5 FR 11 215 8 079 5 318 3 992 3 653 3 268 -10.5 -60.0 HR 1 360 655 597 426 390 368 -5.6 -43.1
IT 7 151 7 061 5 818 4 114 3 653 3 385 -7.3 -52.3 CY 116 111 102 60 51 44 -13.7 -55.1 LV 947 635 442 218 177 179 1.1 -67.9 LT 933 641 773 299 302 256 -15.2 -63.7 LU 70 76 47 32 34 45 32.4 -35.7
HU 2 432 1 200 1 278 740 606 591 -2.5 -52.3 MT 4 15 17 15 9 18 100.0 12.5 NL 1 376 1 082 750 537 562 476 -15.3 -52.1 AT 1 391 976 768 552 531 455 -14.3 -52.5 PL 7 333 6 294 5 444 3 908 3 571 3 357 -6.0 -39.3 PT 2 646 1 877 1 247 937 718 637 -11.3 -61.9 RO 3 782 2 466 2 629 2 377 2 042 1 861 -8.9 -24.0
SI 517 314 258 138 130 125 -3.8 -55.0 SK 731 628 606 353 352 251 -28.7 -59.1 FI 649 396 379 272 255 258 1.2 -40.4
SE 772 591 440 266 285 260 -8.8 -55.4 UK 5 402 3 580 3 336 1 905 1 802 1 770 -1.8 -50.8 AL 280 307 352 334 295 -11.7 -0.7
ME 95 46 74 60.9 MK 162 143 162 132 198 50.0 85.0 RS 656 668 631 -5.5 TR 6 317 5 510 4 505 4 045 3 750 3 685 -1.7 -16.0 IS 24 32 19 8 9 15 66.7 -37.5
NO 332 341 224 208 145 187 29.0 -32.0 CH 954 592 409 328 339 269 -20.6 -50.6
Notes: persons killed are all persons deceased within 30 days of the accident. corrective factors have been applied to the figures which did not follow this definition.
TRANSPORT
2.7 SAFETY
Road fatalities
2.7 .1
fATAliTiES2013
per million inhabitants per 10 billion pkm
per million passenger cars
SE 27 SE 24 SE 58UK 28 UK 28 UK 59NL 28 NL 33 NL 60DK 34 DK 36 MT 71ES 36 DE 37 ES 76IE 41 IE 40 DE 77
DE 41 FI 40 FI 83MT 43 FR 41 DK 85SK 46 SI 50 IT 91FI 47 ES 53 CY 93
CY 51 IT 55 AT 99FR 51 EU-28 56 IE 99
EU-28 51 AT 61 FR 102AT 54 LU 66 EU-28 105IT 56 BE 66 SI 117
HU 60 EE 72 LU 125SI 61 CY 74 EE 132
PT 61 LT 77 BE 132EE 61 PT 78 SK 136CZ 62 MT 79 CZ 139BE 65 EL 91 PT 142EL 80 SK 92 LT 144
BG 83 CZ 101 EL 170LU 83 HU 114 PL 176HR 86 BG 117 HU 196LT 87 HR 141 BG 210PL 88 LV 153 HR 254LV 89 PL 158 LV 286
RO 93 RO 232 RO 405
Notes: Fatalities: all fatalities on the road: car drivers and passengers, bus and coach occupants, powered two-wheelers’ riders and passengers, cyclists, pedestrians, commercial vehicle drivers, etc. indicated in table 2.7.1 for 2013.
pkm: indicator of traffic volume (in the absence of consistent vehicle-kilometre data); passenger-kilometres of cars indicated in table 2.3.4 for 2013 plus (mostly estimated) passenger-kilometres of motorised two-wheelers.
Inhabitants: the average population at 1 January 2013 and 1 January 2014. Passenger cars: the average stock of vehicles indicated in table 2.6.2 for 2012
and 2013.

104 105
Titlesubtitle
Titlesubtitle
Road fatalities of vehicle Occupants BY TYPE OF VEHICLE
Road fatalities BY TYPE OF USER
2.7 .3b 2 .7 .3a TRANSPORT
SAFETY
TRANSPORT
SAFETY
Source : CARE database (DG Mobi l i ty and Transport ) , nat ional sourcesSource : CARE database (DG Mobi l i ty and Transport ) , nat ional sources
yEAR
TOTA
l
dRi
vER
PASS
ENg
ER
PEd
ESTR
iAN
PEd
ESTR
iAN
AS
A %
O
f TO
TAl
BE 2013 723 516 107 99 13.7
BG 2011 658 310 199 149 22.6
CZ 2013 654 389 103 162 24.8
DK 2013 191 121 37 33 17.3
DE 2013 3 339 2 309 469 561 16.8
EE 2009 98 49 26 23 23.5
IE 2012 162 101 32 29 17.9
EL 2013 879 582 146 151 17.2
ES 2013 1 680 1 018 291 371 22.1
FR 2013 3 268 2 279 524 465 14.2
HR 2013 368 215 84 69 18.8
IT 2013 3 385 2 297 539 549 16.2
CY 2013 44 29 7 8 18.2
LV 2013 179 83 26 70 39.1
LT 2013 256 106 53 96 37.5
LU 2013 45 35 5 5 11.1
HU 2013 591 325 119 147 24.9
MT 2011 21 12 0 9 42.9
NL 2013 476 382 43 51 10.7
AT 2012 531 374 76 81 15.3
PL 2012 3 571 1 756 658 1 157 32.4
PT 2013 637 387 106 144 22.6
RO 2013 1 861 720 415 726 39.0
SI 2012 130 92 19 19 14.6
SK 2010 371 170 75 126 34.0
FI 2013 258 181 43 34 13.2
SE 2013 260 171 42 42 16.2
UK 2013 1 770 1 078 287 405 22.9
Notes: persons deceased within 30 days of their accident. in this table the totals exclude the victims which were labelled as ‘Unknown’. ‘Driver’ includes cyclists.
yEAR
TOTA
l
cAR
ANd
TAX
i
bUS
OR
cOAc
H
HEA
vy g
OO
dS
vE
Hic
lE
lORR
y,
<3.5
TO
NN
ES
mO
TORc
yclE
mO
PEd
PEd
Al c
yclE
AgRi
cUlT
URA
l TR
AcTO
R
OTH
ER O
R U
NkN
Ow
N
BE 2013 624 340 5 13 34 102 13 73 2 42
BG 2009 703 570 5 33 48 5 29 1 12
CZ 2013 492 308 2 19 15 66 6 74 1 1
DK 2013 157 79 0 1 17 15 11 33 0 1
DE 2013 2 778 1 588 11 148 568 73 354 12 24
EE 2009 75 54 2 6 0 2 3 7 0 1
IE 2012 133 89 1 2 10 19 8 4
EL 2013 728 347 2 7 38 271 25 15 17 6
ES 2013 1 308 716 11 43 69 302 56 70 17 24
FR 2013 2 803 1 615 7 57 132 658 159 147 7 21
HR 2013 299 195 1 2 2 49 14 23 12 1
IT 2013 2 836 1 483 48 43 101 724 125 251 24 37
CY 2013 36 16 0 2 1 15 0 2 0 0
LV 2013 109 71 1 3 5 10 3 13 2 1
LT 2009 259 183 0 2 0 30 5 30 0 9
LU 2013 40 30 0 2 0 8 0 0 0
HU 2013 444 254 6 13 17 58 24 68 4
MT 2010 13 9 0 0 0 3 0 0 1
NL 2013 425 180 0 7 15 29 41 112 0 41
AT 2013 373 194 0 6 15 87 15 52 4 0
PL 2013 2 217 1 448 18 90 - 253 62 306 23 17
PT 2013 493 214 11 18 61 78 51 29 21 10
RO 2013 1 135 721 8 18 61 52 39 161 6 69
SI 2013 105 40 0 1 5 17 4 16 3 19
SK 2010 245 171 0 19 1 27 27 0
FI 2013 224 152 1 6 9 24 5 20 4 3
SE 2013 218 144 1 5 5 40 3 14 1 5
UK 2013 1 365 815 12 22 39 337 4 113 5 18
Note: persons deceased within 30 days of their accident.

106 107
Road Accidents Railway fatalities
2.7 .5 2 .7 .4 TRANSPORT
SAFETY
TRANSPORT
SAFETY
NUmbER Of AccidENTS iNvOlviNg PERSONAl iNJURy 1 000 %
1990 1995 2000 2005 2010 2012 2013 CHA
NG
E '1
2 / '
13
EU-28 1 502.08 1 433.020 1 505.653 1 341.981 1 130.484 1 079.825 1 054.744 -2.3
BE 62.45 50.744 49.065 49.307 40.569 37.478 35.632 -4.9BG 6.48 7.435 6.886 8.224 6.610 6.717 6.859 2.1CZ 21.91 28.746 25.445 25.239 19.675 20.503 20.342 -0.8DK 9.16 8.373 7.346 5.413 3.498 3.124 2.985 -4.4DE 389.35 388.003 382.949 336.618 288.297 299.637 291.105 -2.8EE 2.10 1.644 1.504 2.341 1.347 1.383 1.382 -0.1IE 6.07 8.117 7.749 6.533 5.779 5.610 5.865 4.5
EL 19.61 22.798 23.001 16.914 15.032 12.398 12.072 -2.6ES 101.51 83.586 101.729 91.187 85.503 83.115 89.519 7.7FR 162.57 132.949 121.223 84.525 67.288 60.437 56.812 -6.0HR 14.47 12.668 14.430 15.679 13.274 11.774 11.228 -4.6
IT 161.78 182.761 256.546 240.011 211.404 188.228 181.227 -3.7CY 3.17 3.052 2.411 1.382 1.198 0.919 0.774 -15.8LV 4.33 4.056 4.482 9.310 3.193 3.358 3.489 3.9LT 5.14 4.144 5.807 6.772 3.530 3.392 3.418 0.8LU 1.22 1.145 0.899 0.775 0.787 1.019 0.949 -6.9
HU 27.80 19.817 17.493 20.777 16.308 15.174 15.691 3.4MT 0.24 0.969 1.253 0.848 0.577 0.348 0.314 -9.8NL 44.89 42.641 42.271 27.007 12.457 4.968 9.522 -AT 46.34 38.956 42.126 40.896 35.348 40.831 38.502 -5.7PL 50.53 56.904 57.331 48.100 38.832 37.046 35.847 -3.2PT 45.11 48.339 44.463 37.066 35.426 29.867 30.339 1.6RO 9.71 9.119 7.889 19.819 25.995 26.928 24.827 -7.8
SI 5.18 6.567 8.951 10.509 7.659 6.857 6.559 -4.3SK 8.24 8.713 7.884 7.903 8.119 5.007 4.729 -5.6FI 10.18 7.812 6.633 7.020 6.072 5.725 5.334 -6.8
SE 16.98 15.626 15.770 18.094 16.627 16.636 14.942 -10.2UK 265.60 237.336 242.117 203.712 160.080 151.346 144.480 -4.5AL 0.399 0.428 0.853 1.564 1.87 2.075 11.0
ME 9.14 8.10 5.264 -35.0MK 2.30 2.44 1.67 2.82 4.22 4.11 4.23 3.0RS 14.18 13.19 13.42 1.8TR 55.77 66.03 75.20 87.27 116.80 153.55 161.31 5.0IS 0.56 1.06 0.98 0.67 0.88 0.74 0.81 8.9
NO 8.80 8.63 8.44 8.08 6.43 6.15 5.24 -14.8CH 23.83 23.03 23.74 21.71 19.61 18.15 17.47 -3.7
Note: the definition of an accident involving personal injury differs from country to country.
Sources : CARE, United Nat ions (Stat ist ics of road traff ic acc idents) , nat ional stat ist ics
Sources: European Rai lway Agency (from 2006 onward for EU MS and NO), Eurostat , Union Internat ionale des Chemins de Fer, national statist ics
NUmbER Of RAilwAy PASSENgERS killEd iN AccidENTS iNvOlviNg RAilwAy
1990 2000 2005 2006 2007 2008 2009 2010 2011 2012 2013
EU-28 66 83 73 89 48 63 38 36 97BE 0 3 0 4 9 2 2 18 0 0 0BG 3 1 2 12 1 0 1 1 0CZ 1 4 4 0 13 1 2 5 2 0DK 1 3 0 0 0 0 0 0 0 1 0DE 50 38 7 18 3 1 3 0 9 3 0EE 0 0 0 0 0 0 0 0IE 1 2 0 0 0 0 0 0 0 0 0
EL 0 20 0 3 0 1 0 1 0 0 0ES 4 0 1 9 13 5 2 15 2 4 79FR 30 15 5 12 9 10 7 2 7 2 4HR 1 0 3 0 11 1 0 0 0
IT 9 8 22 5 5 4 5 7 0 2 2CY - - - - - - - - - - -LV 0 0 0 0 1 0 0 0 0LT 0 0 0 0 0 0 0 0 0LU 0 0 0 0 0 0 0 0
HU 33 11 6 4 14 10 0 3 3 3 4MT - - - - - - - - - - -NL 2 0 0 1 0 1 0 0 0 1 0AT 6 4 1 0 1 2 1 0 0 0 0PL 21 20 0 9 9 8 8 7 10 15 6PT 22 2 7 0 1 3 0 1 0 0 1RO 0 1 8 0 15 4 4 0 1 1
SI 0 0 0 0 0 0 0 0 0 0SK 0 0 4 1 2 2 0 1 1 0FI 0 2 0 1 0 0 0 0 0 0 0
SE 3 0 0 0 0 0 0 2 0 0 0UK 37 20 8 0 3 0 0 0 0 0 0AL
ME 0MK 0 0 0 2 2 0 0 0 0RSTR 17 9 10 6 1 9 7 3 1 3 1IS - - - - - - - - - - -
NO 4 32 0 1 0 0 0 0 0 0 0CH 8 2 3 0 0 0 1 2 1 0 0

108 109
Titlesubtitle
Titlesubtitle
2.7 .7 2 .7 .6
Sea: SHIPS LOST (WORLD)
Air: LIVES LOST
TRANSPORT
SAFETY
TRANSPORT
SAFETY
PERiOdlives lost over EU-28
territory by any operatorlives lost by EU-28 operators anywhere
1990 0 471991 41 2781992 154 1431993 16 161994 9 51995 133 1211996 20 41997 71 11998 19 621999 46 662000 113 1132001 122 1252002 101 252003 5 52004 0 02005 144 1252006 5 62007 0 02008 154 1542009 9 2282010 0 02011 6 62012 8 02013 0 02014 0 120
1970–1979/yr. 312 3281980–1989/yr. 179 1281990–1999/yr. 51 742000–2009/yr. 65 782010–2014/yr. 3 25
Notes: onboard fatalities, and only those in aircraft with a take-off mass above 5 701 kg.Data include fatalities from commercial air transport (passenger, cargo, air taxi, ferry/positioning and emergency medical service) and fatalities from General aviation (only ‘business’ flights).
Source : European Aviat ion Safety Agency Sources : Inst i tute for Shipping Economics and Logist ics , Bremen
yEAR TANkERSbUlkERS ANd
cOmbiNEd cARRiERS OTHER SHiPSN° 1 000 gt N° 1 000 gt N° 1 000 gt
1996 13 58 14 247 59 294 1997 13 308 6 137 58 274 1998 5 26 11 160 62 323 1999 6 71 11 277 55 283 2000 10 173 21 394 68 248 2001 9 202 12 341 88 319 2002 10 119 10 234 77 454 2003 9 158 8 107 74 274 2004 18 104 6 103 62 277 2005 11 103 8 117 79 309 2006 11 35 9 397 70 294 2007 6 34 11 197 70 311 2008 9 105 7 105 55 259 2009 14 214 15 335 67 353 2010 12 35 16 431 82 375 2011 8 102 20 452 56 281 2012 12 93 4 83 43 314 2013 3 10 11 257 46 291 2014 2 4 - - 15 66
Notes: Reported world total losses at time of loss; ships of 500 gt and over. 2014 values refer to mid-year.

TitlesubtitlePART 3
Energy and
environment
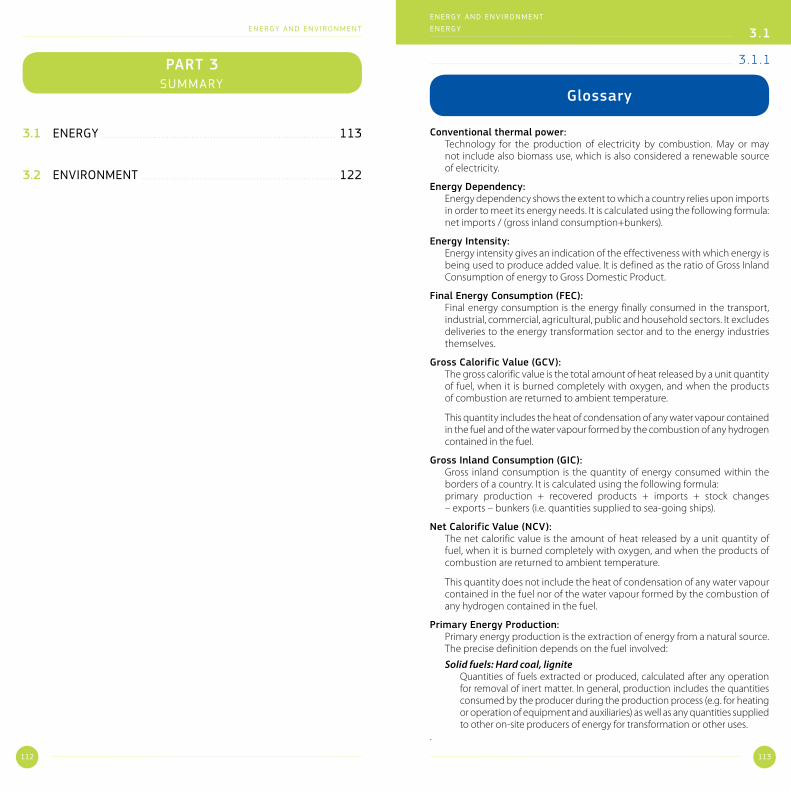
112 113
ENERGY AND ENVIRONMENT
glossary
conventional thermal power: Technology for the production of electricity by combustion. May or may
not include also biomass use, which is also considered a renewable source of electricity.
Energy dependency: Energy dependency shows the extent to which a country relies upon imports
in order to meet its energy needs. It is calculated using the following formula: net imports / (gross inland consumption+bunkers).
Energy intensity: Energy intensity gives an indication of the effectiveness with which energy is
being used to produce added value. It is defined as the ratio of Gross Inland Consumption of energy to Gross Domestic Product.
final Energy consumption (fEc): Final energy consumption is the energy finally consumed in the transport,
industrial, commercial, agricultural, public and household sectors. It excludes deliveries to the energy transformation sector and to the energy industries themselves.
gross calorific value (gcv): The gross calorific value is the total amount of heat released by a unit quantity
of fuel, when it is burned completely with oxygen, and when the products of combustion are returned to ambient temperature.
This quantity includes the heat of condensation of any water vapour contained in the fuel and of the water vapour formed by the combustion of any hydrogen contained in the fuel.
gross inland consumption (gic): Gross inland consumption is the quantity of energy consumed within the
borders of a country. It is calculated using the following formula: primary production + recovered products + imports + stock changes
– exports – bunkers (i.e. quantities supplied to sea-going ships).
Net calorific value (Ncv): The net calorific value is the amount of heat released by a unit quantity of
fuel, when it is burned completely with oxygen, and when the products of combustion are returned to ambient temperature.
This quantity does not include the heat of condensation of any water vapour contained in the fuel nor of the water vapour formed by the combustion of any hydrogen contained in the fuel.
Primary Energy Production: Primary energy production is the extraction of energy from a natural source.
The precise definition depends on the fuel involved:
Solid fuels: Hard coal, lignite Quantities of fuels extracted or produced, calculated after any operation
for removal of inert matter. In general, production includes the quantities consumed by the producer during the production process (e.g. for heating or operation of equipment and auxiliaries) as well as any quantities supplied to other on-site producers of energy for transformation or other uses.
.
3.1 ENERGY . . . . . . . . . . . . . . . . . . . . . . . . . . . . . . . . . . . . . . . . . . . . . . . . . . . . . . . . . . . . . . . . . . . . . . . . . . . . . . . . . . . . . . 113
3.2 ENVIRONMENT . . . . . . . . . . . . . . . . . . . . . . . . . . . . . . . . . . . . . . . . . . . . . . . . . . . . . . . . . . . . . . . . . . . . . . . 122
3.1 .1
ENERGY AND ENVIRONMENT
3.1 ENERGY
PART 3SUMMARY

ENERGY AND ENVIRONMENT
ENERGY
ENERGY AND ENVIRONMENT
ENERGY
114 115
Titlesubtitle
Titlesubtitle
3.1 .2 3 .1 .1
Average calorific values – Energy contentglossary
kJ (NCV) kgoe (NCV)
Hard coal 1 kg 17 200 – 30 700 0.411 – 0.733
Recovered hard coal 1 kg 13 800 – 28 300 0.330 – 0.676
Patent fuels 1 kg 26 800 – 31 400 0.640 – 0.750
Hard coke 1 kg 28 500 0.681
brown coal 1 kg 5 600 – 10 500 0.134 – 0.251
black lignite 1 kg 10 500 – 21 000 0.251 – 0.502
Peat 1 kg 7 800 – 13 800 0.186 – 0.330
brown coal briquettes 1 kg 20 000 0.478
Tar 1 kg 37 700 0.900
benzol 1 kg 39 500 0.943
Oil equivalent 1 kg 41 868 1
crude oil 1 kg 41 600 – 42 800 0.994 – 1.022
feedstocks 1 kg 42 500 1.015
Refinery gas 1 kg 50 000 1.194
lPg 1 kg 46 000 1.099
motor spirit 1 kg 44 000 1.051
kerosenes, jet fuels 1 kg 43 000 1.027
Naphtha 1 kg 44 000 1.051
gas diesel oil 1 kg 42 300 1.010
Residual fuel oil 1 kg 40 000 0.955
white spirit 1 kg 44 000 1.051
lubricants 1 kg 42 300 1.010
bitumen 1 kg 37 700 0.900
Petroleum cokes 1 kg 31 400 0.750
Other petro. products 1 kg 30 000 0.717
Electrical energy 1 kWh 3 600 0.086
Crude oil: Quantities of fuels extracted or produced within national boundaries,
including off-shore production. Production includes only marketable production, and excludes any quantities returned to formation. Production includes all crude oil, natural gas liquids (NGL), condensates and oil from shale and tar sands, etc.
Natural gas: Quantities of dry gas, measured after purification and extraction of
natural gas liquids and sulphur. The production includes only marketable production, and excludes any quantities re-injected, vented and flared, and any extraction losses. The production includes all quantities used within the natural gas industry, in gas extraction, pipeline systems and processing plants.
Nuclear heat: Quantities of heat produced in a reactor. Production is the actual heat
produced or the heat calculated on the basis of the gross electricity generated and the thermal efficiency of the nuclear plant.
Hydropower, Wind energy, Solar photovoltaic energy: Quantities of electricity generated. Production is calculated on the basis
of the gross electricity generated and a conversion factor of 3600 kJ/kWh.
Geothermal energy: Quantities of heat extracted from geothermal fluids. Production is
calculated on the basis of the difference between the enthalpy of the fluid produced in the production borehole and that of the fluid disposed of via the re-injection borehole.
Biomass / Wastes: In the case of municipal solid wastes (MSW), wood, wood wastes and
other solid wastes, production is the heat produced after combustion and corresponds to the heat content (NCV) of the fuel. In the case of anaerobic digestion of wet wastes, production is the heat content (NCV) of the biogases produced. The production includes all quantities of gas consumed in the installation for the fermentation processes, and excludes all quantities of flared gases. In the case of biofuels, the production is the heat content (NCV) of the fuel.
Pumping, pumped storage: Method for storing electrical energy at hydroelectric installations by pumping
water between reservoirs at different altitudes.
Renewable Energy Sources (RES): Renewable energy includes hydroelectricity, biomass, wind, solar, tidal and
geothermal energy.
Tonne of oil equivalent (toe): The tonne of oil equivalent is a conventional standardised unit for measuring
energy, defined on the basis of a tonne of oil with a net calorific value of 41 868 kilojoules/kg.
1 ktoe = 1 000 toe1 Mtoe = 1 000 000 toe

ENERGY AND ENVIRONMENT
ENERGY
ENERGY AND ENVIRONMENT
ENERGY
116 117
Titlesubtitle
Titlesubtitle
Energy Statistics for EU-28conversion factors
3.1 .4 3 .1 .3
Mtoe 1990 1995 2000 2005 2010 2012 2013Production (*) 947.1 964.9 946.8 906.5 845.5 810.5 804.2
Solid fuels 369.1 279.8 214.6 196.0 164.8 167.5 156.5Oil 132.9 177.5 175.7 138.0 109.9 89.9 85.5Gas 165.1 191.4 209.4 190.8 159.9 133.4 132.0Nuclear 205.2 227.3 243.8 257.5 236.6 227.7 226.3Renewables 71.0 83.2 97.1 116.3 163.3 180.1 192.0Industrial waste 3.8 5.7 6.1 7.8 11.0 11.7 11.9
Net Imports 753.5 734.4 826.3 979.7 955.0 923.6 909.0Solid fuels 81.3 78.4 98.3 125.4 111.8 124.3 126.6Oil 532.5 508.4 532.2 597.5 558.8 532.0 523.6Gas 135.6 145.5 193.4 254.1 278.0 258.8 252.6Electricity 3.9 1.8 2.0 1.4 0.7 1.6 1.1Renewables 0.2 0.3 0.3 1.4 5.6 6.8 4.9Other (**) 0.0 0.0 0.0 0.0 0.0 0.1 0.2
Gross Inland Consumption 1 667.3 1 671.1 1 726.8 1 824.7 1 760.6 1 686.1 1 666.3Solid fuels 454.9 365.0 321.3 318.1 283.0 294.2 286.5Oil 630.0 651.7 660.0 677.0 613.0 570.3 556.6Gas 298.1 336.1 396.1 445.3 447.4 393.4 386.9Nuclear 205.2 227.3 243.8 257.5 236.6 227.7 226.3Renewables 71.3 83.5 97.5 117.6 168.9 186.9 196.8Other (***) 7.7 7.5 8.1 9.2 11.7 13.5 13.3
Elec. Generation (TWh) 2 594.8 2 743.0 3 035.2 3 325.1 3 364.4 3 296.6 3 261.5
Final Energy Consumption 1 080.0 1 078.8 1 130.6 1 186.4 1 157.2 1 102.4 1 103.8by fuel/product
Solid fuels 124.3 83.0 62.0 54.0 49.8 48.1 47.6Oil 446.4 464.2 489.7 502.6 457.4 429.2 425.0Gas 229.9 247.2 267.6 281.2 273.2 252.1 259.8Electricity 186.0 194.3 217.6 239.5 244.5 240.5 238.3Renewables 38.1 43.2 48.1 55.3 76.9 81.5 82.2Other (**) 55.2 47.0 45.6 53.8 55.5 51.0 50.9
by sectorINDUSTRY 367.6 329.5 331.9 326.9 285.7 274.6 276.6TRANSPORT 284.2 306.8 345.2 369.5 364.6 352.0 348.5
Rail 8.3 8.3 8.2 7.6 7.1 7.0 6.7Road 238.0 256.2 283.8 301.6 299.8 287.2 285.0International aviation 24.1 29.5 38.5 43.4 43.0 43.5 43.8Domestic aviation 5.6 4.8 6.5 6.7 6.4 5.6 5.2Domestic navigation 6.4 6.2 6.1 6.8 5.7 4.9 4.6Consumption in pipeline transport, etc. 1.9 1.8 2.1 3.5 2.7 3.7 3.3
HOUSEHOLDS 273.6 283.6 294.4 305.5 311.1 293.8 295.9AGRICULTURE 32.6 31.6 28.8 28.3 25.6 24.8 25.0SERVICES, ETC. 121.9 127.4 130.3 156.2 170.2 157.3 157.7
CO2 Emissions (Mt) (****) 4 615.4 4 365.2 4 384.3 4 558.7 4 193.6 3 995.0Energy intensity (toe/M€ '10) 173 174 155 149 138 130 129CO2 intensity (tCO2/toe) 2.77 2.61 2.54 2.50 2.38 2.37Import dependency, % 44.3 43.0 46.7 52.2 52.8 53.3 53.2RES share in transport, % (*****) 1.41 4.78 5.06 5.35
Notes: (*) including recovered products. (**) Derived heat and industrial waste. (***) electrical energy and industrial waste. (****) Source: european environment agency, June 2014, including bunkers. (*****) Renewables share in transport, according to the definition in the Directive 2009/28/ec
of the european parliament and of the council of 23 april 2009 on the promotion of the use of energy from renewable sources. From 2011, only formally reported compliant biofuels in line with Directive 2009/28/ec are considered for the ReS share in transport calculations whereas before 2011 all biofuels are accounted.
ENERgy
fROm: TO: TJ gcal mtoe gwhTJ 1 238.8 2.388 x 10 -5 0.2778
gcal 4.1868 x 10 -3 1 1 x 10 -7 1.163 x 10 -3
mtoe 4.1868 x 10 4 1 x 10 7 1 11 630
gwh 3.6 860 8.6 x 10 -5 1
vOlUmE
fROm: TO: barrel litre US gallon Uk gallonbarrel 1 158.99 42 34.9723
litre 0.6290 x 10 -2 1 0.2642 0.2200
US gallon 0.2381 x 10 -1 3.7854 1 0.8327
Uk gallon 0.2859 x 10 -1 4.5461 1.2009 1
mASS
fROm: TO: Tonne long ton Short tonTonne (t) 1 0.9842 1.1023
long ton (lt) Uk 1.0160 1 1.1200
Short ton (st) US 0.9072 0.8929 1
dEcimAl PREfiXES10 1 deca (da) 10 -1 deci (d)
10 2 hecto (h) 10 -2 centi (c)
10 3 kilo (k) 10 -3 milli (m)
10 6 mega (M) 10 -6 micro (µ)
10 9 giga (G) 10 -9 nano (n)
10 12 tera (T) 10 -12 pico (p)
10 15 peta (P) 10 -15 femto (f )
10 18 exa (E) 10 -18 atto (a)
Source : Eurostat , June 2015

ENERGY AND ENVIRONMENT
ENERGY
ENERGY AND ENVIRONMENT
ENERGY
118 119
Titlesubtitle
Titlesubtitle
Mtoe
1 200
1 100
1 000
900
800
700
600
500
400
300
200
100
0
1990
1991
1992
1993
1994
1995
1996
1997
1998
1999
2000
2001
2002
2003
2004
2005
2006
2007
2008
2009
2010
2011
2012
2013
Note: Renewables not including electricity.
3 .1 .5 3 .1 .5
final Energy consumption – EU-28 BY SECTOR (Mtoe)
final Energy consumption BY SECTOR 2013 (Mtoe)
Source : Eurostat , June 2015
All
SEcT
ORS
iNd
UST
Ry
TRAN
SPO
RT
Road
Railw
ays
Air
dom
estic
na
viga
tion
cons
umpt
ion
in p
ipel
ine
trans
port,
etc
.
HO
USE
HO
ldS,
SE
Rvic
ES, E
Tc.
Hou
seho
lds
Agri
cult
ure
Serv
ices
, etc
.
EU-28 1 103.8 276.6 348.5 285.0 6.7 49.0 4.6 3.3 478.6 295.9 25.0 157.7
Share 100 % 25 % 32 % 82 % 2 % 14 % 1 % 1 % 43 % 62 % 5 % 33 %
BE 34.8 10.5 9.8 8.1 0.2 1.3 0.2 0.1 14.6 9.0 0.7 4.9
BG 8.8 2.6 2.8 2.4 0.0 0.2 0.2 3.4 2.2 0.2 1.0
CZ 23.9 7.5 6.0 5.4 0.2 0.3 0.0 0.1 10.3 6.3 0.6 3.4
DK 14.2 2.2 4.8 3.6 0.1 0.9 0.1 0.0 7.2 4.3 0.9 2.0
DE 217.3 60.7 62.6 51.6 1.4 9.0 0.3 0.3 93.9 59.7 34.2
EE 2.9 0.6 0.8 0.7 0.0 0.0 0.0 0.0 1.5 0.9 0.1 0.4
IE 10.7 2.2 4.2 3.5 0.0 0.6 0.0 0.0 4.3 2.8 0.2 1.3
EL 15.3 2.8 6.3 5.0 0.0 0.9 0.4 0.0 6.2 3.8 0.3 2.1
ES 81.1 21.0 32.0 25.4 0.5 5.1 0.5 0.5 28.2 15.0 2.8 10.4
FR 152.1 30.0 49.3 41.0 0.9 6.5 0.5 0.3 72.8 43.7 4.6 24.5
HR 5.8 1.1 2.0 1.8 0.0 0.1 0.0 0.0 2.7 1.7 0.2 0.7
IT 118.7 27.0 38.7 32.9 0.5 3.7 1.0 0.7 53.0 34.2 2.8 16.0
CY 1.6 0.2 0.9 0.6 0.2 0.6 0.3 0.0 0.2
LV 3.9 0.8 1.1 0.9 0.1 0.1 0.0 0.0 2.0 1.3 0.2 0.6
LT 4.7 1.0 1.6 1.4 0.1 0.1 0.0 0.0 2.2 1.5 0.1 0.6
LU 4.1 0.5 2.5 2.2 0.0 0.4 1.0 0.5 0.0 0.6
HU 15.0 3.5 3.7 3.3 0.2 0.2 0.0 0.0 7.8 4.8 0.5 2.5
MT 0.5 0.0 0.3 0.2 0.1 0.0 0.2 0.1 0.0 0.1
NL 51.2 13.6 14.6 10.6 0.2 3.5 0.3 23.0 10.8 3.5 8.8
AT 27.9 9.3 8.9 7.6 0.2 0.7 0.0 0.4 9.8 6.6 0.6 2.6
PL 63.4 15.1 16.3 15.0 0.3 0.5 0.0 0.4 32.0 20.4 3.6 8.1
PT 15.8 4.6 6.4 5.2 0.0 1.1 0.1 0.0 4.9 2.6 0.4 1.8
RO 21.8 6.3 5.3 4.8 0.3 0.2 0.0 0.0 10.2 7.7 0.5 2.0
SI 4.8 1.2 1.9 1.8 0.0 0.0 0.0 1.7 1.2 0.1 0.5
SK 10.9 4.3 2.4 2.0 0.0 0.0 0.2 4.2 2.1 0.1 2.0
FI 24.6 10.8 4.8 3.9 0.1 0.7 0.1 0.0 9.0 5.1 0.8 3.1
SE 31.6 11.5 8.3 7.1 0.2 0.9 0.1 11.8 7.0 0.4 4.4
UK 136.4 25.7 50.5 37.0 1.0 11.6 0.8 60.2 40.2 0.9 19.2
MK 1.8 0.6 0.5 0.5 0.0 0.0 0.7 0.5 0.0 0.2
TR 82.9 26.7 20.7 18.1 0.2 1.5 0.7 0.2 35.5 20.9 4.4 10.2
IS
NO 18.8 5.9 5.3 3.5 0.1 0.9 0.7 0.1 7.6 3.9 0.8 2.8
CH
INDUSTRY
TRANSPORT
HOUSEHOLDS AND SERVICES, ETC.
AGRICULTURE
YEAR 2013
25.1 %
31.6 %
41.1 %
2.3 %
Source : Eurostat , June 2015

ENERGY AND ENVIRONMENT
ENERGY
ENERGY AND ENVIRONMENT
ENERGY
120 121
Titlesubtitle
Titlesubtitle
3.1 .7 3 .1 .6
biofuels Production BY FUEL 2013 (ktoe)
final consumption of motor gasoline, diesel and biofuels for Transport – BY FUEL 2013 (ktoe)
fiN
Al c
ON
SUm
PTiO
N
Of
mO
TOR
gAS
Oli
NE
ANd
diE
SEl
fO
R TR
ANSP
ORT
(*)
mot
or g
asol
ine
gas
/ d
iese
l Oil
biO
fUEl
S
biog
asol
ine
biod
iese
l
Oth
er li
quid
bi
ofue
ls (*
*)
EU-28 270 965.2 79 337.1 191 628.1 13 014.2 2 716.8 10 292.7 4.6BE 7 918.3 1 192.5 6 725.8 329.3 48.0 281.3BG 1 829.6 442.4 1 387.2 104.3 8.4 95.9CZ 5 158.2 1 573.9 3 584.3 277.1 53.5 223.6DK 3 626.6 1 335.9 2 290.6 226.6 226.6DE 48 773.4 17 590.7 31 182.7 2 658.4 765.1 1 892.7 0.5EE 724.6 240.7 483.9 3.2 3.2IE 3 468.3 1 186.4 2 281.9 72.4 27.8 44.6
EL 4 877.5 2 834.4 2 043.1 121.3 121.3ES 25 285.1 4 666.1 20 619.0 883.4 167.1 716.3FR 38 725.5 6 739.1 31 986.5 2 690.2 391.8 2 298.5HR 1 789.1 601.7 1 187.4 32.7 1.3 31.5
IT 29 834.3 8 399.0 21 435.3 1 250.6 74.3 1 176.2CY 606.5 369.3 237.2 15.0 15.0LV 852.4 210.0 642.4 21.5 6.4 15.1LT 1 262.1 209.7 1 052.4 57.7 6.4 51.3LU 2 098.7 327.0 1 771.7 55.4 0.6 54.6 0.1
HU 3 218.9 1 192.5 2 026.4 143.2 37.5 105.7MT 171.5 73.9 97.6 3.1 3.1NL 10 259.5 3 955.7 6 303.8 319.5 125.1 194.4AT 7 141.0 1 560.8 5 580.2 489.7 66.9 422.8PL 12 590.1 3 659.7 8 930.4 747.5 144.1 603.4PT 4 898.6 1 147.6 3 751.0 264.1 4.7 255.4 4.0RO 4 736.2 1 267.8 3 468.4 178.1 56.1 122.0
SI 1 750.7 484.9 1 265.7 61.5 5.7 55.8SK 1 915.9 562.7 1 353.2 99.1 17.8 81.3FI 3 822.4 1 400.9 2 421.6 220.5 65.6 154.8
SE 6 407.9 2 661.7 3 746.1 630.8 179.9 450.9UK 37 222.3 13 450.1 23 772.3 1 058.0 459.3 598.7MK 446.3 117.3 329.0 0.9 0.9TR 15 127.8 1 922.4 13 205.4 372.0 23.0 349.0IS
NO 4 086.0 973.0 3 113.0 123.1 6.4 114.3 2.5CH
Notes: (*) Without bio components. (**) liquid biofuels, used directly as fuel, not included in biogasoline or biodiesel.
TOTAl biogasoline biodieselOther liquid biofuels (*)
EU-28 12 841.1 2 580.8 9 868.5 391.7
BE 442.8 155.2 265.1 22.5
BG 47.1 8.0 39.1
CZ 228.0 67.4 160.6
DK 99.5 79.9 19.6
DE 3 156.0 405.7 2 667.7 82.6
EE
IE 21.8 21.8
EL 137.9 137.9
ES 877.4 231.2 646.2
FR 2 433.1 507.1 1 926.0
HR 29.6 29.6
IT 549.3 51.0 405.8 92.5
CY 1.6 1.6
LV 60.4 1.7 58.7
LT 118.3 14.6 103.7
LU
HU 305.4 180.0 125.4
MT 1.0 1.0
NL 1 482.1 267.0 1 215.1
AT 229.2 74.7 154.2 0.3
PL 700.2 121.8 578.2 0.2
PT 274.4 264.6 9.8
RO 147.2 26.5 120.8
SI 1.5 1.5
SK 147.6 52.8 94.8
FI 364.8 14.4 315.8 34.6
SE 456.4 107.9 218.9 129.6
UK 528.5 294.0 234.5
MK
TR 43.6 22.9 20.7
IS
NO 34.8 28.6 6.2
CH
Note: (*) liquid biofuels, used directly as fuel, not included in biogasoline or biodiesel.
Source : Eurostat , June 2015 Source : Eurostat , June 2015

122 123
Titlesubtitle
ENERGY AND ENVIRONMENT
ENVIRONMENT 3.2 .2
gHg Emissions from TransportMILLION TONNES CO2 EQUIVALENTTotal greenhouse gas Emissions (gHg) (*)
MILLION TONNES CO2 EQUIVALENT
1990 2000 2005 2010 2011 2012EU-28 5 626.3 5 121.7 5 178.2 4 751.1 4 603.2 4 544.2
BE 143.0 145.9 142.1 130.6 120.1 116.5BG 109.1 59.5 63.7 60.3 66.0 61.0CZ 196.1 146.3 146.0 137.0 135.3 131.5DK 68.7 68.5 64.1 61.4 56.5 51.6DE 1 248.0 1 040.4 994.5 946.4 928.7 939.1EE 40.6 17.2 18.4 19.9 20.5 19.2IE 55.2 68.2 69.7 61.9 57.7 58.5
EL 104.9 126.6 135.3 117.9 114.7 111.0ES 283.7 380.0 431.4 347.2 345.9 340.8FR 557.4 560.5 558.8 516.4 490.0 490.1HR 31.9 26.6 30.7 28.9 28.5 26.4
IT 519.1 551.2 574.3 499.4 486.6 460.1CY 6.1 8.9 9.9 10.0 9.7 9.3LV 26.2 10.0 11.1 12.0 11.1 11.0LT 48.7 19.6 23.3 21.1 21.7 21.6LU 12.9 9.8 13.1 12.2 12.1 11.8
HU 97.6 76.5 78.4 67.6 66.0 62.0MT 2.0 2.6 3.0 3.0 3.0 3.1NL 211.8 213.0 209.4 209.3 195.1 191.7AT 78.1 80.3 92.6 84.8 82.8 80.1PL 466.4 396.1 398.8 407.5 405.7 399.3PT 60.8 84.1 87.7 70.6 69.3 68.8RO 247.7 134.1 141.3 115.8 121.5 118.8
SI 18.4 19.0 20.3 19.4 19.5 18.9SK 73.2 48.9 50.3 45.4 44.7 42.7FI 70.3 69.2 68.6 74.4 66.9 61.0
SE 72.7 68.6 66.9 65.1 60.8 57.6UK 775.5 690.2 674.7 605.6 562.8 580.8MKTR 188.4 298.1 330.7 403.5 424.1 439.9IS 3.5 3.9 3.9 4.6 4.4 4.5
NO 50.4 54.1 54.5 54.3 53.3 52.7CH 52.9 51.8 54.2 54.1 50.0 51.4
Notes: emissions data are downloaded from the european environment agency (eea), which is the main provider of eU-wide greenhouse gas emissions data. eea prepares and maintains the complete eU greenhouse gas emissions inventory, which is based on data reported by Member States through the eU greenhouse gas monitoring mechanism and the UNFccc process.
GHGs: carbon dioxide (co2), methane (cH4), nitrous oxide (N2o), sulphur hexafluoride (SF6), hydrofluorocarbons (HFc), perfluorocarbons (pFc). (*) excluding international bunkers and lUlUcF (land Use, land-Use change and Forestry) emissions.
iNclUdiNg iNTERNATiONAl bUNkERS (*)
1990 2000 2005 2010 2011 2012EU-28 962.6 1 168.6 1 270.0 1 224.5 1 223.2 1 173.3
BE 37.1 45.5 54.8 55.9 53.3 48.6BG 7.8 6.2 8.6 8.8 8.9 9.1CZ 8.3 13.0 19.0 18.5 18.3 17.9DK 15.6 18.8 18.3 17.8 17.5 16.3DE 184.9 209.8 193.1 188.7 189.6 189.3EE 3.1 2.1 2.7 3.1 3.0 2.9IE 6.3 13.1 16.0 14.4 13.7 13.1
EL 25.3 33.2 33.4 33.3 31.2 26.1ES 76.4 116.7 140.8 131.7 128.4 121.2FR 137.9 164.0 165.9 157.1 159.2 156.9HR 4.6 4.8 6.0 6.3 6.2 6.0
IT 111.7 134.8 143.6 135.0 134.5 121.1CY 2.1 3.2 3.9 3.7 3.8 3.5LV 4.8 2.3 4.1 4.5 4.0 4.0LT 8.2 3.8 5.0 5.1 5.1 5.1LU 3.1 5.8 8.3 7.7 8.1 7.6
HU 9.0 9.8 12.7 12.4 12.1 11.3MT 0.8 2.1 4.6 4.3 5.2 4.6NL 65.3 85.4 100.1 88.5 94.1 87.7AT 15.0 20.7 27.1 24.6 24.0 23.8PL 22.5 29.4 37.0 49.9 50.3 49.0PT 13.2 23.1 23.7 23.2 22.2 21.9RO 13.5 10.2 13.1 14.8 15.0 15.5
SI 2.8 3.9 4.6 5.4 5.9 6.0SK 5.2 4.3 6.4 6.8 6.5 6.7FI 15.6 16.0 16.6 15.8 15.8 15.0
SE 22.9 26.6 30.2 29.8 28.6 27.2UK 139.8 160.1 170.5 157.6 158.8 156.0MKTR 26.3 35.5 41.3 46.3 61.6 72.0IS 0.9 1.3 1.4 1.5 1.5 1.5
NO 13.2 16.4 17.1 17.9 17.8 18.0CH 17.8 20.6 19.4 20.7 21.0 21.1
Notes: (*) the activity data used in GHG inventories to report international maritime emissions (emissions from bunker fuels) are not fully consistent with the energy statistics on bunker fuels for some years and countries. For eU-28, changes in international maritime emissions between 2010 and 2011 show inconsistency with changes in energy statistics on bunker fuels and will be reviewed at a later stage.
Source : European Environment Agency (EEA) , June 2014 Source : European Environment Agency (EEA) , June 2014
3.2 .1
ENERGY AND ENVIRONMENT
3.2 ENVIRONMENT

124 125
ENERGY AND ENVIRONMENT
ENVIRONMENT
ENERGY AND ENVIRONMENT
ENVIRONMENT
Source : European Environment Agency (EEA) , June 2014
gHg Emissions (*) by Sector – EU-28MILLION TONNES CO2 EQUIVALENT
gHg Emissions (*) by Sector – EU-28MILLION TONNES CO2 EQUIVALENT
TOTA
l EN
ERg
y
fUEl
cO
mb
UST
iON
ENER
gy
iNd
UST
RiES
Publ
ic E
lect
rici
ty
and
Hea
t Pr
oduc
tion
Petr
oleu
m R
efin
ing
Oth
er
Ener
gy in
dust
ries
mAN
UfA
cTU
RiN
g
ANd
cO
NST
RUcT
iON
iron
and
Ste
el
Non
-fer
rous
met
als
chem
ical
s
Pulp
, Pap
er a
nd P
rint
food
, bev
erag
es
and
Toba
cco
Oth
er
1990 4 324.6 4 168.8 1 676.2 1 436.7 123.3 116.2 860.5 185.4 14.0 132.9 36.0 53.9 438.3
1995 4 058.4 3 924.0 1 518.5 1 289.4 130.0 99.1 767.2 172.8 13.3 125.3 39.1 61.3 355.4
1997 4 065.6 3 937.8 1 502.0 1 273.4 135.1 93.5 746.0 166.1 14.2 118.1 38.7 59.6 349.3
1998 4 056.6 3 939.3 1 519.8 1 295.7 137.2 86.9 716.8 161.3 14.2 111.4 37.2 57.0 335.6
1999 3 994.5 3 880.6 1 476.8 1 261.9 131.2 83.7 696.8 149.9 14.5 109.1 35.8 57.0 330.5
2000 4 003.6 3 891.5 1 508.2 1 292.5 133.4 82.3 706.7 152.4 14.9 113.0 37.3 55.9 333.2
2001 4 080.1 3 972.6 1 547.5 1 333.1 135.2 79.2 683.3 143.8 15.3 108.9 35.0 55.4 324.8
2002 4 050.3 3 944.4 1 565.5 1 349.1 136.7 79.8 664.6 137.7 14.8 106.0 35.2 54.1 316.7
2003 4 136.5 4 032.5 1 617.0 1 401.3 136.4 79.4 675.2 139.3 14.2 109.7 35.6 53.6 322.8
2004 4 130.0 4 032.5 1 603.2 1 384.9 140.9 77.4 673.0 144.2 13.9 109.0 34.3 51.8 319.7
2005 4 102.7 4 007.1 1 594.6 1 373.1 143.1 78.4 663.5 140.2 13.0 109.0 34.7 50.7 315.9
2006 4 106.6 4 013.9 1 608.8 1 387.2 141.2 80.4 657.8 143.8 12.4 107.4 34.3 46.3 313.6
2007 4 044.5 3 956.1 1 616.8 1 396.5 142.1 78.2 659.5 150.1 12.3 103.1 33.7 45.9 314.4
2008 3 961.1 3 874.8 1 538.0 1 320.7 142.2 75.0 633.2 140.9 11.4 103.2 31.4 44.0 302.2
2009 3 678.0 3 596.4 1 414.2 1 218.1 133.9 62.1 528.4 101.2 10.2 91.1 28.8 40.8 256.2
2010 3 783.5 3 702.3 1 435.6 1 232.9 133.3 69.4 567.5 123.6 11.1 95.1 30.3 42.7 264.8
2011 3 642.0 3 561.3 1 413.5 1 215.1 132.3 66.1 552.8 122.7 10.3 92.5 28.5 39.7 259.2
2012 3 603.8 3 523.3 1 408.9 1 225.2 127.3 56.4 533.1 117.8 9.8 90.1 27.7 39.3 248.4
TRAN
SPO
RT (*
*)
OTH
ER S
EcTO
RS
com
mer
cial
/ in
stit
utio
nal
Resi
dent
ial
Agric
ultu
re /
fore
stry
/fi
sher
ies
OTH
ER (N
OT
SPEc
i-fi
Ed E
lSEw
HER
E)
fUg
iTiv
E Em
iSSi
ON
S fR
Om
fU
ElS
iNd
UST
RiAl
PR
OcE
SSES
SOlv
ENT
ANd
O
THER
PRO
dU
cT U
SE
AgRi
cUlT
URE
wAS
TE
OTH
ER
TOTA
l Em
iSSi
ON
S
782.6 820.7 201.0 523.2 96.5 28.8 155.8 462.0 16.9 617.2 205.6 5 626.3 1990
838.3 783.7 182.9 508.5 92.3 16.3 134.4 440.8 14.1 533.2 206.8 5 253.2 1995
877.2 798.5 184.9 522.0 91.6 14.1 127.7 446.2 14.1 534.3 201.2 5 261.2 1997
904.9 783.5 184.0 510.8 88.7 14.3 117.3 420.4 14.1 531.6 198.5 5 221.2 1998
923.7 770.2 183.0 498.3 88.9 13.2 113.9 382.6 13.8 528.5 192.1 5 111.3 1999
918.0 746.0 176.7 482.8 86.6 12.5 112.1 393.9 13.5 521.0 189.6 5 121.7 2000
932.3 798.2 193.8 517.6 86.8 11.4 107.5 381.1 13.1 512.2 185.7 5 172.2 2001
943.1 760.1 183.4 491.5 85.2 11.1 105.9 377.1 12.8 506.6 185.1 5 131.9 2002
953.5 775.3 184.5 505.0 85.8 11.5 104.0 389.8 12.4 499.4 178.7 5 216.9 2003
972.8 771.3 188.2 497.2 85.9 12.2 97.6 404.3 12.3 500.1 170.8 5 217.5 2004
971.2 765.3 184.6 494.6 86.1 12.5 95.6 403.3 12.3 493.4 166.5 5 178.2 2005
978.6 757.1 191.1 482.7 83.3 11.6 92.7 400.6 12.4 489.7 164.2 5 173.4 2006
989.3 678.5 169.9 428.8 79.8 12.0 88.4 412.3 11.9 490.2 159.8 5 118.7 2007
966.8 725.5 182.5 461.6 81.4 11.3 86.2 388.2 11.4 489.5 156.3 5 006.5 2008
940.9 702.7 178.0 445.4 79.3 10.3 81.5 324.1 10.5 477.8 152.1 4 642.4 2009
936.3 753.1 188.6 483.3 81.1 9.9 81.2 334.7 10.6 474.9 147.3 4 751.1 2010
926.2 659.0 171.0 408.2 79.7 9.8 80.7 332.1 10.3 475.2 143.7 4 603.2 2011
893.1 679.3 176.1 425.2 78.0 9.0 80.5 320.6 9.9 469.1 140.8 4 544.2 2012
Notes: (*) excluding lUlUcF (land Use, land-Use change and Forestry) emissions and international bunkers;
(**) excluding international bunkers (international traffic departing from the eU); (***) emissions from Manufacturing and construction and industrial processes; (*****) emissions from Fuel combustion and other emissions from agriculture; (******) emissions from Fuel combustion in other (not specified elsewhere), Fugitive emissions from Fuels, Solvent and other product Use, Waste, other.
Energy Industries • Industry (***) • Transport (**) • Residential • Commercial/Institutional • Other (****) • Total
1.20
1.10
1.00
0.90
0.80
0.70
0.60
1990 = 1 19
90
1991
1992
1993
1994
1995
1996
1997
1998
1999
2000
2001
2002
2003
2004
2005
2006
2007
2008
2009
2010
2011
2012
Notes: (*) excluding lUlUcF (land Use, land-Use change and Forestry) emissions and international bunkers;
(**) excluding international bunkers (international traffic departing from the eU); (***) emissions from Manufacturing and construction and industrial processes;
(****) emissions from Fuel combustion in agriculture/Forestry/Fisheries, other (not specified elsewhere), Fugitive emissions from Fuels, Solvent and other product Use, agriculture, Waste, other.
ENERGY INDUSTRIES
INDUSTRY (***)
TRANSPORT (**)
RESIDENTIAL
COMMERCIAL/ INSITUTIONAL
OTHER (******)
AGRICULTURE, FORESTRY, FISHERIES (*****)
31.0 %
18.8 %19.7 %
9.4 %
12.0 %
3.9 %
YEAR 2012
5.3 %
3.2 .3 3 .2 .3

126 127
ENERGY AND ENVIRONMENT
ENVIRONMENT
ENERGY AND ENVIRONMENT
ENVIRONMENT
Source : European Environment Agency (EEA) , June 2014
gHg Emissions (*) by Sector – EU-28SHARES %
gHg Emissions (*) by Sector – EU-28SHARES %
3.2 .3 3 .2 .3
TOTA
l EN
ERg
y
fUEl
cO
mb
UST
iON
ENER
gy
iNd
UST
RiES
Publ
ic E
lect
rici
ty a
nd
Hea
t Pr
oduc
tion
Petr
oleu
m R
efin
ing
Oth
er
Ener
gy in
dust
ries
mAN
UfA
cTU
RiN
g
ANd
cO
NST
RUcT
iON
iron
and
Ste
el
Non
-fer
rous
met
als
chem
ical
s
Pulp
, Pap
er a
nd P
rint
food
, bev
erag
es
and
Toba
cco
Oth
er
1990 76.9 96.4 40.2 85.7 7.4 6.9 20.6 21.5 1.6 15.4 4.2 6.3 50.9
1991 77.6 96.6 39.9 86.2 7.2 6.6 19.7 22.0 1.9 15.0 4.7 6.8 49.7
1992 77.6 96.6 39.5 86.2 7.4 6.3 19.2 21.5 1.8 14.5 4.8 7.2 50.2
1993 77.8 96.5 38.6 85.5 8.0 6.5 19.2 21.9 1.6 14.7 4.8 7.5 49.4
1994 77.3 96.7 39.0 85.1 8.2 6.7 19.4 22.8 1.7 15.2 5.2 7.8 47.3
1995 77.3 96.7 38.7 84.9 8.6 6.5 19.6 22.5 1.7 16.3 5.1 8.0 46.3
1996 77.7 96.8 38.4 85.3 8.7 6.0 18.7 21.3 1.8 16.2 5.1 8.3 47.3
1997 77.3 96.9 38.1 84.8 9.0 6.2 18.9 22.3 1.9 15.8 5.2 8.0 46.8
1998 77.7 97.1 38.6 85.3 9.0 5.7 18.2 22.5 2.0 15.5 5.2 8.0 46.8
1999 78.1 97.1 38.1 85.5 8.9 5.7 18.0 21.5 2.1 15.7 5.1 8.2 47.4
2000 78.2 97.2 38.8 85.7 8.8 5.5 18.2 21.6 2.1 16.0 5.3 7.9 47.1
2001 78.9 97.4 39.0 86.1 8.7 5.1 17.2 21.1 2.2 15.9 5.1 8.1 47.5
2002 78.9 97.4 39.7 86.2 8.7 5.1 16.8 20.7 2.2 16.0 5.3 8.1 47.7
2003 79.3 97.5 40.1 86.7 8.4 4.9 16.7 20.6 2.1 16.2 5.3 7.9 47.8
2004 79.2 97.6 39.8 86.4 8.8 4.8 16.7 21.4 2.1 16.2 5.1 7.7 47.5
2005 79.2 97.7 39.8 86.1 9.0 4.9 16.6 21.1 2.0 16.4 5.2 7.6 47.6
2006 79.4 97.7 40.1 86.2 8.8 5.0 16.4 21.9 1.9 16.3 5.2 7.0 47.7
2007 79.0 97.8 40.9 86.4 8.8 4.8 16.7 22.8 1.9 15.6 5.1 7.0 47.7
2008 79.1 97.8 39.7 85.9 9.2 4.9 16.3 22.3 1.8 16.3 5.0 7.0 47.7
2009 79.2 97.8 39.3 86.1 9.5 4.4 14.7 19.2 1.9 17.2 5.4 7.7 48.5
2010 79.6 97.9 38.8 85.9 9.3 4.8 15.3 21.8 2.0 16.8 5.3 7.5 46.7
2011 79.1 97.8 39.7 86.0 9.4 4.7 15.5 22.2 1.9 16.7 5.2 7.2 46.9
2012 79.3 97.8 40.0 87.0 9.0 4.0 15.1 22.1 1.8 16.9 5.2 7.4 46.6
Notes: (*) excluding lUlUcF (land Use, land-Use change and Forestry) emissions and international bunkers.
indirect emissions from electricity use are not included in the GHG emissions from fuel combustion by Manufacturing and construction, transport and other sectors (commercial/institutional, Residential and agriculture/Forestry/Fisheries).
TRAN
SPO
RT (*
*)
OTH
ER S
EcTO
RS
com
mer
cial
/ in
stit
utio
nal
Resi
dent
ial
Agric
ultu
re /
fore
stry
/fi
sher
ies
OTH
ER (N
OT
SPEc
i-fi
Ed E
lSEw
HER
E)
fUg
iTiv
E Em
iSSi
ON
S fR
Om
fU
ElS
iNd
UST
RiAl
PR
OcE
SSES
SOlv
ENT
ANd
O
THER
PRO
dU
cT U
SE
AgRi
cUlT
URE
wAS
TE
OTH
ER
TOTA
l Em
iSSi
ON
S
18.8 19.7 24.5 63.7 11.8 0.7 3.6 8.2 0.3 11.0 3.7 100 1990
19.1 20.8 24.2 64.7 11.1 0.6 3.4 7.7 0.3 10.6 3.8 100 1991
20.4 20.4 24.1 64.8 11.1 0.5 3.4 7.7 0.3 10.5 3.9 100 1992
20.8 21.0 22.9 65.7 11.4 0.4 3.5 7.7 0.3 10.3 3.9 100 1993
21.2 20.0 22.8 65.2 11.9 0.4 3.3 8.2 0.3 10.3 4.0 100 1994
21.4 20.0 23.3 64.9 11.8 0.4 3.3 8.4 0.3 10.2 3.9 100 1995
21.4 21.1 23.5 65.4 11.1 0.4 3.2 8.2 0.3 10.0 3.8 100 1996
22.3 20.3 23.2 65.4 11.5 0.4 3.1 8.5 0.3 10.2 3.8 100 1997
23.0 19.9 23.5 65.2 11.3 0.4 2.9 8.1 0.3 10.2 3.8 100 1998
23.8 19.8 23.8 64.7 11.5 0.3 2.9 7.5 0.3 10.3 3.8 100 1999
23.6 19.2 23.7 64.7 11.6 0.3 2.8 7.7 0.3 10.2 3.7 100 2000
23.5 20.1 24.3 64.8 10.9 0.3 2.6 7.4 0.3 9.9 3.6 100 2001
23.9 19.3 24.1 64.7 11.2 0.3 2.6 7.3 0.2 9.9 3.6 100 2002
23.6 19.2 23.8 65.1 11.1 0.3 2.5 7.5 0.2 9.6 3.4 100 2003
24.1 19.1 24.4 64.5 11.1 0.3 2.4 7.7 0.2 9.6 3.3 100 2004
24.2 19.1 24.1 64.6 11.3 0.3 2.3 7.8 0.2 9.5 3.2 100 2005
24.4 18.9 25.2 63.8 11.0 0.3 2.3 7.7 0.2 9.5 3.2 100 2006
25.0 17.2 25.0 63.2 11.8 0.3 2.2 8.1 0.2 9.6 3.1 100 2007
25.0 18.7 25.2 63.6 11.2 0.3 2.2 7.8 0.2 9.8 3.1 100 2008
26.2 19.5 25.3 63.4 11.3 0.3 2.2 7.0 0.2 10.3 3.3 100 2009
25.3 20.3 25.0 64.2 10.8 0.3 2.1 7.0 0.2 10.0 3.1 100 2010
26.0 18.5 25.9 62.0 12.1 0.3 2.2 7.2 0.2 10.3 3.1 100 2011
25.3 19.3 25.9 62.6 11.5 0.3 2.2 7.1 0.2 10.3 3.1 100 2012
Notes: (*) excluding lUlUcF (land Use, land-Use change and Forestry) emissions and international bunkers;
(**) excluding international bunkers (international traffic departing from the eU). indirect emissions from electricity use are not included in the GHG emissions
from fuel combustion by Manufacturing and construction, transport and other sectors (commercial/institutional, Residential and agriculture/Forestry/Fisheries).

128 129
ENERGY AND ENVIRONMENT
ENVIRONMENT
ENERGY AND ENVIRONMENT
ENVIRONMENT
Source : European Environment Agency (EEA) , June 2014
gHg Emissions (*) by Sector – 2012MILLION TONNES CO2 EQUIVALENT
gHg Emissions (*) by Sector – 2012MILLION TONNES CO2 EQUIVALENT
3.2 .4 3 .2 .4
TOTA
l EN
ERg
y
fUEl
cO
mb
UST
iON
ENER
gy
iNd
UST
RiES
Publ
ic E
lect
rici
ty a
nd
Hea
t Pr
oduc
tion
Petr
oleu
m R
efin
ing
Oth
er
Ener
gy in
dust
ries
mAN
UfA
cTU
RiN
g
ANd
cO
NST
RUcT
iON
iron
and
Ste
el
Non
-fer
rous
met
als
chem
ical
s
Pulp
, Pap
er a
nd P
rint
food
, bev
erag
es
and
Toba
cco
Oth
er
EU-28 3 603.8 3 523.3 1 408.9 1 225.2 127.3 56.4 533.1 117.8 9.8 90.1 27.7 39.3 248.4
BE 94.4 93.9 22.9 18.0 4.7 0.2 21.0 4.5 0.4 6.8 0.5 2.1 6.6
BG 47.2 45.6 31.6 30.6 1.0 0.0 3.3 0.1 0.1 1.0 0.1 0.3 1.7
CZ 107.1 103.0 57.4 52.6 1.0 3.8 16.6 3.1 0.1 6.4 0.7 0.9 5.4
DK 39.0 38.7 16.8 14.3 1.0 1.4 4.3 0.1 0.0 0.3 0.1 1.2 2.6
DE 786.0 775.4 364.8 334.0 18.6 12.2 115.1 33.2 0.1 0.0 0.2 81.5
EE 16.9 16.8 13.1 12.7 0.4 0.8 0.0 0.0 0.0 0.0 0.0 0.7
IE 37.1 37.0 12.8 12.4 0.3 0.1 4.3 0.0 1.5 0.3 0.0 0.8 1.7
EL 87.2 85.7 54.7 51.1 3.6 0.0 5.5 0.2 0.5 0.8 0.1 0.5 3.4
ES 265.5 261.2 91.9 77.5 12.5 2.0 46.4 6.2 2.1 8.1 5.2 3.1 21.8
FR 351.4 346.8 52.7 41.0 8.7 3.0 63.5 13.4 1.0 19.0 2.7 8.9 18.6
HR 18.9 17.2 5.6 3.8 1.6 0.2 2.8 0.1 0.0 0.3 0.1 0.4 1.9
IT 379.9 372.6 126.3 91.1 26.0 9.3 54.9 15.6 1.1 6.9 4.3 3.6 23.4
CY 6.6 6.6 3.6 3.6 0.4 0.0 0.0 0.1 0.3
LV 7.2 7.2 1.9 1.8 0.1 1.0 0.1 0.0 0.0 0.0 0.1 0.7
LT 11.9 11.6 4.4 3.0 1.4 0.0 1.3 0.2 0.1 0.3 0.7
LU 10.5 10.5 1.0 1.0 1.3 0.3 0.1 0.2 0.0 0.0 0.7
HU 45.5 43.3 16.5 14.9 1.4 0.2 4.0 1.1 0.2 0.5 0.2 0.5 1.5
MT 2.8 2.8 2.1 2.1 0.1 0.1
NL 161.9 160.1 60.3 48.4 9.8 2.1 25.9 4.3 0.2 12.4 1.1 3.4 4.5
AT 59.7 59.2 12.4 9.1 2.8 0.5 15.6 5.9 0.2 1.8 2.0 1.0 4.7
PL 319.7 303.6 169.6 161.1 6.0 2.5 30.9 6.0 1.1 7.5 1.5 4.2 10.5
PT 47.9 46.5 17.4 15.3 2.2 7.5 0.1 0.9 1.0 0.9 4.5
RO 82.2 74.3 32.5 29.1 2.0 1.4 15.4 3.0 3.6 0.1 1.0 7.7
SI 15.5 15.1 6.0 6.0 0.0 1.6 0.2 0.1 0.1 0.3 0.1 0.8
SK 29.3 28.2 9.5 6.1 2.1 1.3 7.2 3.3 0.2 1.3 0.3 0.3 1.8
FI 47.8 47.6 20.7 17.9 2.6 0.3 8.4 2.3 0.1 0.7 3.1 0.2 2.1
SE 42.1 41.2 10.3 7.7 2.2 0.4 8.5 1.2 0.1 1.2 1.2 0.5 4.4
UK 482.5 471.5 190.2 159.2 15.9 15.1 65.5 13.5 0.7 10.0 2.9 4.6 34.0
MK
TR 308.6 306.3 119.6 117.1 2.5 56.3 6.0 1.4 3.8 0.7 1.4 43.0
IS 1.7 1.5 0.0 0.0 0.2 0.0 0.0 0.1 0.1
NO 39.2 35.9 14.1 1.5 0.8 11.7 3.1 0.1 0.2 1.2 0.2 0.3 1.1
CH 41.5 41.3 4.1 3.3 0.7 0.0 5.5 0.3 0.1 0.8 0.2 0.9 3.3
Notes: (*) excluding lUlUcF (land Use, land-Use change and Forestry) emissions and international bunkers.
TRAN
SPO
RT (*
*)
OTH
ER S
EcTO
RS
com
mer
cial
/ in
stit
utio
nal
Resi
dent
ial
Agric
ultu
re /
fore
stry
/fi
sher
ies
OTH
ER (N
OT
SPEc
i-fi
Ed E
lSEw
HER
E)
fUg
iTiv
E Em
iSSi
ON
S fR
Om
fU
ElS
iNd
UST
RiAl
PR
OcE
SSES
SOlv
ENT
ANd
O
THER
PRO
dU
cT U
SE
AgRi
cUlT
URE
wAS
TE
OTH
ER
TOTA
l Em
iSSi
ON
S
893.1 679.3 176.1 425.2 78.0 9.0 80.5 320.6 9.9 469.1 140.8 4 544.2 EU-28
24.9 25.1 5.9 17.0 2.2 0.0 0.5 11.2 0.2 9.3 1.5 116.5 BE
8.4 2.2 0.3 1.4 0.5 1.6 3.9 0.0 6.3 3.6 61.0 BG
16.9 11.0 3.3 7.5 0.2 1.1 4.1 12.1 0.5 8.1 3.8 131.5 CZ
12.2 5.3 0.8 2.3 2.1 0.1 0.3 1.8 0.2 9.6 1.1 51.6 DK
155.5 139.1 38.2 94.5 6.4 1.0 10.6 68.3 1.8 69.5 13.6 939.1 DE
2.3 0.6 0.0 0.3 0.3 0.0 0.1 0.7 0.0 1.3 0.3 19.2 EE
10.9 9.1 2.1 6.2 0.8 0.0 2.4 0.1 18.0 1.0 58.5 IE
16.1 9.4 1.3 7.1 1.0 1.5 9.6 0.3 9.1 4.7 111.0 EL
80.7 42.2 13.5 17.6 11.0 4.4 23.4 1.3 37.7 12.9 340.8 ES
132.5 98.0 29.1 57.5 11.4 4.6 35.7 1.1 89.3 12.6 490.1 FR
5.7 3.1 0.5 1.8 0.7 1.7 2.9 0.2 3.4 1.1 26.4 HR
106.1 85.0 28.2 49.3 7.5 0.4 7.2 28.2 1.5 34.3 16.2 460.1 IT
2.1 0.5 0.0 0.4 0.1 0.0 0.8 0.1 0.8 1.0 9.3 CY
2.8 1.5 0.5 0.7 0.4 0.0 0.1 0.7 0.0 2.4 0.6 11.0 LV
4.5 1.4 0.3 0.9 0.1 0.0 0.3 3.6 0.1 5.1 1.0 21.6 LT
6.5 1.6 0.6 0.9 0.1 0.0 0.6 0.0 0.7 0.1 11.8 LU
10.8 11.9 3.4 7.6 0.9 2.2 4.3 0.4 8.7 3.2 62.0 HU
0.6 0.1 0.1 0.0 0.0 0.2 0.0 0.1 0.1 3.1 MT
34.0 39.6 11.2 18.3 10.1 0.3 1.8 9.9 0.2 15.9 3.7 191.7 NL
21.6 9.5 1.4 7.2 0.9 0.0 0.5 10.9 0.3 7.5 1.7 80.1 AT
46.8 56.3 9.2 36.1 11.0 16.0 27.0 0.8 36.7 15.2 399.3 PL
17.0 4.5 1.1 2.3 1.1 0.0 1.4 5.2 0.2 7.2 8.2 68.8 PT
15.1 10.8 2.0 7.6 1.2 0.6 7.9 12.4 0.1 18.2 5.8 118.8 RO
5.8 1.7 0.4 1.1 0.2 0.0 0.3 1.0 0.1 1.9 0.5 18.9 SI
6.6 3.9 0.7 3.1 0.1 1.0 1.1 8.0 0.2 3.1 2.2 42.7 SK
12.7 4.3 1.0 1.7 1.5 1.6 0.2 5.3 0.1 5.7 2.1 61.0 FI
19.1 3.2 0.5 1.1 1.6 0.2 1.0 5.9 0.3 7.6 1.6 57.6 SE
114.8 98.4 20.1 73.6 4.7 2.5 11.0 24.9 51.8 21.6 580.8 UK
MK
61.6 68.8 65.5 3.3 0.0 2.3 62.8 32.3 36.2 439.9 TR
0.9 0.5 0.0 0.0 0.5 0.2 1.9 0.0 0.7 0.2 4.5 IS
15.2 3.2 0.7 0.5 2.1 0.3 3.3 7.7 0.2 4.5 1.2 52.7 NO
16.3 15.2 4.5 10.1 0.6 0.1 0.2 3.6 0.2 5.5 0.6 0.0 51.4 CH
Notes: (*) excluding lUlUcF (land Use, land-Use change and Forestry) emissions and international bunkers;
(**) excluding international bunkers (international traffic departing from the eU).
130 131
Titlesubtitle
Titlesubtitle
3.2 .5 3 .2 .5
Total Civil Aviation • Road Transportation • Railways (***) • Total Navigation • Other • Total Transport
1.80
1.60
1.40
1.20
1.00
0.80
0.60
0.40
1990 = 1 19
90
1991
1992
1993
1994
1995
1996
1997
1998
1999
2000
2001
2002
2003
2004
2005
2006
2007
2008
2009
2010
2011
2012
Notes: (*) excluding international bunkers (international traffic departing from the eU); (**) including international bunkers but excluding lUlUcF;
(***) excluding indirect emissions from electricity consumption; (****) combustion emissions from all remaining transport activities including
pipeline transportation, ground activities in airports and harbours, and off-road activities.
Source : European Environment Agency (EEA) , June 2014
iNclUdiNg iNTERNATiONAl bUNkERS
TOTA
l
civ
il A
viA
TiO
N
civi
l Avi
atio
n
(dom
esti
c) (*
)
inte
rnat
iona
l bu
nker
s –
Avia
tion
ROAd
TR
ANSP
ORT
ATiO
N
RAil
wAy
S (*
**)
TOTA
l N
Avig
ATiO
N
Nav
igat
ion
(d
omes
tic)
(*)
inte
rnat
iona
l bun
kers
–
mar
itim
e Tr
ansp
ort
OTH
ER
TRAN
SPOR
TATi
ON (*
***)
TOTA
l TR
ANSP
ORT
TOTA
l Em
iSSi
ON
S(*
*)
1990 84.1 14.2 69.9 722.4 13.5 133.1 22.9 110.2 9.6 962.6 5 806.31995 101.3 14.6 86.7 782.7 10.6 133.1 21.9 111.2 8.4 1 036.2 5 451.11997 111.8 17.0 94.8 819.4 10.1 150.0 22.5 127.5 8.2 1 099.5 5 483.51998 120.0 17.6 102.4 845.6 9.8 156.5 23.4 133.1 8.4 1 140.3 5 456.71999 129.1 19.1 110.1 863.6 9.4 150.1 22.8 127.3 8.8 1 161.0 5 348.72000 135.8 19.5 116.3 859.5 9.5 154.7 20.4 134.3 9.1 1 168.6 5 372.32001 133.7 18.9 114.7 874.9 8.8 161.2 20.7 140.5 8.9 1 187.5 5 427.42002 130.2 18.2 112.0 886.7 8.7 164.7 20.4 144.3 9.1 1 199.4 5 388.22003 134.3 17.8 116.5 897.0 8.6 168.9 21.0 147.9 9.0 1 217.9 5 481.32004 144.2 18.7 125.5 914.6 8.6 178.0 21.3 156.7 9.6 1 255.0 5 499.72005 151.6 19.1 132.4 912.7 8.0 187.4 21.0 166.4 10.4 1 270.0 5 477.02006 157.5 19.3 138.2 919.4 7.9 197.0 21.2 175.8 10.8 1 292.6 5 487.42007 162.0 19.5 142.5 931.3 8.2 199.1 20.2 178.9 10.1 1 310.6 5 440.02008 162.2 19.0 143.3 909.9 8.0 196.7 19.3 177.4 10.7 1 287.5 5 327.22009 150.3 17.6 132.6 886.9 7.3 179.8 19.3 160.5 9.8 1 234.0 4 935.62010 149.7 17.3 132.4 883.0 7.3 175.0 19.2 155.8 9.5 1 224.5 5 039.32011 153.3 16.9 136.4 875.1 7.4 178.0 17.4 160.6 9.4 1 223.2 4 900.32012 150.7 16.1 134.6 843.2 7.1 162.8 17.2 145.6 9.4 1 173.3 4 824.4
Source: European Environment Agency (EEA) , June 2014
iNclUdiNg iNTERNATiONAl bUNkERS
TOTA
l
civ
il A
viA
TiO
N
civi
l Avi
atio
n
(dom
esti
c) (*
)
inte
rnat
iona
l bu
nker
s –
Avia
tion
ROAd
TR
ANSP
ORT
ATiO
N
RAil
wAy
S (*
**)
TOTA
l N
Avig
ATiO
N
Nav
igat
ion
(d
omes
tic)
(*)
inte
rnat
iona
l bun
kers
–
mar
itim
e Tr
ansp
ort
OTH
ER
TRAN
SPOR
TATi
ON (*
***)
TOTA
l
TRAN
SPO
RT (*
****
)
TOTA
l Em
iSSi
ON
S(*
*)
1990 8.7 16.9 83.1 75.0 1.4 13.8 17.2 82.8 1.0 16.6 1001995 9.8 14.4 85.6 75.5 1.0 12.8 16.5 83.5 0.8 19.0 1001997 10.2 15.2 84.8 74.5 0.9 13.6 15.0 85.0 0.7 20.1 1001998 10.5 14.7 85.3 74.2 0.9 13.7 15.0 85.0 0.7 20.9 1001999 11.1 14.8 85.2 74.4 0.8 12.9 15.2 84.8 0.8 21.7 1002000 11.6 14.4 85.6 73.6 0.8 13.2 13.2 86.8 0.8 21.8 1002001 11.3 14.2 85.8 73.7 0.7 13.6 12.8 87.2 0.8 21.9 1002002 10.9 14.0 86.0 73.9 0.7 13.7 12.4 87.6 0.8 22.3 1002003 11.0 13.3 86.7 73.7 0.7 13.9 12.5 87.5 0.7 22.2 1002004 11.5 12.9 87.1 72.9 0.7 14.2 12.0 88.0 0.8 22.8 1002005 11.9 12.6 87.4 71.9 0.6 14.8 11.2 88.8 0.8 23.2 1002006 12.2 12.2 87.8 71.1 0.6 15.2 10.8 89.2 0.8 23.6 1002007 12.4 12.0 88.0 71.1 0.6 15.2 10.2 89.8 0.8 24.1 1002008 12.6 11.7 88.3 70.7 0.6 15.3 9.8 90.2 0.8 24.2 1002009 12.2 11.7 88.3 71.9 0.6 14.6 10.7 89.3 0.8 25.0 1002010 12.2 11.6 88.4 72.1 0.6 14.3 11.0 89.0 0.8 24.3 1002011 12.5 11.0 89.0 71.5 0.6 14.6 9.8 90.2 0.8 25.0 1002012 12.8 10.7 89.3 71.9 0.6 13.9 10.6 89.4 0.8 24.3 100
Notes: (*) excluding international bunkers (international traffic departing from the eU); (**) including international bunkers but excluding lUlUcF; (***) excluding indirect emissions from electricity consumption; (****) combustion emissions from all remaining transport activities including
pipeline transportation, ground activities in airports and harbours, and off-road activities;
(*****) total transport share in total emissions.
gHg Emissions from Transport – EU-28 BY MODE (MILLION TONNES CO2 EQUIVALENT)
gHg Emissions from Transport – EU-28 BY MODE (SHARE %)
TOTAL CIVIL AVIATION
ROAD TRANSPORTATION
RAILWAYS (***)
TOTAL NAVIGATION
OTHER
0.8 %
12.8 %
71.9 %
13.9 %0.6 %
YEAR 2012
ENERGY AND ENVIRONMENT
ENVIRONMENT
ENERGY AND ENVIRONMENT
ENVIRONMENT

Source :
ENERGY AND ENVIRONMENT
ENVIRONMENT
ENERGY AND ENVIRONMENT
ENVIRONMENT
132 133
Titlesubtitle
Titlesubtitle
gHg Emissions from Transport – 2012 BY MODE (SHARE %)
gHg Emissions from Transport – 2012 BY MODE (MILLION TONNES CO2 EQUIVALENT)
3.2 .6 3 .2 .6
iNclUdiNg iNTERNATiONAl bUNkERS
TOTA
l
civ
il A
viA
TiO
N
civi
l Avi
atio
n
(dom
esti
c) (*
)
inte
rnat
iona
l bu
nker
s –
Avia
tion
ROAd
TR
ANSP
ORT
ATiO
N
RAil
wAy
S
TOTA
l N
Avig
ATiO
N
Nav
igat
ion
(d
omes
tic)
(*)
inte
rnat
iona
l bun
kers
–
mar
itim
e Tr
ansp
ort
OTH
ER
TRAN
SPO
RTAT
iON
TOTA
l
TRAN
SPO
RT
TOTA
l Em
iSSi
ON
S
(**)
EU-28 150.7 16.1 134.6 843.2 7.1 162.8 17.2 145.6 9.4 1 173.3 4 824.4
BE 4.1 0.0 4.1 24.2 0.1 20.1 0.5 19.6 0.2 48.6 140.2BG 0.5 0.0 0.5 7.8 0.1 0.2 0.0 0.2 0.5 9.1 61.8CZ 1.0 0.0 1.0 16.5 0.3 0.0 0.0 0.1 17.9 132.4DK 2.7 0.1 2.5 11.4 0.3 2.1 0.5 1.5 16.3 55.7DE 27.5 1.9 25.6 147.4 1.1 9.2 1.0 8.2 4.2 189.3 972.9EE 0.1 0.0 0.1 2.2 0.1 0.6 0.0 0.5 2.9 19.8IE 1.8 0.0 1.8 10.4 0.1 0.6 0.2 0.4 0.1 13.1 60.7
EL 3.0 0.5 2.5 13.8 0.1 9.2 1.7 7.4 0.0 26.1 121.0ES 16.8 3.2 13.6 74.3 0.3 29.6 2.7 26.9 0.3 121.2 381.3FR 21.4 5.1 16.3 125.1 0.5 9.3 1.3 8.0 0.5 156.9 514.5HR 0.4 0.1 0.3 5.4 0.1 0.1 0.1 6.0 26.7
IT 11.6 2.2 9.4 98.2 0.0 10.6 4.9 5.7 0.7 121.1 475.2CY 0.8 0.0 0.8 2.0 0.6 0.6 3.5 10.7LV 0.4 0.0 0.4 2.5 0.3 0.8 0.0 0.8 0.0 4.0 12.1LT 0.2 0.0 0.2 4.1 0.2 0.4 0.0 0.4 0.2 5.1 22.2LU 1.1 0.0 1.1 6.5 0.0 0.0 0.0 0.0 7.6 13.0
HU 0.5 0.0 0.5 10.7 0.1 0.0 0.0 11.3 62.5MT 0.3 0.0 0.3 0.5 3.8 0.0 3.7 0.0 4.6 7.2NL 10.2 0.0 10.2 33.2 0.1 44.3 0.7 43.6 87.7 245.4AT 2.2 0.1 2.1 21.0 0.1 0.1 0.0 0.1 0.4 23.8 82.2PL 1.7 0.1 1.7 45.8 0.4 0.5 0.0 0.5 0.6 49.0 401.4PT 3.1 0.4 2.7 16.4 0.0 2.3 0.2 2.1 21.9 73.6RO 0.5 0.1 0.4 14.2 0.6 0.2 0.1 0.0 0.0 15.5 119.2
SI 0.1 0.0 0.1 5.7 0.0 0.2 0.2 0.0 6.0 19.2SK 0.1 0.0 0.1 6.5 0.1 0.0 0.0 0.0 0.0 6.7 42.8FI 2.1 0.2 1.9 11.2 0.1 0.9 0.5 0.4 0.6 15.0 63.2
SE 2.7 0.5 2.2 17.9 0.1 6.2 0.3 5.9 0.3 27.2 65.7UK 33.9 1.5 32.3 108.4 2.1 11.2 2.3 8.8 0.5 156.0 622.0MKTR 11.6 3.8 7.8 55.7 0.4 4.2 1.6 2.6 72.0 450.3IS 0.5 0.0 0.4 0.8 0.2 0.0 0.2 1.5 5.1
NO 2.5 1.2 1.2 10.1 0.0 3.6 2.0 1.6 1.8 18.0 55.5CH 4.8 0.1 4.7 16.0 0.0 0.2 0.1 0.0 0.0 21.1 56.2
Notes: (*) excluding international bunkers (international traffic departing from the eU); (**) including international bunkers but excluding lUlUcF.
Source : European Environment Agency (EEA) , June 2014
iNclUdiNg iNTERNATiONAl bUNkERS
TOTA
l
civ
il A
viA
TiO
N
civi
l Avi
atio
n
(dom
esti
c) (*
)
inte
rnat
iona
l bu
nker
s –
Avia
tion
ROAd
TR
ANSP
ORT
ATiO
N
RAil
wAy
S
TOTA
l N
Avig
ATiO
N
Nav
igat
ion
(d
omes
tic)
(*)
inte
rnat
iona
l bun
kers
–
mar
itim
e Tr
ansp
ort
OTH
ER
TRAN
SPO
RTAT
iON
TOTA
l
TRAN
SPO
RT (*
**)
TOTA
l Em
iSSi
ON
S(*
*)
EU-28 12.8 10.7 89.3 71.9 0.6 13.9 10.6 89.4 0.8 24.3 100
BE 8.4 0.7 99.3 49.7 0.2 41.3 2.4 97.6 0.4 34.7 100BG 5.8 6.5 93.5 85.7 0.8 2.5 3.7 96.3 5.1 14.8 100CZ 5.4 0.8 99.2 92.5 1.6 0.1 100.0 0.4 13.5 100DK 16.4 5.0 95.0 69.5 1.5 12.6 24.7 75.3 29.3 100DE 14.5 6.9 93.1 77.9 0.6 4.9 10.6 89.4 2.2 19.5 100EE 4.0 2.9 97.1 73.9 3.1 18.9 2.3 97.7 14.8 100IE 13.6 0.6 99.4 79.8 1.0 4.5 31.4 68.6 1.1 21.5 100
EL 11.6 16.3 83.7 52.7 0.3 35.2 19.0 81.0 0.0 21.6 100ES 13.9 18.9 81.1 61.3 0.2 24.4 9.0 91.0 0.2 31.8 100FR 13.7 23.8 76.2 79.7 0.3 5.9 13.7 86.3 0.3 30.5 100HR 6.0 26.5 73.5 90.8 1.3 1.9 100.0 22.4 100
IT 9.6 18.9 81.1 81.0 0.0 8.8 46.4 53.6 0.6 25.5 100CY 24.1 3.5 96.5 58.3 17.6 100.0 32.7 100LV 9.3 0.6 99.4 63.0 7.0 20.6 1.8 98.2 0.0 32.6 100LT 3.8 0.9 99.1 80.0 3.5 7.8 3.7 96.3 4.8 23.0 100LU 14.7 0.0 100.0 85.1 0.1 0.0 91.3 8.7 58.9 100
HU 4.4 0.3 99.7 94.3 1.1 0.2 100.0 18.2 100MT 6.9 0.4 99.6 10.8 81.8 0.9 99.1 0.4 64.0 100NL 11.6 0.2 99.8 37.8 0.1 50.5 1.6 98.4 35.7 100AT 9.0 2.6 97.4 88.4 0.6 0.3 19.2 80.8 1.7 28.9 100PL 3.5 3.3 96.7 93.5 0.7 1.0 2.6 97.4 1.2 12.2 100PT 14.3 11.9 88.1 74.9 0.2 10.7 9.7 90.3 29.7 100RO 3.4 23.2 76.8 91.6 3.7 1.1 75.3 24.7 0.2 13.0 100
SI 1.1 2.6 97.4 95.1 0.7 3.0 100.0 0.0 31.4 100SK 1.4 5.5 94.5 97.2 1.2 0.2 10.7 89.3 0.0 15.6 100FI 14.2 9.7 90.3 75.2 0.7 5.7 57.6 42.4 4.3 23.6 100
SE 10.0 19.3 80.7 65.9 0.2 22.7 5.0 95.0 1.1 41.4 100UK 21.7 4.6 95.4 69.5 1.3 7.2 20.8 79.2 0.3 25.1 100MKTR 16.1 32.4 67.6 77.4 0.6 5.9 38.3 61.7 16.0 100IS 31.5 4.5 95.5 55.2 13.3 7.0 93.0 29.1 100
NO 13.8 49.9 50.1 56.2 0.3 19.8 56.0 44.0 9.9 32.4 100CH 23.0 2.9 97.1 75.9 0.2 0.7 81.5 18.5 0.2 37.5 100
Notes: (*) excluding international bunkers (international traffic departing from the eU); (**) including international bunkers but excluding lUlUcF; (***) total transport share in total emissions.
Source : European Environment Agency (EEA) , June 2014

ENERGY AND ENVIRONMENT
ENVIRONMENT
ENERGY AND ENVIRONMENT
ENVIRONMENT
134 135
Titlesubtitle
Titlesubtitle
Total cO2 Emissions (*)MILLION TONNES
cO2 Emissions from TransportMILLION TONNES
3.2 .8 3 .2 .7
1990 2000 2005 2010 2011 2012EU-28 4 437.0 4 136.0 4 262.3 3 907.8 3 767.4 3 717.1
BE 119.0 125.2 124.3 113.4 104.3 100.7BG 80.2 45.5 50.3 47.7 53.2 48.4CZ 164.7 126.1 126.2 117.1 115.1 111.3DK 52.9 54.0 51.2 48.9 44.0 39.4DE 1 042.1 891.5 861.7 829.4 810.4 821.7EE 36.7 15.1 16.4 17.8 18.4 17.1IE 32.4 44.7 47.6 41.3 37.7 38.0
EL 83.0 102.6 112.9 96.8 94.3 90.5ES 227.5 308.0 365.5 280.4 280.9 276.6FR 396.3 411.6 421.6 386.0 359.5 363.3HR 23.3 20.1 23.5 21.3 20.9 19.2
IT 434.7 462.3 488.1 425.0 413.4 386.7CY 4.6 7.0 7.9 7.8 7.6 7.1LV 19.1 7.0 7.7 8.5 7.8 7.4LT 35.8 11.8 14.0 13.7 14.0 14.2LU 12.0 8.8 12.1 11.3 11.1 10.9
HU 72.5 58.1 59.9 51.7 49.9 46.1MT 1.9 2.3 2.7 2.6 2.7 2.8NL 159.2 169.9 175.9 181.4 168.1 165.3AT 62.0 66.0 79.4 72.4 70.4 67.7PL 374.8 318.7 318.4 329.6 327.7 320.9PT 45.0 65.7 69.2 52.5 51.2 50.3RO 178.1 92.9 99.3 79.9 85.6 83.9
SI 14.8 15.2 16.7 16.1 16.2 15.7SK 61.8 41.0 41.9 37.4 37.2 35.2FI 56.6 56.8 56.5 63.5 56.4 50.7
SE 57.1 54.1 53.2 52.3 48.5 45.7UK 588.8 553.7 558.1 502.0 461.1 480.5MKTR 141.6 225.6 259.8 326.8 345.7 357.5IS 2.2 2.8 2.9 3.4 3.3 3.3
NO 34.8 41.8 43.2 45.5 44.6 44.1CH 44.6 44.0 46.3 45.9 41.8 43.3
Notes: emissions data are downloaded from the european environment agency (eea), which is the main provider of eU-wide greenhouse gas emissions data. eea prepares and maintains the complete eU greenhouse gas emissions inventory, which is based on data reported by Member States through the eU greenhouse gas monitoring mechanism and the UNFccc process.
(*) excluding international bunkers and excluding lUlUcF (land Use, land-Use change and Forestry) emissions.
iNclUdiNg iNTERNATiONAl bUNkERS (*)
1990 2000 2005 2010 2011 2012EU-28 947.7 1 151.4 1 255.4 1 211.2 1 209.9 1 160.2
BE 36.7 45.1 54.5 55.6 53.0 48.3BG 7.5 5.9 8.5 8.7 8.8 9.0CZ 8.1 12.5 18.2 17.7 17.5 17.1DK 15.4 18.6 18.1 17.6 17.3 16.1DE 182.3 207.5 191.5 186.9 187.8 187.3EE 3.1 2.0 2.6 3.0 2.9 2.9IE 6.1 12.9 15.7 14.2 13.6 12.9
EL 24.6 32.2 32.6 32.7 30.6 25.6ES 75.3 114.7 139.4 130.4 127.1 119.9FR 135.9 161.8 163.7 155.2 157.3 155.0HR 4.5 4.7 5.9 6.2 6.2 5.9
IT 109.8 132.3 141.9 133.5 133.0 119.8CY 2.1 3.2 3.9 3.7 3.7 3.5LV 4.6 2.2 4.0 4.4 3.9 3.9LT 8.1 3.7 4.9 5.1 5.1 5.1LU 3.1 5.7 8.2 7.6 8.0 7.5
HU 8.8 9.5 12.5 12.3 11.9 11.2MT 0.8 2.1 4.6 4.2 5.1 4.5NL 64.9 84.8 99.6 88.0 93.6 87.2AT 14.7 20.4 26.7 24.3 23.7 23.5PL 22.2 29.0 36.5 49.2 49.5 48.3PT 13.0 22.8 23.4 22.9 22.0 21.6RO 12.8 10.0 12.9 14.6 14.8 15.3
SI 2.7 3.7 4.5 5.3 5.8 5.9SK 5.0 4.2 6.3 6.7 6.4 6.6FI 15.3 15.7 16.4 15.5 15.6 14.7
SE 22.5 26.3 29.8 29.5 28.3 26.8UK 137.7 157.9 168.7 156.2 157.4 154.6MKTR 26.0 35.0 40.5 45.6 61.2 71.6IS 0.9 1.3 1.3 1.4 1.4 1.4
NO 13.0 16.2 16.8 17.5 17.4 17.6CH 17.5 20.3 19.2 20.5 20.8 20.9
Note: (*) the activity data used in GHG inventories to report international maritime emissions (emissions from bunker fuels) are not fully consistent with the energy statistics on bunker fuels for some years and countries.
For eU-28, changes in international maritime emissions between 2010 and 2011 show inconsistency with changes in energy statistics on bunker fuels
and will be reviewed at a later stage.
Source: European Environment Agency (EEA) , June 2014 Source : European Environment Agency (EEA) , June 2014

136 137
ENERGY AND ENVIRONMENT
ENVIRONMENT
ENERGY AND ENVIRONMENT
ENVIRONMENT
Source: European Environment Agency (EEA) , June 2014
cO2 Emissions (*) by Sector – EU-28MILLION TONNES
cO2 Emissions (*) by Sector – EU-28MILLION TONNES
3.2 .9 3 .2 .9
TOTA
l EN
ERg
y
fUEl
cO
mb
UST
iON
ENER
gy
iNd
UST
RiES
Publ
ic E
lect
rici
ty a
nd
Hea
t Pr
oduc
tion
Petr
oleu
m R
efin
ing
Oth
er
Ener
gy in
dust
ries
mAN
UfA
cTU
RiN
g
ANd
cO
NST
RUcT
iON
iron
and
Ste
el
Non
-fer
rous
met
als
chem
ical
s
Pulp
, Pap
er a
nd P
rint
food
, bev
erag
es
and
Toba
cco
Oth
er
1990 4 136.1 4 110.2 1 665.4 1 428.1 122.5 114.8 851.7 184.2 13.9 132.1 35.4 53.5 432.6
1995 3 894.5 3 867.1 1 508.3 1 281.3 129.1 97.9 759.0 171.7 13.2 124.5 38.4 60.9 350.4
1997 3 907.0 3 879.3 1 491.9 1 265.3 134.2 92.3 737.8 165.1 14.0 117.3 38.0 59.2 344.2
1998 3 906.7 3 881.5 1 509.5 1 287.5 136.3 85.7 708.8 160.3 14.1 110.7 36.5 56.6 330.6
1999 3 849.2 3 824.4 1 466.8 1 254.0 130.2 82.6 688.8 148.9 14.4 108.4 35.1 56.6 325.5
2000 3 863.8 3 838.4 1 498.1 1 284.3 132.5 81.2 698.6 151.4 14.8 112.2 36.5 55.4 328.2
2001 3 944.4 3 919.6 1 537.0 1 324.6 134.3 78.1 675.2 142.9 15.2 108.1 34.2 55.0 319.8
2002 3 918.1 3 892.8 1 554.7 1 340.3 135.7 78.7 656.6 136.8 14.7 105.3 34.4 53.7 311.7
2003 4 005.8 3 979.8 1 605.5 1 391.7 135.4 78.4 667.0 138.4 14.1 108.9 34.8 53.1 317.7
2004 4 004.5 3 979.6 1 591.6 1 375.2 140.0 76.4 664.7 143.2 13.8 108.2 33.6 51.4 314.6
2005 3 981.2 3 955.3 1 582.9 1 363.3 142.2 77.4 655.1 139.3 12.9 108.1 34.0 50.2 310.6
2006 3 988.4 3 962.0 1 596.8 1 377.1 140.3 79.4 649.6 142.9 12.4 106.5 33.5 45.9 308.5
2007 3 930.5 3 904.3 1 604.7 1 386.2 141.2 77.3 651.2 149.1 12.2 102.3 32.9 45.5 309.2
2008 3 847.8 3 822.8 1 526.0 1 310.5 141.4 74.2 625.2 139.9 11.3 102.4 30.7 43.6 297.2
2009 3 570.1 3 546.4 1 402.5 1 208.2 133.0 61.3 521.6 100.6 10.2 90.5 28.1 40.4 251.8
2010 3 673.8 3 649.9 1 423.4 1 222.4 132.5 68.5 560.3 122.8 11.0 94.4 29.5 42.3 260.3
2011 3 534.3 3 510.6 1 401.2 1 204.5 131.4 65.3 545.8 121.9 10.2 91.7 27.8 39.3 254.9
2012 3 495.2 3 472.0 1 396.2 1 214.1 126.5 55.6 526.1 117.0 9.7 89.4 26.9 38.8 244.2
Notes: (*) excluding lUlUcF (land Use, land-Use change and Forestry) emissions and international bunkers;
(**) excluding international bunkers (international traffic departing from the eU); (***) emissions from Manufacturing and construction and industrial processes;
(****) emissions from Fuel combustion in agriculture/Forestry/Fisheries, other (Not specified elsewhere), Fugitive emissions from Fuels, Solvent and other
product Use, Waste, other.
TRAN
SPO
RT (*
*)
OTH
ER S
EcTO
RS
com
mer
cial
/ in
stit
utio
nal
Resi
dent
ial
Agric
ultu
re /
fore
stry
/fi
sher
ies
OTH
ER (N
OT
SPEc
i-fi
Ed E
lSEw
HER
E)
fUg
iTiv
E Em
iSSi
ON
S fR
Om
fU
ElS
iNd
UST
RiAl
PR
OcE
SSES
SOlv
ENT
ANd
O
THER
PRO
dU
cT U
SE
AgRi
cUlT
URE
wAS
TE
OTH
ER
TOTA
l Em
iSSi
ON
S
769.3 795.9 198.5 504.4 93.1 27.8 25.9 284.2 11.8 4.9 4 437.0 1990
822.4 761.6 181.3 491.7 88.6 15.7 27.4 261.7 9.0 4.2 4 169.4 1995
859.7 776.4 183.3 505.2 87.8 13.5 27.7 259.7 9.0 3.6 4 179.3 1997
886.9 762.6 182.6 495.0 85.1 13.7 25.2 256.5 9.1 3.6 4 175.9 1998
906.5 749.6 181.5 482.8 85.3 12.6 24.7 248.4 8.9 3.3 4 109.8 1999
903.0 726.7 175.2 468.4 83.1 12.0 25.4 260.1 8.8 3.3 4 136.0 2000
917.9 778.6 192.3 503.1 83.3 10.9 24.8 249.6 8.5 3.2 4 205.8 2001
929.4 741.5 182.0 477.9 81.6 10.6 25.3 249.7 8.5 3.5 4 179.7 2002
940.0 756.3 182.9 491.1 82.2 11.0 26.0 259.0 8.3 3.5 4 276.6 2003
959.5 752.1 186.6 483.1 82.4 11.7 24.9 270.4 8.4 3.4 4 286.7 2004
959.0 746.2 183.0 480.7 82.5 12.0 25.9 269.2 8.4 3.6 4 262.3 2005
966.6 737.9 189.5 468.8 79.6 11.1 26.4 274.0 8.3 3.5 4 274.4 2006
977.3 659.6 168.3 415.3 76.0 11.5 26.2 281.6 8.0 3.4 4 223.5 2007
955.2 705.6 180.8 447.5 77.3 10.8 24.9 264.1 7.6 3.4 4 122.9 2008
930.0 682.5 176.3 431.1 75.2 9.9 23.7 207.4 6.9 3.2 3 787.6 2009
925.4 731.4 186.9 467.7 76.8 9.4 23.9 223.6 7.1 3.3 3 907.8 2010
915.4 638.8 169.3 394.1 75.5 9.4 23.7 223.0 7.0 3.1 3 767.4 2011
882.4 658.7 174.3 410.4 74.1 8.6 23.2 212.2 6.8 2.9 3 717.1 2012
Notes: (*) excluding lUlUcF (land Use, land-Use change and Forestry) emissions and international bunkers;
(**) excluding international bunkers (international traffic departing from the eU); (***) emissions from Manufacturing and construction and industrial processes;
(****) emissions from other (Not specified elsewhere); Fugitive emissions from Fuels, Solvent and other product Use, Waste, other.
Energy Industries • Industry (***) • Transport (**) • Residential • Commercial/Institutional • Other (****) • Total
1.20
1.10
1.00
0.90
0.80
0.70
0.60
1990 = 1 19
90
1991
1992
1993
1994
1995
1996
1997
1998
1999
2000
2001
2003
2003
2004
2005
2006
2007
2008
2009
2010
2011
2012
ENERGY INDUSTRIES
INDUSTRY (***)
TRANSPORT (**)
RESIDENTIAL
COMMERCIAL/ INSTITUTIONAL
OTHER (****)
AGRICULTURE, FORESTRY, FISHERIES
37.6 %
19.9 %
23.7 %
11.0 %
2.0 %
YEAR 2012
4.7 %
1.1 %

138 139
ENERGY AND ENVIRONMENT
ENVIRONMENT
ENERGY AND ENVIRONMENT
ENVIRONMENT
Source: European Environment Agency (EEA) , June 2014
cO2 Emissions (*) by Sector – EU-28SHARES %
cO2 Emissions (*) by Sector – EU-28SHARES %
3.2 .9 3 .2 .9
TOTA
l EN
ERg
y
fUEl
cO
mb
UST
iON
ENER
gy
iNd
UST
RiES
Publ
ic E
lect
rici
ty a
nd
Hea
t Pr
oduc
tion
Petr
oleu
m R
efin
ing
Oth
er
Ener
gy in
dust
ries
mAN
UfA
cTU
RiN
g
ANd
cO
NST
RUcT
iON
iron
and
Ste
el
Non
-fer
rous
met
als
chem
ical
s
Pulp
, Pap
er a
nd P
rint
food
, bev
erag
es
and
Toba
cco
Oth
er
1990 93.2 99.4 40.5 85.8 7.4 6.9 20.7 21.6 1.6 15.5 4.2 6.3 50.8
1991 93.8 99.4 40.2 86.3 7.1 6.6 19.8 22.1 1.9 15.0 4.7 6.8 49.5
1992 93.8 99.4 39.8 86.3 7.4 6.3 19.3 21.6 1.8 14.5 4.8 7.2 50.1
1993 93.9 99.3 38.9 85.5 8.0 6.5 19.2 22.0 1.6 14.8 4.8 7.5 49.3
1994 93.5 99.3 39.3 85.1 8.2 6.6 19.4 22.9 1.8 15.3 5.1 7.8 47.1
1995 93.4 99.3 39.0 85.0 8.6 6.5 19.6 22.6 1.7 16.4 5.1 8.0 46.2
1996 93.7 99.3 38.7 85.3 8.7 6.0 18.8 21.4 1.8 16.3 5.1 8.3 47.1
1997 93.5 99.3 38.5 84.8 9.0 6.2 19.0 22.4 1.9 15.9 5.2 8.0 46.7
1998 93.6 99.4 38.9 85.3 9.0 5.7 18.3 22.6 2.0 15.6 5.1 8.0 46.6
1999 93.7 99.4 38.4 85.5 8.9 5.6 18.0 21.6 2.1 15.7 5.1 8.2 47.3
2000 93.4 99.3 39.0 85.7 8.8 5.4 18.2 21.7 2.1 16.1 5.2 7.9 47.0
2001 93.8 99.4 39.2 86.2 8.7 5.1 17.2 21.2 2.2 16.0 5.1 8.1 47.4
2002 93.7 99.4 39.9 86.2 8.7 5.1 16.9 20.8 2.2 16.0 5.2 8.2 47.5
2003 93.7 99.4 40.3 86.7 8.4 4.9 16.8 20.7 2.1 16.3 5.2 8.0 47.6
2004 93.4 99.4 40.0 86.4 8.8 4.8 16.7 21.5 2.1 16.3 5.1 7.7 47.3
2005 93.4 99.3 40.0 86.1 9.0 4.9 16.6 21.3 2.0 16.5 5.2 7.7 47.4
2006 93.3 99.3 40.3 86.2 8.8 5.0 16.4 22.0 1.9 16.4 5.2 7.1 47.5
2007 93.1 99.3 41.1 86.4 8.8 4.8 16.7 22.9 1.9 15.7 5.1 7.0 47.5
2008 93.3 99.4 39.9 85.9 9.3 4.9 16.4 22.4 1.8 16.4 4.9 7.0 47.5
2009 94.3 99.3 39.5 86.1 9.5 4.4 14.7 19.3 1.9 17.3 5.4 7.7 48.3
2010 94.0 99.3 39.0 85.9 9.3 4.8 15.4 21.9 2.0 16.8 5.3 7.5 46.5
2011 93.8 99.3 39.9 86.0 9.4 4.7 15.5 22.3 1.9 16.8 5.1 7.2 46.7
2012 94.0 99.3 40.2 87.0 9.1 4.0 15.2 22.2 1.8 17.0 5.1 7.4 46.4
Notes: (*) excluding lUlUcF (land Use, land-Use change and Forestry) emissions and international bunkers.
indirect emissions from electricity use are not included in the co2 emissions from fuel combustion by Manufacturing and construction, transport and other sectors (commercial/institutional, Residential and agriculture/Forestry/Fisheries).
TRAN
SPO
RT (*
*)
OTH
ER S
EcTO
RS
com
mer
cial
/ in
stit
utio
nal
Resi
dent
ial
Agric
ultu
re /
fore
stry
/fi
sher
ies
OTH
ER (N
OT
SPEc
i-fi
Ed E
lSEw
HER
E)
fUg
iTiv
E Em
iSSi
ON
S fR
Om
fU
ElS
iNd
UST
RiAl
PR
OcE
SSES
SOlv
ENT
ANd
O
THER
PRO
dU
cT U
SE
AgRi
cUlT
URE
wAS
TE
OTH
ER
TOTA
l Em
iSSi
ON
S
18.7 19.4 24.9 63.4 11.7 0.7 0.6 6.4 0.3 0.1 100 1990
19.0 20.4 24.7 64.3 11.0 0.6 0.6 5.9 0.3 0.1 100 1991
20.3 20.1 24.6 64.4 11.0 0.5 0.6 5.8 0.3 0.1 100 1992
20.8 20.7 23.4 65.4 11.3 0.4 0.7 5.7 0.2 0.1 100 1993
21.1 19.7 23.3 64.9 11.8 0.4 0.7 6.1 0.2 0.1 100 1994
21.3 19.7 23.8 64.6 11.6 0.4 0.7 6.3 0.2 0.1 100 1995
21.3 20.8 24.0 65.1 11.0 0.4 0.7 5.9 0.2 0.1 100 1996
22.2 20.0 23.6 65.1 11.3 0.3 0.7 6.2 0.2 0.1 100 1997
22.8 19.6 23.9 64.9 11.2 0.4 0.6 6.1 0.2 0.1 100 1998
23.7 19.6 24.2 64.4 11.4 0.3 0.6 6.0 0.2 0.1 100 1999
23.5 18.9 24.1 64.5 11.4 0.3 0.7 6.3 0.2 0.1 100 2000
23.4 19.9 24.7 64.6 10.7 0.3 0.6 5.9 0.2 0.1 100 2001
23.9 19.0 24.5 64.5 11.0 0.3 0.6 6.0 0.2 0.1 100 2002
23.6 19.0 24.2 64.9 10.9 0.3 0.6 6.1 0.2 0.1 100 2003
24.1 18.9 24.8 64.2 11.0 0.3 0.6 6.3 0.2 0.1 100 2004
24.2 18.9 24.5 64.4 11.1 0.3 0.7 6.3 0.2 0.1 100 2005
24.4 18.6 25.7 63.5 10.8 0.3 0.7 6.4 0.2 0.1 100 2006
25.0 16.9 25.5 63.0 11.5 0.3 0.7 6.7 0.2 0.1 100 2007
25.0 18.5 25.6 63.4 11.0 0.3 0.6 6.4 0.2 0.1 100 2008
26.2 19.2 25.8 63.2 11.0 0.3 0.7 5.5 0.2 0.1 100 2009
25.4 20.0 25.5 63.9 10.5 0.3 0.7 5.7 0.2 0.1 100 2010
26.1 18.2 26.5 61.7 11.8 0.3 0.7 5.9 0.2 0.1 100 2011
25.4 19.0 26.5 62.3 11.2 0.2 0.7 5.7 0.2 0.1 100 2012
Notes: (*) excluding lUlUcF (land Use, land-Use change and Forestry) emissions and international bunkers;
(**) excluding international bunkers (international traffic departing from the eU). indirect emissions from electricity use are not included in the co2 emissions
from fuel combustion by Manufacturing and construction, transport and other sectors (commercial/institutional, Residential and agriculture/Forestry/Fisheries).

140 141
ENERGY AND ENVIRONMENT
ENVIRONMENT
ENERGY AND ENVIRONMENT
ENVIRONMENT
Source: European Environment Agency (EEA) , June 2014
cO2 Emissions (*) by Sector – 2012MILLION TONNES
cO2 Emissions (*) by Sector – 2012MILLION TONNES
3.2 .10 3 .2 .10
TOTA
l EN
ERg
y
fUEl
cO
mb
UST
iON
ENER
gy
iNd
UST
RiES
Publ
ic E
lect
rici
ty a
nd
Hea
t Pr
oduc
tion
Petr
oleu
m R
efin
ing
Oth
er
Ener
gy in
dust
ries
mAN
UfA
cTU
RiN
g
ANd
cO
NST
RUcT
iON
iron
and
Ste
el
Non
-fer
rous
met
als
chem
ical
s
Pulp
, Pap
er a
nd P
rint
food
, bev
erag
es
and
Toba
cco
Oth
er
EU-28 3 495.2 3 472.0 1 396.2 1 214.1 126.5 55.6 526.1 117.0 9.7 89.4 26.9 38.8 244.2
BE 92.9 92.8 22.7 17.9 4.6 0.2 20.7 4.4 0.4 6.8 0.5 2.1 6.4
BG 45.0 45.0 31.4 30.4 1.0 0.0 3.3 0.1 0.1 1.0 0.1 0.3 1.7
CZ 101.6 101.3 57.1 52.3 1.0 3.8 16.5 3.1 0.1 6.4 0.7 0.9 5.4
DK 38.2 38.0 16.5 14.1 1.0 1.4 4.2 0.1 0.0 0.2 0.1 1.2 2.6
DE 768.0 766.6 360.1 329.6 18.5 12.0 114.1 33.1 0.1 0.0 0.2 80.8
EE 16.6 16.6 13.0 12.6 0.4 0.8 0.0 0.0 0.0 0.0 0.0 0.7
IE 36.5 36.5 12.6 12.2 0.3 0.1 4.3 0.0 1.5 0.3 0.0 0.8 1.6
EL 85.0 85.0 54.5 50.9 3.6 0.0 5.5 0.2 0.5 0.7 0.1 0.5 3.4
ES 260.5 257.2 91.1 76.9 12.4 1.9 45.5 6.1 2.1 7.9 5.0 3.0 21.4
FR 344.3 340.9 52.1 40.4 8.6 3.0 62.6 13.3 0.9 18.7 2.6 8.8 18.3
HR 17.5 16.9 5.6 3.8 1.6 0.2 2.8 0.1 0.0 0.3 0.1 0.4 1.9
IT 368.5 366.3 125.6 90.7 25.7 9.2 53.7 15.4 1.1 6.9 4.3 3.5 22.5
CY 6.5 6.5 3.5 3.5 0.4 0.0 0.0 0.1 0.3
LV 6.8 6.8 1.9 1.8 0.1 0.9 0.1 0.0 0.0 0.0 0.1 0.6
LT 11.3 11.3 4.4 2.9 1.4 0.0 1.3 0.2 0.1 0.3 0.7
LU 10.3 10.3 1.0 1.0 1.3 0.3 0.1 0.2 0.0 0.0 0.6
HU 42.9 42.7 16.5 14.8 1.4 0.2 4.0 1.1 0.2 0.5 0.2 0.5 1.5
MT 2.8 2.8 2.1 2.1 0.1 0.1
NL 159.0 158.0 59.9 48.1 9.8 2.1 25.8 4.3 0.2 12.3 1.1 3.4 4.5
AT 58.5 58.3 12.3 9.0 2.8 0.5 15.4 5.9 0.2 1.8 2.0 1.0 4.6
PL 302.1 298.4 168.6 160.1 6.0 2.5 30.6 6.0 1.1 7.5 1.5 4.2 10.4
PT 46.7 45.7 17.3 15.1 2.1 7.4 0.1 0.9 1.0 0.9 4.5
RO 73.4 72.8 32.4 29.0 2.0 1.4 15.3 3.0 3.6 0.1 1.0 7.6
SI 14.9 14.8 6.0 6.0 0.0 1.6 0.2 0.1 0.1 0.3 0.1 0.8
SK 28.0 28.0 9.4 6.1 2.1 1.3 7.2 3.3 0.2 1.3 0.3 0.3 1.8
FI 46.5 46.4 20.4 17.6 2.6 0.3 8.2 2.3 0.1 0.6 3.0 0.2 2.1
SE 40.6 39.7 9.7 7.2 2.2 0.4 8.2 1.2 0.1 1.2 1.0 0.5 4.2
UK 470.1 466.4 188.3 157.9 15.7 14.7 64.5 13.4 0.6 9.9 2.9 4.5 33.1
MK
TR 301.8 301.7 119.2 116.8 2.5 56.0 6.0 1.4 3.8 0.7 1.3 42.8
IS 1.7 1.5 0.0 0.0 0.2 0.0 0.0 0.1 0.1
NO 37.8 35.0 13.9 1.5 0.8 11.6 3.1 0.1 0.2 1.2 0.2 0.3 1.1
CH 41.0 41.0 4.0 3.3 0.7 5.5 0.3 0.1 0.8 0.2 0.9 3.3
Note: (*) excluding international bunkers and lUlUcF (land Use, land-Use change and Forestry) emissions.
TRAN
SPO
RT (*
*)
OTH
ER S
EcTO
RS
com
mer
cial
/ in
stit
utio
nal
Resi
dent
ial
Agric
ultu
re /
fore
stry
/fi
sher
ies
OTH
ER (N
OT
SPEc
i-fi
Ed E
lSEw
HER
E)
fUg
iTiv
E Em
iSSi
ON
S fR
Om
fU
ElS
iNd
UST
RiAl
PR
OcE
SSES
SOlv
ENT
ANd
O
THER
PRO
dU
cT U
SE
AgRi
cUlT
URE
wAS
TE
OTH
ER
TOTA
l Em
iSSi
ON
S
882.4 658.7 174.3 410.4 74.1 8.6 23.2 212.2 6.8 2.9 3 717.1 EU-28
24.7 24.7 5.9 16.7 2.1 0.0 0.1 7.2 0.5 100.7 BE
8.3 1.9 0.3 1.1 0.5 0.0 3.3 0.0 0.0 48.4 BG
16.2 10.4 3.3 6.9 0.2 1.1 0.3 9.3 0.2 0.2 111.3 CZ
12.1 5.0 0.8 2.1 2.1 0.1 0.2 1.0 0.1 0.0 39.4 DK
153.9 137.5 38.0 93.3 6.2 1.0 1.5 52.2 1.4 821.7 DE
2.3 0.5 0.0 0.2 0.3 0.0 0.5 0.0 0.0 17.1 EE
10.8 8.8 2.1 6.0 0.7 1.4 0.1 0.0 38.0 IE
15.8 9.2 1.3 6.9 0.9 0.0 5.3 0.2 0.0 90.5 EL
79.8 40.8 13.2 16.7 10.9 3.3 15.4 0.8 0.0 276.6 ES
130.9 95.4 28.7 55.4 11.3 3.4 16.7 1.0 1.2 363.3 FR
5.6 2.9 0.5 1.7 0.7 0.5 1.7 0.1 0.0 19.2 HR
104.8 81.8 27.7 47.3 6.8 0.3 2.2 17.0 1.0 0.2 386.7 IT
2.1 0.5 0.0 0.4 0.1 0.0 0.6 0.0 7.1 CY
2.7 1.3 0.4 0.5 0.4 0.0 0.0 0.6 0.0 0.0 7.4 LV
4.5 1.2 0.3 0.8 0.1 0.0 0.0 2.8 0.1 0.0 14.2 LT
6.4 1.6 0.6 0.9 0.1 0.0 0.5 0.0 10.9 LU
10.7 11.5 3.3 7.3 0.9 0.2 3.1 0.1 0.1 46.1 HU
0.5 0.1 0.1 0.0 0.0 0.0 0.0 2.8 MT
33.7 38.2 11.1 17.9 9.2 0.3 1.1 6.1 0.1 165.3 NL
21.4 9.1 1.4 6.9 0.8 0.0 0.2 9.0 0.2 0.0 67.7 AT
46.1 53.0 9.1 33.5 10.4 3.7 17.8 0.6 0.3 320.9 PL
16.8 4.1 1.1 2.0 1.0 0.0 1.0 3.4 0.2 0.0 50.3 PT
14.9 9.7 2.0 6.5 1.2 0.6 0.6 10.3 0.1 0.0 83.9 RO
5.7 1.6 0.4 0.9 0.2 0.0 0.1 0.8 0.0 15.7 SI
6.5 3.9 0.7 3.1 0.1 1.0 0.0 7.2 0.1 0.0 35.2 SK
12.5 4.0 1.0 1.4 1.5 1.4 0.1 4.2 0.0 50.7 FI
18.9 2.8 0.5 0.8 1.5 0.2 0.9 4.8 0.2 0.1 45.7 SE
113.8 97.2 20.1 73.0 4.2 2.5 3.8 10.1 0.3 480.5 UK
MK
61.2 65.2 61.9 3.3 0.1 55.7 357.5 TR
0.8 0.5 0.0 0.0 0.5 0.2 1.7 0.0 0.0 3.3 IS
14.8 3.0 0.7 0.3 2.0 0.3 2.8 6.2 0.1 44.1 NO
16.2 15.1 4.5 10.1 0.6 0.1 0.0 2.1 0.2 0.0 0.0 43.3 CH
Notes: (*) excluding international bunkers and lUlUcF (land Use, land-Use change and Forestry) emissions; (**) excluding international bunkers (international traffic departing from the eU).

ENERGY AND ENVIRONMENT
ENVIRONMENT
ENERGY AND ENVIRONMENT
ENVIRONMENT
142 143
Titlesubtitle
Titlesubtitle
Total Civil Aviation • Road Transportation • Railways (***) • Total Navigation • Other • Total Transport
1.80
1.60
1.40
1.20
1.00
0.80
0.60
0.40
1990 = 1 19
90
1991
1992
1993
1994
1995
1996
1997
1998
1999
2000
2001
2002
2003
2004
2005
2006
2007
2008
2009
2010
2011
2012
cO2 Emissions from Transport – EU-28 BY MODE (MILLION TONNES)
3.2 .11 3 .2 .11
Notes: (*) excluding international bunkers (international traffic departing from the eU); (**) including international bunkers but excluding lUlUcF; (***) excluding indirect emissions from electricity consumption; (****) combustion emissions from all remaining transport activities including
pipeline transportation, ground activities in airports and harbours, and off-road activities.
iNclUdiNg iNTERNATiONAl bUNkERS
TOTA
l
civ
il A
viA
TiO
N
civi
l Avi
atio
n
(dom
esti
c) (*
)
inte
rnat
iona
l bu
nker
s –
Avia
tion
ROAd
TR
ANSP
ORT
ATiO
N
RAil
wAy
S (*
**)
TOTA
l N
Avig
ATiO
N
Nav
igat
ion
(d
omes
tic)
(*)
inte
rnat
iona
l bun
kers
–
mar
itim
e Tr
ansp
ort
OTH
ER
TRAN
SPOR
TATi
ON (*
***)
TOTA
l TR
ANSP
ORT
TOTA
l Em
iSSi
ON
S(*
*)
1990 83.3 14.0 69.2 710.2 13.1 131.7 22.6 109.2 9.5 947.7 4 615.41995 100.3 14.4 85.9 767.8 10.3 131.4 21.6 109.9 8.3 1 018.2 4 365.21997 110.8 16.8 93.9 802.9 9.8 148.6 22.1 126.4 8.0 1 080.1 4 399.71998 118.9 17.4 101.4 828.6 9.6 155.0 23.0 131.9 8.3 1 120.2 4 409.21999 127.9 18.9 109.1 847.4 9.1 148.6 22.5 126.2 8.7 1 141.8 4 345.02000 134.5 19.3 115.2 845.5 9.3 153.2 20.0 133.2 8.9 1 151.4 4 384.32001 132.4 18.7 113.7 861.5 8.5 159.6 20.3 139.3 8.8 1 170.9 4 458.82002 128.9 18.0 111.0 873.9 8.5 163.2 20.0 143.2 8.9 1 183.5 4 433.92003 133.0 17.6 115.4 884.4 8.4 167.4 20.7 146.7 8.9 1 202.2 4 538.82004 142.8 18.5 124.3 902.3 8.4 176.5 20.9 155.5 9.4 1 239.4 4 566.62005 150.1 18.9 131.2 901.4 7.7 185.9 20.7 165.2 10.2 1 255.4 4 558.72006 156.0 19.1 136.9 908.4 7.7 195.4 20.8 174.5 10.6 1 278.0 4 585.82007 160.4 19.3 141.1 920.2 8.0 197.5 19.9 177.6 9.9 1 296.0 4 542.22008 160.6 18.8 141.9 899.2 7.8 195.1 18.9 176.1 10.5 1 273.3 4 440.92009 148.8 17.4 131.4 876.8 7.1 178.2 19.0 159.2 9.6 1 220.6 4 078.32010 148.3 17.1 131.2 873.0 7.1 173.5 18.9 154.6 9.4 1 211.2 4 193.62011 151.9 16.8 135.1 865.0 7.3 176.5 17.1 159.4 9.2 1 209.9 4 062.02012 149.3 16.0 133.3 833.3 7.0 161.5 17.0 144.5 9.2 1 160.2 3 995.0
iNclUdiNg iNTERNATiONAl bUNkERS
TOTA
l
civ
il A
viA
TiO
N
civi
l Avi
atio
n
(dom
esti
c) (*
)
inte
rnat
iona
l bu
nker
s –
Avia
tion
ROAd
TR
ANSP
ORT
ATiO
N
RAil
wAy
S (*
**)
TOTA
l N
Avig
ATiO
N
Nav
igat
ion
(d
omes
tic)
(*)
inte
rnat
iona
l bun
kers
–
mar
itim
e Tr
ansp
ort
OTH
ER
TRAN
SPOR
TATi
ON (*
***)
TOTA
l TR
ANSP
ORT
(*
****
)
TOTA
l Em
iSSi
ON
S(*
*)
1990 8.8 16.9 83.1 74.9 1.4 13.9 17.1 82.9 1.0 20.5 1001995 9.9 14.4 85.6 75.4 1.0 12.9 16.4 83.6 0.8 23.3 1001997 10.3 15.2 84.8 74.3 0.9 13.8 14.9 85.1 0.7 24.5 1001998 10.6 14.7 85.3 74.0 0.9 13.8 14.9 85.1 0.7 25.4 1001999 11.2 14.7 85.3 74.2 0.8 13.0 15.1 84.9 0.8 26.3 1002000 11.7 14.4 85.6 73.4 0.8 13.3 13.1 86.9 0.8 26.3 1002001 11.3 14.1 85.9 73.6 0.7 13.6 12.7 87.3 0.8 26.3 1002002 10.9 13.9 86.1 73.8 0.7 13.8 12.3 87.7 0.8 26.7 1002003 11.1 13.2 86.8 73.6 0.7 13.9 12.4 87.6 0.7 26.5 1002004 11.5 12.9 87.1 72.8 0.7 14.2 11.9 88.1 0.8 27.1 1002005 12.0 12.6 87.4 71.8 0.6 14.8 11.1 88.9 0.8 27.5 1002006 12.2 12.2 87.8 71.1 0.6 15.3 10.7 89.3 0.8 27.9 1002007 12.4 12.0 88.0 71.0 0.6 15.2 10.1 89.9 0.8 28.5 1002008 12.6 11.7 88.3 70.6 0.6 15.3 9.7 90.3 0.8 28.7 1002009 12.2 11.7 88.3 71.8 0.6 14.6 10.6 89.4 0.8 29.9 1002010 12.2 11.6 88.4 72.1 0.6 14.3 10.9 89.1 0.8 28.9 1002011 12.6 11.0 89.0 71.5 0.6 14.6 9.7 90.3 0.8 29.8 1002012 12. 9 10.7 89.3 71.8 0.6 13.9 10.5 89.5 0.8 29.0 100
Notes: (*) excluding international bunkers (international traffic departing from the eU); (**) including international bunkers but excluding lUlUcF; (***) excluding indirect emissions from electricity consumption; (****) combustion emissions from all remaining transport activities including
pipeline transportation, ground activities in airports and harbours, and off-road activities;
(*****) total transport share in total emissions.
Source : European Environment Agency (EEA) , June 2014Source: European Environment Agency (EEA) , June 2014
cO2 Emissions from Transport – EU-28 BY MODE (SHARE %)
TOTAL CIVIL AVIATION
ROAD TRANSPORTATION
RAILWAYS (***)
TOTAL NAVIGATION
OTHER
0.8 %
12.9 %
71.8 %
13.9 %0.6 %
YEAR 2012

ENERGY AND ENVIRONMENT
ENVIRONMENT
ENERGY AND ENVIRONMENT
ENVIRONMENT
144 145
Titlesubtitle
Titlesubtitle
cO2 Emissions from Transport – 2012 BY MODE (SHARE %)
cO2 Emissions from Transport – 2012 BY MODE (MILLION TONNES)
3.2 .12 3 .2 .12
Source: European Environment Agency (EEA) , June 2014 Source : European Environment Agency (EEA) , June 2014
iNclUdiNg iNTERNATiONAl bUNkERS
TOTA
l
civ
il A
viA
TiO
N
civi
l Avi
atio
n
(dom
esti
c) (*
)
inte
rnat
iona
l bu
nker
s –
Avia
tion
ROAd
TR
ANSP
ORT
ATiO
N
RAil
wAy
S
TOTA
l N
Avig
ATiO
N
Nav
igat
ion
(d
omes
tic)
(*)
inte
rnat
iona
l bun
kers
–
mar
itim
e Tr
ansp
ort
OTH
ER
TRAN
SPO
RTAT
iON
TOTA
l
TRAN
SPO
RT
TOTA
l Em
iSSi
ON
S(*
*)
EU-28 149.3 16.0 133.3 833.3 7.0 161.5 17.0 144.5 9.2 1 160.2 3 995.0
BE 4.1 0.0 4.0 23.9 0.1 20.1 0.5 19.6 0.2 48.3 124.3BG 0.5 0.0 0.5 7.7 0.1 0.2 0.0 0.2 0.5 9.0 49.1CZ 0.9 0.0 0.9 15.9 0.3 0.0 0.0 0.1 17.1 112.2DK 2.6 0.1 2.5 11.2 0.2 2.0 0.5 1.5 16.1 43.4DE 27.2 1.9 25.3 145.8 1.0 9.1 1.0 8.2 4.1 187.3 855.2EE 0.1 0.0 0.1 2.1 0.1 0.6 0.0 0.5 2.9 17.7IE 1.8 0.0 1.7 10.3 0.1 0.6 0.2 0.4 0.1 12.9 40.2
EL 3.0 0.5 2.5 13.6 0.1 8.9 1.7 7.3 0.0 25.6 100.3ES 16.6 3.1 13.5 73.4 0.3 29.3 2.6 26.6 0.3 119.9 316.8FR 21.2 5.0 16.2 123.5 0.5 9.2 1.2 8.0 0.5 155.0 387.4HR 0.4 0.1 0.3 5.4 0.1 0.1 0.1 5.9 19.5
IT 11.5 2.2 9.3 97.0 0.0 10.5 4.9 5.6 0.7 119.8 401.6CY 0.8 0.0 0.8 2.0 0.6 0.6 3.5 8.5LV 0.4 0.0 0.4 2.5 0.2 0.8 0.0 0.8 3.9 8.6LT 0.2 0.0 0.2 4.0 0.2 0.4 0.0 0.4 0.2 5.1 14.8LU 1.1 0.0 1.1 6.4 0.0 0.0 0.0 0.0 7.5 12.0
HU 0.5 0.0 0.5 10.6 0.1 0.0 0.0 11.2 46.6MT 0.3 0.0 0.3 0.5 3.7 0.0 3.7 0.0 4.5 6.8NL 10.1 0.0 10.1 32.9 0.1 44.1 0.7 43.4 87.2 218.8AT 2.1 0.1 2.1 20.8 0.1 0.1 0.0 0.0 0.4 23.5 69.9PL 1.7 0.1 1.7 45.1 0.4 0.5 0.0 0.5 0.6 48.3 323.0PT 3.1 0.4 2.7 16.2 0.0 2.3 0.2 2.1 21.6 55.1RO 0.5 0.1 0.4 14.0 0.6 0.2 0.1 0.0 0.0 15.3 84.3
SI 0.1 0.0 0.1 5.7 0.0 0.2 0.2 0.0 5.9 15.9SK 0.1 0.0 0.1 6.4 0.1 0.0 0.0 0.0 0.0 6.6 35.3FI 2.1 0.2 1.9 11.1 0.1 0.8 0.5 0.4 0.6 14.7 53.0
SE 2.7 0.5 2.2 17.7 0.1 6.1 0.3 5.8 0.3 26.8 53.6UK 33.5 1.5 32.0 107.4 2.1 11.1 2.3 8.8 0.4 154.6 521.2MKTR 11.5 3.7 7.8 55.5 0.4 4.2 1.6 2.6 71.6 367.9IS 0.5 0.0 0.4 0.8 0.2 0.0 0.2 1.4 3.9
NO 2.5 1.2 1.2 10.0 0.0 3.4 1.9 1.6 1.6 17.6 46.9CH 4.8 0.1 4.7 15.9 0.0 0.1 0.1 0.0 0.0 20.9 47.9
Notes: (*) excluding international bunkers (international traffic departing from the eU); (**) including international bunkers but excluding lUlUcF.
iNclUdiNg iNTERNATiONAl bUNkERS
TOTA
l
civ
il A
viA
TiO
N
civi
l Avi
atio
n
(dom
esti
c) (*
)
inte
rnat
iona
l bu
nker
s –
Avia
tion
ROAd
TR
ANSP
ORT
ATiO
N
RAil
wAy
S
TOTA
l N
Avig
ATiO
N
Nav
igat
ion
(d
omes
tic)
(*)
inte
rnat
iona
l bun
kers
–
mar
itim
e Tr
ansp
ort
OTH
ER
TRAN
SPO
RTAT
iON
TOTA
l
TRAN
SPO
RT (*
**)
TOTA
l Em
iSSi
ON
S(*
*)
EU-28 12.9 10.7 89.3 71.8 0.6 13.9 10.5 89.5 0.8 29.0 100
BE 8.4 0.7 99.3 49.5 0.2 41.5 2.3 97.7 0.4 38.9 100BG 5.8 6.5 93.5 85.9 0.8 2.3 4.1 95.9 5.2 18.4 100CZ 5.4 0.8 99.2 92.5 1.6 0.1 100.0 0.4 15.3 100DK 16.4 5.0 95.0 69.6 1.5 12.5 24.8 75.2 37.1 100DE 14.5 6.9 93.1 77.8 0.6 4.9 10.6 89.4 2.2 21.9 100EE 4.0 2.9 97.1 73.8 3.2 19.0 2.3 97.7 16.4 100IE 13.6 0.6 99.4 79.9 0.9 4.5 31.4 68.6 1.1 32.2 100
EL 11.7 16.3 83.7 53.0 0.3 34.9 18.6 81.4 0.0 25.6 100ES 13.9 18.9 81.1 61.2 0.2 24.4 9.0 91.0 0.2 37.9 100FR 13.7 23.8 76.2 79.7 0.3 5.9 13.5 86.5 0.3 40.0 100HR 6.0 26.7 73.3 90.8 1.3 1.9 100.0 30.3 100
IT 9.6 18.9 81.1 81.0 0.0 8.8 46.4 53.6 0.6 29.8 100CY 24.1 3.5 96.5 58.3 17.7 100.0 40.8 100LV 9.5 0.6 99.4 64.0 6.4 20.1 1.7 98.3 45.1 100LT 3.8 0.9 99.1 79.9 3.6 7.9 3.7 96.3 4.9 34.3 100LU 14.8 0.0 100.0 85.1 0.1 0.0 91.2 8.8 63.0 100
HU 4.4 0.3 99.7 94.3 1.1 0.2 100.0 24.1 100MT 6.9 0.4 99.6 10.8 81.9 0.9 99.1 0.4 66.8 100NL 11.6 0.2 99.8 37.7 0.1 50.6 1.6 98.4 39.9 100AT 9.0 2.6 97.4 88.5 0.5 0.2 20.2 79.8 1.7 33.7 100PL 3.5 3.3 96.7 93.5 0.7 1.0 2.4 97.6 1.3 14.9 100PT 14.3 11.9 88.1 74.9 0.2 10.7 9.7 90.3 39.2 100RO 3.4 23.3 76.7 91.6 3.7 1.1 75.3 24.7 0.2 18.2 100
SI 1.1 2.6 97.4 95.5 0.6 2.7 100.0 0.0 37.3 100SK 1.4 5.3 94.7 97.3 1.1 0.2 10.8 89.2 0.0 18.6 100FI 14.2 9.7 90.3 75.1 0.7 5.7 57.5 42.5 4.3 27.8 100
SE 10.0 19.2 80.8 66.1 0.2 22.6 5.0 95.0 1.1 50.0 100UK 21.7 4.6 95.4 69.5 1.4 7.2 20.8 79.2 0.3 29.7 100MKTR 16.0 32.4 67.6 77.5 0.6 5.9 38.3 61.7 19.5 100IS 32.1 4.5 95.5 54.3 13.6 7.0 93.0 36.5 100
NO 14.0 49.9 50.1 57.0 0.2 19.6 54.9 45.1 9.1 37.5 100CH 22.9 2.9 97.1 75.9 0.2 0.7 81.4 18.6 0.2 43.6 100
Notes: (*) excluding international bunkers (international traffic departing from the eU); (**) including international bunkers but excluding lUlUcF; (***) total transport share in total emissions.
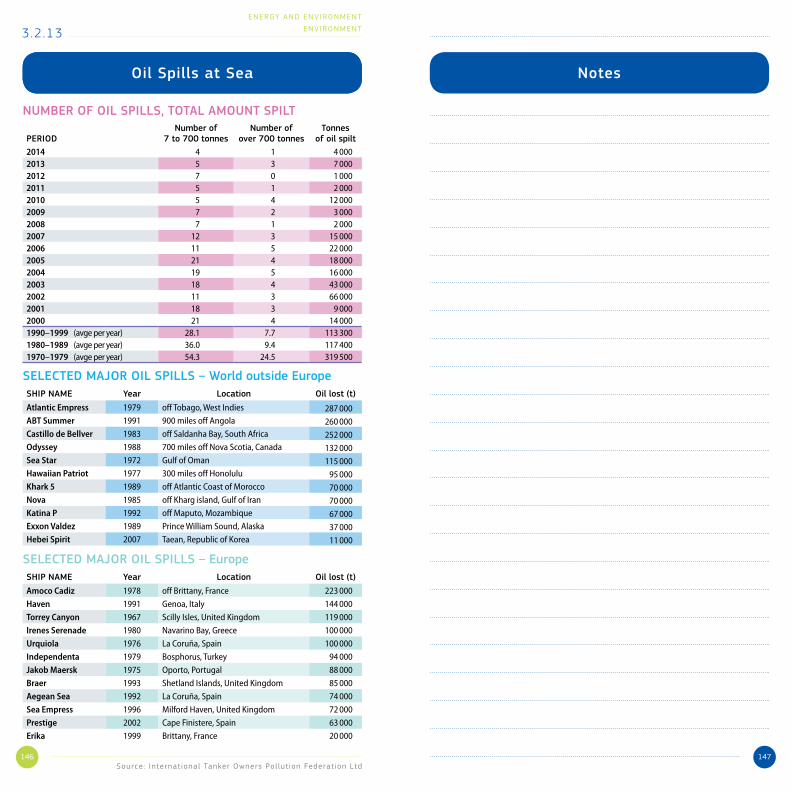
147
ENERGY AND ENVIRONMENT
ENVIRONMENT
146
Titlesubtitle
Source : Internat ional Tanker Owners Pol lut ion Federat ion Ltd
Oil Spills at Sea
3.2 .13
NUmbER Of Oil SPillS, TOTAl AmOUNT SPilT
PERiOdNumber of
7 to 700 tonnesNumber of
over 700 tonnesTonnes
of oil spilt2014 4 1 4 000 2013 5 3 7 000 2012 7 0 1 000 2011 5 1 2 000 2010 5 4 12 000 2009 7 2 3 000 2008 7 1 2 000 2007 12 3 15 000 2006 11 5 22 000 2005 21 4 18 000 2004 19 5 16 000 2003 18 4 43 000 2002 11 3 66 000 2001 18 3 9 000 2000 21 4 14 000 1990–1999 (avge per year) 28.1 7.7 113 300 1980–1989 (avge per year) 36.0 9.4 117 400 1970–1979 (avge per year) 54.3 24.5 319 500
SElEcTEd mAJOR Oil SPillS – world outside Europe SHiP NAmE year location Oil lost (t)Atlantic Empress 1979 off Tobago, West Indies 287 000 ABT Summer 1991 900 miles off Angola 260 000 Castillo de Bellver 1983 off Saldanha Bay, South Africa 252 000 Odyssey 1988 700 miles off Nova Scotia, Canada 132 000 Sea Star 1972 Gulf of Oman 115 000 Hawaiian Patriot 1977 300 miles off Honolulu 95 000 Khark 5 1989 off Atlantic Coast of Morocco 70 000 Nova 1985 off Kharg island, Gulf of Iran 70 000 Katina P 1992 off Maputo, Mozambique 67 000 Exxon Valdez 1989 Prince William Sound, Alaska 37 000 Hebei Spirit 2007 Taean, Republic of Korea 11 000
SElEcTEd mAJOR Oil SPillS – Europe SHiP NAmE year location Oil lost (t)Amoco Cadiz 1978 off Brittany, France 223 000
Haven 1991 Genoa, Italy 144 000
Torrey Canyon 1967 Scilly Isles, United Kingdom 119 000
Irenes Serenade 1980 Navarino Bay, Greece 100 000
Urquiola 1976 La Coruña, Spain 100 000
Independenta 1979 Bosphorus, Turkey 94 000
Jakob Maersk 1975 Oporto, Portugal 88 000
Braer 1993 Shetland Islands, United Kingdom 85 000
Aegean Sea 1992 La Coruña, Spain 74 000
Sea Empress 1996 Milford Haven, United Kingdom 72 000
Prestige 2002 Cape Finistere, Spain 63 000
Erika 1999 Brittany, France 20 000
Notes

148
Notes
HOw TO ObTAiN EU PUblicATiONS
free publications:
• one copy: via EU Bookshop (http://bookshop.europa.eu);• more than one copy or posters/maps: from the European Union’s representations
(http://ec.europa.eu/represent_en.htm); from the delegations in non-eU countries (http://eeas.europa.eu/delegations/index_en.htm); by contacting the europe Direct service (http://europa.eu/europedirect/index_en.htm) or calling 00 800 6 7 8 9 10 11 (freephone number from anywhere in the eU) (*).
(*) the information given is free, as are most calls (though some operators, phone boxes or hotels may charge you).
Priced publications:
• via EU Bookshop (http://bookshop.europa.eu).