Embed Size (px)
Citation preview

EN
EU - KENYA Cooperation
11*1 EUROPEAN DEVELOPMENT TOND
NATIONAL INDICATIVE PROGRAMME 2014 - 2020
Ref. Ares(2014)2070433 - 24/06/2014
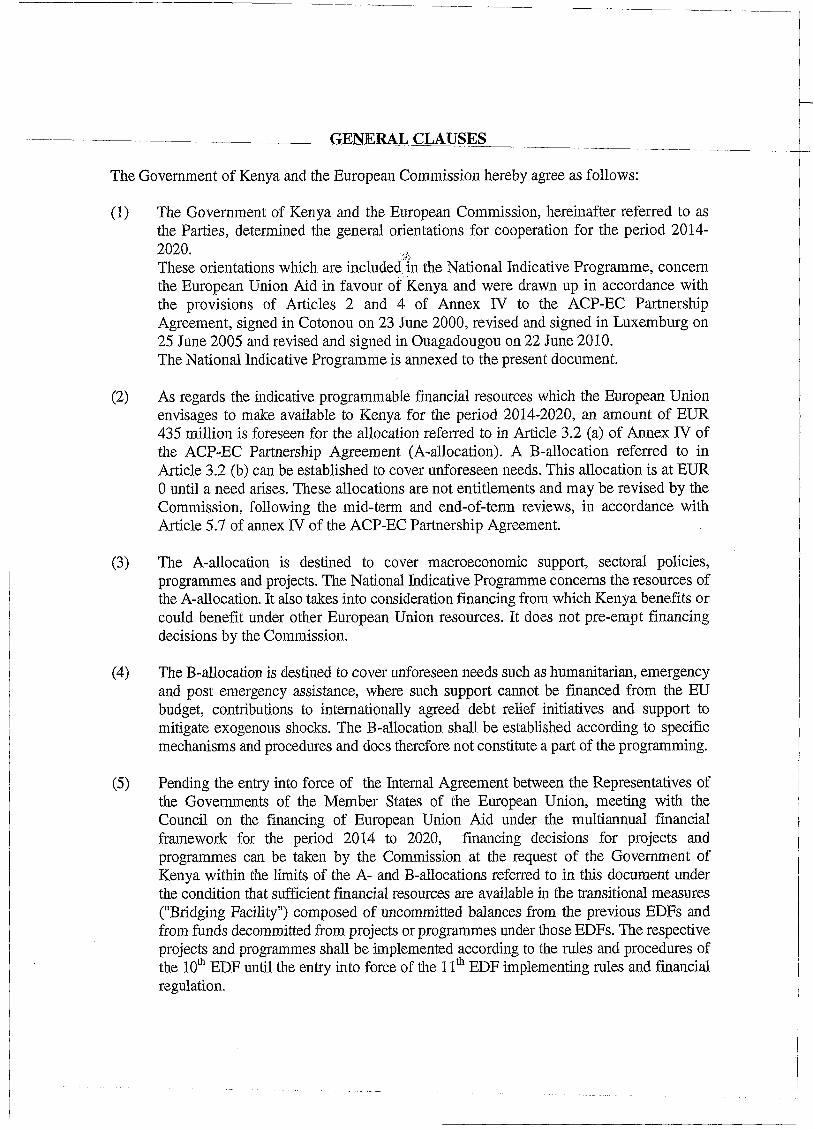
GENERAL CLAUSES
The Government of Kenya and the European Commission hereby agree as follows:
(1) The Government of Kenya and the European Commission, hereinafter referred to as the Parties, determined the general orientations for cooperation for the period 20142020. A
These orientations which are included, in the National Indicative Programme, concern the European Union Aid in favour of Kenya and were drawn up in accordance with the provisions of Articles 2 and 4 of Annex IV to the ACP-EC Partnership Agreement, signed in Cotonou on 23 June 2000, revised and signed in Luxemburg on 25 June 2005 and revised and signed in Ouagadougou on 22 June 2010. The National Indicative Programme is annexed to the present document.
(2) As regards the indicative programmable financial resources which the European Union envisages to make available to Kenya for the period 2014-2020, an amount of EUR 435 million is foreseen for the allocation referred to in Article 3.2 (a) of Annex IV of the ACP-EC Partnership Agreement (A-allocation). A B-allocation referred to in Article 3.2 (b) can be established to cover unforeseen needs. This allocation is at EUR 0 until a need arises. These allocations are not entitlements and may be revised by the Commission, following the mid-term and end-of-term reviews, in accordance with Article 5.7 of annex IV of the ACP-EC Partnership Agreement.
(3) The A-allocation is destined to cover macroeconomic support, sectoral policies, programmes and projects. The National Indicative Programme concerns the resources of the A-allocation. It also takes into consideration financing from which Kenya benefits or could benefit under other European Union resources. It does not pre-empt financing decisions by the Commission.
(4) The B-allocation is destined to cover unforeseen needs such as humanitarian, emergency and post emergency assistance, where such support cannot be financed from the EU budget, contributions to internationally agreed debt relief initiatives and support to mitigate exogenous shocks. The B-allocation shah be established according to specific mechanisms and procedures and does therefore not constitute a part of the programming.
(5) Pending the entry into force of the Memal Agreement between the Representatives of the Governments of the Member States of the European Union, meeting with the Council on the financing of European Union Aid under the multiannual financial framework for the period 2014 to 2020, financing decisions for projects and programmes can be taken by the Commission at the request of the Government of Kenya within the limits of the A- and B-allocations referred to in this document under the condition that sufficient financial resources are available in the transitional measures ("Bridging Facility") composed of uncommitted balances from the previous EDFs and from funds decommitted from projects or programmes under those EDFs. The respective projects and programmes shall be implemented according to the rules and procedures of the 10th EDF until the entry into force of the 11th EDF implementing rules and financial regulation.

(6 ) The European Investment Bank may contribute to the implementation of the present National Indicative Programme by operations financed from the Investment Facility and/or from its own resources, in accordance with Articles 2c and 3 of the 11th EDF multi-annual financial framework for the period 2014-2020.
(7) In accordance with Article 5 of Annex IV to the ACP-EC Partnership Agreement, the National Indicative Programme as well ąs the А-and B-allocations can be revised following the mid-term review and the end-of-term review or ad hoc reviews.
Done in Nairobi on 19 June 2014 in two originals in English language.

Table of Contents Abbreviations Τ^Τ^ΤΤΤ^Τ^ΤΤΓΤ^^ν^τττττ^τττττΒ-
1 The overall lines for the EU response 6
1.1 Strategic obj ectives of the EU's relationship with Kenya 6
1.2 Choice of sectors 8
Focal Sector 1 : Food security and resilience to climatic shocks with focus on ASAL (MTP Π Sectors ) • Agriculture, Livestock and Fisheries, Environment, Water and Sanitation and ASAL) 8
Focal Sector 2: Sustainable Infrastructure (MTP IISector - Infrastructure) 10
Focal Sector 3: Accountability of Public Institutions (MTP II Sector - Governance and the Rule of Lawj 12
2 Financial overview 14
3 EU support per sector 15
3.1 Food Security and Resilience to climate shocks (EUR 190 million ) 15
3.1.1 The overall and specific objectives : 15
3.1.2 The main expected results: 15
3.1.3 The main indicators : 16
3.1.4 Donor coordination and policy dialogue 16
3.1.5 The Government's financial and policy commitments 16
3.1.6 Environmental Assessment 17
3.1.7 The overall risk assessment of the sector intervention: 17
3.2 Sustainable Infrastructure (EUR 175 million) 18
3.2.1 The overall and specific obj ectives : 18
... 3.2.2 The main expected results: 18
3.2.3 The main indicators: 19
3.2.4 Donor coordination and policy dialogue 19
3.2.5 The Government's financial and policy oommitments 20
3.2.6 Environmental assessment 21
3.2.7 The overall risk assessment of the sector intervention: 21
3.3 Accountability of public institutions (EUR 60 million) 22
3.3.1 The overall and specific objectives: 22
3.3.2 The main expected results: 22
1

3.3.3 The main indicators: 22
3.3.4 Donor coordination and policy dialogue 23
3.3. J The Government's financial and policy commitments 23
3.3.6 Environmental assessment: 24
3.3.7 The overall risk assessment of the sector intervention: 24
4 Measures in favour of civil society 25
5 Support measures 25
2

-LISX-X)F_ABB.RE¥ÏATÏONS
Abbreviations
AEG Aid Effectiveness Group AfDB African Development Bank AMISOM African Union Mission in Somalia ASALs Arid and Semi-Arid Lands ASDS Agriculture Sector Development Strategy DANIDA Danish International Development Agency DGDG Democratic Governance Donor Group DoL Division of Labour DRR Disaster Risk Reduction EAC East African Community EACC Ethics and Anti-Corruption Commission EA-SA-IO East Africa-South Africa-Indian Ocean EC European Community EDF European Development Fund EPA Economic Partnership Agreement EU • European Union EUCAP NESTOR Regional Maritime Capacity Building Mission in the Horn of Africa
and the Western Indian Ocean FY Financial Year GDP Gross Domestic Product GoK Government of Kenya GIZ Deutsche Gesellschaft für Internationale Zusammenarbeit GHG Green House Gas emissions IEBC Independent Electoral and Boundaries Commission ЛСА Japan International Cooperation Agency KES Kenya Shilling KFSSG Kenya Food Security Steering Group MDG Millennium Development Goal . MT Metric Ton MTEF Medium Term Expenditure Framework MTP Medium Term Plan NAO National Authorising Officer NCCAP National Climate Change Action Plan NIP National Indicative Programme NS As Non State Actors NTBs Non-Tariff Barriers ODA Official Development Assistance PFM Public Financial Management RIP Regional Indicative Programme SoV Source of Verification TJRC Truth Justice and Reconciliation Commission TSP Technical Support Programme
з

11—EĐF-NIP-for-Кепуa- Summary
After the peaceful elections in 2013 the current government faces as one of its main challenges the continuation of the reform process, and the further implementation of the 2010 Constitution. Strengthening government institutions, enhancing their accountability as well as the fight against impunity are important agenda items. The devolution process is a key element in this process as it aims to bring the government closer to the people. Police and land reform as well as continued reform of the judiciary are other main areas to be addressed.
Kenya is the leading economy in the region and has the potential to become a middle income country. Economic performance is on the rise, and macroeconomic stabilisation is showing good results. However, poverty levels remain high, progress towards the Millennium Development Goals sketchy. Recurrent severe droughts illustrate the fragility of the socioeconomic development. Boosting competitiveness, targeted investments for more jobs, and addressing vulnerabilities and continue the reform process are key economic priorities.
The main long term policy document guiding the development of Kenya is Vision 2030 a national development blue-print to create a globally competitive and prosperous nation transforming Kenya into a middle-income country providing a high quality of life to all its citizens by 2030 in a clean and secure environment. This vision is anchored on three key pillars; economic, social and political governance.
Based on Vision 2030, the Agenda for Change and the Division of Labour among Donors, the NIP proposes to focus on the following three sectors: Food security and resilience to climate shocks, sustainable infrastructure, and accountability of public institutions.
Sector Indicative Amount (in M€)
Indicative % of total
Sector 1 - Food Security and Resilience to climate shocks 190 44
Sector 2 - Sustainable Infrastructure 175 40
Sector 3 - Accountability of public institutions 60 14
Support measures (incl. NAO support) 10 2
Total 435 100
The Food Security and Resilience to climate shocks sector will improve food security of the rural population and their resilience to future climatic shocks. In particular, EU support will enable institutions and stakeholders in the agriculture sector to develop, adjust and to implement disaster risk reduction strategies. To this end, the NIP foresees a multifaceted approach covering nutrition, agriculture productivity integrating market linkages,
4

diversification of livelihood sources as well as climate proof investments at community and at county levels.
In the Sustainable"Infrastructure sector the focus will be on poverty reduction and accelerated and inclusive economic growth through more sustainable and efficient energy and transport infrastructure. The two main objectives are to develop 1) more efficient and environmentally friendly energy services that are accessible to all and 2) a more efficient and safe transport system for increased productivity and reduced negative environmental impact. The preferred mode of financing the projects shall be blending of EU grants with loans from European financial institutions including the European Investment Bank (EIB). The identification of other potential financial partners and the negotiation with them will start during the project identification stage.
With the support to enhance the Accountability of Public Institutions three specific objectives are pursued, all of which are closely linked to the further implementation of the 2010 Constitution:
- The justice system is made available to a greater diversity of Kenyans. - Public funds are better monitored and accounted for at all levels of governance. - The 2017 elections are credible and centered around issues of public interest.
There will be no specific allocation for civil society support. However, civil society organisations will be among the potential implementing partners and beneficiaries of the activities of the sectors on "Food Security and Resilience" and "Accountability of Public Institutions".
5

NATIONAL INDICATIVE PROGRAMME
The overall lines for the EU response
Strategic objectives of the EU's relationship with Kenya
Links between the European Community (EC) and Kenya were forged as early as 1968 when the then East African Community signed the Arusha Convention establishing trade relations between three partner States (Kenya, Tanzania, Uganda) and the EC. Economic, trade and political relations continued to be established between the European Union (EU) and Kenya under the framework of the successive Lomé Conventions, to which Kenya became a signatory in 1975, and the Cotonou Partnership Agreement. Today relations have advanced and are very much driven by mutual interests in the economic and social development of the country as well as the will to promote a common political agenda of human rights, democracy and peace in the country and the region.
The current government faces as one of its main challenges the continuation of the reform process, and the further implementation of the 2010 Constitution. Strengthening government institutions, enhancing their accountability as well as the fight against impunity - notably in relation to corruption - are important agenda items. The devolution process is a key element in this process as it aims to bring the government closer to the people. Police and land reform as well as continued reform of the judiciary are other main areas to be addressed.
Kenya is also facing periodic refugee crisis situations fuelled by conflict in neighbouring countries some of them leading to semi-permanent large refugee camps such as Dadaab on the Somalia border.
The main long term policy document guiding the development of Kenya is Vision 2030, a national development blue-print to create a globally competitive and prosperous nation transforming Kenya into a middle-income country providing a high quality of life to all its citizens by 2030 in a clean and secure environment. This vision is anchored on three key pillars: economic, social and political governance.
The Second Medium Term Plan 2013-20171 (MTP II) for the implementation of Vision 2030 contains concrete objectives to be achieved over this period in the various sectors.
Kenya is the leading economy in the region and has the potential to become a middle income country. Dependency on aid is limited in part due to a taxation rate of above 20% of GDP which is one of the highest rates in Sub-Saharan Africa. However progress towards the Millennium Development Goals remains a challenge. High youth unemployment and socioeconomic and regional inequalities are also important challenges. In addition, the country
1 Pathway to Devolution, Socio-Economic Development, Equity and National Unity
6

faces growing environmental problems such as soil erosion, deforestation, water pollution, and desertification. Global environmental concerns such as climate change and loss of
-biodi-Yersity.aggraYatethe situation.
Kenya is a key regional partner for the EU. The EU works with Kenya to secure peace in Somalia, and to enhance maritime security. The Regional Maritime Capacity Building Mission in the Horn of Africa and the Western Indian Ocean EUCAP Nestor as well the EU support to African Union Mission in Somalia (AMISOM) and its comprehensive strategy towards the Horn of Africa provide the framework for this cooperation.
The EU is a very important trade partner for Kenya (31% of imports, 26% of exports). The conclusion of the Economic Partnership Agreement (EPA) is regarded as important by Kenya notably in view of the importance of its exports to the EU for its economy.
EU development partners have embarked on Joint Programming in Kenya. In 2013, the EU Delegation together with 8 Member States (Germany, France, the Netherlands, the UK, Denmark, Sweden, Italy and Finland) carried out a mapping of the development sectors it intends to cover over the next implementation cycle (MTP 2). All EU Member States represented in Kenya endorsed at HoMs level in December 2013 guiding principles on joint programming related in particular to the division of labour, the use of country systems, joint monitoring and joint evaluation. This Joint Programming initiative aims to lead as a final output to a Joint EU assistance response to the second Medium Term Plan 2013-2017. In the meantime, the EU Member States and the EU Delegation will jointly explore the potential for joint analysis, joint programming and joint implementation modalities in the form of Task Teams designed to cover the following sectors: i. Agriculture and Resilience, ii. Energy, Infrastructure (incl. Transport), iii. Election, Justice and Democratic Governance joined with Devolution, iv. Environment and Climate change, v. Water & Sanitation, vi. Health and vii. Gender.
The EU response and National Indicative Programme may be complemented by operations financed by the EIB from the Cotonou Investment Facility and/or its own resources. Synergies and complementarities will be sought both in the focal sectors of the EU and in other sectors.
7

Choice of sectors
The focal sectors addressed by the NIP have been identified in consistency and complementarity with the support that the country will be able to receive under the Regional Indicative Programme (RIP) for Eastern Africa, Southern Africa and the Indian Ocean (EA-SA-IO). The main objective of which is to support peace and stability, trade and regional economic integration, including infrastructures, and natural resources management, as to address the needs arising from future EPA implementation in a holistic way. Individual Member States of Regional Organisations may receive direct financing from the RIP for projects with a regional dimension based on the regional policies and strategies of their reference Regional Organisation. The National Indicative Programme of Kenya will contribute to promote regional cooperation and integration in the EA-SA-IO region; moreover it will complement support to the EPA process at regional level by addressing the challenges the country is facing in Food Security, Energy and Transport and Governance sectors at national level.
The choice of sectors is based on the Government of Kenya priorities as elaborated in the Vision 2030's MTP II, the EU Agenda for Change and the Division of Labour (DoL) among donors as proposed by the Aid Effectiveness Group (AEG). It was also endorsed by the Civil Society Organisations (CSOs) gathered (80 in total, including Local Authorities networks) at a consultation meeting held by the EU Delegation in September 2013.
The selected sectors correspond to the MTP II sectors and cover the Enablers/Foundations for National Transformation of Vision 2030 and its three pillars (a) The Economic Pillar, (b) The Political Pillar (c) Social Pillar. Cross cutting issues including Gender, Environment & Climate Change, and Resilience, will be taken into account in individual programmes at the identification and formulation stages. The potential of Information and Communication Technologies (ICT) in providing or facilitating viable solutions will also be exploited.
The Evaluation of the European Union's Co-operation with Kenya for the period 2006 - 2012 highlights the importance to improve the availability of quality data and the quality of Monitoring and Evaluation systems. These issues will receive particular attention and will be improved by the individual programmes. The evaluation also stresses that the EU in the Kenya country context of fragmented project aid and relatively week donor coordination adopted a pragmatic approach. It recommends that future focus of EU assistance should be in areas where it has built up comparative advantage and should be in line with government's priorities. The evaluation recommendations explicitly support the choice of focal sectors as indicated below.
Focal Sector 1: Food security and resilience to climatic shocks with focus on ASAL (MTP II Sectors Agriculture, Livestock and Fisheries, Environment, Water and Sanitation and ASAL)
Food security and resilience are key priorities in MTP IL The EU has substantial experience in the sector and is one of the major donors. It fits within Agenda for Change priorities, and the sector is relatively well organised lending itself to the implementation of large efficient programmes in collaboration with other players in the sector including donors and the private sector.
8

Country Strategy and policies: Kenya Vision 2030 identifies agriculture as one of the key economic sectors expected to drive the economy. Major challenges to this include: A •predominantly ra i n-fed agriculture, climate change affecting more severely the Arid and Semi-Arid lands (ASAL) which also have some of the highest levels of poverty incidence and, population pressure leading to spontaneous settlements in ASALs and further land degradation. High on the agenda for expanded production and increased productivity is access to agricultural inputs and irrigation. Priorities of Agricultural Sector Development Strategy (ASDS) 2010-2020 are in line with Vision 2030. Assuming a conducive environment, the agricultural sector has set the following targets by 2015: (i) reduced number of people living below absolute poverty lines to less than 25%, to achieve the first MDG; (ii) reduced food insecurity by 30% to surpass the MDGs; (iii) increased contribution of agriculture to GDP by more than KES 80 billion per year as set out in Vision 2030; (iv) divest from all state corporations handling production, processing and marketing that can be better done by the private sector; and (v) reformed and streamlined agricultural services such as in research, extension, training and regulatory institutions to make them effective and efficient. Given the holistic approach envisaged in addressing resilience also issues of water and ecosystems will need to be factored in. In addition, as Kenya's economy is natural resource based, these objectives can only be achieved with rehabilitation of watersheds that provide the economy with critical ecosystem services. With fast diminishing high and medium potential areas the ASALs are the last frontier of agricultural development in Kenya. The ASAL policy "Releasing our full potential" aims at integrating ASAL in the national economy, building the resilience of its population to future climatic shocks including climate proof infrastructure, developing alternative approaches to service delivery, governance and public administration that will accommodate the specific realities of the ASAL and finally mobilising the resources necessary to reduce inequality. Measures to improve agricultural output should emphasise sustainable land management techniques, including agro-forestry and other measures for the sustainable management of natural resources. The policy is people-centred by recognising the need to develop a community approach and the need to cater for the pastoral way of life in providing adapted solutions in terms of governance, growth and access to social services. The policy was developed from the finding of the post crisis need assessment that was made by the World Bank in 2010. Rural Poverty: Nearly half (47%) of Kenya's rural population is living below the poverty line and unable to meet its nutritional requirements. High levels of rural poverty persist because of the high population growth rate, small landholdings, frequent droughts, large rural income disparities, and strong linkages between poverty and environmental degradation particularly poor water management, soil erosion and declining fertility. The majority of the poor are living in the medium-high potential areas that cover about 16% of the country. Food security continues to be a major concern with an estimated 3.8 million or 47% people in rural areas either highly or extremely food insecure. On nutrition, official data indicate that 33% of children under five years of age are stunted, and that 20% of all children are underweight. Very little progress has been made in combating chronic malnutrition. The agriculture sector remains the backbone of the economy, although its share in the GDP has declined from nearly 40% in the 1970s, to about 28% in 2011. About 80% of people working in agriculture are smallholders, who use low quantities of modern inputs, employ inappropriate practices that lead to soil degradation, have limited access to technical and financial services, have significant post-harvest losses, selling mostly at farm gate at low prices. Women contribute 80% of all labour in food production and 50% in cash crop production, it is estimated that over 40% of smallholder farms are managed by women as men increasingly migrate for non-agricultural labour. Female-headed households have lower income and higher poverty
9

incidences and to a less extent land owners. Youth form 30% of the population and 60% of the total labour force. The majority is unemployed and resource poor to start their own businessT^Fhe-ASÄbs-have-the-lowest-development-indieators-and-the-highest-inGidence-of-poverty with an increasing larger percentage of the population falling out of the agro-pastoralist system becoming reliant on social transfer and remittance from urban population in the absence of alternative source of livelihood. Devolution: The new 2010 Constitution brings about fundamental changes to the way Kenya is governed notably through devolution of responsibility from central government to the new counties government. This is particularly relevant for the implementation of the health care primary services including nutrition and for the implementation of the agriculture and ASAL policies whereby the County Governments have now the responsibility (Kenya Gazette Supplement № 116 - 9 August 2013) to regulate, implement and deliver services encompassing crop, livestock and fisheries as well as disaster risk reduction investments and land conflict resolution. The Ministry's functions, as per Executive Order №2 of 20 May 2013, are now focused on broad ranging policy formulation, standards setting and oversight to evaluate conformity of counties' implementation with national policies and strategies.
Responding to continental strategies: Sector interventions in Kenya will also have to be coherent with the continental strategies, particularly: the ending drought emergencies strategies developed by IGAD and the food security strategies developed by the African Union under the NEP AD.
Lessons learnt from past interventions show there is a strong relationship between resilience building and other aspect of development. Past failure to manage risks had consequences in various areas, including livelihood and environmental sustainability, health and nutritional status, educational opportunity, social development, political stability, inequality, and economic growth. Effective actions in all these sectors are essential to bring sound resilience together with a paradigm shift in the way governments, development partners and NGOs do business.
A common programme framework needs to be developed to operationalise the policies dealing with food security and disaster mitigation measures and for a more effective implementation and to avoid duplication and overlaps. Environment conservation and an effective natural resource management is crucial in this regard.
Focal Sector 2: Sustainable Infrastructure βΙΤΡ II Sector - Infrastructure) Infrastructure is one of the foundations of Kenya's Vision 2030 and energy and transport are key drivers for the realisation of the Vision's three pillars: economic, social, and political. This is in line with the EU Agenda for Change to support an inclusive and sustainable growth for human development necessary to achieve the primary objective of eradicating poverty. Modern and efficient infrastructure facilities are required to support the expansion of Kenya's productive sectors and to alleviate poverty. The inadequate investment in infrastructure development and maintenance is recognised as one of the main contributors to the high cost of doing business, undermining competitiveness and adversely affecting trade and regional integration. It also increases the cost of providing social services and curtails access to markets, in particular to the remote parts of the country. Kenya has a multi-modal transport infrastructure system comprising roads, railways, maritime, oil pipeline and air transport networks. At present, roads remain the dominant transport mode in Kenya, accounting for 93% in terms of volume for both domestic freight
10

and passenger traffic, the former of particular importance given the country's role as East Africa's main logistics hub. Despite a significant increase in development and maintenance financing in recent ,years as well as a number of improvements to the institutional framework, a number of challenges remain to be addressed. These include: inadequate funding for development and maintenance of key infrastructure, poor quality of transport services, inappropriate modal split, weak adherence to environment requirements, lack of urban transport policy, and institutional deficiencies. Furthermore, the transport sector is a major contributor to greenhouse gas emissions, it generates air and noise pollution and is a key consumer of energy. According to Kenya's National Climate Change Action Plan, if nothing is done, greenhouse gases emissions from the transport sector are projected to grow significantly from 6MtC02 in 2010 to almost 18MtC02 in 2030. Finally, the road sector has a poor safety record with 10 deaths recorded per 100,000 persons each year. Kenya's power system consists of the national grid and several mini-grids serving areas located far from the national grid. Yet, only about 29% of households in Kenya have access to grid electricity and over 68% of people in Kenya still rely on traditional biomass for cooking and heating. The connection rate is around 15% in the rural areas. Kenya lags behind its economic peers in household electrification and per capita energy leading to unequal accessibility of energy services. Vulnerability of energy supplies and dependence on imported fuels, traditional biomass and hydro power leaves Kenya prone to price volatility, supply instability and interruptions in dry periods which cause physical hardship and economic burden. Inadequate, low quality and highly priced energy supply contribute significantly to the prevailing high cost of doing business in the country. As such the two main challenges concern inadequate electricity generation that in turn is too expensive. A number of strategies have been put in place in the country as part of ongoing efforts to improve access to modem energy services, increase generation capacity, strengthen transmission and distribution systems, as well as improve energy security. The sustainable growth will require the promotion of renewable energy, energy conservation, energy efficiency and energy substitution programmes for households, industry and the transport sectors. Given the significant proportion of rural populations for whom biomass (predominantly fuel wood) still represents the main energy source, the promotion of sustainable use of fuel wood and improving the energy-efficiency of wood-burning stoves is critical. The sustainable management of forest resources also complements objectives under sector 1) Food security, as well as mitigates against climate change and reduces land degradation. In order to address the infrastructure challenges, MTP II focuses on sustaining and expanding Kenya's physical infrastructure to ensure that it can support a rapidly-growing economy. This includes upgrading the national transport framework at both national and regional level, expanding the capacity of the road network and improving its condition, increasing the capacity of ports and improving their efficiency, reducing congestion in the main urban areas. MTP II also focuses on modernising· the energy infrastructure network, increasing installed capacity for electricity generation, increasing the share of energy generated from renewable energy sources, and providing access to energy that is affordable and reliable to businesses and homes. The major investments in energy and transport will only lead to sustainable social and economic development if the negative impacts on the environment are mitigated and green growth policies are mainstreamed. Furthermore, the investments in infrastructure are only sustainable if an adequate maintenance and effective axle load control regime are institutionalised. The evaluation of the EU Kenya Cooperation further recommends that the future support strategy should continue to address the challenges regarding sustainable improvements in road maintenance as well as support to key institutional reforms through a
good policy dialogue. At county level, support to rural roads would provide good opportunities to enhance internal coherence and to create synergies between various sector leveLactivities-Supported-by-theJEU
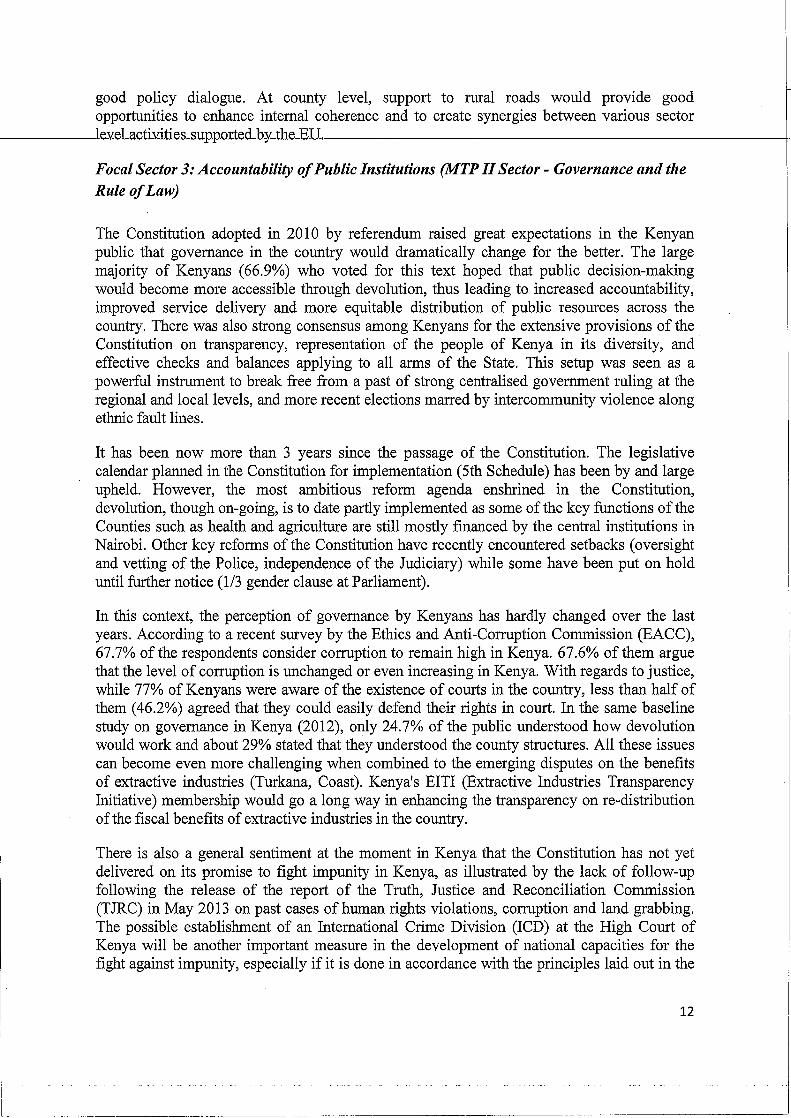
Focal Sector 3: Accountability of Public Institutions (MTP Π Sector - Governance and the Rule of Law)
The Constitution adopted in 2010 by referendum raised great expectations in the Kenyan public that governance in the country would dramatically change for the better. The large majority of Kenyans (66.9%) who voted for this text hoped that public decision-making would become more accessible through devolution, thus leading to increased accountability, improved service delivery and more equitable distribution of public resources across the country. There was also strong consensus among Kenyans for the extensive provisions of the Constitution on transparency, representation of the people of Kenya in its diversity, and effective checks and balances applying to all arms of the State. This setup was seen as a powerful instrument to break free from a past of strong centralised government ruling at the regional and local levels, and more recent elections marred by intercommunity violence along ethnic fault lines.
It has been now more than 3 years since the passage of the Constitution. The legislative calendar planned in the Constitution for implementation (5th Schedule) has been by and large upheld. However, the most ambitious reform agenda enshrined in the Constitution, devolution, though on-going, is to date partly implemented as some of the key functions of the Counties such as health and agriculture are still mostly financed by the central institutions in Nairobi. Other key reforms of the Constitution have recently encountered setbacks (oversight and vetting of the Police, independence of the Judiciary) while some have been put on hold until further notice (1/3 gender clause at Parliament).
In this context, the perception of governance by Kenyans has hardly changed over the last years. According to a recent survey by the Ethics and Anti-Corruption Commission (EACC), 67.7% of the respondents consider corruption to remain high in Kenya. 67.6% of them argue that the level of corruption is unchanged or even increasing in Kenya. With regards to justice, while 77% of Kenyans were aware of the existence of courts in the country, less than half of them (46.2%) agreed that they could easily defend their rights in court. In the same baseline study on governance in Kenya (2012), only 24.7% of the public understood how devolution would work and about 29% stated that they understood the county structures. All these issues can become even more challenging when combined to the emerging disputes on the benefits of extractive industries (Turkana, Coast). Kenya's EITI (Extractive Industries Transparency Initiative) membership would go a long way in enhancing the transparency on re-distribution of the fiscal benefits of extractive industries in the country.
There is also a general sentiment at the moment in Kenya that the Constitution has not yet delivered on its promise to fight impunity in Kenya, as illustrated by the lack of follow-up following the release of the report of the Truth, Justice and Reconciliation Commission (TJRC) in May 2013 on past cases of human rights violations, corruption and land grabbing. The possible establishment of an International Crime Division (ICD) at the High Court of Kenya will be another important measure in the development of national capacities for the fight against impunity, especially if it is done in accordance with the principles laid out in the
12

EU Joint Staff Working Document on Advancing the Principle of .Complementarity -Bridging the gap between international & national justice!.
Governance finds itsefflîôw^f a cr^sro^lsnn-Kenyar-The-ŽO-l-O-QonstitutionJiasjcaised. expectations on the concrete benefits of democracy for all citizens of Kenya. The government at central and decentralised level will need to demonstrate that these benefits are realised. Continued reforms are needed so that public institutions operate efficiently and transparently and effectively implement public policies in Kenya.
Further strengthening accountability mechanisms in line with the new Constitution will assist the government realising its objectives in this regard. The Constitution provides indeed for accountability mechanisms:
In intergovernmental relations between central and county level, but also between county authorities and the local communities; In the form of a more effective justice sector, ensuring that all rights recognised by the Bill of Rights can be equally upheld for all Kenyan citizens, irrespective of their social, religious or ethnic background; Every 5 years during general elections, as managed by the Independent Electoral and Boundaries Commission.
The European Union will support all three conduits for the increased accountability of public institutions in Kenya, relying also on civil society organisations to strengthen the demand side of governance, especially with regards to legal aid services. This support will be consistent with the Constitution of Kenya but also with the second national Medium Term Plan (MTP II). Election assistance and devolution reforms feature in the Foundations for National Transformation (Chapter 2) but also in the Political Pillar of MTP II (Chapter 6). In that respect, the recommendations of the EU Election Observation Mission of 2014 provide a valuable basis for the improvement of the electoral process. Progress in their implementation should be closely monitored and supported through political dialogue and/or technical assistance. Finally, strengthening of the justice sector pertains to several flagship programmes of the Political Pillar of MTP 11.
On specific areas, the following lessons were learnt from past interventions:
Governance: past support in this area lacked a comprehensive strategy and was too scattered and limited in scope. It was also hampered by the limited institutionalized dialogue and information exchange between NSAs (which·, mostly benefitted from the EU governance programmes) and the national government, i'įiis is said, through the 09th and 10th EDF Governance interventions there has been a consistent involvement in 'Access to Justice' that needs further consolidation under the 11th EDF with an expansion of scope and resources to allow some tangible impact in this area.
The radical Electoral reforms that took place with the adoption of the Constitution and the experience of the 2013 Elections call for a consolidation of the gains obtained in this democratic exercise, with a specific need to further build the capacity of the Electoral
2 http://eeas.europa.eu/human_rights/icc/docs/joint_staff_en.pdf
13

Commissi nn to ensure it delivers its mandate with the confidence of the public, critical safeguards for future credible and peaceful Elections.
PFM reforms can only be effective if led by the GoK and if they get high level political support. Past support was not as successful as expected because there was lack of drive from GoK.
Financial overview Seco, Indicative Amount (in
Mfc) Indicative % of total
Sector 1 - Food Security and Resilience to climate shocks 190 44
Sector 2 - Sustainable Infrastructure 175 40
Sector 3 - Accountability of public institutions 60 14
Support measures (incl.NAO support) 10 2
Total 435 100
14

EU support per sector
FooclSecurityanclResilience^to-climate^shocksĽ(EUR 190 million )
The overall and specific objectives:
Overall objective: Food security of the rural population and their resilience to future climatic shocks is sustainably improved.
Specific obiective: Institutions and stakeholders in the agriculture sector are able to develop, adjust and implement Disaster Risk Reduction strategies involving a multisectoral approach to nutrition, agriculture productivity integrating market linkages, diversification of livelihood sources as well as supporting climate proof investments at community and at county levels.
In order to achieve substantial impact by 2020, the interventions under the three results below will have to address Government priorities and key issues underlined in recent evaluations. Identification of the interventions will also take into consideration the continental strategies such as the Continental Programme for a Sustainable Development of Livestock for Livelihoods in Africa, the Africa Fishery Governance programme and others.
The main expected results:
Result 1: Food security and nutrition of the most vulnerable part of the population and their resilience to climatic shocks are improved.
Food security interventions need to address with an integrated approach nutritional challenges affecting the most vulnerable. This includes promoting production and access to high nutritional value food and fortification and strengthening of systems to effectively deliver nutrition interventions in line with the Scaling Up Nutrition principles. The nutrition activities would encompass high impact nutrition interventions as defined in the National Nutrition Action Plan and nutrition-sensitive activities in agriculture and education. It is also necessary to invest in climate proof community infrastructure in view of future periods of drought as well as in early emergency response mechanisms in order to mobilise humanitarian aid only when peak crisis occur
Result 2: Productive climate resilient agriculture and community investments to safeguard productivity against climatic shocks supported. '
In order to increase agricultural output at national level it will be necessary to transform the agricultural model of a significant number of small holder farmers from subsistence farming to farming as a business. Support could build upon the EU's current experience in the promotion of strategic value chains (including those for sorghum, maize, pulses, cassava, livestock, poultry, and fisheries) which have had proven impact on the food security situation at national level. Interventions should adopt a comprehensive approach; this includes improved agricultural practices, notably those that are climate resilient, a complete range of financial services as well as Е-services to farmers. Integrating the youth and women farmers
15

will also be a priority in order to respond to the aging famers/pastoralist population, unemployment and above all the need to empower women. Supporting research for promising -yielding/elimate-resilient-agro-teehnologies-is-also-er-itiGal-as-demonstrated-by-the-sucGess-of-EU investment in past in research on climate proof insurance, drought adapted plants and farming practices.
Result 3: A conducive environment for long-term food security, rural growth economy and resilience building supported.
It will be important to address the needs of counties for climate proof infrastructure which will bridge the climate proof infrastructure developed by communities and those developed by the national government. It is also important to conserve critical watersheds to maintain continued provision of critical ecosystem services benefiting communities adjacent to the watersheds and beneficiaries further afield. In addition, counties are indicating the lack of peace and security as a limiting factor for their inclusive development and therefore interventions on land governance would need to be expanded. Finally, in view of increased division of labour and synergy with government programmes, coordination at all levels will have to be strengthened.
The 11th EDF should also be an opportunity for leveraging investments from Government, other development partners and private sector in an effective Community Public Private Partnership approach. The identification of new programmes will identify the responsibility of each of these actors and will ensure that implementation mechanisms strengthen their respective capacities.
The main indicators: The main indicators for measuring the aforementioned results are contained in the sector intervention framework attached in Annex.
Donor coordination and policy dialogue Donor coordination and policy dialogue are in place and active at the level of agriculture sector, environment, ASAL and food security and nutrition. Government and donors are now jointly engaging into the formulation of common programmatic frameworks in order to first align programmes along the MTPII pillars and at term to develop joint programme for donors procedures permitting. The completion of those common programmatic frameworks will represent a pragmatic way forward in increasing donor coordination.
The EU is currently the chair of the ASAL coordination donors' group and the co-chair of the agriculture sector coordination. The EU is also chairing the Forest Sector Group and in addition is the Scaling Up Nutrition (SUN) donor convenor.
The Government's financial and policy commitments The Government of Kenya is committed to its policy and financial commitments, including not losing effectiveness in achieving sectors' objectives in implementing devolution. The need to develop operation policies at county level and to re-enforce a coherent monitoring and evaluation system will be high on the agenda during the years to come including addressing cross cutting issues. Kenya aims at being a medium income country with substantial budgets
16

are allocated to recurrent expenditures (year 2013/2014 about EUR 100 million for agriculture, EUR 5 million for the National Drought Management Authority). Hence the 11th BD-EUvmldJGacus on investment cost and targeted capacity building measures.
Environmental Assessment Any programme or project identified under this focal sector will be subject to the environmental screening according to the procedure indicated in the Guidelines for Integration of Environment and Climate Change in EU Development Cooperation in coordination with the Government and other donors active in the sector.
The overall risk assessment of the sector intervention: i. Occurrence of a major drought disaster and/or other climate-related events such as
extreme flooding prior to a common programmatic framework being in place. ii. Disparity in budgets and allocations compromising the funding of public service.
iii. The politicisation of the devolution process and the risk on targeting non disaster risk reduction investments.
iv. Dynamic of high population growth.
These risks will be mitigated by increased sector dialogue with line ministries at the political level.
17

SustttinttbleInfrastructure(EUR175million)
The overall and specific objectives: Overall Objective: Contribute to poverty reduction and accelerated and inclusive economic growth through more sustainable and efficient energy and transport sectors
Specific Objective 1: Develop more efficient and environmentally friendly energy services that are accessible to all
Specific Objective 2: Develop a more efficient and safe transport system for increased productivity and reduced negative environmental impact
These objectives shall be pursued through the development of a green investment policy framework with a view to improve coherence between climate and investment policies. Integrating climate and investment policies in a unique framework can help these different policy communities work together to achieve the common goal of low-carbon, climate-resilient development and greener growth.
The main expected results:
Specific Objective 1
Result 1 : Increased access to modern and sustainable energy services
Increased access includes increasing the capacity of the electricity sector through development of the country's generation, transmission and distribution capacity as well as decentralised off-grid systems. It also includes developing solutions for clean lighting and cooking at household level.
Result 2: Increased production of renewable energy in the country
Increased production of renewable energy entails primarily developing new solar and wind sources in the country and may entail limited support to the development of geothermal and small hydro sources as well as the promotion of a more sustainable use of biomass through sustainable natural resource management. This will also include the design and implementation of incentives to promote private sector investments in renewable energy generation.
Result 3: Improved energy efficiency
Increased energy efficiency entails developing and promoting energy conservation and efficiency programmes for households (cooking and lighting), industry (food processing, textile, paper, tea) and the transport sector. Initiatives to be preceded by energy audits may include credit facilities for energy efficiency improvement, training, information exchange, technology transfer and support to development of policies and regulations.
18

Specific Objective 2
Result 4: Increased access to anďěffičiency ofiransporrservíce's~an'd"reduced-transport-cost-for passengers and goods
Improvements to the quality and cost of transport services requires investments in infrastructure to develop and maintain the transport network (e.g. roads, ports, facilities for public transport and non-motorised traffic, intermodality), strengthening of the institutional and regulatory framework to promote most efficient modes in terms of cost and time as well as reduction of non-tariff barriers.
Result 5: Reduced environmental impact of the transport sector A reduction of the environmental impact requires interventions that reduce unnecessary travel, shift travel to more efficient transport modes and promote technological improvements to reduce the negative environmental impact of motorised modes.
Result 6: Increased road safety •
Increased road safety will require investments to increase the safety of the road network (segregation of motorised and non-motorised traffic, redesign of unsafe locations) complemented with activities targeting an improvement of knowledge and enforcement of traffic regulations.
The preferred mode of financing the projects shall be blending of EU grants with loans from European financial institutions including the European Investment Bank (EIB). The identification of other potential financial partners and the negotiation with them will start during the project identification stage. Furthermore, given the large demand for investments in the energy and transport sectors, opportunities for the involvement of the private sector through public-private-partnerships (PPP)will be pursued.
In particular for the transport sector, a key objective will be to ensure full complementarity between the initiatives foreseen under the national programme with those foreseen under the regional programme.
The main indicators: The main indicators for measuring the aforementioned results are contained in the sector intervention framework attached in Annex.
Donor coordination and policy dialogue In energy sector, donor coordination is led by the Ministry of Energy and Petroleum. Co-chairs of the Donor coordination group are currently World Bank and Japan International Cooperation Agency (JICA). Further, 14 donors are active in the sector which demonstrates the high level of support. Out of these, 51% are active in generation, 27% in transmission and 10% in distribution. The project financing comprises of 86% loans and 14% loans/grants. Policy dialogue and priority areas have mainly focused on the need for capacity development
19

in the sector, creation of an enabling environment for private sector involvement as well as increasing access to energy.
The Roads and Transport Sector Donor Group is currently chaired by ЛСА on a 2 year rotational basis. The EU is scheduled to take the chair from the middle of 2014. The Group actively participated in the Government's 2008 road sector reform by supporting the development of sector specific policies, strategies, institutional frameworks, as well as the road sector investment plans.
More recently, the group's contacts with the Government have been less frequent. Moving forward the Group needs to identify how to reinvigorate its working relationship with the Ministry of Transport and Infrastructure as well as possibly with other Ministries and institutions directly concerned by the envisaged programmes (Nairobi City County, Ministry of Land, Housing and Urban Development etc.).
The Government's financial and policy commitments The Government's financial and policy commitments are elaborated in the second Medium Term Plan (MTP II). Specifically, and relevant to the possible interventions under the 11th
EDF:
In the energy sector, the Government is committed to improve the infrastructure network and promote the development and use of renewable energy sources to create a reliable, adequate and cost effective energy supply regime. The financial commitments include the construction of 24 MW Hydropower, 1,646 MW Geothermal Resources, 630 MW Windpower as well as 18 MW co-generation.
• The Government will increase access to electricity through upgrading and expansion of the national power transmission and distribution network to improve supply and reliability, reduce losses and connect two million new customers by 2017. The Rural Electrification Authority (REA) will continue implementing the Rural Electrification Programme countrywide which targets to connect 6,304 public facilities.
• In terms of policy, the Government will continue to regularly review its policy on Feed in Tariffs and amend as necessary the 2nd and latest version of December 2012. It will also provide a regulatory framework to enhance independent system operators; as well as finalise and enact the Energy Bill.
• In the transport sector, the Government will implement a Roads expansion Programme aimed at enhancing domestic and regional trade through upgrading of the national and county roads network. The Government is committed to finance the construction and rehabilitation of approximately 5,500 km of roads and the construction of approximately 1,700 km pedestrian and cycling facilities for Non-Motorized Transport (NMT).
• In terms of climate change actions, the Government's National Climate Change Action Plan (NCCAP) foresees the development of Mass Transport Transit Systems in major cities including an extensive mass transit system for Greater Nairobi. This will be in the form of bus rapid transit corridors complemented by light rail transit and non-motorised transport infrastructure such as bicycle lanes and sidewalks. These measures could abate about 2.8 Mt Co2e in 2030.
20

• In terms of policy, the Government will review and implement the Integrated National Transport policy and develop and implement a 50 Year Transport Master Plan. Government will also finalise and enact the Roads Subsector Policy and Kenya Roads Bill 2013; establish a Ν£ΐίΐΌ&ΓΜ6ΐΓ0^ΪίΐΜ_Τι^ψ0ΐ1^;ΰ&ΌΐΊΐ7ΓΒ3 ^6ΐ1--α8-ά6ν6ΐΌρ-3ΐ^-implement a National Road Safety Programme.
Environmental assessment The Government will conduct environmental assessments as an integral part of all stages of the project development so as to comply with the legal requirements of the National Environmental Management Authority (NEMA). They will also address relevant climate-change adaptation concerns and include preliminary climate risks assessments as and when relevant.
The overall risk assessment of the sector intervention: 1) Lack of political will to implement institutional and policy reforms to strengthen sector
context - This risk will be mitigated through a continued and where possible intensified policy dialogue at the different levels of Government. The dialogue must be coordinated with the key development partners in the sectors and possibly linking the size of investments to the achievement of key milestones by the Government.
2) Limited uptake of funds due to delays in implementation of programmes particularly where co-funding and/or blending are pursued as these increase the complexity of the programmes being implemented. - This risk can be mitigated through provision of adequate funding for project identification and preparation as well as consultation of key partners at an early stage of the project cycle.
3) In the case of blending loans/grants: a limited number of bankable projects ready for financing or a limited number of financial partners interested in the identified projects. -This risk can be mitigated through the provision of dedicated funds to identify and develop bankable projects..
4) Climate change presents risks to infrastructure assets which include damage or destruction from extreme events, which climate change may exacerbate, changes in patterns of water availability, as well as effects of higher temperatures on operating costs. These risks can be mitigated through the update of infrastructure design standards to ensure that future infrastructure capital is resilient to anticipated climate change and extreme events, and strengthening of the maintenance and repair regimes.
21

Accountability of public institutions (EUR 60 million)
The overall and specific objectives:
Overall objective: enhance the accountability of public institutions in the delivery of their constitutional mandate
Specific objectives:
Support increased equity in access to and delivery of justice
Support more transparent management of public funds at central and county level
Support elections that are credible and fully compliant with the Constitution
The main expected results: 1) The justice system is made available to a greater diversity of Kenyans
2) Public funds are better monitored and accounted for at all levels of governance
3) The 2017 elections represent further improvement in terms of preparation of the
elections, polling operations and compliance with the Constitution
Result 1 relates directly to Legal Aid and Awareness, Judicial Transformation and strengthening of the criminal justice system, which are three of the six flagship projects of the Governance and Rule of Law component of the Political Pillar of MTP II for the period 20132017. Moreover, Access to Justice is emphasised as a key legal and policy reform in the same component of MTP IL It is also aligned to the first pillar of the sector strategy, the Judiciary Transformation Framework (2012 - 2016) on a "people-centred delivery of justice".
Result 2 ties in to Public Financial Management Reforms and Devolution, which are identified as priority areas in MTP IL This result addresses five flagship projects of the Devolution component of the political pillar of MTP II. This result also pertains for four themes of the Strategy for Public Finance Management Reforms in Kenya (2013 - 2018) on Budget Execution, Accounting/Reporting, Audit and Oversight and Fiscal decentralisation. In addition to assisting the central government, devolution support will also need to take into account the needs expressed by subnational levels of government represented by the Council of Governors and possibly by associations of local authorities.
Result 3 caters for Electoral and Political Processes, which is one of the programmes of the Governance and Rule of Law component of the Political Pillar of MTP II. In the Implementation Matrix of MTP II, national cohesion is mentioned as one of the Strategic Objectives of the Governance and Rule of Law component of the Political Pillar.
The main indicators: The main indicators for measuring the aforementioned results are contained in the sector intervention framework attached in Annex.
22

Donor coordination and policy dialogue Donor coordination takes place in the framework of the Donor Group on Democracy and Governance (DGDG). The Government and public institutions take part in the DGDG technical groups on elections, devolution and public financial management sector group meetings.
The EU is at present lead donor with DANIDA in public financial management. This position entails the holding and chairing of sector group meetings, consultation with government institutions on current reforms, and preparation of sector contributions to the bi-annual Development Partnership Forum.
The main policy areas in the governance sector to be addressed by development partners in the near future are 1) devolution and 2) support to the judiciary. Public financial management and election support rank lower in terms of ODA commitments. With regards to justice, the largest development partner now is the World Bank, who will finance court infrastructure. GIZ, a major donor in the past, is reducing its interventions, and the continuation of support from Sweden is uncertain. In the PFM area, plans for donor support are still unclear, as GIZ and AfDB are withdrawing, while Sweden and DANIDA are to announce their future governance interventions. Regarding election support, only the UK and Canada have pledged so far support for 2017
The next step for increased donor harmonisation and ownership by the government is the progressive alignment of the DGDG architecture with the relevant MTEF sector working groups. Joint programming for the implementation of the Judiciary Transformation Framework, of the Strategy for Public Finance Management Reforms in Kenya and of the future Capacity Building Strategy of Government on devolution also seems achievable in the near future.
The Government's financial and policy commitments Objective 1 : Support increased equity in access to and delivery of justice
The government under MTP II (Political Pillar - Implementation Matrix) has earmarked KES 155,575 million (EUR 1,349 million) for the Justice Sector until 2018, integrating the World Bank project on support to the Judiciary of almost EUR 89 million. This medium-term forecast seems ambitious, given that the justice sector (Public Prosecutor + Judiciary + Department of Justice) is to receive a total of KES 38,819 million or EUR 336 million until 2016 according to the Programme-Based Budget. Two prerequisites are needed on the government's side for progress on this objective: the enactment of the Legal Aid bill and its implementation through relative regulations, and the institutionalisation of the National Council for the Administration of Justice,
Objective 2: Support more transparent management of public funds at central and county level
According to its 2013-2014 Programme-Based Budget, the government plans for a total of KES 54,021 million (EUR 467 million) for public financial management in the period 2013 -2016. 75% of the amount is to be funded by the government, while the rest (mostly capital expenditure) is expected to be provided by development partners. The budget for the implementation of the Strategy for PFM Reforms in Kenya equals KES 20,295 million (EUR 176 million) in the period 2013 - 2018. According to the
23

Implementation Matrix of MTP II (Political Pillar), capacity building of county governments is expected to cost a total of KES 50,700 million (EUR 439 million) over the same years. Eunding__for_.these._two__items_is_to_he__covered__by__hoth_the_government_and__development partners. The main sector measure pending is the operationalisation of the PFM Reform Strategy through the establishment of an implementation unit within Treasuiy.
Objective 3: Support issue-based and credible elections
Allocations to the Independent Electoral and Boundaries Commission (IEBC) (government and Appropriation-in-Aid combined) amount to an aggregate figure of KES 11,669 million between 2013 and 2016 (EUR 101 million). This needs to be compared to the last allocation to the IEBC during an election year (FY 2012/2013), which was KES 24,900 billion (EUR 216 million). It is therefore expected that government funding of the 2017 elections will significantly increase over FY 2016/2017. A comprehensive review of the legislative framework related to elections is to be carried out by the government (Department of Justice) and the IEBC, not least to guarantee that the 1/3 gender clause be complied with in all elected positions in 2017. Clear decisions by the government and the IEBC on procedures for voter registration and verification, result transmission and tallying will also need to be taken at a very early phase of the electoral cycle to prevent any repeat of the challenges observed in 2013.
Environmental assessment: Any programme or project identified under this focal sector will be subject to the environmental screening according to the procedure indicated in the Guidelines for Integration of Environment and Climate Change in EU Development Cooperation. If an environmental assessment is not necessary, the application of the screening questionnaire will nevertheless provide an indication of environmental and climate change aspects that will have to be taken into account during the formulation phase.
The overall risk assessment of the sector intervention:
Major risks:
1) No adoption or implementation of the national legal aid bill
Mitigation measure: provide support to legal aid policies on the grounds of the Constitution which sets Access to Justice as a right and engage with GoK in order to have the national legal aid bill adopted and implemented.
2) No effective implementation of the PFM Reform Strategy
Mitigation measure: Maintain active participation in PFM Sector Working Group (with GoK) in order to ensure the implementation of key PFM reforms.
3) Improvement of the legislative framework on elections stalled at the Parliament
Mitigation measure: support the existing legal framework which offers the minimum guarantees for Elections preparedness including for pre and post-election dispute and engage with GoK in order to have provisions on party conduct (financing) and gender equality implemented.
24

Measures. Ш favour of civil society There will be no specific allocation for civil society support. However, civil society organisations will be among the potential implementing partners and beneficiaries of the activities of the sectors on "Food Security and Resilience" and "Accountability of Public Institutions".
B-allocation
No B-allocation is foreseen.
Support measures Measures to support or accompany the programming, preparation or implementation of actions (10 million €)
A support facility (i.e. the Technical Support Programme - TSP) which aims to support or accompany the programming, preparation or implementation of actions, will also benefit from 11th EDF funds, based on the experience of previous programmes under the 10th EDF (TSP 1 and 2).
Support to the National Authorising Officer
Support to the National Authorising Officer will be part of the activities funded by TSP (see point above).
25

; 2005 2006 2007 2008 2009 2010 2011 2012 World view Hopulation, total (millions) 35.79 36.76 37.75 38.77 39.82 40.91 42.03 43.18 Population growth (annual 2.69 2.68 2.67 2.67 2.68 2.69 2.70 2.70 Surface area (sq. km) (thousands) 580.37 580.37 580.37 580.37 580.37 580.37 580.37 580.37 Hoverty headcount ratio at national poverty line (% of population) 45.9 üNi, Atlas method (current Ub$) (Pillions) 18.61 20.94 24.68 28.32 30.88 32.76 33.66 36.50 ÜN1 per capita, Atlas method (current иь$) 520 570 650 730 780 800 800 850 üNi, PPP (current international Ş) (Pillions) 47.94 52.47 57.64 60.04 62.20 66.42 69.77 76.05 ül\l per capita, PHP (current international $) 1340 1430 1530 1550 1560 1620 1660 1760 People income share held ūy lowest 2Uu/o 4.84 Life expectancy at birth, total (years) 54.70 55.60 56.59 57.61 58.62 59.55 60.37 l-ertility rate, total (births per woman) 4.923 4.879 4.824 4.761 4.691 4.616 4.538 Adolescent fertility rate (births per ι,υυυ women ages 1Ь-1У) 101.81 101.02 100.22 98.90 97.58 96.25 94.93 contraceptive prevalence (% of women ages ib-49) 45.5 Births attended by skilled health staff (% of total) 43.8 Mortality rate, under-b (per 1,000 live births) 97.3 93.7 90 85.8 82.5 79 75.5 72.9 Malnutrition prevalence, weight for age (% of children under b) 18.4 16.4 immunization, measles (% of children ages 1 2 - 2 3 months) 69 77 80 90 88 86 87 Primary completion rate, total (% of relevant age group) 90.65 Ratio of girls to boys In primary and secondary education (%) 95.83 96.03 95.14 95.84 95.36 Prevalence of HiV, total (% of population ages 1Ь-4У) 6.8 6.6 6.4 6.3 6.2 6.2 6.2 Environment hörest area (sq. km) (thousands) 35.22 35.11 35 34.89 34.78 34.67 34.56 Agricultural land (u/o of land area) 47.44 47.53 47.62 47.79 48.23 48.23 48.23 Annual freshwater withdrawals, total (% of internal resources) 13.21 13.21 improved water source (% of population with access) · 56.1 56.9 57.7 58.5 59.3 60.1 60.9 improved sanitation facilities (% of population with access) 28 28.2 28.5 28.7 28.9 29.1 29.4 tnergy use (kg of oil equivalent per capita) 451.33 459.67 456.39 459.22 474.50 482.02 480.13 CU<d emissions (metric tons per capita) 0.24 0.26 0.26 0.26 0.31 0.30 hlectric power consumption (kWh per capita) 136.34 144.32 147.86 147.42 145.96 154.51 155.02 Economy ÜDP (current USŞ) (billions) 18.74 22.50 27.24 30.47 30.60 32.23 34.33 37.34 uup growth (annual %) 5.91 6.33 6.99 1,53 2.74 5.80 4.38 4.56 inflation, GDP deflator (annual 7o) 4.90 7.79 5.61 13.21 9.32 1.97 14.38 7.92 Agriculture, value added (% of üdp) 27.20 26.76 25.01 25.84 26.56 24.35 26.90 29.34 industry, value added (% of GDP) 19.09 18.47 18.54 19.77 18.57 18.49 17.48 17.39 Services, etc., value added (% of GDP) 53.71 54.77 56.45 54.39 54.87 57.16 55.62 53.27 bxports of goods and services (% of GDP) 28.51 27.11 26.78 27.61 24.14 27.77 28.54 27.30 imports of goods and services (% of GDP) 35.97 37.83 37.70 41.75 37.45 40.01 45.07 44.49 Gross capital formation (7o of GDP) 17.65 18.49 19.12 19.24 19.92 19.76 20.52 20.09 Revenue, excluding grants (% of GDP) 20.23 18.35 18.74 19.41 19.66 20.29 20.24 cash surplus/deficit (% of GDP) 1.49 -2.33 -2.98 -4.08 -5.31 -5.87 -4.46 States and markets Time required to start a business (days) 54 54 44 30 34 33 33 32 Market capitalization of listed companies (% of GDP) 34.07 50.56 49.15 35.83 35.15 44.87 29.72 39.61 Military expenditure (% of GDP) 1.69 1.67 1.82 1.90 1.89 1.93 1.88 1.96 Mobile cellular subscriptions (per 100 people) 12.95 20.09 30.28 42.40 49.07 61.63 67.49 71.89 Internet users (per 100 people) 3.10 7.53 7.95 8.67 10.04 14.00 28.00 32.10 Roads, paved (% of total roads) 14.6 14.3 14.3 High-technology exports (% of manufactured exports) 2.90 3.24 5.51 4.15 5.31 5.70
Global links Merchandise trade (7o of GDP) 49.45 47.70 47.99 52.94 47.96 53.61 61.09 60.21 Net barter terms of trade index (2000 = 100) 90.04 88.01 84.76 84.31 94.22 92.22 90.68 txternai debt stocks, total (dod, current USŞ) (millions) 6482.90 6680.51 7522.66 7607.38 8589.49 8801.16 10257.88 lotai debt service (% of exports of goods, services and primary 9.97 7.12 6.31 4.87 5.12 4.39 4.20 Net migration (thousands) -189.33 -50 Personal remittances, received (current US$) (millions) 424.99 570.46 645.21 667.32 631.46 685.76 934.15 Foreign direct investment, net inflows (BoP, current US$) 21.21 50.67 729.04 95.59 116.26 178.06 335.25 Net official development assistance and official aid received 759.2 946.7 1326.78 1365.96 1776.2 1628.57 2484.28
Page: Country: Kenya Row: Series Column: Time

Kenya at a glance 3/17/13
POVERTY and SOCIAL Kenya
Sub-Saharan
Africa 2011
Low-income
Population, mid-year (millions) 41.6 875 817 GNI per capita (Atlas method, US$) 820 1,258 571 GNI (Atlss method, US$ billions) 34.1 1,101 466
Average annual growth, 2005-11
Population (%) 2.6 2.5 2.1 Labor force (%) 3.1 2.8 2.6
Most recent estimate (latest year available, 2005-11)
Poverty (% of population below national poverty line) 46 Urban population (% of total population) 24 36 28 Life expectancy at birth Cyears; 57 55 59 Infant mortality (per 1,000 live births) 48 69 63 Child malnutrition (% of children under 5) 16 21 23 Access to an improved water source (% of population) 59 61 65 Literacy (% of population age 15+) 87 63 63 Gross primary enrollment (% of school-age population¡ 113 100 105
Male 115 103 108 Female 112 96 103
KEY ECONOMIC RATIOS and LONG-TERM TRENDS
1991 2001 2010 2011
GDP (US$ billions) 8.2 13.0 32.2 33.6
Gross capital formation/GDP 21.0 18.8 19.8 21.2 Exports of goods and services/GDP 27.0 22.9 27.8 29.1 Gross domestic savings/GDP 19.5 8.7 7.5 4.3 Gross national savings/GDP 19.1 13.1 14.1 13.5
Current account balance/GDP -1.8 -5.7 -7.3 -10.4 Interest payments/GDP 3.9 0.9 0.4 0.3 Total debt/GDP 91.4 42.9 27.3 30.5 Total debt service/exports 32.7 16.1 4.4 4.3 Present value of debt/GDP .· 21.0 Present value of debt/exports .. 70.2
1991-01 2001-11 2010 2011 2011-15 (average annual growth) GDP 2.3 4.5 5.8 4.4 4.9 GDP per capita -0.5 1.9 3.0 1.6 2.2 Exports of goods and services 0.7 6.2 17.7 6.7 7.0
Development diamond*
Life expectancy
GNI per capita
Gross H primary
enrollment
Access to improved water source
» Kenya Low-income group
Economic ratios*
Trade
Domestic savings
4 Capital
Indebtedness
• Kenya Low-income group
STRUCTURE of the ECONOMY 1991 2001 2010 2011
(%0fGDP) Agriculture 28.1 31.3 25.1 28.5 Industry 19.7 17.2 18.6 17.6
Manufacturing 12.0 11.0 11.3 11.0 Services 52.2 51,4 56.3 53.9
Household final consumption expenditure 63.8 75.3 74.9 77.7 General gov't final consumption expenditure 16.8 16.0 17.6 18.0 Imports of goods and services 28.6 33.0 40.1 46.0
1991-01 2001-11 2010 2011 (average annual growth) ... Agriculture 2.9 1.7 6.3 1.6 Industry 1.1 4.7 5.4 2.8
Manufacturing 0.9 4.4 4.5 3.3 Services 3.0 5.0 5.6 5.1
Household final consumption expenditure 4.1 4.8 1.8 4.7 General gov't final consumption expenditure 5.6 . 3.2 9.2 10.6 Gross capital formation 7.8 10.1 5.0 16.1 Imports of goods and services 9.4 8.8 6.1 15.6
Note: 2011 data are preliminary estimates. This table was produced from the Development Economics LDB database. * The diamonds show four key indicators in the country (In bold) compared with its Income-group average. If data are missing, the diamond will
be incomplete.

Kenya
PRICES and GOVERNMENT FINANCE 1991 2001 2010 2011
Domestic prices (% change) Consumer prices 19.1 5.7 4.1 14.0 Implicit GDP deflator 12.5 1.6 2.0 12.1
Government finance (% of GDP, includes current grants) Current revenue 20.4 20.1 24.2 23.9 Current budget balance -6.0 0.5 0.9 2.5 Overall surplus/deficit -11.0 -2.8 -5.8 -3.7
TRADE 1991 2001 2010 2011
(US$ millions) Total exports (fob) 1,055 1,891 5,225 5,478
Petroleum 76 177 90 113 Coffee 159 94 209 266 Manufactures 188 175 608 715
Total imports (cif) 1,956 3,462 12,395 14,665 Food 69 207 . 610 655 Fuel and energy 385 721 2,622 2,857 Capital goods 523 639 3,808 5,361
Export price index (2000=100) 35 103 198 209 Import price index (2000=100) 36 109 ' 195 201 Terms of trade (2000=100) 97 94 102 104
BALANCE of PAYMENTS 1991 2001 2010 2011
CUS$ millions) Exports of goods and services 2,197 2,978 8,901 9,907 Imports of goods and services 2,320 4,287 13,544 16,347 Resource balance -123 -1,309 -4,643 -6,440
Net income -372 -148 -3 -148 Net current transfers 348 719 2,288 3,102
Current account balance -147 -738 -2,358 -3,486
Financing items (net) 59 929 2,512 3,732 Changes in net reserves 88 -190 -154 -246
Memo: Reserves including gold (US$ millions) 199 1,064 4,002 4,248 Conversion rate (DEC, local/US$) • 27.5 78.6 79.2 88.8
EXTERNAL DEBT and RESOURCE FLOWS 1991 2001 2010 2011
(US$ millions) Total debt outstanding and disbursed 7,454 5,566 8,801 10,258
IBRD 783 23 0 0 IDA 1,370 2,263 3,238 3,388
Total debt service 719 485 401 428 IBRD 165 26 0 0 IDA 14 51 111 129
Composition of net resource flows Official grants 418 272 1,228 Official creditors 274 -2 263 560 Private creditors 274 -144 8 17 Foreign direct investment (net inflows) 19 5 178 335 Portfolio equity (net Inflows) 0 2 22 20
World Bank program Commitments 304 92 649 485 Disbursements 178 116 220 268 Principal repayments 101 57 88 103 Net flows 77 58 132 165 Interest payments 77 20 23 26 Net transfers 0 39 109 139
-lnflation(%)-
06 07 08 09 10 11
GDP deflator i CPI
Export and import levels (US$ mill.)
15,000
10,000 IJ J J J 05 05 07
3 Exports
09 10 11
D Imports
Composition of 2011 debt (US$ mill.)
G: 1,593
E: 2,778
B: 3,388
C: 1,100
A-IBRD E- Bilateral B-IDA D - Other multilateral F-Private C-IMF G-Short-term
Note: This table was produced from the Development Economics LDB database. 3/17/13

шшшш IBSii IpsSïiliPSf!PP§§ mm
Goals and Targets Indicators First Year Lates Year Count ry Progress
Region Sub-Sa
Latest Data: haran Africa
Value Year Value Year Level '•/ thart —Value— Year
вц H H M ¡ишш ιρΜ ÎSSïiP deduce extreme poverty oy half
Proportion of population living below $1,25 (PPP) per day (%)
38.4 1992 43.4 2005 very high poverty
60 -, A0 π 20 i Pl o 1—Ц.ц.. U—τ·
19D0 1995 20 30 2005 2010 47.5 2008
Reduce hunger by half Proportion of population below minimum level of dietary energy consumption (%)
35.6 1991 30.4 2011 high hunger
40 -, 3D · p ПТТШТ 20 · ' ; J M I ; í : ι 10 · ! í Π ļ ' i ΗI q 1Mtí 1·|'{ ΠΙ ί·
1990 1995 2
ί! ; 5 ; ļ; •' ! 'Ι
00 2005 2010
27.0 2008
HÜ ри Selil ЙШШК liisis ŞIPH 11 В Universal primary schooling
• "
Net enrolment ratio In primary education (enrôlées per IOD children)
62.6 1999 84.0 2009 moderate
enrollment
100 ι 80·
s- I 20 Á . ^
1990 1995 '
Hiili! L 000 2005 2010
76.2 2010
ШШШШ H M lliljļļgSI ш и ¡¡¡ИМ Equal girls' enrolment In primary school
Ratio of girls to boys in primary education
0.97 1991 0.98 2009 parity
1.05 η
0.85 ' j
0.65 -
0.45 -ļj ^ LL 1990 1995 2
" ί - i í ! ' ' ι i 1JI ) ''cil liim ! 000 2005 2010
0.93 ' 2010
Women's share of paid employment
Share of women in wage employment In the non-agricultural sector {%)
21.4 1990 32.2 1997 medium share
40 •,
30 iTíííf^ 1990 1995 20 DO 2005 2010
32.5 2010
Women's equal representation in national parliaments
Proportion of seats held by women In national parliament (single or lower house only - %)
1.1 1990 9.8 2012 very low
representation
15 , 10-
I·. ,πιτ 1990 1995 204
illi! II 30 2005 2010
20.0 2012
ļfļū H H H WĚÉSĚĚĚĚĚ 1МЯ^И8Р ШШ ΙΜΙΙ Reduce mortality of under-five-year-old by two thirds
Under-five morality rate (deaths of children per 1,000 births)
' '
97.8 1990 72.8 2011 moderate mortality
' ł
Vso-," " *" 100 ΐΐΠΠΤίΤϊΐ 50 · i ļ I ļ o JilíllUiUiii 1090 1995 -000 2005 2010
121
iti В M WÊBSÊÈÈÊÊÊÊ шшж i— Reduce maternal mortality by three quarters
Maternal mortality ratio (maternal deaths per 100,000 live births)
400 1990 360 2010 high mortality
600 ļ 400 η [ļ 200 · ι ř o-P μ
1990 1995 Ш
000 2005 2010
500 2010
Access to universal reproductive health
Contraceptive prevalence rate (percentage of women aged 1549, married or in union, using contraception)
32.7 1993 45.5 2009
moderate access to reproductive health
ļ
1
eo ι 40- π
s. í. 1990 1995 20 0 2005 2010
24.6 2010
Access to universal reproductive health Unmet need for family planning
(percentage of women aged 1549, married or in union, with unmet need for family planning)
35.3 1993 2S.6 2009
moderate access to reproductive health
ļ
1
40 30 - Γ * 20 · ļ j 10 · ! j o ļ—LL,—иЦ. 1990 1995 20
I I 00 2005 2010
25.4
I
2010
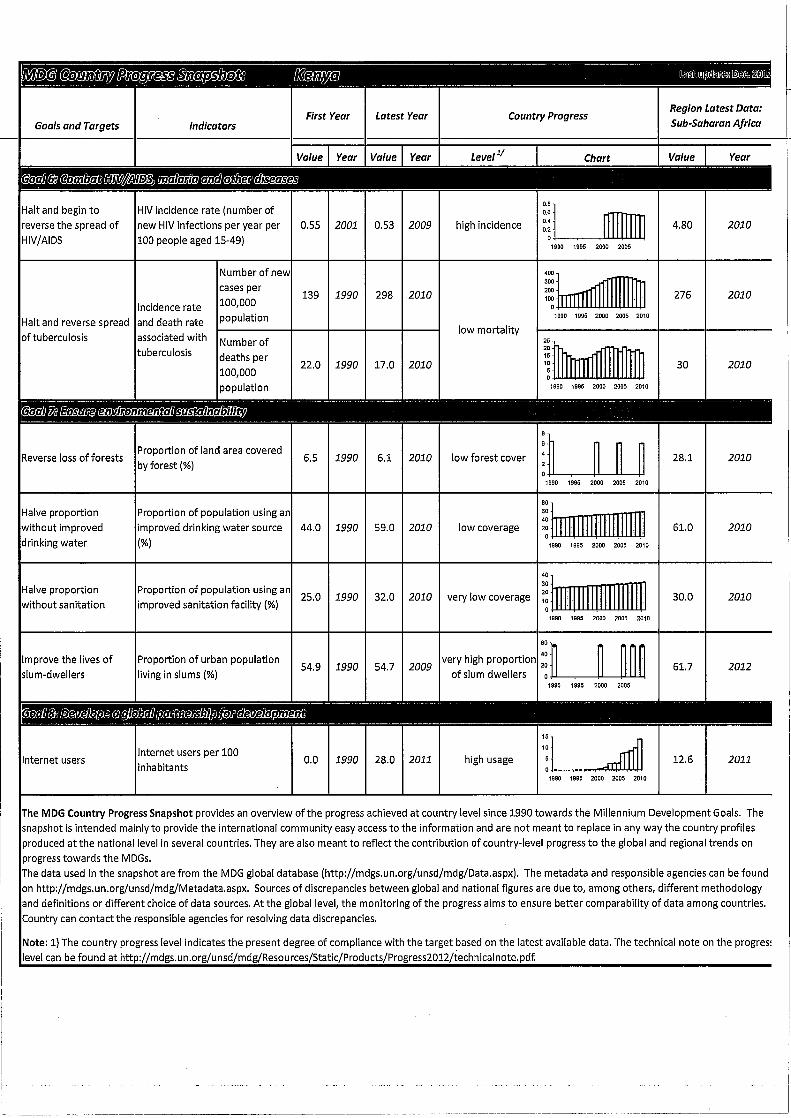
Goals and Targets Indicators First Year Latest Year Country Progress
Region Latest Data: Sub-Saharan Africa
Value Year Value Year Level Chart Value
Halt and begin to reverse the spread of HIV/AIDS
HIV incidence rate (number of new HIV infections per year per 100 people aged 15-49)
0.55 2001 0.53 2009 high incidence
1995 2000 2005
4.80
Halt and reverse spread of tuberculosis
Incidence rate and death rate associated with tuberculosis
Reverse loss of forests
Number of deaths per 100,000 population
Proportion of land area covered by forest (%)
Number of new cases per 100,000 population
139 1990 298 2010 штпИ 276
1990 1995 2000 2005 2010
low mortality
22.0 1990 17.0 2010 ω 30
1990 1995 2000 2005 2010
6.5 1990 6.1 2010 low forest cover
1990 1995 2000 2005 2010
28.1
Halve proportion without improved drinking water
Proportion of population using an improved drinking water source (%)
44.0 1990 59.0 2010 low coverage 61.0 1990 1995 2000 2005 2010
Halve proportion without sanitation
Proportion of population using an improved sanitation facility (%)
25.0 1990 32.0 2010 very low coverage 30.0
1990 1995 2000 2005 2010
Improve the lives of slum-dwellers
Proportion of urban population livingin slums (%)
54.9 1990 54.7 2009 very high proportion
of slum dwellers 61.7
1990 1995 2000 2005
Internet users Internet users per 100 inhabitants
0.0 1990 28.0 2011 high usage τΓηίΐΤί 1990 1995 2000 2005 2010
12.6
The MDG Country Progress Snapshot provides an overview of the progress achieved at country level since 1990 towards the Millennium Development Goals. The snapshot is intended mainly to provide the international community easy access to the information and are not meant to replace in any way the country profiles produced at the national level in several countries. They are also meant to reflect the contribution of country-level progress to the global and regional trends on progress towards the MDGs. The data used in the snapshot are from the MDG global database (http://mdgs.un.org/unsd/mdg/Data.aspx). The metadata and responsible agencies can be found on http://mdgs.un.org/unsd/mdg/Metadata.aspx. Sources of discrepancies between global and national figures are due to, among others, different methodology and definitions or different choice of data sources. At the global level, the monitoring of the progress aims to ensure better comparability of data among countries. Country can contact the responsible agencies for resolving data discrepancies.
Note: 1) The country progress level indicates the present degree of compliance with the target based on the latest available data. The technical note on the progres; level can be found at http://mdgs.un.org/unsd/mdg/Resources/Static/Products/Progress2012/technicalnote.pdf

EN
Matrix showing tentative current (FY 2012/2013) engagement of DPs by sector as defined in the MTP II Draft DIVISION OF LABOUR BASED ON ON-BUDGET ESTIMATES-JUNE 2013
DP/SEC co á g н
< Q
< 1
DANI
DA
JAPA
M
ITAL
Y
BELG
IUM
1
CHIN
A
g Ά 5
N 3
FINL
AND
P g
USAI
D
i AUSA
ID
CIDA
BADE
A
ю M
KUW
AIT
OPEC
SPAI
N
Q
с/з
s n U
P <Я
D D « 3
fc ë IN
DIA
TOTA
L
1 Tou III ШШ ШШ ЕВЯВЯЯК m m Ilii H Ms üli ük ül ílS IV'V/ . • жй*'$ b-Ä •ών: аш ífÉ1
2 Agrie ШШ iin M asseie m m ЯВРЯЯВ» ШШВЙ№ HI m ШШ ШШ IIII ITriiy ШШ иш
·. . тШ 'ļV* :%ìi m -'•"j •" β 8
3 Man m m M m m цаш m ш ШШ нам ШШ ШШШ íjlť'Í 1 ШШ ШИ 1Ш ЙИ ;; âjiii Xv J МИ lii ШШ ИМ 2
4 ICT IM ¡ni m H «ваш Hi m ШШ № лш m ISII Mi .г#1
if·..« r;v į jį МШ- г;Ш ям •į0įįs 111 1
5 PFM tifi m pp m ш ШШ ШШ ш ШШ ШШ m НИ IM ШШ ши ШШ ΛίΤ- ШШ SSŕi Μ iil 'Iż.': gg 12
6 EaT pp i S m m ИИНЯЙ! m m шшшт нш m ppi ШШ ши gįlli ШШ Hü ?Ш13 •«•./I ШШ iilfļ
· . . ЯН ip-i ШШ 7
7 Hea Ml üi ш m ш m m ШШ Illi gM 1 :|ţ ..v, i/ ; msām •Ж Pil λ iļ 1Ш. ШШ Ш y-ΨΝ 14
8 EWS шш 9¡ ШШ m Ш К§Ш ш m iil Bi ixg ШшШ IS'Î мш •: • ШШ IM »• ¡ш se Sl 17
9 LYH gg Ш1 ши m m ШШ НЕ Ш1 ШШ «йШ тя ЩЩ íi m •'iÜt.? ŕl ••. 's ' ·:
L'I мю III '•Mi ; ; : 7
10 PUH gs gM [¿Ш m ш H Ш 1 m 1Ш ШШ i ' · "v.·- '
¿i ' í "CÎ nS-f яш? Ï; Æii Шр 6
11 OIL щш ШШ Ш1 ШВШ m m ж шш& шШ m ШШ ШШ ШШ •лд! Mål :4b.·"' .. . Ш! ШШ Ælt .;Ά им 111 5
12 Tra mi рш M m ш m IIHIII 411 ШШ
итприш ШШ m ШШ Ш ШШ ш ШШ! Bi Шй
- w¿& lil tm S"í?ä£ IHfl •'Ш; Hl'ť 6
13 SPB ши ШШ WBBSBB Wm ШШ ШШШ ШШ m ШШ аШивк. m 11 ļHŪ Şîg-, Mi ШШ gį ' •-•'•71®·· ||Si Sí' 1
14 PSR m ШШ m m m m ШШ иявмв m m ша 1И ШШ ШШ |Щ? Й!Ш SIS; ШШ '• * •N' įį;> •Sţi -īĪļi:> HR ши IHM • ' - Övi';' S
15 Ener m Mi 1Ш ш H ШяЯШ m вмв ивмвд ш m ши ëH 1Ш НИН ШШ ГЩ ШШ lift ШШ '' Á·: • ми lil Шг 12
16 Roa m m ШШ ш m тшж MH m m шж m ШШ ШШ Ml Mi ШШ Sil ШШ - - 1181 шм P i 12
17 Trans üll ШШ m H № H m m ШШ 1И 1Ш 'Ж äv \ хн MĚ: ШШ 11181 ШШ ШШ !ü ма .Ш' 3
18 NMD inp liii 1 m m ЯдрНЯВВу β m m M ШШ WÊÍ Mil Я1 ми • : r JW 1R8 ;ЩМ ШШ I
19 STI 1 ж m ШШ ШШ ш ШШ WS&m m Ш® 1Ш1 Üll llilí рш шв £?/) ми 1 j •ν©! Hil ш§ Mi 3
20 DRR Ш m » ЕШ ш Ш m m ШШ ШШ Şf;;;, ШР ШШ: IIP ψ$ iS 21 Lan 5£тмавю
gxggl ШШ mi g|gļ gm gíHg m Щ| gg —i iitL a.i¿& MW •шм ШШШ вш 2
15 в 6 9 6 3 β 5 8 11 5 s 2 3 e 2 1 5 1 4 5 2 3 1 1 ï 1 1 Key. Sectors- Tou-Tourism, Agri-Agriculture, Tra- Trade, Man-Manufacturing, ICT-Information, Communication and Technology, PFM -Public Finance Management, EaT-Educaticin and Training. Hea-Health, EWS-Environment, Water and Sanitation, LYH-Labour, Youth and Human Resource Management, PUH- Population, Urbanisation and Housing, CļJL-Govemance, Justice and Legal Reforms. SPB-Security, Peace Building and Conflict Management, DRR Disaster risk reduction in ASAL- PSR-Public Service Reform Roa-Roads, Trans-Transport, NMD-Nairobi Metropolitan Deve bpment, STI- Science, Technology and Innovation Lan-Lands, Ene- Energy, Trans-Transport
τ

EN
Tables 1 and 2 show the EU+ support provided by the 8 bilateral Member States, EUD/the European Development Fund (EDF), the European Investment Bank (EIB) and the Directorate General for Humanitarian Aid and Civil Protection (ECHO) distributed by sector in amounts and percentages. In •føe-colour-version-of-the-report, the pillars of the MTP have been marked with the following colours:
MTP Pillars: í -áfefeiúthars
Table 1: EU+ support by sector in EUR

EN
Table 2: EU+ support by sectors in percentage, ranking of sectors by amount of support and total percentage for the 10 most supported sectors
Joint EU programming Kenya
Percenta ge distribution on sectors Ranking 2013 & % Disbursements estimates (commitments)
Ranking 2013 & %
O ł-»
O
Sector 2011 2012 2013 2014 2015 2016 largest Agriculture 7.64 7.80 5.11 4.65 5.34 5.68 6 Tourism 0.00 0.00 0.00 0.00 0.00 0.00 Trade 1.62 2.38 2.77 2.61 0.63 0.36 ... 9 Manufacturing 1.61 2.19 1.17 1.28 2.12 0.91 ICTand BPO 0.00 0.00 0.00 0.00 0.00 0.00 Financial services 1.39 13.87 6.52 13.20 9.63 0.00 3 Education and Training 1.75 1.63 1.77 2.10 1.19 1.44 11 Health 16.79 7.56 6.80 10.52 5.56 4.04 4 HIV/AIDS 0.46 0.22 0.00 0.00 0.00 0.00 Environment, water and sanitation 14.97 16.20 18.69 16.01 20.45 19.67 2 Gender, youth and vulnerable groups 2.31 3.92 1.73 1.69 0.67 0.38 12 Labourand employment 0.06 0.00 0.00 0.00 0.00 0.00 Equity Population, Urbanization and
0.00 0.00 0.00 0.00 0.00 0.00
Housing 0.80 0.76 1.80 3.88 0.77 0.71 10 Governance, Security and Rule of Law 7.35 9.33 4.26 3.91 3.35 4.14 7 Security 0.22 0.29 0.26 0.24 0.27 0.16 Public Sector Reform 0.75 0.69 0.28 0.25 0.38 0.71 Publicfinandal management 0.48 1.93 1.25 0.46 0.65 0.97 Devolution and implementation of the Constitution 0.16 0.15 0.04 0.47 0.63 2.33 Infrastrurture 18.89 24.28 38.71 30.32 45.94 55.54 1
Science, Technology and Innovation 0.00 0.00 0.00 1.80 0.00 0.00 Draught and Ending Drought 1. : .·, Emergencies ^ • Emergencies and disaster л '-'-ŕ management '. • • ' • ' fcU/ffi··. 5.85
-3.6,
3.20
ācĪ;';';.: · 5.95;;.,4:45;,f;Ą5: 2.32^;^;: . ' 2.85 .'Λγ'ντί'1"·.""· ' ·- • . .i'.·.' '' r:i ': ·л. ' '•"Λ·;"?:': •: ·Ά
5
8
Totals 100.00i 100.00 100.00 100.00 100.00 100.00 93.50

EN
Aliñes 3. Temnłale lor Sector intervention franmvor!
Note: All targets are based on current data available and subiect to feasibility, identification and assessment studies. Where baselines or targets are not available, these will be determined at project formulation stage. Every time it is possible and meaningful, indicators will be disaggregated by gender.
Specific objective 1: The ASAL institutions and stakeholders in the agriculture sector are able to develop, adjust and implement Disaster Risk Reduction strategies involving a multifaceted approach covering nutrition, agriculture productivity integrating market linkages, diversification of livelihood sources as well as supporting climate proof investments at community and at county levels. Expected Results Indicators Means of verification
a) Food security of the most vulnerable part of the population and their resilience to climatic shocks are improved (the pull element).
About 2 million persons will benefit under this component along the following indicators:
al) malnutrition level during drought: i) % of stunted children below five years old in ASAL areas ii) Access to food as measured by FAO food insecurity access score.
a.2) i) % of ASAL covered by approved county drought contingency plans ii) % of ASAL covered by community drought contingency plans
Al) a) MoHealth yearly Kenya Nutritional Survey + b) Kenya food security assessment steering group semester report
a2) Crisis Toolkit for county
planning and county reporting
ii) FAO survey
a) NDMA early warning system
b) % of livestock retained at household level after drought verified against average livestock holding per household before drought crisis (sub-reference per quintile of income per agro-ecological zone)
b) PDNA and specific Livelihood assessment
b) Productive agriculture and community investments to
, safeguard productivity against climatic shocks supported (the push element).
Another 2 million persons should benefit from this component.
a) % of smallhokk-r farmers beneficiaries graduating from subsistence farming to commercial agriculture measured by i) % of non-subsidized inputs used, ii) % of smallholder farmers with a commercial contract iii) % smallholder farmers in financial services. b) National grain deficit c) % of smallholders' production marketed
d) Number of new drought resistant and more yielding technologies adopted (in value chain or national programme).
BÍ) a) b) and c) Ministry of Agriculture M&E system. ,
B2) Research and programme implementation reports

c) A conducive environment for long-term food security and resilience to drought supported.
cl) % climate proof infrastructure earmarked in County Investment Development Plans (CIDP) budgeted; and % climate proof infrastructure
cl) consolidated DRR counties yearly reports
c2) relevant counties implemented - Baseline: the DRR annexes to the CIDPs.
c2) average water flow on permanent and semi-permanent rivers from water towers located in or bordering ASAL areas
c3) Indicators to be defined during the identification mission along: a) Access to land for the small holder farmers and pastoralists b) number of resolution of conflicts on land and access to natural resources.
hydrologicai reports
c3) consolidated semester report of the county land boards
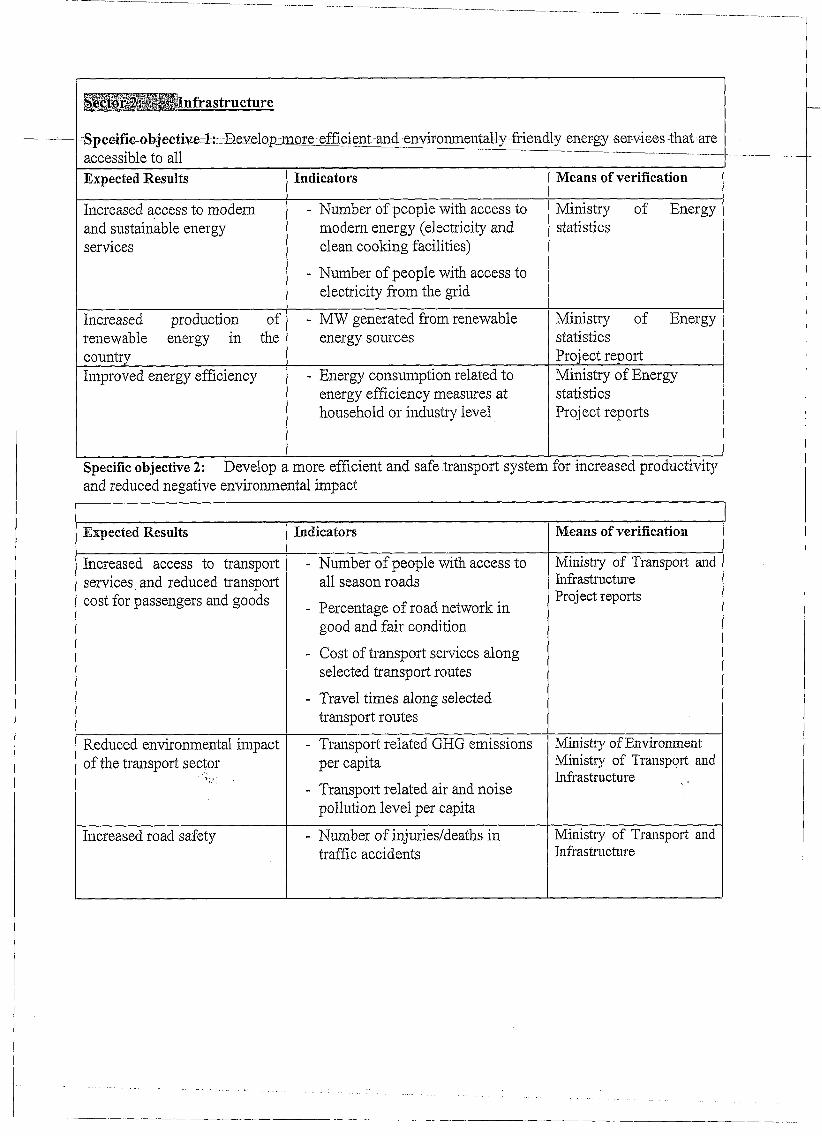
ЩЩог!: Infrastructure
-Specific-objectjve-:l:__Bev_elop:r accessible to all
nore efficient and -environmentally friendly energy services that are
ЩЩог!: Infrastructure
-Specific-objectjve-:l:__Bev_elop:r accessible to all Expected Results Indicators Means of verification
Increased access to modern and sustainable energy services
- Number of people with access to modern energy (electricity and clean cooking facilities)
- Number of people with access to electricity from the grid
Ministry of Energy statistics
Increased production of renewable energy in the country
- MW generated from renewable energy sources
Ministry of Energy statistics Project report
Improved energy efficiency - Energy consumption related to energy efficiency measures at household or industry level
Ministry of Energy statistics Project reports
Specific objective 2: Develop a more efficient and safe transport system for increased productivity and reduced negative environmental impact
Expected Results Indicators Means of verification
Increased access to transport services, and reduced transport cost for passengers and goods
- Number of people with access to all season roads
- Percentage of road network in good and fair condition
- Cost of transport services along selected transport routes
- Travel times along selected transport routes
Ministry of Transport and Infrastructure Project reports
Reduced environmental impact of the transport sector
v.' '· ' ·
- Transport related GHG emissions per capita
- Transport related air and noise pollution level per capita
Ministry of Environment Ministry of Transport and Infrastructure ,
Increased road safety - Number of injuries/deaths in traffic accidents
Ministry of Transport and Infrastructure

Sector Λ: ЧссЗЯННШМШНШНЮШВШ!
ry of justice Specifìcobjectivel:Supportincreasedequityinaccesstoand delivel ry of justice
Expected Result Indicators Means of verification
1) The justice system is made available to a greater diversity of Kenyans
Change (in %) in case backlog at the Judiciary
Annual Report on the State of the Judiciary and the Administration of Justice
Change (in %) in the number of people who have benefited from Legal Aid services across Kenya
Annual Report on the State of the Judiciary and the Administration of Justice
Percentage of people held in custody in Kenyan prisons who are on remand
Annual Report of the Kenya National Commission on Human Rights (KNCHR) Annual Report on the State of the Judiciary and the Administration of Justice
Specific objective 2: Support more transparent management of public funds at central and county level Expected Result Indicators Means of verification
2) Public funds are better monitored and accounted for at all levels of governance
Status of legislation and regulations to implement Chapter 11 (Devolved Government) and Chapter 12 (Public Finance)
Annual Implementation Report of the PFM Reform Strategy PEFA evaluation
Number of government and county financial reports unqualified by the Auditor General
Annual audit report of the public accounts of Kenya by the Office of the Auditor General
Change (in %) in the poverty rate of the 10 poorest counties of Kenya
County fact sheets by the Commission on Revenue Allocation (CRA)
Specific objective 3: Support elections that are credible and fully compliant with the Constitution Expected Result Indicators Means of verification
3) The 2017 elections represent further improvement in terms of preparation of the elections, polling operations and compliance with the Constitution
Percentage of recommendations of the EU Election Observation Mission on General Elections 2013 in Kenya implemented before and during the next elections of 2017
2017 EU Election Observation Mission Reports 2017 UNDP Election Basket Fund implementation report
Number of public institutions elected 2017 EU Election

in 2017 in compliance with the Constitution, including the 1/3 gender clause
Observation Mission Reports 2017 UNDP Election Basket Fund implementation report
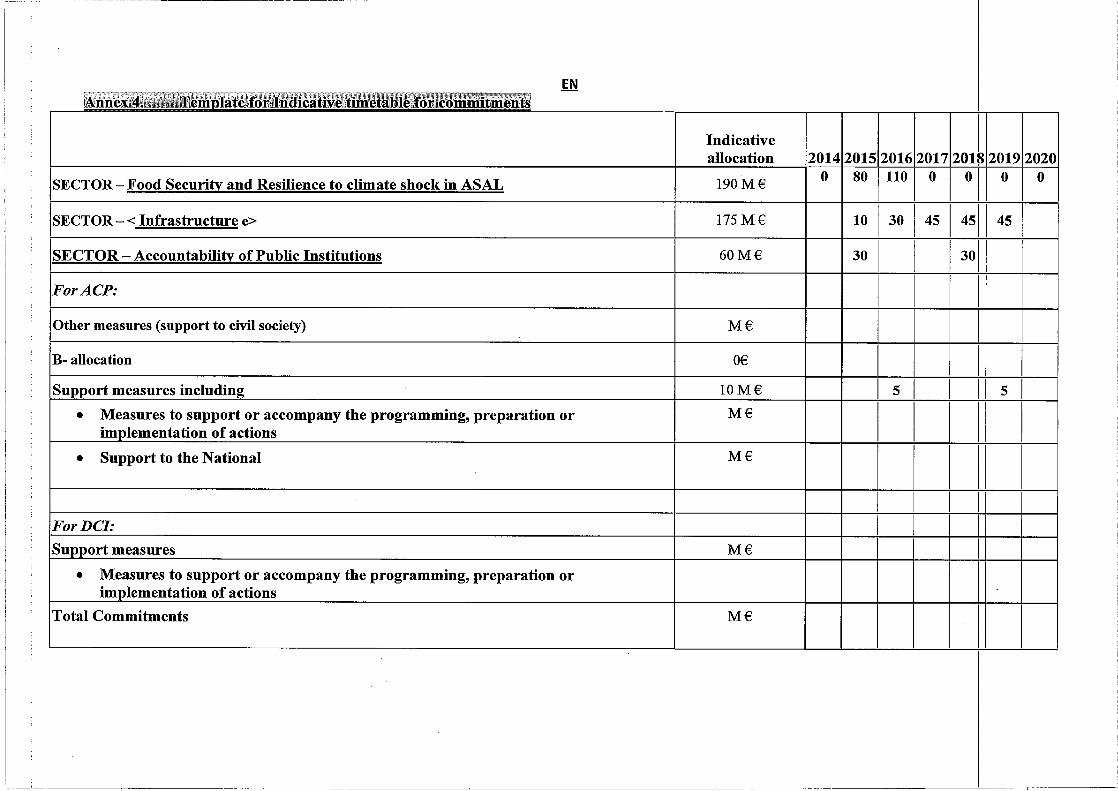
EN Annex 4, Template for Indicative timetable for commitments
Indicative allocation 2014 2015 2016 2017 2018 »2019 2020
SECTOR - Food Security and Resilience to climate shock in ASAL 190 M € 0 80 110 0 0 0 0
SECTOR - < Infrastructure e> 175 M € 10 30 45 45 45
SECTOR - Accountability of Public Institutions 60 M € 30 30 60 M € 30 30
For ACP:
Other measures (support to civil society) M€
B- allocation 06
Support measures including 10 М€ 5 5 • Measures to support or accompany the programming, preparation or
implementation of actions М€
• Support to the National М€
For DCI: Support measures М€
• Measures to support or accompany the programming, preparation or implementation of actions
Total Commitments М€