Embed Size (px)
Citation preview

Fernando Hervás
Sixth IRIMA Workshop on: 'R&D Investment and Firm Dynamics' Brussels, 3rd December 2015
EU Industrial R&D Scoreboard
2015
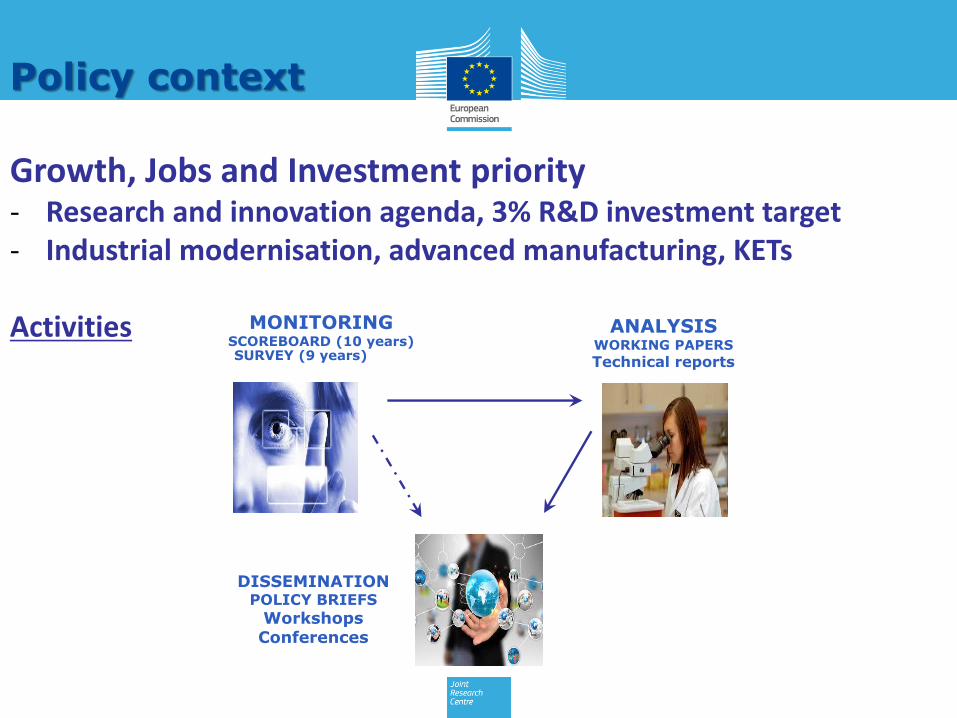
Policy context
Growth, Jobs and Investment priority - Research and innovation agenda, 3% R&D investment target - Industrial modernisation, advanced manufacturing, KETs Activities
SURVEY (9 years)
MONITORING SCOREBOARD (10 years)
ANALYSIS WORKING PAPERS
Technical reports
DISSEMINATION POLICY BRIEFS
Workshops Conferences

Policy message
Need to increase the weight of knowledge intensive and high-value industrial segments in the European economy
WHY?
Global Value Chains
EU industrial structure
Shift towards more knowledge
intensive activities will make it
more resilient and competitive in
a global economy
Investment
Knowledge Based Capital
Investments in intangible assets
are main source of
Growth and Employment
New technologies
Technological development
Key and emerging technologies contribute to
solve grand societal challenges
4
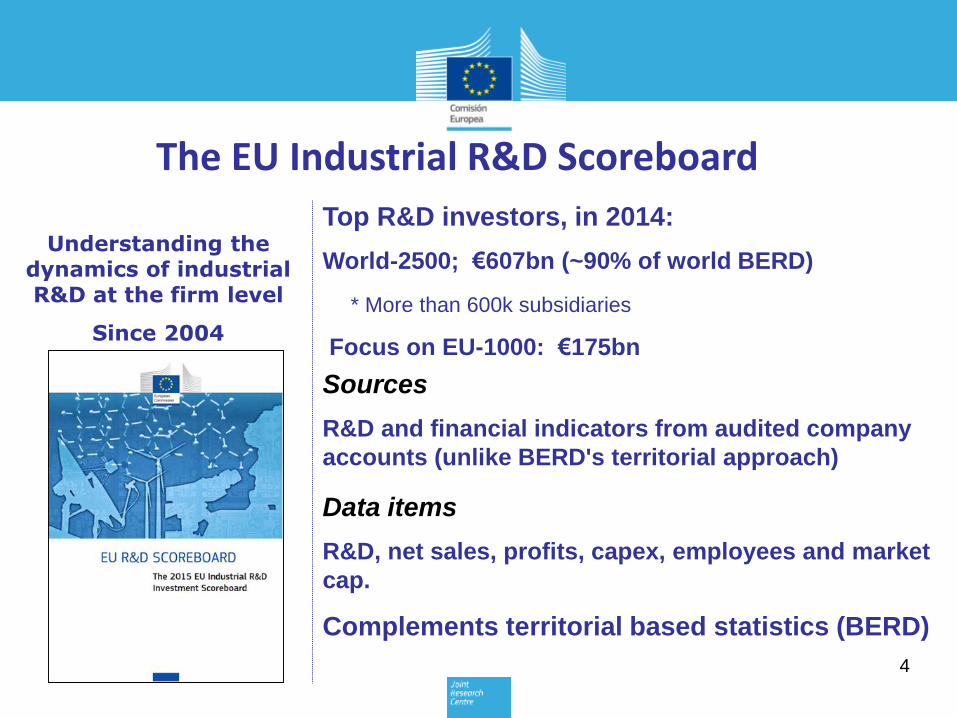
Understanding the dynamics of industrial R&D at the firm level
Since 2004
Top R&D investors, in 2014:
World-2500; €607bn (~90% of world BERD)
* More than 600k subsidiaries
Focus on EU-1000: €175bn
Sources
R&D and financial indicators from audited company
accounts (unlike BERD's territorial approach)
Data items
R&D, net sales, profits, capex, employees and market
cap.
Complements territorial based statistics (BERD)
The EU Industrial R&D Scoreboard

The top 2500 companies invested €607.2 billion in R&D, which is 55% of the
total expenditure on R&D worldwide (GERD) and about 90% of the R&D
expenditure financed by the business sector worldwide (BERD).

Distribution of the 2500 companies in the 2015 Scoreboard by country
Note: The map only includes countries with 9 or more companies. Source: The 2015 EU Industrial R&D Investment Scoreboard, European Commission, JRC/DG RTD.

Distribution of the 608 EU companies in the 2015 Scoreboard by country
Source: The 2015 EU Industrial R&D Investment Scoreboard, European Commission, JRC/DG RTD.

Top R&D investors – investment share by main world region
Source: The 2015 EU Industrial R&D Investment Scoreboard, European Commission, JRC/DG RTD.
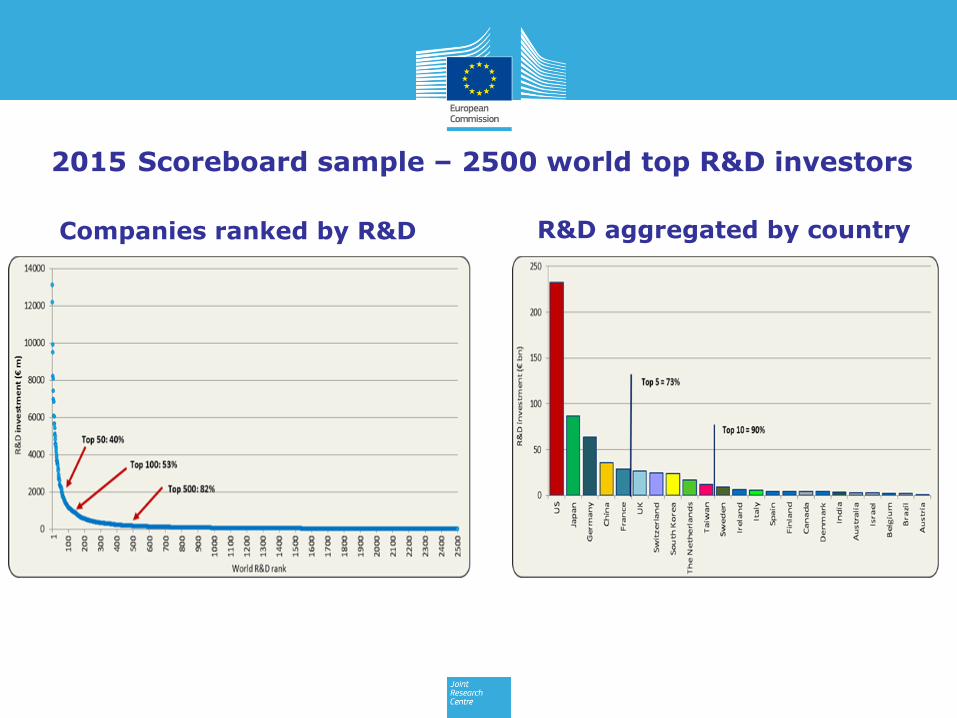
Companies ranked by R&D R&D aggregated by country
2015 Scoreboard sample – 2500 world top R&D investors

As in the previous Scoreboard edition, the top R&D investors are VW,
Samsung, Microsoft, Intel and Novartis.
The most significant changes at the top of the ranking in 2014 are the climb of
Google to 6th place (from 9th), and Pfizer to 10th place (from 15th). Huawei (15th)
and Apple (18th) accelerated in 2014 their race towards the top 10, jumping 11 and
17 positions, respectively. By main sector, the top investors are:
Pharmaceuticals & Biotech. Automobiles & Parts Technology Hardware & Equip.
NOVARTIS Switzerland VOLKSWAGEN Germany INTEL US
ROCHE Switzerland TOYOTA MOTOR Japan CISCO SYSTEMS US
JOHNSON & JOHNSON US GENERAL MOTORS US APPLE US
Software & Computer Services Electronic & Electrical Equipment Industrial Engineering
MICROSOFT US SAMSUNG South Korea VOLVO Sweden
GOOGLE US SIEMENS Germany CATERPILLAR US
ORACLE US HITACHI Japan ABB Switzerland
Chemicals Aerospace & Defence General Industrials
BASF Germany AIRBUS The Netherlands GENERAL ELECTRIC US
DUPONT US BOEING US TOSHIBA Japan
MONSANTO US UNITED TECHNOLOGIES US PHILIPS The Netherlands
Leisure Goods Health Care Equipment & Services Oil & Gas Producers
SONY Japan MEDTRONIC PLC Ireland PETROCHINA China
PANASONIC Japan BAXTER INTERNATIONAL US TOTAL France
LG ELECTRONICS South Korea BOSTON SCIENTIFIC US ROYAL DUTCH SHELL UK

Differences in region's
industrial structures –
R&D intensive sectors
Pharma & Bio18%
Tech. Hardware & Equipment
9%
Software4%
Aerospace & Defence6%
other high2%
Automobiles & parts27%
Industrials2%
Electr. Equipment
5%
Chemicals3%
other medium-high8%
medium-low6%
low10%
EU 608 companies€171 bn R&D
high 39%
medium-high 45%
Pharma & Bio21%
Tech. Hardware & Equipment
25%Software
21%
Aerospace & Defence
3%
other high4%
Automobiles & parts7%
Industrials3%
Electr. Equipment
3%
Chemicals3%
other medium-high5%
medium-low4% low
1%
US829 companies €232 bn R&D
high 74%
medium-high 21%
Pharma & Bio2%
Tech. Hardware & Equipment
13%
Software10%
other high2%
Automobiles & parts
10%
Industrials3%
Electr. Equipment
6%
Chemicals1%
other medium-high
25%
medium-low2%
low26%
China301 companies
€36 bn R&D
high27%
medium-high 45%
Pharma & Bio11%
Tech. Hardware & Equipment
7%
Software3%
other high10%
Automobiles & parts
29%
Industrials6%
Electr. Equipment
13%
Chemicals7%
other medium-high
7%
medium-low4% low
3%
Japan 360 companies
€87 bn R&D
high 31%
medium-high 62%

Company R&D investment by sector (2006 vs 2014)
Source: The 2015 EU Industrial R&D Investment Scoreboard, European Commission, JRC/DG RTD.

Our Evidence
Source: The 2015 EU Industrial R&D Investment Scoreboard, European Commission, JRC/DG RTD.

Top R&D investors are also top employers

The country distribution of patents filed by the world's top R&D investors is a
good proxy for the location of companies' innovation activities.
80% of patents were developed by inventors
residing in the same world region as the
parent company owning the rights: Inventor location
EU USA Japan RoW Switzerland
Co
mp
any'
s h
ead
qu
arte
r lo
cati
on
EU (6,635)
72.2% 21.6% 1.3% 3.9% 1.0%
USA (8,619)
10.3% 81.2% 1.7% 5.0% 1.8%
Japan (1,342)
5.8% 18.5% 67.8% 7.7% 0.21%
RoW (860)
18.1% 30.5% 0.1% 50.3% 1.12%
Switzerland (2,897)
31.0% 43.7% 2.6% 3.8% 18.8%
Inventor location
EU USA Japan Asian Tigers RoW
Co
mp
any'
s h
ead
qu
arte
r lo
cati
on
EU (14,609)
84.9% 10.6% 1.2% 0.9% 2.4%
USA (7,172)
28.1% 65.8% 0.8% 0.4% 4.8%
Japan (17,508)
1.6% 7.8% 89.9% 0.0% 0.58%
Asian Tigers (2,520)
0.2% 0.8% 0.4% 97.0% 1.54%
RoW (118)
71.4% 5.3% 23.3%
Pharma & biotech
Automobiles
& parts

High-performing R&D driven innovators in the EU
Identification exercise, based on multiple performance criteria over the period 2000-2013: R&D and sales growth, R&D intensity, labour productivity, profits. Key findings: - Concentrated in few countries including the UK, Germany, France and Sweden. - High-tech firms are, on average, younger than those in other sector groups and are also relatively more numerous. - Very heterogeneous corporate trajectories, including dynamic ICT firms and few older companies from less R&D intensive sectors. - Eight firms showing particularly strong performance (R&D intensity above 10%, net sales growth above 10%), positive profits and well above sectoral labour productivity average: Dialog Semiconductor, Gameloft, Bavarian Nordic, Wirecard, Parrot, Playtech, HMS Networks and Generix.

IRIMA research agenda
The role of intangibles (patents, TM , other) in firm's
performance and the obstacles to firms competitiveness
Disentangling the casual links underlying the success of firms
(birth and scaling-up)
Analysis of value chains in strategic knowledge intensive industrial sectors

Thank you More information at:
IRIMA:
http://iri.jrc.ec.europa.eu/
JRC - Joint Research Centre:
https://ec.europa.eu/jrc/
Contact information:
[email protected] Economics of Industrial Research and Innovation
European Commission
JRC-IPTS’s Knowledge for Growth Unit
Edf. Expo, Calle Inca Garcilaso n. 3
41092 Seville (Spain)

EU/US gap largely determined by differences in high-tech sectors related to
health and ICT
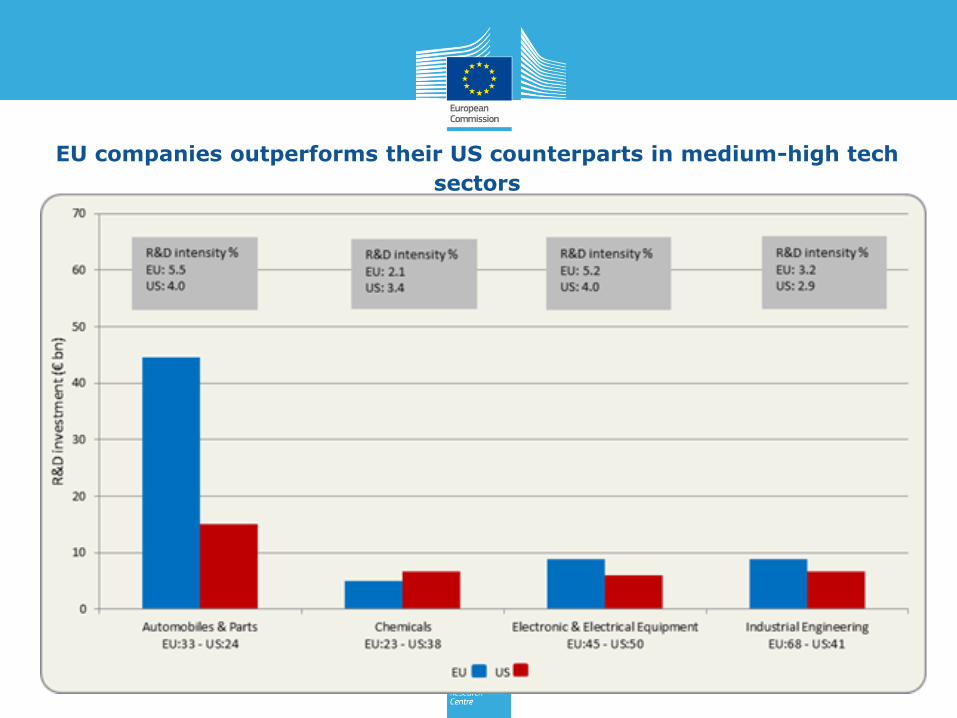
EU companies outperforms their US counterparts in medium-high tech
sectors