Embed Size (px)
Citation preview

EU-India trade relations: assessment and perspectives
Authors: Niclas POITIERS, Suman BERY, Sonali CHOWDHRY and Alicia GARCÍA-HERRERO
European Parliament Coordinator: Policy Department for External Relations
Directorate General for External Policies of the Union PE 653.646 – September 2021
EN
IN-DEPTH ANALYSIS Requested by the INTA committee
DIRECTORATE-GENERAL FOR EXTERNAL POLICIES
POLICY DEPARTMENT
EP/EXPO/INTA/FWC/2019-01/LOT5/1/C/09 EN
September 2021 – PE 653.646 © European Union, 2021
IN-DEPTH ANALYSIS
EU-India trade relations: assessment and perspectives
ABSTRACT
Following the EU-India summit in May 2021, talks on both an EU-India trade and an investment agreement have resumed. This analysis provides background on where EU-India economic relations stand and why it is important to maintain momentum following this breakthrough, despite a somewhat unpromising domestic political envi-ronment in India. This new impetus largely reflects a transformed geopolitical land-scape since the last round of EU-India talks were abandoned in 2013. The increased tension between India and China, as well as the EU’s intent to reduce its reliance on Chinese manufacturing have created the conditions for changes in policy by both parties. However, many of the issues that bedeviled the 2007-2013 negotiations remain unresolved. In this analysis, we provide an overview of EU-India trade and investment relations as well as the major topics in these negotiations. The impact of key global initiatives on climate change and WTO reform that will shape the negotia-tions is also briefly discussed. Based on this analysis, we discuss three potential ways forward for EU-India trade and investment negotiations: a comprehensive agreement similar to that reached between the EU and Vietnam; a limited investment deal primarily focused on manufacturing; and a reinforced status quo with trade and invest-ment relations growing organically under the existing multilateral umbrella.
Policy Department, Directorate-General for External Policies AUTHORS
• Niclas POITIERS, Research Fellow, Bruegel
• Suman BERY, Non-resident Fellow, Bruegel
• Sonali CHOWDHRY, Kiel Institute for the World Economy
• Alicia GARCÍA-HERRERO, Senior Fellow, Bruegel
Coordination by Bruegel: Daniel Mayer (project management), Lionel Guetta-Jeanrenaud (research assis-tance), André Sapir (feedback), Stephen Gardner and Henry Naylor (editorial support).
This paper was requested by the European Parliament's Committee on International Trade (INTA).
The content of this document is the sole responsibility of the author(s), and any opinions expressed herein do not necessarily represent the official position of the European Parliament.
CONTACTS IN THE EUROPEAN PARLIAMENT
Coordination: Mario DAMEN, Policy Department for External Policies
Editorial assistant: Balázs REISS
Feedback is welcome. Please write to [email protected]
To obtain copies, please send a request to [email protected]
VERSION
English-language manuscript completed on 6 September 2021.
COPYRIGHT
Brussels © European Union, 2021
Reproduction and translation for non-commercial purposes are authorised, provided the source is acknowl-edged and the European Parliament is given prior notice and sent a copy.
This paper will be published on the European Parliament's online database, 'Think tank'.
EU-India trade relations: assessment and perspectives
3
Table of contents
1 Introduction 5
2 The suspended 2007-2013 negotiations 10
3 Where do EU-India trade relations stand? 13
4 Bilateral investment 19
5 EU-India trade in a changing global environment 22
6 Assessment and way forward 27
References 30

EU-India trade relations: assessment and perspectives
5
1 Introduction India is back in Brussels. At the May 2021 EU-India summit, it was announced that negotiations on an EU-India free trade agreement (FTA) should be restarted. After the obvious disappointment of discontinued negotiations back in 2013, India is back on the agenda of European Union trade and investment negoti-ators for two main reasons: the EU’s need to secure external markets and US-China strategic competition, which is pushing middle powers together. In paragraph 17 of the Joint Statement issued at the Summit, the EU and India stated:
’We agreed to resume negotiations for a balanced, ambitious, comprehensive and mutually beneficial trade agreement which would respond to the current challenges. We agreed that in order to create the required positive dynamic for negotiations, it is imperative to find solutions to long-standing market access issues. We also agreed to the launch of negotiations on a stand-alone investment protection agreement. We also agreed to start negotiations on a separate agreement on geographical indications which could be concluded sepa-rately or integrated into the trade agreement, depending on the pace of negotiations.’1
This means the EU and India wish to conclude agreements on trade, market access, investment protection and geographical indications. The intention to sign an EU-India FTA dates back to the strategic partnership launched in 2004. In this in-depth analysis, we discuss the geopolitical background and the economic relationship between the EU and India in order to inform the debate on the new push for an agreement. We conclude with a discussion of options and likely outcomes of these negotiations.
Before we look into EU-India economic relations, we start with a discussion of the political background against which India and the EU are entering into the talks, and revisit the issues that led to the failure of the 2007-2013 negotiations.
1.1 India’s experience with opening up to trade and investment2 Since gaining independence from Britain in 1947, India’s external engagement has been driven by two overarching goals: to restore the country’s historic standing as one of the world’s major economies (despite the traumas of colonisation and partition), and to preserve geopolitical freedom of action, or ‘strategic autonomy’. As we discuss below, these goals remain today. Economic strength is both an end in itself (to lift millions out of deep distress and poverty), and is indispensable for maintaining and defending auto-nomy. For decades, India’s fundamental economic and political challenge has been to provide good jobs for its young population, something that anaemic manufacturing performance has prevented, in contrast to the experience of peers in Southeast Asia and most recently in China
Below, we review the evolution of Indian trade policy in pursuit of these larger goals. This helps us to understand the economic imperatives shaping India’s present external posture, and what these could mean for India’s forthcoming economic engagement with the EU. This overview is followed by a brief description of India’s current geopolitical situation, and how deeper ties with the EU may be instrumental in addressing these challenges.
At independence, India inherited a relatively open trade regime (Krishna, 2019, Section II) and was one of the 23 original ‘contracting parties’ to the GATT. India’s turn inwards occurred in the following decades, following the government attempts to industrialize the country while guarding off foreign competition. The former was formalised in India’s Industrial Policy Resolution of 1956. This focused on domestic
1 ‘Joint Statement, EU-India Leaders’ Meeting, 8 May 2021’, https://www.consilium.europa.eu/media/49523/eu-india-leaders-meeting-joint-statement-080521.pdf. 2 This discussion draws on Krishna (2019). The aim of the narrative is to provide a perspective on the evolution of India’s external engagement that may not be familiar to a European audience. See also Bery (2021).
Policy Department, Directorate-General for External Policies
6
production of capital goods, rather than capitalising on India’s historic superiority in labour-intensive products, notably textiles.
India’s industrial policies were strongly influenced by what was then considered the success of the Soviet Union in the inter-war years, and the export pessimism of Latin American thinkers.3 The primacy of the public sector in India’s industrialization strategy also reflected the extensive nationalisation undertaken by the post-war government in Britain.
For a broad range of reasons, these policies failed to achieve the rapid industrial take-off to which India had aspired. Policy was reinforced by geopolitics: Jawaharlal Nehru, India’s prime minister until his death in 1964, pursued a policy of non-alignment, including robust commercial and defence links with the Soviet Union. Indira Gandhi of the still-dominant Congress party (who became prime minister in 1966) increasing-ly sided with the USSR in the Cold War, reacting to US support for Pakistan and China under President Nixon (1969-74) and took further steps in the direction of a planned rather than market economy which included nationalisation of the major commercial banks in 1969. The cost of preserving strategic autonomy in the 1960s and 1970s was dismal economic stagnation.
The next phase was India’s embrace of openness in 1991. This occurred at a time of economic and political crisis on the watch of Prime Minister P. V. Narasimha Rao, the first Congress prime minister drawn from outside the Nehru-Gandhi family. Rao’s technocratic finance minister, Manmohan Singh, advised the prime minister to seek support from the International Monetary Fund. The programme submitted to the IMF included a comprehensive, integrated set of reforms covering trade, public finance, the exchange rate regime and the reform of capital markets. These reforms had been under discussion for at least five years, driven by a desire to emulate the export-led manufacturing success of the economies of East and Southeast Asia and thereafter China, following the Reform and Opening-Up strategy introduced by Deng Xiao Peng from 1979.4
While Prime Minister Rao provided valuable political cover for his finance minister, he was not inclined to mount a frontal challenge to the party’s centre-left orthodoxy associated with the iconic Indira Gandhi. External integration remained a largely technocratic project: ‘reform by stealth’ as it came to be known. Though weak, this impetus to liberalisation, undertaken unilaterally, lasted till the global financial crisis 20 years later. There was a substantial reduction in average applied industrial tariffs over this period, though agriculture remained highly protected (Krishna, 2019).
Throughout this period, India has preferred to trade under World Trade Organisation (earlier GATT) most-favoured nation rules than to negotiate bilateral or regional agreements. It appreciates the flexibility afforded by the distinction between applied and bound tariffs, as well as the trade remedies (antidumping, safeguards) that are available under WTO rules, of which it is an active user. Since the conclusion of the Uruguay Round in 1993 conducted under the GATT, its successor organisation the WTO has not yet been an effective forum for improving market access through multilateral trade negotiations. This is reflected in the stalemate surrounding the Doha Development Round, launched in 2001, but still frozen twenty years later. More recently other aspects of the WTO’s governance, notably its dispute settlement, appeal and enforcement powers have also come under challenge, especially by the US.
Given its own preference for multilateral negotiations, India was dismayed by Washington’s retreat from committed multilateralism toward preferential agreements (first with Canada in 1988 with Mexico joining
3 Garnaut (2004) has described the attractions of inward-looking policies after the war for the large continental economies of India, China and Australia and the political difficulties of executing a U-turn under the same party in power: the Chinese Communist Party under Deng in 1979; the Hawke-Keating reforms under Labor in Australia through the 1980s; and the Rao reforms under a Congress-led government in 1991. 4 An insider’s view of the run-up to the 1991 reforms (and the fierce intellectual, political and bureaucratic resistance they pro-voked) can be found in Ahluwalia (2020).
EU-India trade relations: assessment and perspectives
7
to form NAFTA in 1994, which was then renegotiated in 2020 as the United States–Mexico–Canada Agree-ment, USMCA). US flirtation with a Free Trade Area of the Americas (FTAA) together with the EU’s eastern enlargement, all undermined India’s faith in the primacy of the multilateral trading order in the 1990s and early 2000s.
While unilateral liberalisation was the main instrument, in the first decade of this century India signed a number of relatively shallow bilateral preferential trade agreements with a range of partners, although some were badged as Comprehensive Economic Partnership Agreements to be consistent with Article XXIV of the GATT.5 It also agreed to participate in negotiations on the ASEAN-centred Regional Compre-hensive Partnership (RCEP) in 2012, but withdrew from the negotiations in 2019 and is not one of the initial signatories to the agreement signed in 2020, although it has an open invitation to re-join the group. The reasons for India’s withdrawal from RCEP are obscure; we provide some possible explanations below, when assessing the implications for future EU-India links.
The 20 years of trade and investment liberalisation post-1991 were by and large good for growth: by size of economy, India is now a consequential, though still poor, middle-rank power. However, India did not succeed in boosting the share of manufacturing in domestic output, a long-standing goal of Indian economic policy. In fact, while agriculture as a share of GDP declined, the services sector boomed. Services value added now accounts for half of India’s GDP, while the share of agriculture value added has declined to 16 %. On the other hand, manufacturing value added has fluctuated between 13 % and 18 % since the 1960s, and currently stands at only 14 %.6 There is no established causal or cross-country relationship be-tween real GDP per capita and the share of manufacturing in value-added, although where manufacturing employment is concerned Rodrik (2016) (among others) has pointed to the pervasive phenomenon of ‘premature deindustrialisation’ across the developing world.
India’s trade reflects this composition of output. While overall balance of payments has remained comfort-able, its structure is closer to that of an advanced country, with a large deficit in manufacturing trade (increasingly concentrated in India’s bilateral trade with China), balanced by surpluses in agriculture and services and substantial inflows of remittances. This sectoral configuration presents significant problems in market access negotiations: India seeks improved access for its services sector but is politically reluctant to liberalise either manufacturing or agriculture, despite strong theoretical and policy arguments for doing so.
In 2014, soon after taking office, Prime Minister Modi launched the ‘Make in India’ initiative to promote manufacturing and manufacturing employment growth. The aspirational goal was to raise the share of manufacturing in GDP to 25 %, but a series of setbacks in domestic credit markets resulted in relatively little progress by the end of Mr Modi’s first term. Equally, during his first term there were increasing signs that the Modi government judged that market-driven global integration had not delivered on either the economic or strategic outcomes that were anticipated.7 These signs included a review (and in some cases re-negotiation) of existing FTAs and (as discussed later) cancellation of the majority of India’s bilateral investment treaties. The steady downward trend in customs duties since 1991 was also reversed.
After the parliamentary victory of May 2019, the new policy posture has been pursued with greater vigour. An important marker was the withdrawal from the RCEP negotiations in November 2019 mentioned above, well before the pandemic’s virulence was evident. The political salience of this decision is evidenced by the fact that the announcement was made by the Prime Minister himself while attending a summit in Bangkok.
5 A complete list of trade agreements, both concluded and under negotiation, is available at Welcome to department of commerce, Government of India 6 Source: World Bank, latest data for year 2019. 7 India’s Minister of External Affairs, Dr. S. Jaishankar provided a strong critique of these policies in a speech delivered one year after Prime Minister Modi announced India’s decision to withdraw from the RCEP negotiations. https://mea.gov.in/Speeches-Statements.htm?dtl/33196.
Policy Department, Directorate-General for External Policies
8
While large sectors of Indian industry were on record as opposing India entering a trade agreement that included China, and the economy was going through a marked slowdown, neither of these seemed sufficient reasons for India to abandon an initiative it had supported for nine years. Both then and more recently, after the agreement was signed and the text released, commentators noted that the agreement provided relatively generous transition periods that were sufficient to allow for Indian industry to adapt; and that Japan and Australia, both key strategic partners with India in the Indo-Pacific had no difficulty in participating. Whatever the compulsions, the current reality is that India has chosen to stay out of a key agreement which at a minimum simplifies rules of origin and therefore facilitates participation in Asian value chains.
The shift inward was formalised in a speech by Mr Modi in May 2020 when the country was dealing with the human and economic costs of the first wave of the pandemic. The ‘Self-Reliant India’ (‘Atmanirbhar Bharat') doctrine articulated by him puts emphasis on improving domestic infrastructure, expanding domestic production capacity and providing stimulus for recovery from COVID-19. The campaign also highlights the need to develop India’s capabilities in sunrise industries – new industries promising strong growth, such as medical devices and drugs, automobiles, capital goods and advanced technologies – through investment and innovation. The policy response has been to move trade and investment policy from market-driven liberalism to a more strategic approach. While this remains a work in progress, the elements of this new approach have gradually become clearer: selective increases in industrial tariffs; liberalisation of foreign direct investment in both goods and services sectors; and the creation of incentives aimed at the ‘reshoring’ of key manufacturing processes through the grant of ‘production-linked incen-tives’ for both domestic and foreign investors.
In sum, a combination of external and domestic forces has prompted India’s quest for self-reliance and a reduction of its re-engagement with the rest of the world (Krishna, 2019). Although COVID-19 has hit the Indian economy, unlike 1991 there is no payments crisis, markets are relatively buoyant and the govern-ment is strong and popular. Even so, the economic, medical and political aspects of the COVID-19 scourge have exposed and reinforced weaknesses in India’s development trajectory. China’s long-term economic success and its current political assertiveness (including mobilisation on India’s Himalayan border) are now shaping both the regional and global economic order, as well as China’s bilateral relationship with India. These developments have occurred at a time of declining global support for multilateral co-operation following the global financial crisis and into the pandemic. Taken together, these developments have prompted India to reconsider its external posture. However, it remains to be seen whether these unortho-dox initiatives can successfully deepen India’s integration into the global economy.
Trade and investment policy are primarily tools to generate productivity growth, but they also have an important political dimension. India’s structural economic imperatives have reinforced geopolitical priorities, particularly where two of India’s important external partners (other than the EU) are concerned. The US is India’s most important market for service exports and a critical partner in India’s buoyant digital economy. This relationship is inter alia reinforced by strong diaspora links between tech communities in India and the US, in turn reflecting US openness to immigrating Indian students and skilled professionals dating back as far as 1965, leading now to Indian-origin Americans being the second-largest migrant com-munity in the US, with growing political visibility, particularly in the Biden administration.
A breakthrough in defence and diplomatic cooperation between India and the US took place during the administration of George W. Bush, who announced a Civil Nuclear Agreement with (by then, prime minister) Manmohan Singh in 2005, allowing India to access dual-use technologies previously forbidden under US law because of India’s unwillingness to sign the Nuclear Non-proliferation Treaty (NPT).
US-India defence ties blossomed further under Prime Minister Modi during the Trump Administration. This trend is continuing under President Biden, with his support of the so-called Quad (the US, Japan, Australia
EU-India trade relations: assessment and perspectives
9
and India) as an informal dialogue framework for common security and economic goals in the Indo-Pacific, recently elevated (virtually) to the head of government level.
Despite this increased proximity between India and the US, there remain significant irritants in the bilateral economic relationship that were not resolved under the Trump Administration and have not yet received much attention from the Biden administration. Notwithstanding increased proximity in the security sphere, India’s deep defence relationship with Russia, the US government’s indulgence of Pakistan and India’s links with Iran, are demonstrations of India’s insistence on strategic autonomy.
Three points from this overview of India-US links are relevant for the EU. First, links between India and the US have a strong foundation which with Britain’s exit will take time for the EU27 to emulate. Second, an increasingly strong security relationship has not yet resulted in a formal basis for the economic relation-ship, which, though robust at the aggregate level, continues to be plagued by difficulties. Third the Indo-US economic relationship is characterised by much more than goods trade and is firmly grounded in leading-edge activities in the digital and venture capital worlds.
The rapid growth of the Chinese economy over the last two decades, situated on India’s doorstep, was initially welcomed by India both as a market and as a source of cheap manufactured products. But shifts in Chinese behaviour over the last decade and the muscular security stance of the Modi government have prompted increasing disquiet in Indian circles about the overall economic relationship with China, similar to the re-examination taking place in the EU. While disengagement is neither feasible nor desired, diversi-fication and indigenisation are both goals of the present government, and the Indian government’s resort to strategic industrial policy is largely directed to ensure such diversification.
Overall, it appears that India is reducing its bets on integration with its East Asian neighbours and investing greater energy in links with Europe and the United States. In its post-COVID-19 recovery, India’s pursuit of strategic trade and industrial policy means it prefers the flexibility offered by bilateral trade agreements over more ambitious regional structures. Its aim will be to make access to the Indian market most attractive for those willing to bring the latest technology, following the playbook of China and, before it, Japan and South Korea. India will also seek to consolidate market access for its export of services to rich countries.
1.2 EU perspectives The EU finds itself at a crossroads with at least two of its three major trading partners. As regards the first, the US, the Biden Administration seems much more willing to maintain – if not improve − relations with Europe, in line with their strategic alliance. Although some doubts remain about what this means in terms of trade and investment relations, the waters are clearly calmer than they were under the Trump Adminis-tration. By contrast, relations with the United Kingdom and more recently with China, are not as calm.
The EU's trade relations with the UK are at their lowest in terms of its institutional support, as a consequence of Brexit. It is still early to determine how much of a shock this might be for EU trade, the UK being the EU’s third-largest trading partner after the US and China. It is also important to note that the UK is aggressively pursuing its own trade policy with a deal with Australia. The UK has also officially applied for membership in the Comprehensive and Progressive Agreement for Trans-Pacific Partnership (CPTTP), the former Trans-Pacific Partnership, pushed by the Obama Administration but rejected by President Trump and now a flagship integration project led by Japan. The UK has also recently engaged in talks on a trade deal with India8, which is surely increasing pressure on the EU side to restart negotiations for a potential trade and/or investment agreement with India.
Finally, the EU’s trade and investment links with China have grown steadily during the last two decades but with potentially significant problems ahead. In fact, China exports into the EU have ballooned since the
8 https://www.bloomberg.com/news/articles/2021-06-02/india-u-k-eye-interim-pact-to-help-clinch-major-trade-deal
Policy Department, Directorate-General for External Policies
10
pandemic started while EU exports into China had remained stagnant. In that context, and even more so than ever, as the EU’s domestic demand has been buttressed by COVID-19, the EU needs to find export markets and profitable destinations for European companies’ foreign direct investment.
After having agreed a number of trade deals in Asia, including with Japan, South Korea, Singapore and Vietnam, it seems clear that the EU still needs a very large market which can offer enough trade opportuni–ties, as intra-EU trade remains stagnant and trade with the UK shrinks because of new trade barriers. Furthermore, China does not seem ready to fully open its market, nor is the EU ready to engage in a trade deal with China. This opens the door to potential negotiations with India, especially since the EU does not seem as keen as the UK to engage in a mega trade deal with ASEAN countries, which could be considered the other bloc. In fact, and in contrast to the UK, the EU has not yet expressed interest in joining the CPTPP as a potential response to the announcement of the Regional Comprehensive Economic Partnership (RCEP) among ASEAN economies, China, Japan and South Korea. The fact that the EU already has bilateral agree-ments with a number of CPTPP members, notably Japan and Vietnam, might be behind the different strategy followed by the EU compared to the UK
As if the size of India’s economy, let alone population and prospects for a massive middle class were not enough, geopolitics is pushing the EU towards India’s camp. The US-led Indo-Pacific, following Japan, is clearly in the EU’s mind. France and more recently, Germany and the Netherlands are also exploring the concept at national level. However, the EU as such has more instruments on the economic than the security front, which means that improving its economic relations with India could be a way to engage with the future largest Indo-Pacific partner. This would be a great addition to the already-signed deal with Japan.
All in all, closer economic relations with India can have a strategic significance for Europe amidst increasing US-China competition. In other words, the EU’s push for diversification fits well with closer relations with India given its similar agenda, particularly given the difficulties each is likely to face in the emerging preferential architecture of trade on the Pacific Rim.
2 The suspended 2007-2013 negotiations The renewed attempt to negotiate an FTA will have to overcome the issues that caused the 2007-2013 negotiations to be suspended. Five contentious areas stand out to us as particularly relevant to the current debate: agriculture, services, digital trade, patent protection, and environment and labour rights (this list largely follows Ciortuz et al, 2013). As we discuss below, while there have been policy changes in some of these areas, the general stances of the EU and India on them remain far apart.
2.1 Agriculture Agriculture was and remains a highly sensitive issue for both the EU and India. Unlike the EU, where the agriculture share of GDP and employment is in the single digits, agriculture accounts for 41 % of Indian employment, while the poverty rate in rural India is at 25 % almost twice that of urban areas.9 Yet despite its marginal role in the European economy, protection of the domestic agricultural industry and opening new markets for it have been important goals of EU trade policy.
Felbermayr et al (2017) found in their simulation that almost all of India’s welfare gains from an EU-India trade agreement due to tariff reductions would come from the agriculture sector, the only one in which the EU still applies substantial tariffs on India (rice in particular). India, on the other hand, is very worried about the impact on its farmers that opening its market to the very competitive and highly subsidised EU agricultural industry could have. During the last attempt to negotiate a trade agreement, the Indian dairy sector in particular was concerned about the impact that cheap imports from the EU could have on their
9 Data from 2016. Source: World Bank, https://www.worldbank.org/en/news/infographic/2016/05/27/india-s-poverty-profile
EU-India trade relations: assessment and perspectives
11
livelihoods. Consequently, India has made only minor concessions over agriculture in other FTAs (Ciortuz et al, 2013).
At the May 2021 Joint Summit, the EU and India launched negotiations on a potential separate agreement on geographical indications (GI). India has granted GIs to 368 products, few compared to the more than 3400 GIs recognised by the EU. The vast majority of India’s GIs are for handicrafts, and India has only recognised 8 EU GIs, which leaves considerable scope for expansion of the list.10 The EU-China GI agree-ment provides an example of what that could look like: through the agreement China committed to protect 100 EU GIs.11
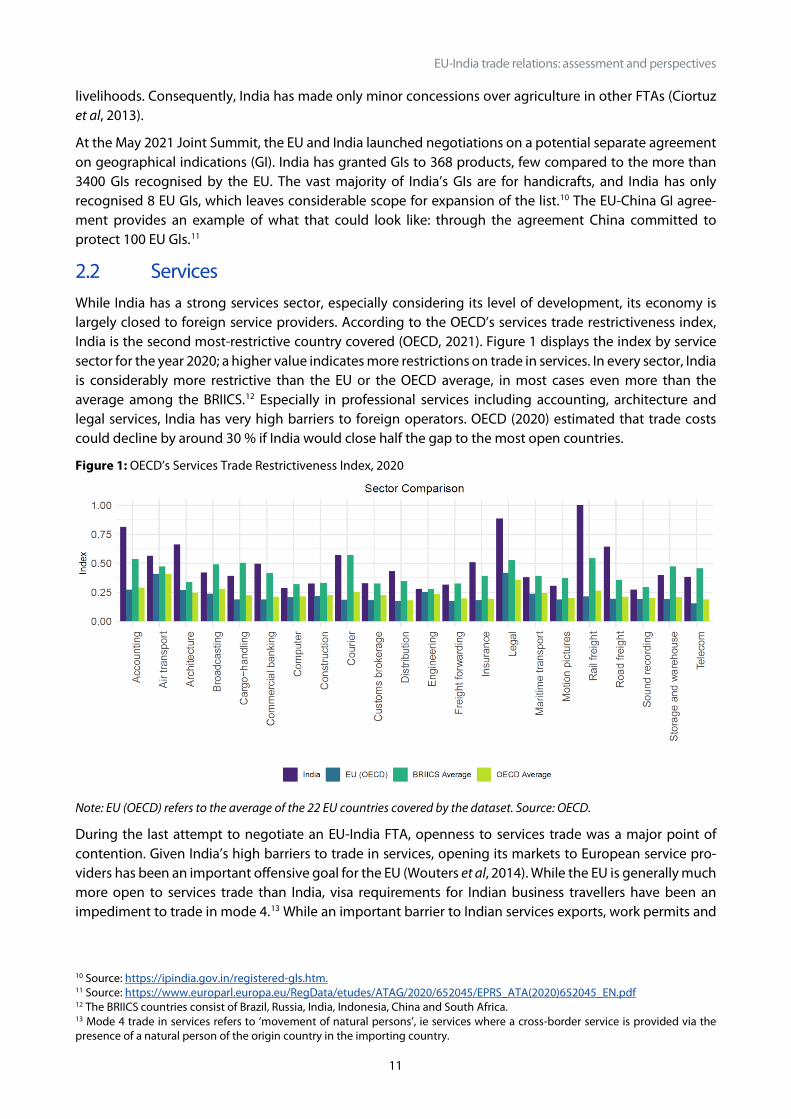
2.2 Services While India has a strong services sector, especially considering its level of development, its economy is largely closed to foreign service providers. According to the OECD’s services trade restrictiveness index, India is the second most-restrictive country covered (OECD, 2021). Figure 1 displays the index by service sector for the year 2020; a higher value indicates more restrictions on trade in services. In every sector, India is considerably more restrictive than the EU or the OECD average, in most cases even more than the average among the BRIICS.12 Especially in professional services including accounting, architecture and legal services, India has very high barriers to foreign operators. OECD (2020) estimated that trade costs could decline by around 30 % if India would close half the gap to the most open countries.
Figure 1: OECD’s Services Trade Restrictiveness Index, 2020
Note: EU (OECD) refers to the average of the 22 EU countries covered by the dataset. Source: OECD.
During the last attempt to negotiate an EU-India FTA, openness to services trade was a major point of contention. Given India’s high barriers to trade in services, opening its markets to European service pro-viders has been an important offensive goal for the EU (Wouters et al, 2014). While the EU is generally much more open to services trade than India, visa requirements for Indian business travellers have been an impediment to trade in mode 4.13 While an important barrier to Indian services exports, work permits and
10 Source: https://ipindia.gov.in/registered-gls.htm. 11 Source: https://www.europarl.europa.eu/RegData/etudes/ATAG/2020/652045/EPRS_ATA(2020)652045_EN.pdf 12 The BRIICS countries consist of Brazil, Russia, India, Indonesia, China and South Africa. 13 Mode 4 trade in services refers to ‘movement of natural persons’, ie services where a cross-border service is provided via the presence of a natural person of the origin country in the importing country.

Policy Department, Directorate-General for External Policies
12
visa rules are member states competencies and a difficult subject for EU trade negotiators. General opposi-tion to immigration and concerns over the potential erosion of labour standards in the EU if Indian workers were allowed more open access, have both contributed to political push-back against more liberal pro-visions (Navarra, 2020).
2.3 Digital trade India’s relative strength in trade in professional services would make for a strong trading partner for the EU. Between 2005 and 2019, India’s services exports tripled, and grew at a rate about a third faster than goods exports. Yet the share of services and especially digitally-deliverable services in manufacturing exports is low compared to other large economies (Görlich and Poitiers, 2020). As generally with trade in digital services, the question of the free flow of data is a major concern. The high bar set for transfers of personal data from the European Union to third countries constitutes a considerable barrier for trade in digital services, but also affects multinational manufacturing companies with subsidiaries abroad. The EU does not deal with flows of personal data in trade negotiations. Instead, countries that have a similar degree of privacy protection to the EU can be recognised through unilateral adequacy decisions, which allow the transfer of personal data from the EU to the respective jurisdiction.
Recently, there have been some important developments in the direction of more stringent privacy rules in India. In 2017, the Indian Supreme Court declared privacy a fundamental right, though the implications of this decision are still unclear.14 In 2019, India introduced privacy legislation partially modelled on the EU General Data Protection Regulation (GDPR; Burman, 2020). It is questionable whether data protection in India will be sufficiently strong and enforceable to clear the high bar set for an EU adequacy decision, which the Indian government reportedly seeks.15 In the Indian framework, the government retains extensive rights of data surveillance (Basu and Sherman, 2020).
General measures of digital trade openness, such as the OECD’s Digital Service Trade Restriction index (STRI), show India as a relatively closed digital economy, on a level comparable with other emerging markets (Ferencz, 2019). As is the case in other fairly restrictive countries, most restrictions are related to ‘Infrastructure and connectivity’ which includes localisation requirements. When comparing regulatory similarity, as done by the OECD Service Trade Restrictiveness Heterogeneity Index, India shows more similarities with the EU than with either the US or China (for a discussion, see Görlich and Poitiers, 2020).
2.4 Patent protection for pharmaceutical goods Patent protection for pharmaceutical products has long been a major issue in EU-India trade relations. India is the leading provider of pharmaceuticals to the developing world. In the area of vaccine production, a sector of unquestionable importance during a pandemic, the EU and India have divided international markets largely between themselves. The EU has a share of 51 % of global trade in vaccines, making it the world’s most important exporter of vaccines, but India accounts for 81 % of vaccine imports by developing countries (Guetta-Jeanrenaud et al, 2021).
India has long advocated that the rules of the Agreement on Trade-Related Aspects of Intellectual Property Rights (TRIPS), with respect to patent protection of medical goods, should be weakened to allow develop-ing countries to produce lifesaving medicines at affordable prices (Wouters et al, 2014). During the COVID-19 pandemic, India has been among the leading proponents of a TRIPS waiver on COVID-19-related medi-cal products. The debate has gained further traction since the US reversed its long-held opposition to TRIPS
14 See https://www.cfr.org/blog/implications-indias-right-privacy-decision. 15 Reported by The Economic Times on 30 June 2019; see https://economictimes.indiatimes.com/tech/internet/govt-to-ping-eu- to-align-its-data-law-with-gdpr/articleshow/70442538.cms
EU-India trade relations: assessment and perspectives
13
patent waivers, and signalled its willingness to agree to a narrow provision. This makes the EU, which argues that such a waiver would not contribute to an increase in vaccine supplies over the medium term, the last major economy that opposes this policy at the time of writing (though the European Parliament endorsed a resolution in favour of a TRIPS waiver16).
2.5 Environment and labour rights Advancing non-trade policy objectives is a core part of the European Union’s foreign policy. The review of the EU trade strategy puts further emphasis on non-trade policy objectives in the EU, and recent trade agreements have been halted over such concerns. The ratification of the Mercosur agreement has been stalled because of environmental concerns, and the provisions on International Labour Organisation con-ventions in the EU-China Comprehensive Agreement on Investment (CAI) have proved highly contro-versial.
In the area of environment and labour rights, major issues from 2013 still remain unresolved. While India has ratified two ILO conventions on child labour that were a concern during the last round of negotiations, India has not ratified the fundamental conventions C087 and C098, which concern freedom of association and collective bargaining. India is a signatory of the Paris climate accord, and is one of only a few countries considered by Climate Action Tracker to be on a pathway to limiting global warming to 2ºC.17 Accounting for 17 % of the world population, India is responsible for 7 % of global greenhouse gas emissions (com-pared to 9 % for the EU). Coal plays a major role in India’s electricity generation, causing substantial harm to both the environment and the health of India’s people. However, new renewable electricity generation is already cost competitive in India (Spencer et al, 2018). European efforts to establish a carbon border adjustment mechanism (CBAM) are viewed very critically in India, which according to KAS (2021) ‘perceives the EU CBAM strongly as protectionist, discriminatory towards developing countries, and contrary to inter-national laws and agreements’.
3 Where do EU-India trade relations stand? While substantial obstacles remain to an FTA, the markets that would be linked in such an agreement would be huge. Measured by market exchange rates India is the fifth largest economy in the world with a GDP of USD 2.8 trillion in 2019, comparable in size to the largest EU member states or the UK and is a potentially large market encompassing a population over 1.3 billion. Its sheer size, but even more its unrealised growth potential (given demographics and comparatively weak current trade engagement, are what make it systemically and strategically relevant to the global economy. In this section, we provide a descriptive analysis of the EU’s economic relations with India by studying the evolution of bilateral trade flows, their composition and tariff levels.
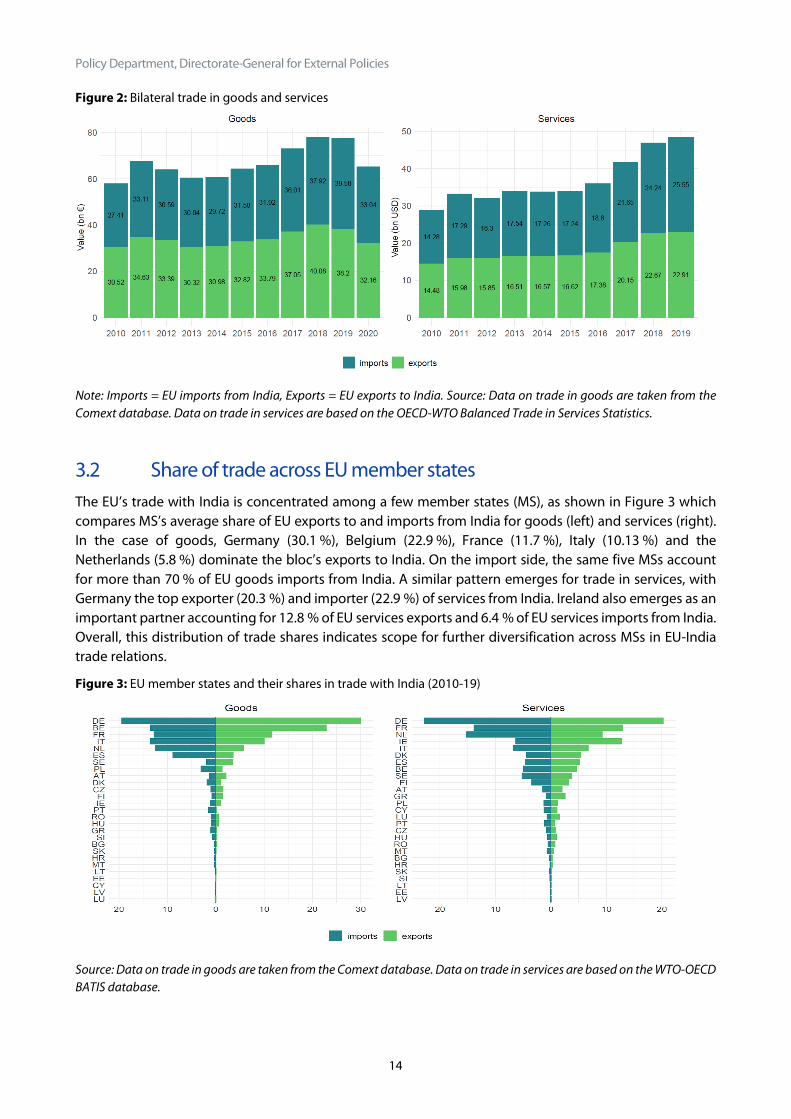
3.1 Aggregate bilateral trade in goods and services The EU’s18 trade in goods and services with India has grown considerably over the last decade (see Fig-ure 2). In 2019, the EU exported EUR 55 billions worth of goods and services to India, and imported EUR 59 billion. Growth in services trade has been particularly promising, with EU-India trade flows almost doubling over the past decade from USD 28.76 billion in 2010 to USD 48.45 billion in 2019. Moreover, EU-India trade is relatively symmetric and trade imbalances limited with the EU posting a EUR 1.4 billion deficit in goods trade with India in 2019. In comparison, the bloc’s trade deficit with China amounted to EUR 164.7 billion in 2019 and grew to EUR 180.8 billion in 2020. Based on this pattern of aggregate trade flows, we note that the structure of EU’s trading relationship with India is very different from the one with China.
16 Source: https://www.europarl.europa.eu/doceo/document/TA-9-2021-0283_EN.html 17 Source: https://climateactiontracker.org. 18 Unless stated otherwise, the EU refers to EU27.
Policy Department, Directorate-General for External Policies
14
Figure 2: Bilateral trade in goods and services
Note: Imports = EU imports from India, Exports = EU exports to India. Source: Data on trade in goods are taken from the Comext database. Data on trade in services are based on the OECD-WTO Balanced Trade in Services Statistics.
3.2 Share of trade across EU member states The EU’s trade with India is concentrated among a few member states (MS), as shown in Figure 3 which compares MS’s average share of EU exports to and imports from India for goods (left) and services (right). In the case of goods, Germany (30.1 %), Belgium (22.9 %), France (11.7 %), Italy (10.13 %) and the Netherlands (5.8 %) dominate the bloc’s exports to India. On the import side, the same five MSs account for more than 70 % of EU goods imports from India. A similar pattern emerges for trade in services, with Germany the top exporter (20.3 %) and importer (22.9 %) of services from India. Ireland also emerges as an important partner accounting for 12.8 % of EU services exports and 6.4 % of EU services imports from India. Overall, this distribution of trade shares indicates scope for further diversification across MSs in EU-India trade relations.
Figure 3: EU member states and their shares in trade with India (2010-19)
Source: Data on trade in goods are taken from the Comext database. Data on trade in services are based on the WTO-OECD BATIS database.
EU-India trade relations: assessment and perspectives
15
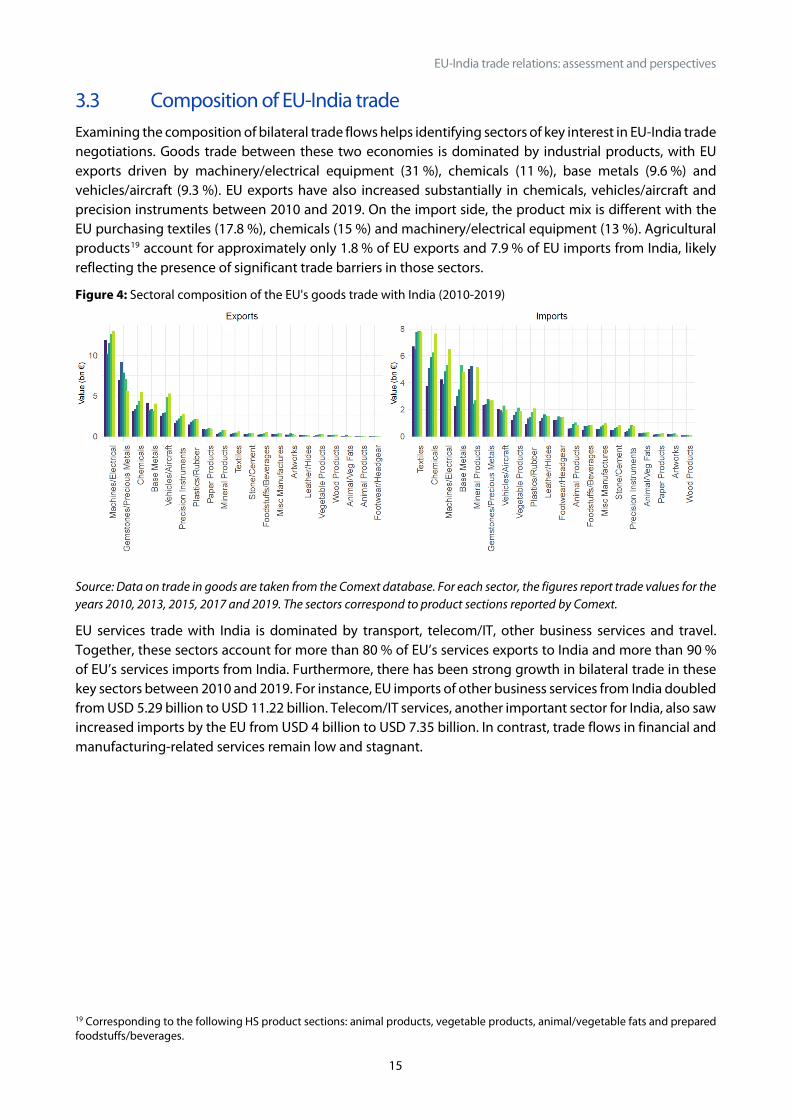
3.3 Composition of EU-India trade Examining the composition of bilateral trade flows helps identifying sectors of key interest in EU-India trade negotiations. Goods trade between these two economies is dominated by industrial products, with EU exports driven by machinery/electrical equipment (31 %), chemicals (11 %), base metals (9.6 %) and vehicles/aircraft (9.3 %). EU exports have also increased substantially in chemicals, vehicles/aircraft and precision instruments between 2010 and 2019. On the import side, the product mix is different with the EU purchasing textiles (17.8 %), chemicals (15 %) and machinery/electrical equipment (13 %). Agricultural products19 account for approximately only 1.8 % of EU exports and 7.9 % of EU imports from India, likely reflecting the presence of significant trade barriers in those sectors.
Figure 4: Sectoral composition of the EU's goods trade with India (2010-2019)
Source: Data on trade in goods are taken from the Comext database. For each sector, the figures report trade values for the years 2010, 2013, 2015, 2017 and 2019. The sectors correspond to product sections reported by Comext.
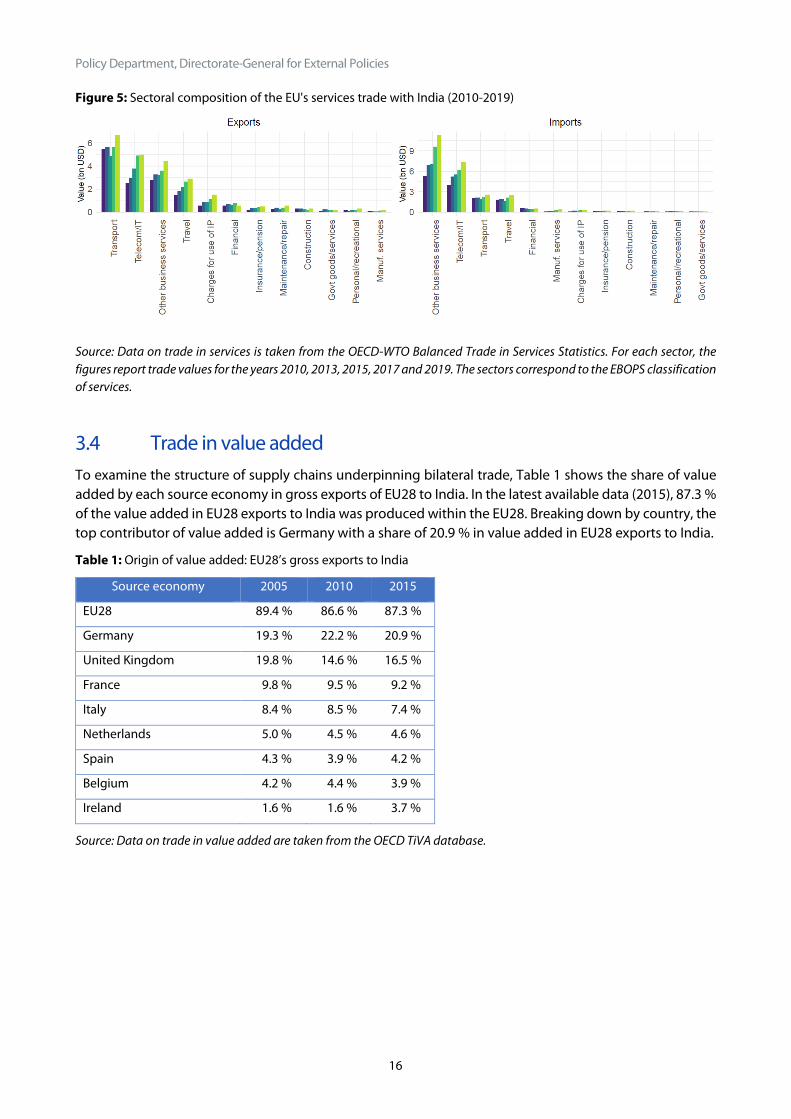
EU services trade with India is dominated by transport, telecom/IT, other business services and travel. Together, these sectors account for more than 80 % of EU’s services exports to India and more than 90 % of EU’s services imports from India. Furthermore, there has been strong growth in bilateral trade in these key sectors between 2010 and 2019. For instance, EU imports of other business services from India doubled from USD 5.29 billion to USD 11.22 billion. Telecom/IT services, another important sector for India, also saw increased imports by the EU from USD 4 billion to USD 7.35 billion. In contrast, trade flows in financial and manufacturing-related services remain low and stagnant.
19 Corresponding to the following HS product sections: animal products, vegetable products, animal/vegetable fats and prepared foodstuffs/beverages.
Policy Department, Directorate-General for External Policies
16
Figure 5: Sectoral composition of the EU's services trade with India (2010-2019)
Source: Data on trade in services is taken from the OECD-WTO Balanced Trade in Services Statistics. For each sector, the figures report trade values for the years 2010, 2013, 2015, 2017 and 2019. The sectors correspond to the EBOPS classification of services.
3.4 Trade in value added To examine the structure of supply chains underpinning bilateral trade, Table 1 shows the share of value added by each source economy in gross exports of EU28 to India. In the latest available data (2015), 87.3 % of the value added in EU28 exports to India was produced within the EU28. Breaking down by country, the top contributor of value added is Germany with a share of 20.9 % in value added in EU28 exports to India.
Table 1: Origin of value added: EU28’s gross exports to India
Source economy 2005 2010 2015
EU28 89.4 % 86.6 % 87.3 %
Germany 19.3 % 22.2 % 20.9 %
United Kingdom 19.8 % 14.6 % 16.5 %
France 9.8 % 9.5 % 9.2 %
Italy 8.4 % 8.5 % 7.4 %
Netherlands 5.0 % 4.5 % 4.6 %
Spain 4.3 % 3.9 % 4.2 %
Belgium 4.2 % 4.4 % 3.9 %
Ireland 1.6 % 1.6 % 3.7 %
Source: Data on trade in value added are taken from the OECD TiVA database.
EU-India trade relations: assessment and perspectives
17
How relevant is Indian manufacturing to the EU28? Table 2 compares the shares of countries in the value added by the manufacturing sector to EU28 gross ex-ports to the world for 2015. 90 % of the value added by the manufacturing sector in EU28’s gross exports is produced within the bloc itself. German manufacturing is crucial, as it accounts for nearly 30 % of the value added by manufacturing to EU28 gross exports. In comparison, India’s share is 0.3 %, significantly lower than China’s manufacturing sector which contributed 2.2 %. Based on these statistics, Indian manufacturing does not appear to be deeply integrated in the EU28’s supply chains.
Table 2: Shares of manufacturing value added in EU28 gross exports in 2015
Source economy
Share
EU28 91.2 %
Germany 29.9 %
Italy 9.8 %
France 9.2 %
UK 8.9 %
Ireland 5.9 %
Spain 4.6 %
China 2.2 %
Source: trade in value added: OECD TiVA database.
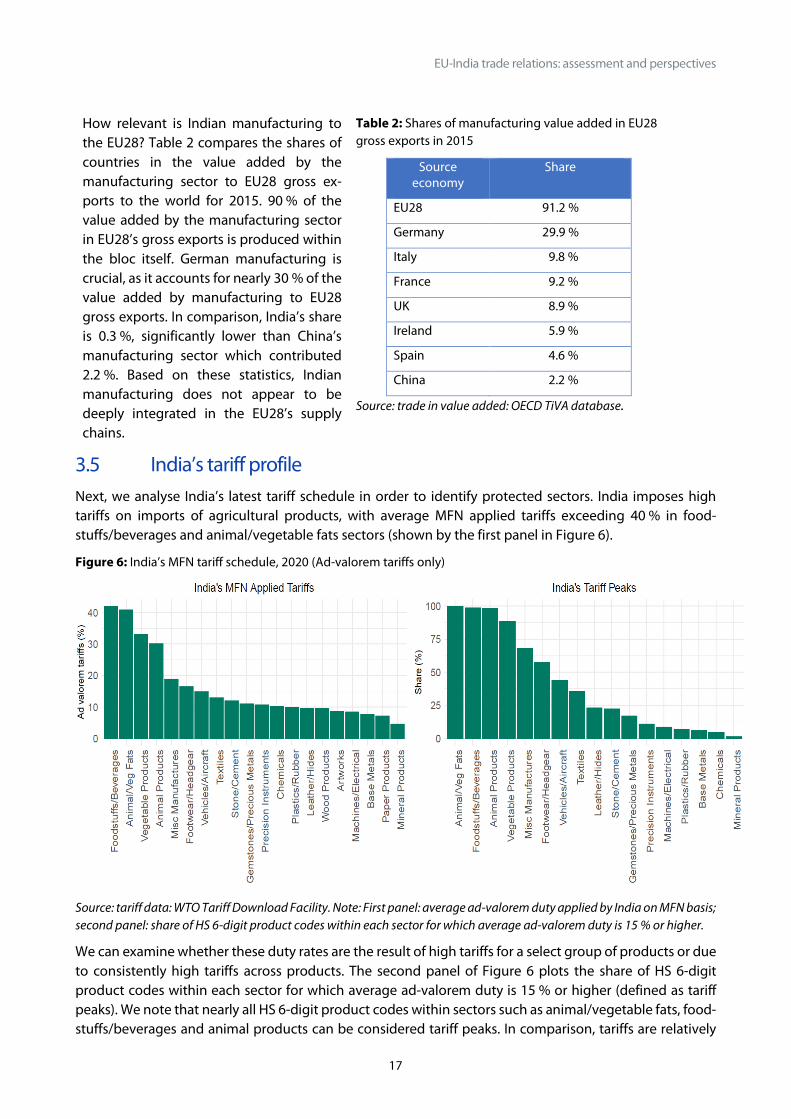
3.5 India’s tariff profile Next, we analyse India’s latest tariff schedule in order to identify protected sectors. India imposes high tariffs on imports of agricultural products, with average MFN applied tariffs exceeding 40 % in food-stuffs/beverages and animal/vegetable fats sectors (shown by the first panel in Figure 6).
Figure 6: India’s MFN tariff schedule, 2020 (Ad-valorem tariffs only)
Source: tariff data: WTO Tariff Download Facility. Note: First panel: average ad-valorem duty applied by India on MFN basis; second panel: share of HS 6-digit product codes within each sector for which average ad-valorem duty is 15 % or higher.
We can examine whether these duty rates are the result of high tariffs for a select group of products or due to consistently high tariffs across products. The second panel of Figure 6 plots the share of HS 6-digit product codes within each sector for which average ad-valorem duty is 15 % or higher (defined as tariff peaks). We note that nearly all HS 6-digit product codes within sectors such as animal/vegetable fats, food-stuffs/beverages and animal products can be considered tariff peaks. In comparison, tariffs are relatively
Policy Department, Directorate-General for External Policies
18
lower for sectors that dominate EU’s exports to India such as machinery/electrical equipment (8.5 %), gemstones/precious metals (11 %), chemicals (10.3 %) and vehicles/transport equipment (14.8 %). In these sectors, the share of tariff peaks is also lower, e.g. machinery/electrical equipment (8.6 %) and chemicals (4.8 %).
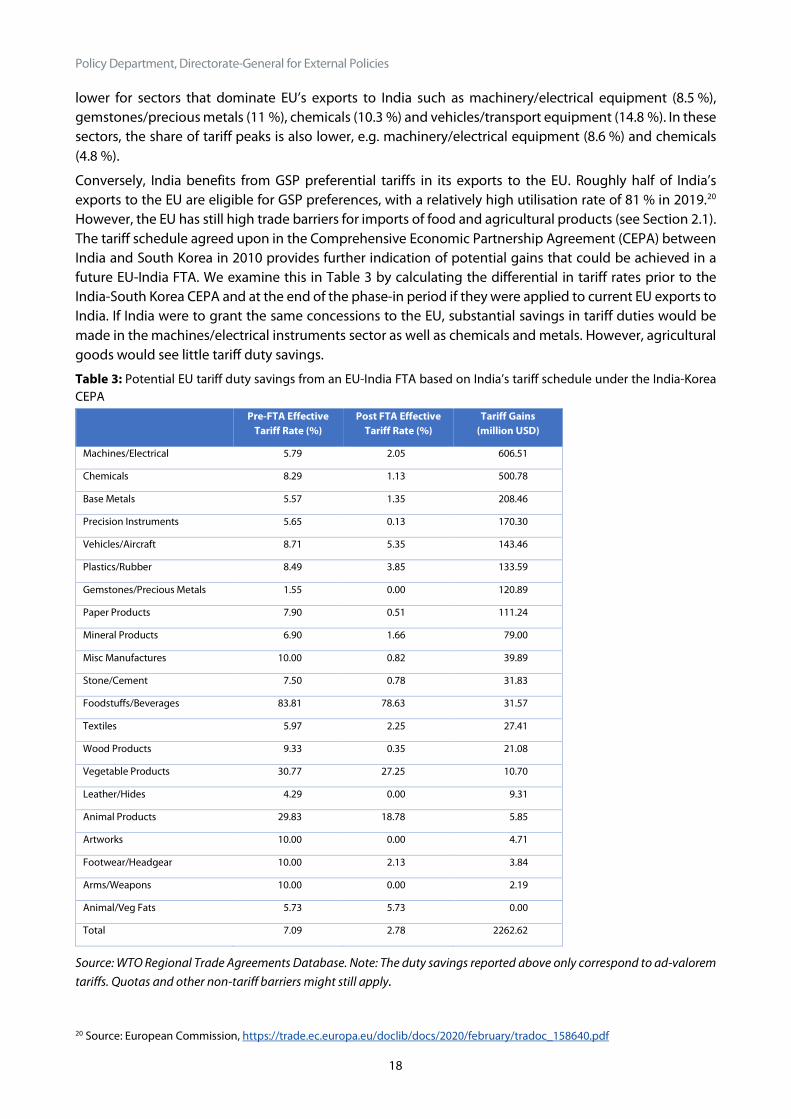
Conversely, India benefits from GSP preferential tariffs in its exports to the EU. Roughly half of India’s exports to the EU are eligible for GSP preferences, with a relatively high utilisation rate of 81 % in 2019.20 However, the EU has still high trade barriers for imports of food and agricultural products (see Section 2.1). The tariff schedule agreed upon in the Comprehensive Economic Partnership Agreement (CEPA) between India and South Korea in 2010 provides further indication of potential gains that could be achieved in a future EU-India FTA. We examine this in Table 3 by calculating the differential in tariff rates prior to the India-South Korea CEPA and at the end of the phase-in period if they were applied to current EU exports to India. If India were to grant the same concessions to the EU, substantial savings in tariff duties would be made in the machines/electrical instruments sector as well as chemicals and metals. However, agricultural goods would see little tariff duty savings.
Table 3: Potential EU tariff duty savings from an EU-India FTA based on India’s tariff schedule under the India-Korea CEPA
Pre-FTA Effective Tariff Rate (%)
Post FTA Effective Tariff Rate (%)
Tariff Gains (million USD)
Machines/Electrical 5.79 2.05 606.51
Chemicals 8.29 1.13 500.78
Base Metals 5.57 1.35 208.46
Precision Instruments 5.65 0.13 170.30
Vehicles/Aircraft 8.71 5.35 143.46
Plastics/Rubber 8.49 3.85 133.59
Gemstones/Precious Metals 1.55 0.00 120.89
Paper Products 7.90 0.51 111.24
Mineral Products 6.90 1.66 79.00
Misc Manufactures 10.00 0.82 39.89
Stone/Cement 7.50 0.78 31.83
Foodstuffs/Beverages 83.81 78.63 31.57
Textiles 5.97 2.25 27.41
Wood Products 9.33 0.35 21.08
Vegetable Products 30.77 27.25 10.70
Leather/Hides 4.29 0.00 9.31
Animal Products 29.83 18.78 5.85
Artworks 10.00 0.00 4.71
Footwear/Headgear 10.00 2.13 3.84
Arms/Weapons 10.00 0.00 2.19
Animal/Veg Fats 5.73 5.73 0.00
Total 7.09 2.78 2262.62
Source: WTO Regional Trade Agreements Database. Note: The duty savings reported above only correspond to ad-valorem tariffs. Quotas and other non-tariff barriers might still apply.
20 Source: European Commission, https://trade.ec.europa.eu/doclib/docs/2020/february/tradoc_158640.pdf
EU-India trade relations: assessment and perspectives
19
4 Bilateral investment Next, we turn to the EU-India investment relationship by first examining bilateral investment positions before discussing the evolution of India’s investment policy.
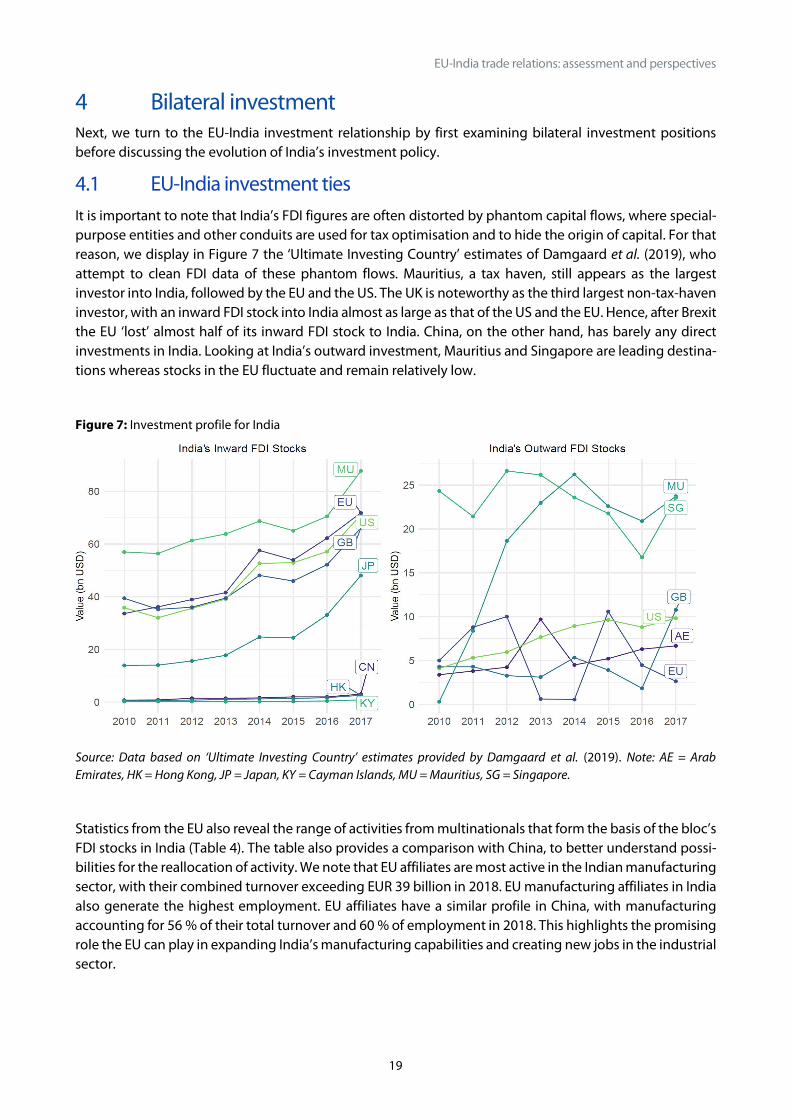
4.1 EU-India investment ties It is important to note that India’s FDI figures are often distorted by phantom capital flows, where special-purpose entities and other conduits are used for tax optimisation and to hide the origin of capital. For that reason, we display in Figure 7 the ‘Ultimate Investing Country’ estimates of Damgaard et al. (2019), who attempt to clean FDI data of these phantom flows. Mauritius, a tax haven, still appears as the largest investor into India, followed by the EU and the US. The UK is noteworthy as the third largest non-tax-haven investor, with an inward FDI stock into India almost as large as that of the US and the EU. Hence, after Brexit the EU ‘lost’ almost half of its inward FDI stock to India. China, on the other hand, has barely any direct investments in India. Looking at India’s outward investment, Mauritius and Singapore are leading destina-tions whereas stocks in the EU fluctuate and remain relatively low.
Figure 7: Investment profile for India
Source: Data based on ‘Ultimate Investing Country’ estimates provided by Damgaard et al. (2019). Note: AE = Arab Emirates, HK = Hong Kong, JP = Japan, KY = Cayman Islands, MU = Mauritius, SG = Singapore.
Statistics from the EU also reveal the range of activities from multinationals that form the basis of the bloc’s FDI stocks in India (Table 4). The table also provides a comparison with China, to better understand possi-bilities for the reallocation of activity. We note that EU affiliates are most active in the Indian manufacturing sector, with their combined turnover exceeding EUR 39 billion in 2018. EU manufacturing affiliates in India also generate the highest employment. EU affiliates have a similar profile in China, with manufacturing accounting for 56 % of their total turnover and 60 % of employment in 2018. This highlights the promising role the EU can play in expanding India’s manufacturing capabilities and creating new jobs in the industrial sector.
Policy Department, Directorate-General for External Policies
20
Table 4: Activities of EU affiliates based in China and India, 2018
China India China India
Turnover Employees
Manufacturing 201 887 39 559 934 701 318 741
Wholesale and retail trade; repair of motor vehicles and motorcycles 124 848 8 225 367 451 45 647
Financial and insurance activities 8 529 2 006 18 183 30 933
Transportation and storage 8 108 3 225 33 253 43 073
Professional, scientific and technical activities 5 448 2 286 58 422 232 156
Information and communication 4 238 6 280 37 943 240 333
Mining and quarrying 1 151 373 4 253 2 781
Water supply; sewerage, waste management and remediation activities 1 857 : 4 867 :
Construction : 392 : 7 709
Accommodation and food service activities 401 350 15 812 53 578
Real estate activities 393 : 2 717 :
Administrative and support service activities : 908 63 057 125 373
Source: EU Outward foreign affiliates statistics, 2018. Sectors based on the NACE classification. China does not include Hong Kong.
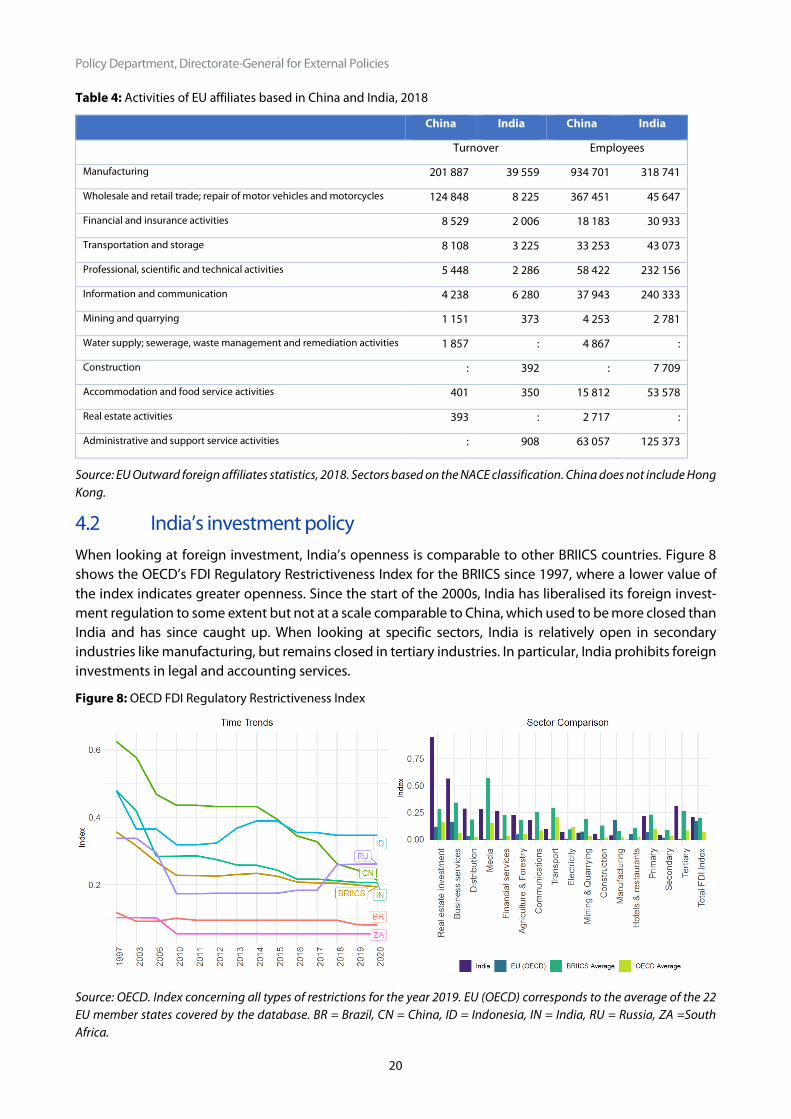
4.2 India’s investment policy When looking at foreign investment, India’s openness is comparable to other BRIICS countries. Figure 8 shows the OECD’s FDI Regulatory Restrictiveness Index for the BRIICS since 1997, where a lower value of the index indicates greater openness. Since the start of the 2000s, India has liberalised its foreign invest-ment regulation to some extent but not at a scale comparable to China, which used to be more closed than India and has since caught up. When looking at specific sectors, India is relatively open in secondary industries like manufacturing, but remains closed in tertiary industries. In particular, India prohibits foreign investments in legal and accounting services.
Figure 8: OECD FDI Regulatory Restrictiveness Index
Source: OECD. Index concerning all types of restrictions for the year 2019. EU (OECD) corresponds to the average of the 22 EU member states covered by the database. BR = Brazil, CN = China, ID = Indonesia, IN = India, RU = Russia, ZA =South Africa.
EU-India trade relations: assessment and perspectives
21
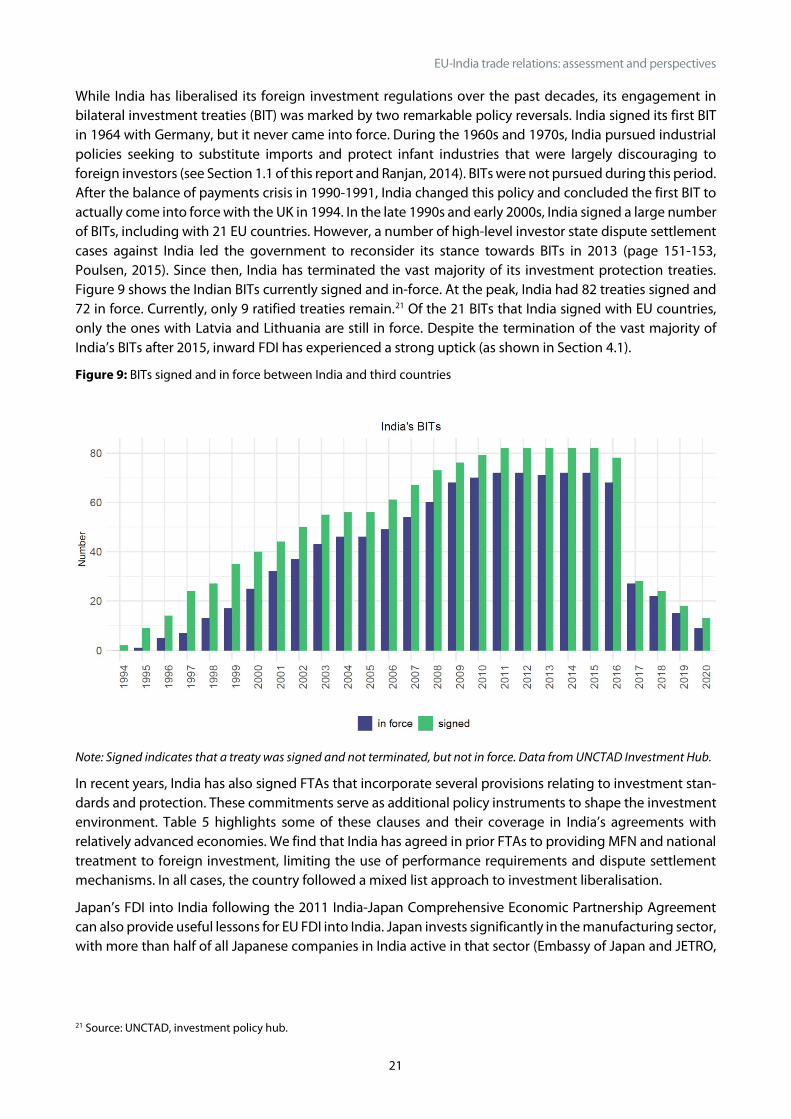
While India has liberalised its foreign investment regulations over the past decades, its engagement in bilateral investment treaties (BIT) was marked by two remarkable policy reversals. India signed its first BIT in 1964 with Germany, but it never came into force. During the 1960s and 1970s, India pursued industrial policies seeking to substitute imports and protect infant industries that were largely discouraging to foreign investors (see Section 1.1 of this report and Ranjan, 2014). BITs were not pursued during this period. After the balance of payments crisis in 1990-1991, India changed this policy and concluded the first BIT to actually come into force with the UK in 1994. In the late 1990s and early 2000s, India signed a large number of BITs, including with 21 EU countries. However, a number of high-level investor state dispute settlement cases against India led the government to reconsider its stance towards BITs in 2013 (page 151-153, Poulsen, 2015). Since then, India has terminated the vast majority of its investment protection treaties. Figure 9 shows the Indian BITs currently signed and in-force. At the peak, India had 82 treaties signed and 72 in force. Currently, only 9 ratified treaties remain.21 Of the 21 BITs that India signed with EU countries, only the ones with Latvia and Lithuania are still in force. Despite the termination of the vast majority of India’s BITs after 2015, inward FDI has experienced a strong uptick (as shown in Section 4.1).
Figure 9: BITs signed and in force between India and third countries
Note: Signed indicates that a treaty was signed and not terminated, but not in force. Data from UNCTAD Investment Hub.
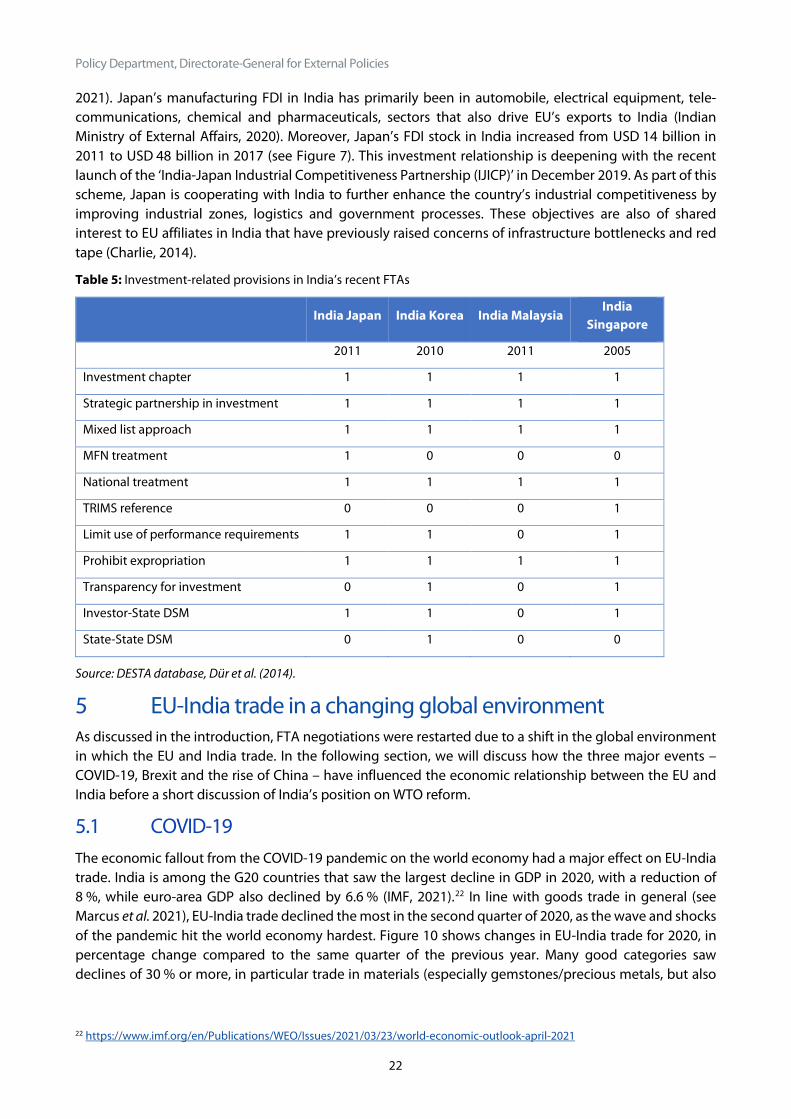
In recent years, India has also signed FTAs that incorporate several provisions relating to investment stan-dards and protection. These commitments serve as additional policy instruments to shape the investment environment. Table 5 highlights some of these clauses and their coverage in India’s agreements with relatively advanced economies. We find that India has agreed in prior FTAs to providing MFN and national treatment to foreign investment, limiting the use of performance requirements and dispute settlement mechanisms. In all cases, the country followed a mixed list approach to investment liberalisation.
Japan’s FDI into India following the 2011 India-Japan Comprehensive Economic Partnership Agreement can also provide useful lessons for EU FDI into India. Japan invests significantly in the manufacturing sector, with more than half of all Japanese companies in India active in that sector (Embassy of Japan and JETRO,
21 Source: UNCTAD, investment policy hub.
Policy Department, Directorate-General for External Policies
22
2021). Japan’s manufacturing FDI in India has primarily been in automobile, electrical equipment, tele-communications, chemical and pharmaceuticals, sectors that also drive EU’s exports to India (Indian Ministry of External Affairs, 2020). Moreover, Japan’s FDI stock in India increased from USD 14 billion in 2011 to USD 48 billion in 2017 (see Figure 7). This investment relationship is deepening with the recent launch of the ‘India-Japan Industrial Competitiveness Partnership (IJICP)’ in December 2019. As part of this scheme, Japan is cooperating with India to further enhance the country’s industrial competitiveness by improving industrial zones, logistics and government processes. These objectives are also of shared interest to EU affiliates in India that have previously raised concerns of infrastructure bottlenecks and red tape (Charlie, 2014).
Table 5: Investment-related provisions in India’s recent FTAs
India Japan India Korea India Malaysia India
Singapore
2011 2010 2011 2005
Investment chapter 1 1 1 1
Strategic partnership in investment 1 1 1 1
Mixed list approach 1 1 1 1
MFN treatment 1 0 0 0
National treatment 1 1 1 1
TRIMS reference 0 0 0 1
Limit use of performance requirements 1 1 0 1
Prohibit expropriation 1 1 1 1
Transparency for investment 0 1 0 1
Investor-State DSM 1 1 0 1
State-State DSM 0 1 0 0
Source: DESTA database, Dür et al. (2014).
5 EU-India trade in a changing global environment As discussed in the introduction, FTA negotiations were restarted due to a shift in the global environment in which the EU and India trade. In the following section, we will discuss how the three major events – COVID-19, Brexit and the rise of China – have influenced the economic relationship between the EU and India before a short discussion of India’s position on WTO reform.
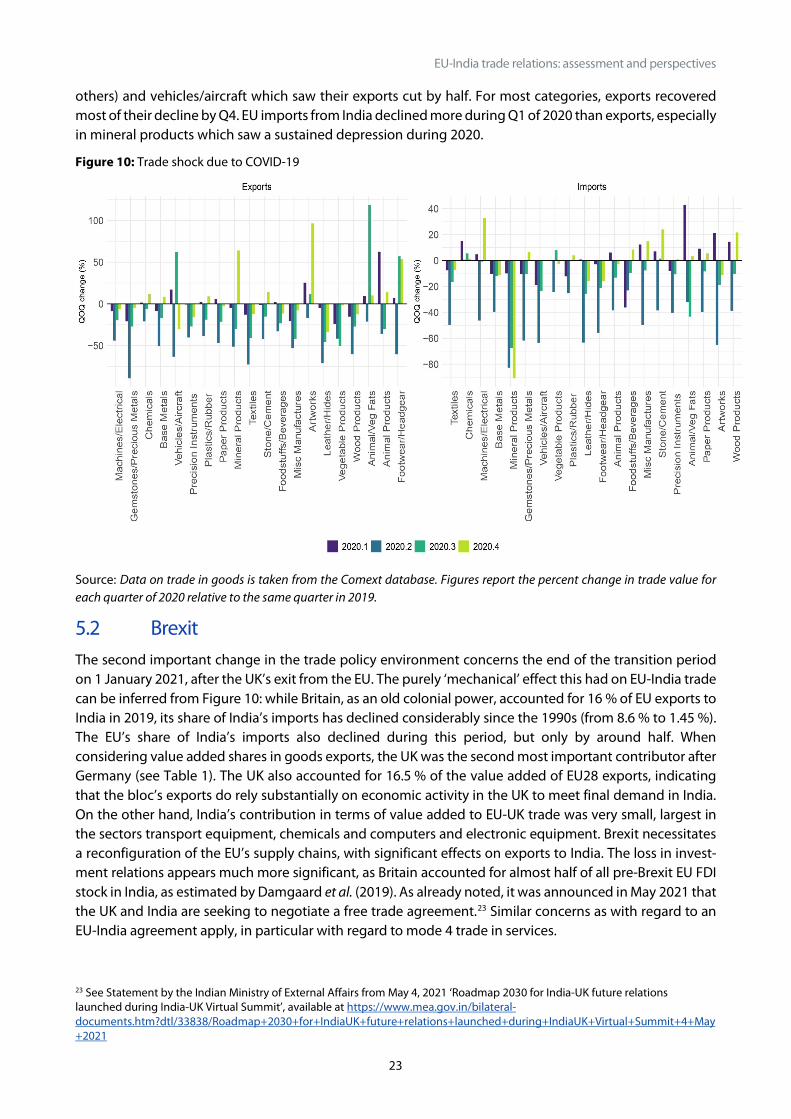
5.1 COVID-19 The economic fallout from the COVID-19 pandemic on the world economy had a major effect on EU-India trade. India is among the G20 countries that saw the largest decline in GDP in 2020, with a reduction of 8 %, while euro-area GDP also declined by 6.6 % (IMF, 2021).22 In line with goods trade in general (see Marcus et al. 2021), EU-India trade declined the most in the second quarter of 2020, as the wave and shocks of the pandemic hit the world economy hardest. Figure 10 shows changes in EU-India trade for 2020, in percentage change compared to the same quarter of the previous year. Many good categories saw declines of 30 % or more, in particular trade in materials (especially gemstones/precious metals, but also
22 https://www.imf.org/en/Publications/WEO/Issues/2021/03/23/world-economic-outlook-april-2021
EU-India trade relations: assessment and perspectives
23
others) and vehicles/aircraft which saw their exports cut by half. For most categories, exports recovered most of their decline by Q4. EU imports from India declined more during Q1 of 2020 than exports, especially in mineral products which saw a sustained depression during 2020.
Figure 10: Trade shock due to COVID-19
Source: Data on trade in goods is taken from the Comext database. Figures report the percent change in trade value for each quarter of 2020 relative to the same quarter in 2019.
5.2 Brexit The second important change in the trade policy environment concerns the end of the transition period on 1 January 2021, after the UK’s exit from the EU. The purely ‘mechanical’ effect this had on EU-India trade can be inferred from Figure 10: while Britain, as an old colonial power, accounted for 16 % of EU exports to India in 2019, its share of India’s imports has declined considerably since the 1990s (from 8.6 % to 1.45 %). The EU’s share of India’s imports also declined during this period, but only by around half. When considering value added shares in goods exports, the UK was the second most important contributor after Germany (see Table 1). The UK also accounted for 16.5 % of the value added of EU28 exports, indicating that the bloc’s exports do rely substantially on economic activity in the UK to meet final demand in India. On the other hand, India’s contribution in terms of value added to EU-UK trade was very small, largest in the sectors transport equipment, chemicals and computers and electronic equipment. Brexit necessitates a reconfiguration of the EU’s supply chains, with significant effects on exports to India. The loss in invest-ment relations appears much more significant, as Britain accounted for almost half of all pre-Brexit EU FDI stock in India, as estimated by Damgaard et al. (2019). As already noted, it was announced in May 2021 that the UK and India are seeking to negotiate a free trade agreement.23 Similar concerns as with regard to an EU-India agreement apply, in particular with regard to mode 4 trade in services.
23 See Statement by the Indian Ministry of External Affairs from May 4, 2021 ‘Roadmap 2030 for India-UK future relations launched during India-UK Virtual Summit’, available at https://www.mea.gov.in/bilateral-documents.htm?dtl/33838/Roadmap+2030+for+IndiaUK+future+relations+launched+during+IndiaUK+Virtual+Summit+4+May+2021
Policy Department, Directorate-General for External Policies
24
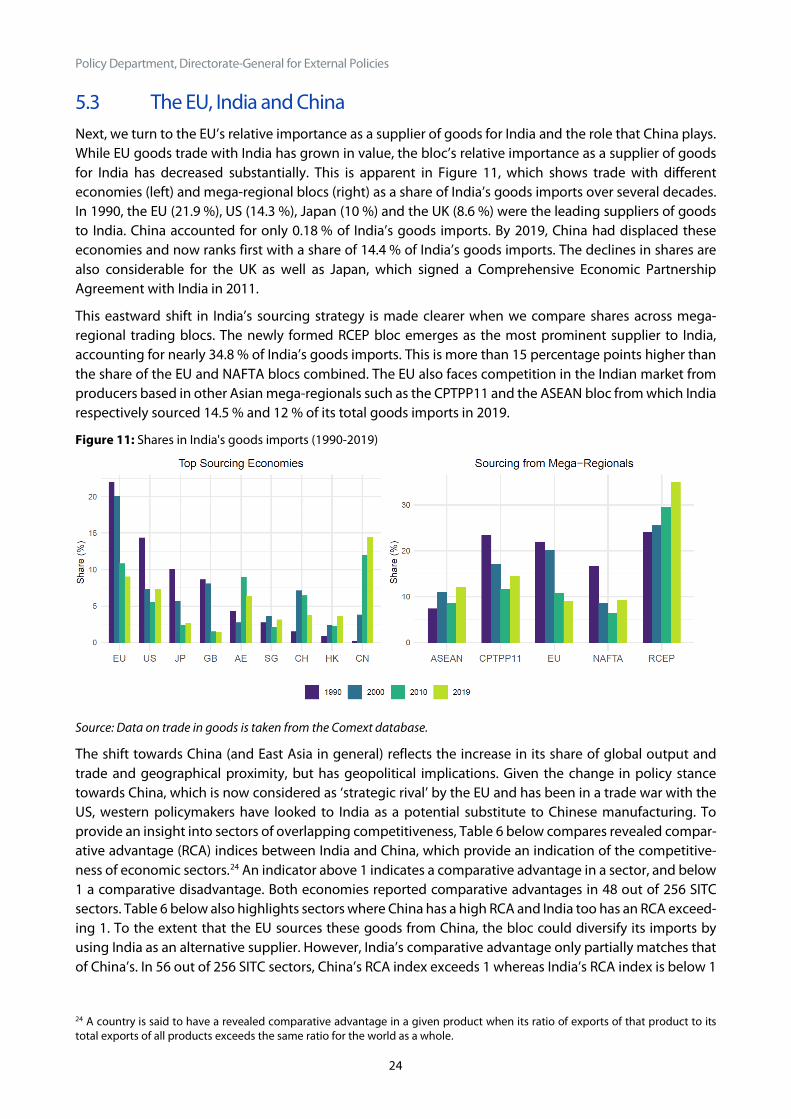
5.3 The EU, India and China Next, we turn to the EU’s relative importance as a supplier of goods for India and the role that China plays. While EU goods trade with India has grown in value, the bloc’s relative importance as a supplier of goods for India has decreased substantially. This is apparent in Figure 11, which shows trade with different economies (left) and mega-regional blocs (right) as a share of India’s goods imports over several decades. In 1990, the EU (21.9 %), US (14.3 %), Japan (10 %) and the UK (8.6 %) were the leading suppliers of goods to India. China accounted for only 0.18 % of India’s goods imports. By 2019, China had displaced these economies and now ranks first with a share of 14.4 % of India’s goods imports. The declines in shares are also considerable for the UK as well as Japan, which signed a Comprehensive Economic Partnership Agreement with India in 2011.
This eastward shift in India’s sourcing strategy is made clearer when we compare shares across mega-regional trading blocs. The newly formed RCEP bloc emerges as the most prominent supplier to India, accounting for nearly 34.8 % of India’s goods imports. This is more than 15 percentage points higher than the share of the EU and NAFTA blocs combined. The EU also faces competition in the Indian market from producers based in other Asian mega-regionals such as the CPTPP11 and the ASEAN bloc from which India respectively sourced 14.5 % and 12 % of its total goods imports in 2019.
Figure 11: Shares in India's goods imports (1990-2019)
Source: Data on trade in goods is taken from the Comext database.
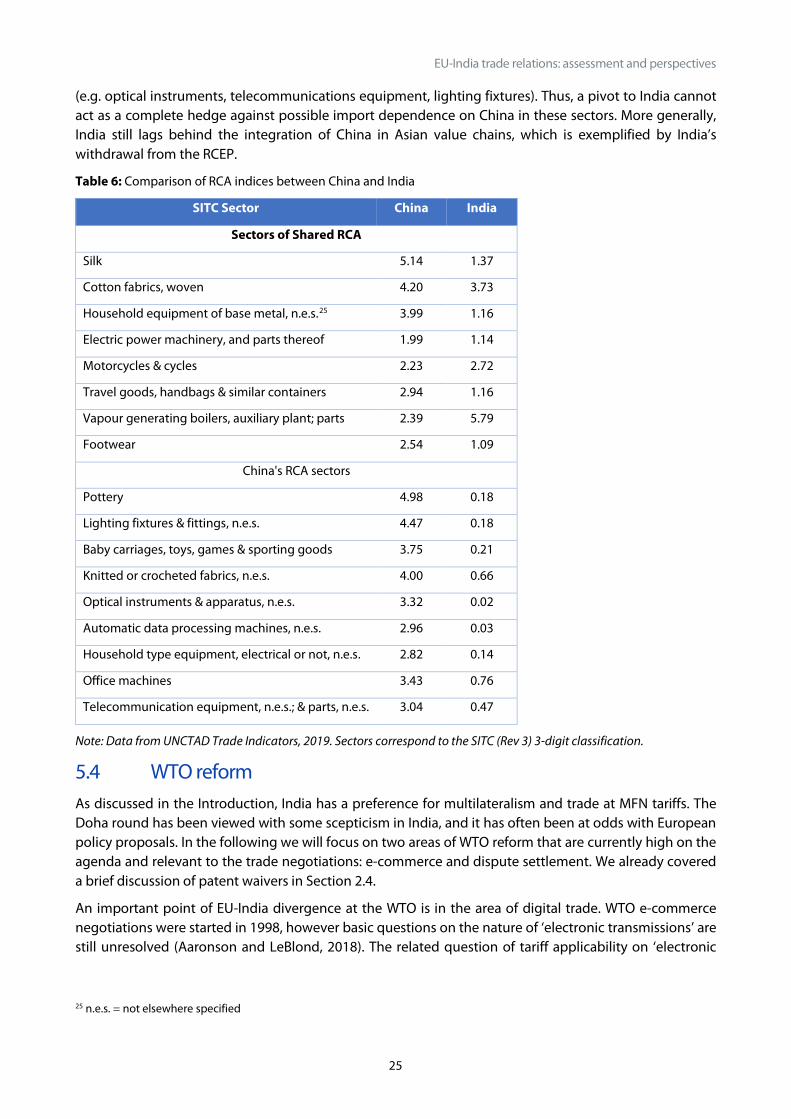
The shift towards China (and East Asia in general) reflects the increase in its share of global output and trade and geographical proximity, but has geopolitical implications. Given the change in policy stance towards China, which is now considered as ‘strategic rival’ by the EU and has been in a trade war with the US, western policymakers have looked to India as a potential substitute to Chinese manufacturing. To provide an insight into sectors of overlapping competitiveness, Table 6 below compares revealed compar-ative advantage (RCA) indices between India and China, which provide an indication of the competitive-ness of economic sectors.24 An indicator above 1 indicates a comparative advantage in a sector, and below 1 a comparative disadvantage. Both economies reported comparative advantages in 48 out of 256 SITC sectors. Table 6 below also highlights sectors where China has a high RCA and India too has an RCA exceed-ing 1. To the extent that the EU sources these goods from China, the bloc could diversify its imports by using India as an alternative supplier. However, India’s comparative advantage only partially matches that of China’s. In 56 out of 256 SITC sectors, China’s RCA index exceeds 1 whereas India’s RCA index is below 1
24 A country is said to have a revealed comparative advantage in a given product when its ratio of exports of that product to its total exports of all products exceeds the same ratio for the world as a whole.
EU-India trade relations: assessment and perspectives
25
(e.g. optical instruments, telecommunications equipment, lighting fixtures). Thus, a pivot to India cannot act as a complete hedge against possible import dependence on China in these sectors. More generally, India still lags behind the integration of China in Asian value chains, which is exemplified by India’s withdrawal from the RCEP.
Table 6: Comparison of RCA indices between China and India
SITC Sector China India
Sectors of Shared RCA
Silk 5.14 1.37
Cotton fabrics, woven 4.20 3.73
Household equipment of base metal, n.e.s.25 3.99 1.16
Electric power machinery, and parts thereof 1.99 1.14
Motorcycles & cycles 2.23 2.72
Travel goods, handbags & similar containers 2.94 1.16
Vapour generating boilers, auxiliary plant; parts 2.39 5.79
Footwear 2.54 1.09
China's RCA sectors
Pottery 4.98 0.18
Lighting fixtures & fittings, n.e.s. 4.47 0.18
Baby carriages, toys, games & sporting goods 3.75 0.21
Knitted or crocheted fabrics, n.e.s. 4.00 0.66
Optical instruments & apparatus, n.e.s. 3.32 0.02
Automatic data processing machines, n.e.s. 2.96 0.03
Household type equipment, electrical or not, n.e.s. 2.82 0.14
Office machines 3.43 0.76
Telecommunication equipment, n.e.s.; & parts, n.e.s. 3.04 0.47
Note: Data from UNCTAD Trade Indicators, 2019. Sectors correspond to the SITC (Rev 3) 3-digit classification.
5.4 WTO reform As discussed in the Introduction, India has a preference for multilateralism and trade at MFN tariffs. The Doha round has been viewed with some scepticism in India, and it has often been at odds with European policy proposals. In the following we will focus on two areas of WTO reform that are currently high on the agenda and relevant to the trade negotiations: e-commerce and dispute settlement. We already covered a brief discussion of patent waivers in Section 2.4.
An important point of EU-India divergence at the WTO is in the area of digital trade. WTO e-commerce negotiations were started in 1998, however basic questions on the nature of ‘electronic transmissions’ are still unresolved (Aaronson and LeBlond, 2018). The related question of tariff applicability on ‘electronic
25 n.e.s. = not elsewhere specified
Policy Department, Directorate-General for External Policies
26
transmissions’ has been postponed by moratorium. India is one of the leading voices to end the moratorium and raise tariff revenues from digital services. The EU, on the other hand, would like to regulate digital trade as service in the GATS.26 Due to pressure from those who want to raise tariff revenue, the regular (biannual) renewal of the moratorium was only extended until the next WTO ministerial (MC12), which was postponed due to the pandemic.27
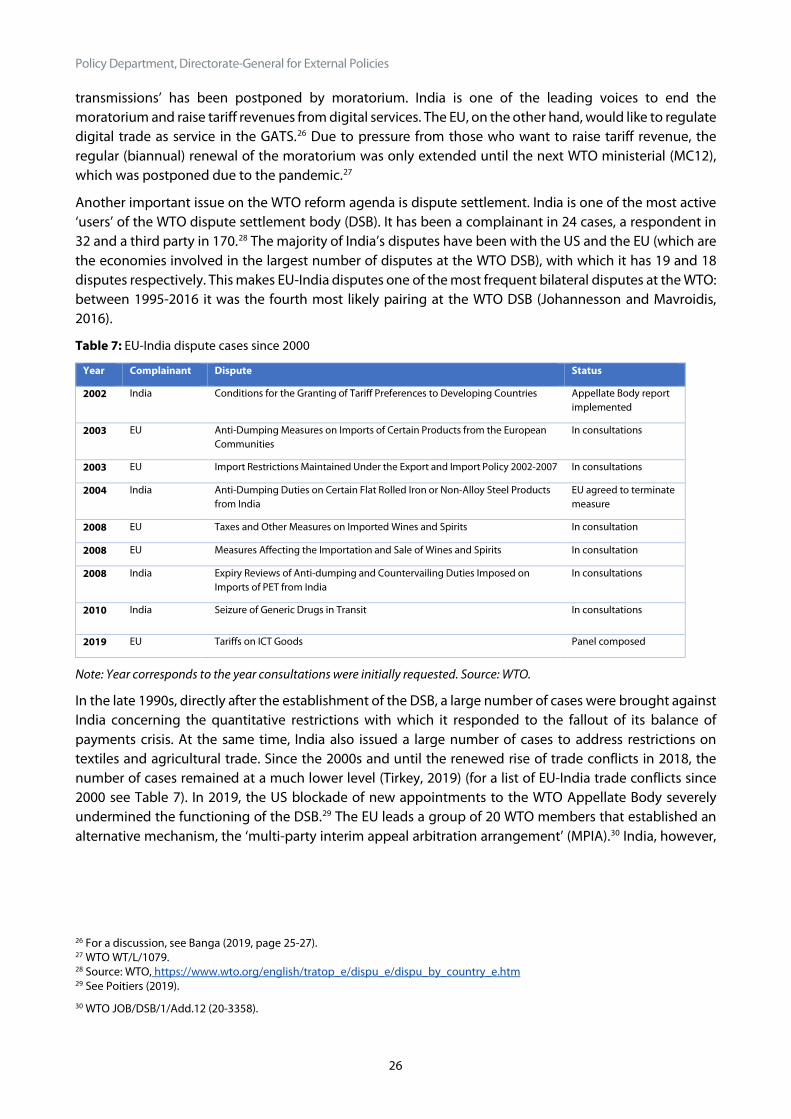
Another important issue on the WTO reform agenda is dispute settlement. India is one of the most active ‘users’ of the WTO dispute settlement body (DSB). It has been a complainant in 24 cases, a respondent in 32 and a third party in 170.28 The majority of India’s disputes have been with the US and the EU (which are the economies involved in the largest number of disputes at the WTO DSB), with which it has 19 and 18 disputes respectively. This makes EU-India disputes one of the most frequent bilateral disputes at the WTO: between 1995-2016 it was the fourth most likely pairing at the WTO DSB (Johannesson and Mavroidis, 2016).
Table 7: EU-India dispute cases since 2000
Year Complainant Dispute Status
2002 India Conditions for the Granting of Tariff Preferences to Developing Countries Appellate Body report implemented
2003 EU Anti-Dumping Measures on Imports of Certain Products from the European Communities
In consultations
2003 EU Import Restrictions Maintained Under the Export and Import Policy 2002-2007 In consultations
2004 India Anti-Dumping Duties on Certain Flat Rolled Iron or Non-Alloy Steel Products from India
EU agreed to terminate measure
2008 EU Taxes and Other Measures on Imported Wines and Spirits In consultation
2008 EU Measures Affecting the Importation and Sale of Wines and Spirits In consultation
2008 India Expiry Reviews of Anti-dumping and Countervailing Duties Imposed on Imports of PET from India
In consultations
2010 India Seizure of Generic Drugs in Transit In consultations
2019 EU Tariffs on ICT Goods Panel composed
Note: Year corresponds to the year consultations were initially requested. Source: WTO.
In the late 1990s, directly after the establishment of the DSB, a large number of cases were brought against India concerning the quantitative restrictions with which it responded to the fallout of its balance of payments crisis. At the same time, India also issued a large number of cases to address restrictions on textiles and agricultural trade. Since the 2000s and until the renewed rise of trade conflicts in 2018, the number of cases remained at a much lower level (Tirkey, 2019) (for a list of EU-India trade conflicts since 2000 see Table 7). In 2019, the US blockade of new appointments to the WTO Appellate Body severely undermined the functioning of the DSB.29 The EU leads a group of 20 WTO members that established an alternative mechanism, the ‘multi-party interim appeal arbitration arrangement’ (MPIA).30 India, however,
26 For a discussion, see Banga (2019, page 25-27). 27 WTO WT/L/1079. 28 Source: WTO, https://www.wto.org/english/tratop_e/dispu_e/dispu_by_country_e.htm 29 See Poitiers (2019).
30 WTO JOB/DSB/1/Add.12 (20-3358).
EU-India trade relations: assessment and perspectives
27
has not joined the MPIA. It is reported that India’s reluctance is due to its preference for a multilateral resolution to Appellate Body reform.31 The EU and India have co-sponsored a reform proposal for the DSB.32
6 Assessment and way forward India-EU economic relations remain below the aspirations of both parties, given the importance of both to the global economy. After a failed attempt to engage in trade negotiations between 2009 and 2013, and notwithstanding increasingly putting greater priority on domestic capabilities over global integration, Prime Minister Modi has taken a number of steps to strengthen the rather distant relationship with the EU, which he inherited. These moves complement India’s traditionally strong relationships with the major member states, even though the UK’s exit represents a major shift in the EU’s engagement with India. Markers of this growing closeness include Prime Minister Modi’s resumption of EU-India summits in 2016, the development of an EU strategy on India in 2018, the launch of the EU-India Roadmap to 2025 following the 2020 EU-India Summit, and the joint statement issued on 8 May 2021, after the EU27-India hybrid summit under the Portuguese EU presidency.
For the Modi government, the May 2021 agreement to reopen trade negotiations with the EU and to look for solutions to long standing market access issues is a significant, considered departure from its general scepticism on the value of preferential trade agreements in helping India meet its economic development agenda. Quite apart from India’s withdrawal from the RCEP negotiations, it has expressed dissatisfaction with existing bilateral preferential agreements with its Asian partners, has been unable to close a mini-deal with the US and has cancelled the bulk of its bilateral investment treaties.
One can only speculate on the range of motives that have led India formally to reopen trade and invest-ment negotiations with the EU. A desire to reduce dependence on Chinese manufactured inputs and the desire for access to high-quality manufacturing technology are perhaps part of the explanation, as well as securing market access for India’s export of information technology enabled services.
Adding urgency to these structural goals is the devastating impact of the pandemic on India’s near-term human development, employment and growth prospects. In preparing for the Indian presidency of the G20 in 2023 and India’s parliamentary elections in 2024, Prime Minister Modi needs to demonstrate that India remains in the league of fast-growing Asian nations, while providing employment to a young, restless and politically mobilised labour force.
The question is how preferential trade and/or investment links with the EU, or even a full-fledged economic partnership agreement similar to those between the EU and other advanced economies such as Canada or Japan (let alone Viet Nam), can meet India’s current needs. Opening up to foreign direct investment (FDI) in manufacturing could be one way forward and in this respect, the EU has a lot to offer. The EU’s approach to China’s market (namely that European companies produce in China both for its domestic market but also as part of the global value chain) should be of interest to Indian policy makers in as far as it creates productive jobs and allows for technological transfers. The EU accounts for the largest stock of FDI in China (not counting investment from Hong Kong and Taiwan). In addition, EU companies in China have been more focused on manufacturing FDI than on services, and with a high degree of technological transfer.
For Europe, India provides a partial hedge against the risk that the emerging trade architecture along the Pacific Rim (CPTPP, RCEP) might adversely affect the EU’s market access to those fast-growing markets. For
31 The India newspaper mint cited in July 2019 an anonymous Indian senior official with: ‘Why should we give up our right to appeal in the Appellate Body against any adverse judgment by a dispute settlement panel? We are not going to bind ourselves to a bilateral arbitration with other countries. The EU and Canada seem to have given up hope on the survival of the Appellate Body after December,’ (‘New Delhi may not join interim arrangement to replace appellate body at WTO’ from 30 July 2019, available at https://www.livemint.com/news/india/new-delhi-may-not-join-interim-arrangement-to-replace-appellate-body-at-wto-1564511083552.html) 32 WTO WT/GC/W/752, available at https://trade.ec.europa.eu/doclib/docs/2018/november/tradoc_157514.pdf
Policy Department, Directorate-General for External Policies
28
now, the EU is a much larger economy than is India, but as the record of China has shown relative positions can change quickly, and if India does achieve the growth spurt for which it has the potential, preferential access to the Indian market would provide an additional layer of assurance for European exporters and investors. Finally, it should not be forgotten that the EU-China trade and investment relationship has flourished even without a full-fledged trade or investment agreement. This might be because of the more open environment for foreign companies in China, at least in some sectors, and China’s much larger network of trade deals, which have made it easier to attract manufacturing companies that prepare goods for re-export. Still, part of the growth in trade flows is purely a consequence of China’s increasingly large market size and this is the case for India too. In other words, in the event that no breakthrough can be expected either from India’s government, at least before the 2024 elections, or the EU side in terms of opening up to more targeted immigration from India and technology transfer, the EU would do well to maintain a fluid economic dialogue with India, not only because of its sheer and growing market size but also for geopolitical reasons. India is an important middle power with a central role in the Indo-Pacific stra-tegies of key EU member states as well as the EU External Action Service.
Furthermore, with Brexit, not only is the EU’s relationship with its third-largest trading partner in some disarray, the formerly dominant EU investor in India is now a competitor. In the light of the still unsettled trading relationship with Britain, securing new markets with the additional comfort provided by preferen-tial trade deals is especially important.
On the geopolitical front, the EU is pursuing a strategy of strategic autonomy in the light of growing competition between the US and China. One way to foster such strategic autonomy is to align with relevant middle powers and India is the most obvious, given its economic size and, even more importantly, its potentially high growth prospects for decades ahead, based on factors including demographics and urbanisation trends. It is important to note that India and the EU share the same intention in terms of remaining relevant and strategically autonomous middle powers.
When it comes to the means through which the EU and India could enhance their trade and investment relationship, the first best is obviously a comprehensive deal. This implies starting negotiations on a com-prehensive economic cooperation agreement, similar to those recently reached by the EU with partners including Canada, Japan and Vietnam (and by India with Singapore, Japan and Korea). This implies that issues relevant to the EU’s strategic ambitions and values will need to be negotiated within such a deal. This includes climate objectives and labour standards. It is important to note these might not pose insuperable obstacles in negotiations. India is meeting its commitments in the Paris Agreement. India’s labour laws have, if anything, been overprotective towards incumbent (formal) workers in the manufac-turing sector, and are currently under review by the Modi government. On the other hand, a compre-hensive trade and investment deal may need address the roadblocks that occurred during previous negoti-ations between the EU and India, in particular on digital trade and student and workers’ visas.
Given the undeniable difficulties of such comprehensive negotiations, a way to continue to build momen-tum without the risk of an abrupt end to the negotiations would be to start with a more limited proposal focused on reducing barriers to investment in manufacturing. This would have to cover investment protection at the EU level but, possibly, also improve the level playing field. One can think of two important sweeteners for India to accept such a deal (other than the employment to be created by new production plants from foreign investors). The first is easier access for Indian workers and students to the EU. The second is easier technological transfer coming with EU companies investing in India. It remains to be seen whether the EU will be willing to accommodate such potential requests.

EU-India trade relations: assessment and perspectives
29
Finally, in the event that not even a targeted deal can be achieved, India’s growing economic size and the forces pushing Europe to find a balance between US-China strategic competition is bound to push the EU towards India and the other way around. In other words, even in the worst of circumstances in terms of the future of the newly started negotiations, economic relations between the EU and India are bound to deepen.
Policy Department, Directorate-General for External Policies
30
References Aaronson, S., and P. LeBlond (2018) ‘Another Digital Divide: The Rise of Data Realms and its Implications for the WTO’, Journal of International Economic Law (21): 245–272.
Ahluwalia, M.S. (2020) Backstage: The story behind India's high growth years, Rupa Publications New Delhi.
Banga, R. (2019) ‘Growing Trade in Electronic Transmissions: Implications for the South’, UNCTAD Research Paper 29, UNCTAD/SER.RP/2019/1/Rev.1, February 2019.
Basu, A. and J. Sherman (2020) ‘Key Global Takeaways From India's Revised Personal Data Protection Bill’, Lawfare.
Bery, S. (2021) ‘Will Modi’s push for self-reliance succeed?’ The Australian National University, Crawford School of Public Policy East Asia Forum.
Burman, A. (2020) ‘Will India’s Proposed Data Protection Law Protect Privacy and Promote Growth?’, Carnegie India Working Paper.
Charlie, A. (2014) ‘European Companies in India: Reigniting Economic Growth and Foreign Direct Invest-ment’, Europe India Chamber of Commerce and Europe Business and Technology Centre.
Ciortuz, F., Goddeeris, I, Natens, B. and J. Wouters (2014) ‘Some Critical Issues in the EU-India Free Trade Agreement Negotiations’, European Law Journal 20(6): 848-869.
Damgaard, J., T. Elkjaer and N. Johannesen (2019) ‘What Is Real and What Is Not in the Global FDI Network?’, IMF Working Paper WP/19/274, International Monetary Fund.
Dür A., L. Baccini and M. Elsig (2014) 'The Design of International Trade Agreements: Introducing a New Dataset', The Review of International Organizations 9(3): 353-375.
Embassy of Japan and JETRO (2021) Press Release: Japanese Business Establishments in India – 2020, Embassy and the Consulates General of Japan in India.
Felbermayr, G., D. Mitra, R. Aichele and J. Gröschl (2017) ‘Europe and India: Relaunching a Troubled Trade Relationship’, ifo Forschungsberichte 80.
Ferencz, J., (2019) ‘The OECD Digital Services Trade Restrictiveness Index’, OECD Trade Policy Papers 221.
Garnaut, R. (2004) India, China and Australia: Lessons from Different Paths in Economic Reform: The 2004 Sir John Crawford Lecture, New Delhi. National Council of Applied Economic Research.
Görlich, D., and N. F. Poitiers (2020) Geopolitical Aspects of Digital Trade, In-Depth Analysis for the European Parliament's Committee on International Trade, European Parliament, Luxembourg.
Guetta-Jeanrenaud, L., N. F. Poitiers and R. Veugelers (2021) ‘A world divided: global vaccine trade and production’, Bruegel Blogpost.
Indian Ministry of External Affairs (2020) Brief Note on India-Japan Bilateral Relations, Government of India.
Johannesson, L., and Mavroidis, P. C. (2017) ‘The WTO dispute settlement system 1995-2016: a data set and its descriptive statistics’, Journal of World Trade 51(3).
KAS (2021) Perception of the Planned EU Carbon Border Adjustment Mechanism in Asia Pacific — An Expert Survey, Konrad Adenauer Stiftung.
Krishna, P. (2019) ‘India’s Trade Agreements and the Future of Indian Trade Policy’, Columbia University Working Paper 2019-05, Deepak and Neera Raj Center on Indian Economic Policies, School of Public and International Affairs.
EU-India trade relations: assessment and perspectives
31
Marcus, J. S., N. F. Poitiers, L. Guetta-Jeanrenaud, M. Grzegorczyk, N. Röhner, S. Buckingham, F. Hortalforonda, J. Pelkmans (2021) The impact of COVID-19 on the Internal Market, Publication for the committee on Internal Market and Consumer Protection, Policy Department for Economic, Scientific and Quality of Life Policies, European Parliament, Luxembourg.
Navarra, C. (2020) Assessing the potential impact of an EU-India trade agreement, European Parliamentary Research Service, PE 642.841.
OECD (2021), OECD Services Trade Restrictiveness Index: Policy trends up to 2021, OECD.
Poitiers, N. F. (2019) ‘High Noon at the appellate body’, Bruegel Blogpost.
Poulsen, L. N. S. (2015) Bounded Rationality and Economic Diplomacy: The Politics of Investment Treaties in Developing Countries, Cambridge University Press.
Rajan, P. (2014) ‘India and Bilateral Investment Treaties – A Changing Landscape’, ICSID Review 29(2): 419-450.
Rodrik, D. (2016) ‘Premature deindustrialization’, Journal of Economic Growth 21(1): 1-3.
Spencer, T., R. Pachouri, G Renjith and S. Vohra (2018) ‘Coal Transition in India’, TERI Discussion Paper.
Tirkey, A. (2019) ‘The WTO Dispute Settlement System: An Analysis of India’s Experience and Current Reform Proposals’, ORF Occasional Paper 209.

PE 653.646 EP/EXPO/INTA/FWC/2019-01/LOT5/1/C/09
Print ISBN 978-92-846-8465-6 | doi: 10.2861/594266 | QA-06-21-046-EN-C PDF ISBN 978-92-846-8466-3 | doi: 10.2861/63326 | QA-06-21-046-EN-N