Embed Size (px)
Citation preview
1
WORKING PAPER NO: 360
EU-India Bilateral Remittances
Chinmay Tumbe Fellow (Ph.D) Student,
Economics & Social Sciences Area Indian Institute of Management Bangalore Bannerghatta Road, Bangalore – 5600 76
Year of Publication 2012

2
This paper is part of the research project titled “Developing a knowledge base for policymaking on India-EU migration”, financed by the European Union (EU) and carried out by Prof. Rupa Chanda at the Indian Institute of Management Bangalore (IIMB) and researchers at the European University Institute (EUI), Indian Council of Overseas Employment (ICOE), and Maastricht University (Faculty of Law). The research project aims at promoting a constructive dialogue between the EU and India on all migration-related issues.
3
Summary
• India is the largest recipient of migrants’ remittances in the world, receiving over $ 50 billion in 2010, from nearly ten million emigrants
• An estimated 15% of these inflows or roughly $ 8 billion originate from European Union (EU) countries which host about a million Indian emigrants, a figure around 0.6 % of India’s Gross Domestic Product (GDP)
• Around 75% of the flows from the EU to India, or $ 6 billion, originate from the United
Kingdom (UK)
• Migrants’ remittances to India constitute about 4% of total extra-EU remittance outflows
• Indian emigrants in the EU held over $ 8 billion worth Non-Resident Indian (NRI) deposits, forming nearly 20% of NRI deposits in the Indian banking system
• Emigrants in UK and Germany held 70% and 20% of NRI deposits held by Indian
emigrants in the EU
• Remittance outflows from India to the EU are estimated to be under $ 500 million, less than 20% of total outflows from India
4
Table of Contents
1. Introduction ................................................................................................................... 5
2. Remittances to and from India ..................................................................................... 6
3. Remittances from and to the EU ................................................................................. 11
4. EU-India Remittances ................................................................................................. 13
5. Conclusion ................................................................................................................... 16
Appendix 1: Measuring Migrants’ Remittances to India ................................................ 17
Appendix 2: Source Regions for Migrants’ Remittances ................................................ 19
Appendix 3: NRI Deposits by source country in Europe ................................................. 21
List of References .............................................................................................................. 22
Tables
1. Types of Non Resident Indian (NRI) Deposits ................................................................. 8 2. Source Regions of Migrants Remittances to India, 1970-2010 ......................................... 9 3. Top Remittance Corridors for extra-EU remittance outflows, 2006 ................................ 11 4. NRI Deposits by source country in Europe, 2010........................................................... 13
Figures
1. Migrants financial links with India, 1970-2010 ................................................................ 7 2. Migrants’ remittances versus Foreign Investment Flows to India, 1993-2010... ............. 10 3. Country shares of extra-EU remittance outflows, 2006 .................................................. 11 4. Source Regions of Migrants Remittances, 1971-1991 .................................................... 19
5
1. Introduction
A hundred years ago, during colonial times, more than a hundred thousand migrants from
Britain and Ireland worked in India, mostly as soldiers and administrators. In contrast, only
around 4,000 Indians lived in Britain: 1,000 students and 2,500 persons working in
navigation related activities.1 As a result, European countries were net recipients of migrants’
remittances from India.2
A century later, nearly a million emigrants from India live in the countries of the European
Union (EU) and less than 10,000 EU expatriates work in India, making India a net recipient
of migrants’ remittances from the EU.3
Considering the significantly large Indian emigrant base in the EU, few questions that emerge
are: How much money flows from the EU to India by way of migrants’ remittances? What
part of emigrant capital flows are sourced from the EU? And what are the country shares of
these remittance flows?
This paper attempts to address these questions basing its analysis on data compiled from
numerous reports published by the Reserve Bank of India over the last three decades.
The paper is organised as follows: Section 2 discusses the various types of remittances that
flow to India, the importance of Non-Resident Indian deposits as a conduit for emigrant
capital flows and migrants’ remittances and the main source regions of remittances to India.
Section 3 briefly summarises remittance outflows from the EU and outlines the top
remittance corridors from the EU. Section 4 quantifies EU to India remittance flows at the
aggregate and country level while Section 5 concludes. Appendix 1 and 2 outline the
measurement issues involved in estimating the magnitude of migrants’ remittances and the
source regions of these flows.
1 Census of India 1911, Vol. 1, Part 1, pg. 110. A similar deficit in relative terms would have been observed in the smaller areas ruled by the French and the Portugeese. 2 Postal money orders were popular means of migrants’ remittances. According to the Annual Report of the Indian Posts and Telegraphs, 1880-81, £ 86, 382 worth money orders were remitted from India to Britain compared to £ 6,428 worth money orders remitted from Britain to India. Similarly, £ 2,108 worth money orders were remitted to Germany compared to £ 870 remitted from Germany to India. 3 Recent data from the Office of National Statistics in the UK report nearly 700,000 people in the UK born in India in 2010 (ONS 2011). Along with nearly 250,000 ‘Non-Resident Indians’ in other EU countries estimated by MOIA (2010), an estimated one million Indian emigrants reside in the EU.
6
2. Migrants’ Remittances to and from India
India is the largest recipient of migrants’ remittances in the world.4 In 2010, India received
over $ 50 billion as migrants’ remittances from nearly ten million emigrants, a figure that is
roughly 4% of India’s Gross Domestic Product (GDP).5
There are two distinct types of migrants’ remittances to India. The first type comes in the
form of family maintenance and repatriation of savings by migrants abroad. Migrants may
remit money to support families back home through wire transfers, bank drafts, money
transfer operators or other such mechanisms. Alternatively, migrants may repatriate their
savings back home after completion of long term assignments abroad.
The second type of flows enters through special banking deposits known as Non-Resident
Indian (NRI) deposits.6 NRI deposits were started in 1970 and have emerged as an important
channel of obtaining foreign capital, totalling nearly $ 50 billion in 2010. The deposits are
popular because of the interest rate differential (Gupta and Gordon 2004) as well as the
favourable tax treatment on the capital gains. Further, transaction costs and operational
hurdles have been progressively lowered over the past two decades such that the deposits are
easy to open and operate. These deposits attract investments that are largely repatriated back
abroad. However, of late, a significant part of these deposits are withdrawn for local use
within India in which case they are counted as migrants’ remittances or unrequited transfers.
Local withdrawals are used for a variety of purposes: Supporting families, Real estate
investments and property maintenance, Stock market investments, etc.
An additional type of remittance occurs through ‘Compensation of Employees’ working on
short-term foreign contracts, usually less than a year, but these flows are relatively small in
volume.
In the financial year 2009-2010, migrants’ remittances amounted to $ 53 billion of which
54% was in the form of ‘Family Maintenance and Repatriation of Savings,’45% as ‘Local
Withdrawals or Redemptions from NRI deposits’ and 1% as ‘Compensation of Employees.’
4 World Bank (2011). 5 Emigrants refer to Non Resident Indians in MOIA (2010). Figures for migrants’ remittances are author’s estimates based on data from the Reserve Bank of India. Appendix 1 describes the methodology. GDP figures and other figures in this paper, unless otherwise stated, are taken from RBI (2011b). 6 The main criterion to distinguish between Non Resident Indians and Resident Indians is duration of stay in India. If duration of stay is less than 182 days or roughly 6 months in a financial year, the person is NRI. NRI deposits can also be opened by Persons of Indian Origin (PIO) and Overseas Corporate Bodies (OCB’s) that are companies predominantly owned by NRI’s or PIO’s.
7
While unofficial remittances through informal channels were significant in magnitude in the
past, they are unlikely to form a significant part of remittances today (Appendix 1).
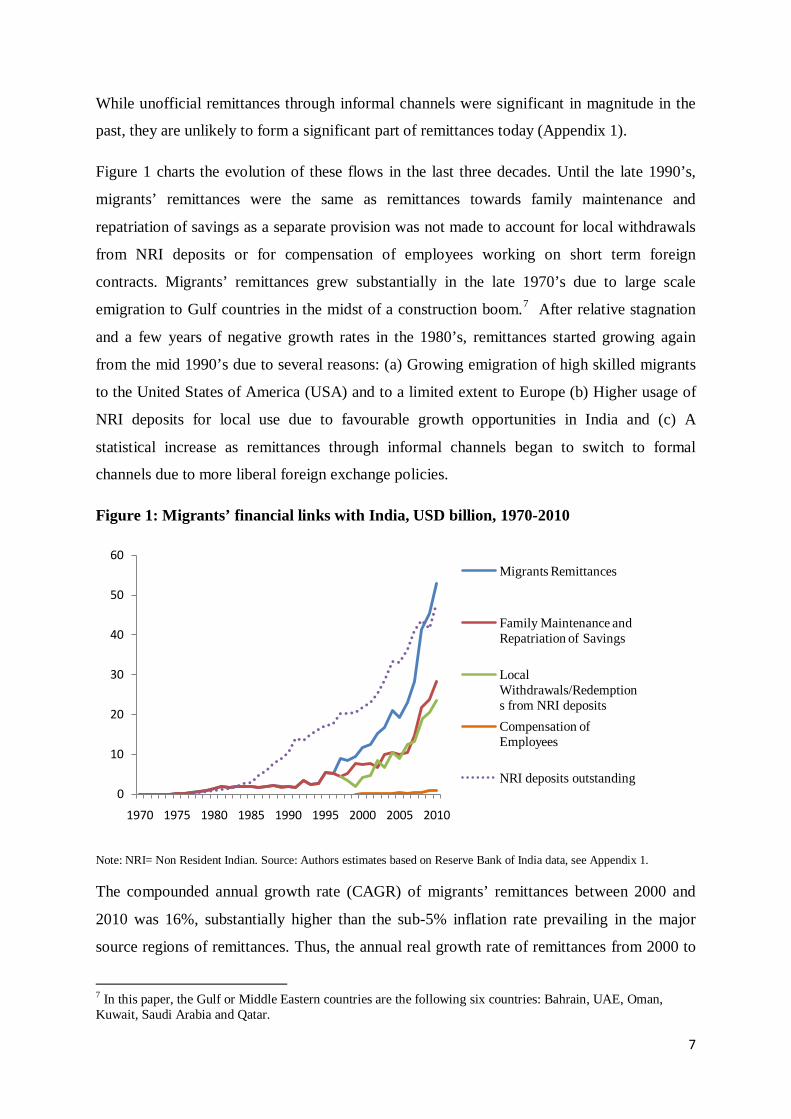
Figure 1 charts the evolution of these flows in the last three decades. Until the late 1990’s,
migrants’ remittances were the same as remittances towards family maintenance and
repatriation of savings as a separate provision was not made to account for local withdrawals
from NRI deposits or for compensation of employees working on short term foreign
contracts. Migrants’ remittances grew substantially in the late 1970’s due to large scale
emigration to Gulf countries in the midst of a construction boom.7 After relative stagnation
and a few years of negative growth rates in the 1980’s, remittances started growing again
from the mid 1990’s due to several reasons: (a) Growing emigration of high skilled migrants
to the United States of America (USA) and to a limited extent to Europe (b) Higher usage of
NRI deposits for local use due to favourable growth opportunities in India and (c) A
statistical increase as remittances through informal channels began to switch to formal
channels due to more liberal foreign exchange policies.
Figure 1: Migrants’ financial links with India, USD billion, 1970-2010
Note: NRI= Non Resident Indian. Source: Authors estimates based on Reserve Bank of India data, see Appendix 1.
The compounded annual growth rate (CAGR) of migrants’ remittances between 2000 and
2010 was 16%, substantially higher than the sub-5% inflation rate prevailing in the major
source regions of remittances. Thus, the annual real growth rate of remittances from 2000 to
7 In this paper, the Gulf or Middle Eastern countries are the following six countries: Bahrain, UAE, Oman, Kuwait, Saudi Arabia and Qatar.
0
10
20
30
40
50
60
1970 1975 1980 1985 1990 1995 2000 2005 2010
Migrants Remittances
Family Maintenance and Repatriation of Savings
Local Withdrawals/Redemptions from NRI depositsCompensation of Employees
NRI deposits outstanding
8
2010 was above 10%. Remittance flows have been more sensitive to host country economic
conditions than changes in exchange rates. Even though the rupee depreciated by 14% in
2008-09, remittance flows did not rise substantially to take advantage of obtaining more
rupees for every dollar sent. Instead, the growth rate of remittances dipped due to the global
economic slowdown.
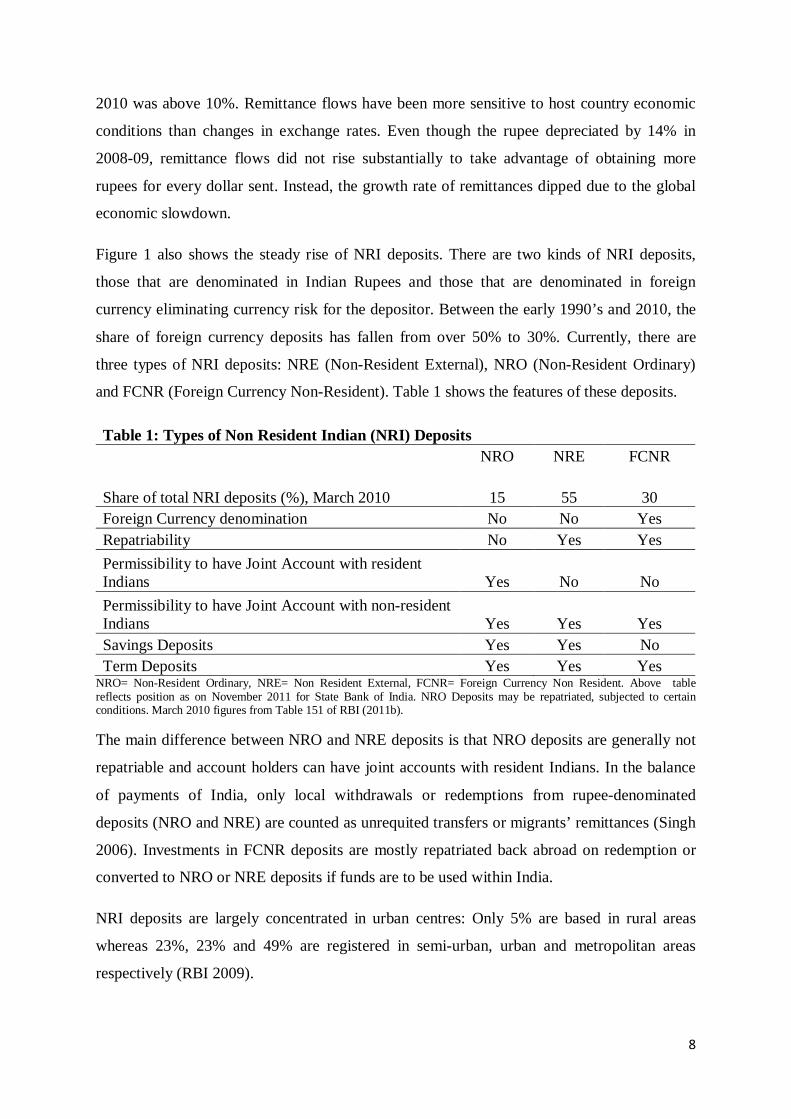
Figure 1 also shows the steady rise of NRI deposits. There are two kinds of NRI deposits,
those that are denominated in Indian Rupees and those that are denominated in foreign
currency eliminating currency risk for the depositor. Between the early 1990’s and 2010, the
share of foreign currency deposits has fallen from over 50% to 30%. Currently, there are
three types of NRI deposits: NRE (Non-Resident External), NRO (Non-Resident Ordinary)
and FCNR (Foreign Currency Non-Resident). Table 1 shows the features of these deposits.
Table 1: Types of Non Resident Indian (NRI) Deposits
NRO NRE FCNR
Share of total NRI deposits (%), March 2010 15 55 30 Foreign Currency denomination No No Yes Repatriability No Yes Yes Permissibility to have Joint Account with resident Indians Yes No No Permissibility to have Joint Account with non-resident Indians Yes Yes Yes Savings Deposits Yes Yes No Term Deposits Yes Yes Yes
NRO= Non-Resident Ordinary, NRE= Non Resident External, FCNR= Foreign Currency Non Resident. Above table reflects position as on November 2011 for State Bank of India. NRO Deposits may be repatriated, subjected to certain conditions. March 2010 figures from Table 151 of RBI (2011b).
The main difference between NRO and NRE deposits is that NRO deposits are generally not
repatriable and account holders can have joint accounts with resident Indians. In the balance
of payments of India, only local withdrawals or redemptions from rupee-denominated
deposits (NRO and NRE) are counted as unrequited transfers or migrants’ remittances (Singh
2006). Investments in FCNR deposits are mostly repatriated back abroad on redemption or
converted to NRO or NRE deposits if funds are to be used within India.
NRI deposits are largely concentrated in urban centres: Only 5% are based in rural areas
whereas 23%, 23% and 49% are registered in semi-urban, urban and metropolitan areas
respectively (RBI 2009).
9
Migrants’ remittances are concentrated in certain States and cities of India. They form an
integral part of the regional economies of Kerala, Goa and Punjab where the remittance to
GDP ratios are as high as 30%, 20% and 10% respectively (Tumbe 2011). In Kerala and
Punjab, large part of the remittances originating from the Gulf countries and Canada
respectively, flow to rural areas. Among the major cities, Mumbai, Delhi and Bangalore
attract significant amount of remittances, especially through the channel of NRI deposits.
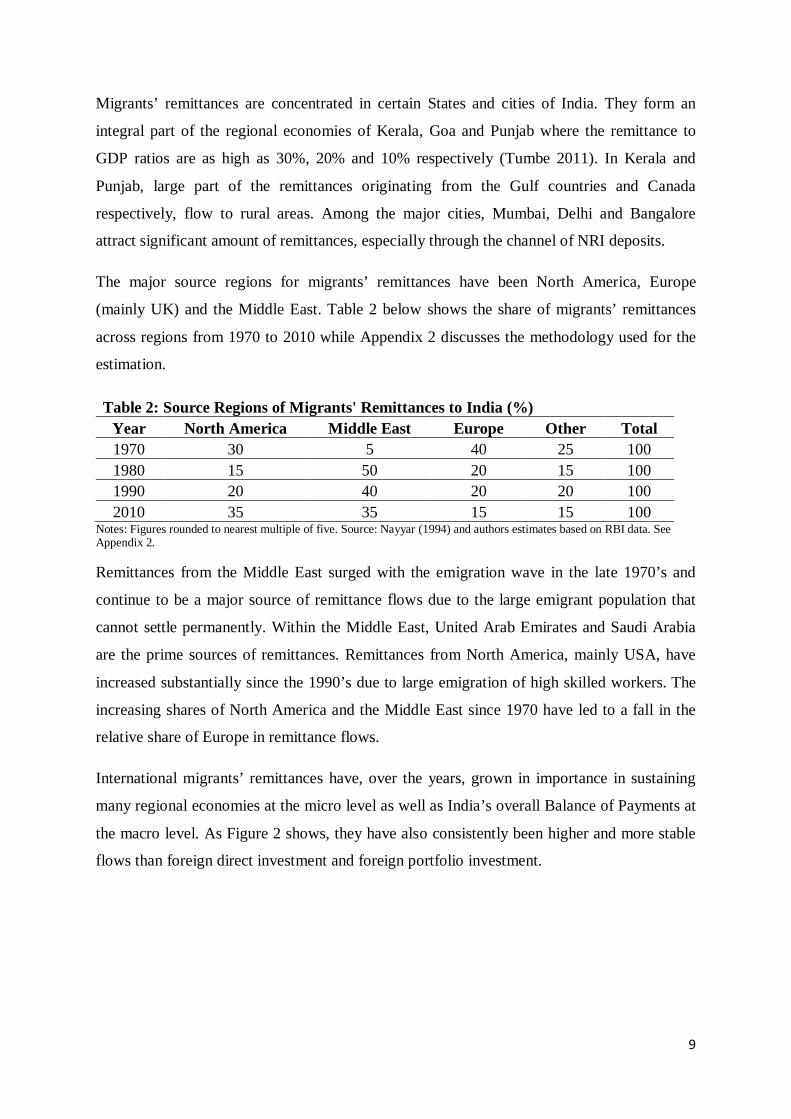
The major source regions for migrants’ remittances have been North America, Europe
(mainly UK) and the Middle East. Table 2 below shows the share of migrants’ remittances
across regions from 1970 to 2010 while Appendix 2 discusses the methodology used for the
estimation.
Table 2: Source Regions of Migrants' Remittances to India (%) Year North America Middle East Europe Other Total 1970 30 5 40 25 100 1980 15 50 20 15 100 1990 20 40 20 20 100 2010 35 35 15 15 100
Notes: Figures rounded to nearest multiple of five. Source: Nayyar (1994) and authors estimates based on RBI data. See Appendix 2.
Remittances from the Middle East surged with the emigration wave in the late 1970’s and
continue to be a major source of remittance flows due to the large emigrant population that
cannot settle permanently. Within the Middle East, United Arab Emirates and Saudi Arabia
are the prime sources of remittances. Remittances from North America, mainly USA, have
increased substantially since the 1990’s due to large emigration of high skilled workers. The
increasing shares of North America and the Middle East since 1970 have led to a fall in the
relative share of Europe in remittance flows.
International migrants’ remittances have, over the years, grown in importance in sustaining
many regional economies at the micro level as well as India’s overall Balance of Payments at
the macro level. As Figure 2 shows, they have also consistently been higher and more stable
flows than foreign direct investment and foreign portfolio investment.
10
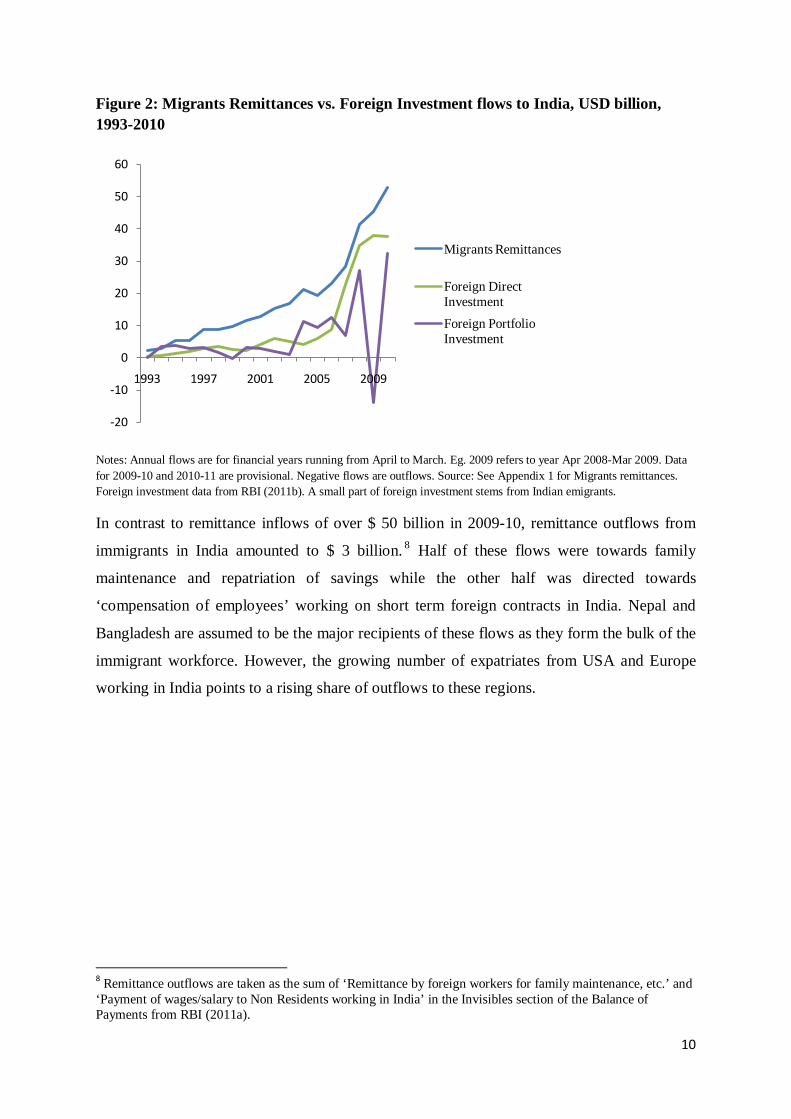
Figure 2: Migrants Remittances vs. Foreign Investment flows to India, USD billion, 1993-2010
Notes: Annual flows are for financial years running from April to March. Eg. 2009 refers to year Apr 2008-Mar 2009. Data for 2009-10 and 2010-11 are provisional. Negative flows are outflows. Source: See Appendix 1 for Migrants remittances. Foreign investment data from RBI (2011b). A small part of foreign investment stems from Indian emigrants.
In contrast to remittance inflows of over $ 50 billion in 2009-10, remittance outflows from
immigrants in India amounted to $ 3 billion. 8 Half of these flows were towards family
maintenance and repatriation of savings while the other half was directed towards
‘compensation of employees’ working on short term foreign contracts in India. Nepal and
Bangladesh are assumed to be the major recipients of these flows as they form the bulk of the
immigrant workforce. However, the growing number of expatriates from USA and Europe
working in India points to a rising share of outflows to these regions.
8 Remittance outflows are taken as the sum of ‘Remittance by foreign workers for family maintenance, etc.’ and ‘Payment of wages/salary to Non Residents working in India’ in the Invisibles section of the Balance of Payments from RBI (2011a).
-20
-10
0
10
20
30
40
50
60
1993 1997 2001 2005 2009
Migrants Remittances
Foreign Direct InvestmentForeign Portfolio Investment
11
3. Migrants’ Remittances from and to the EU
The European Union (EU) is a major source of migrants’ remittances for many countries
within and outside the Union. Remittance outflows from the EU to non-EU countries are
more than double the amount received from non-EU countries (Eurostat 2007).
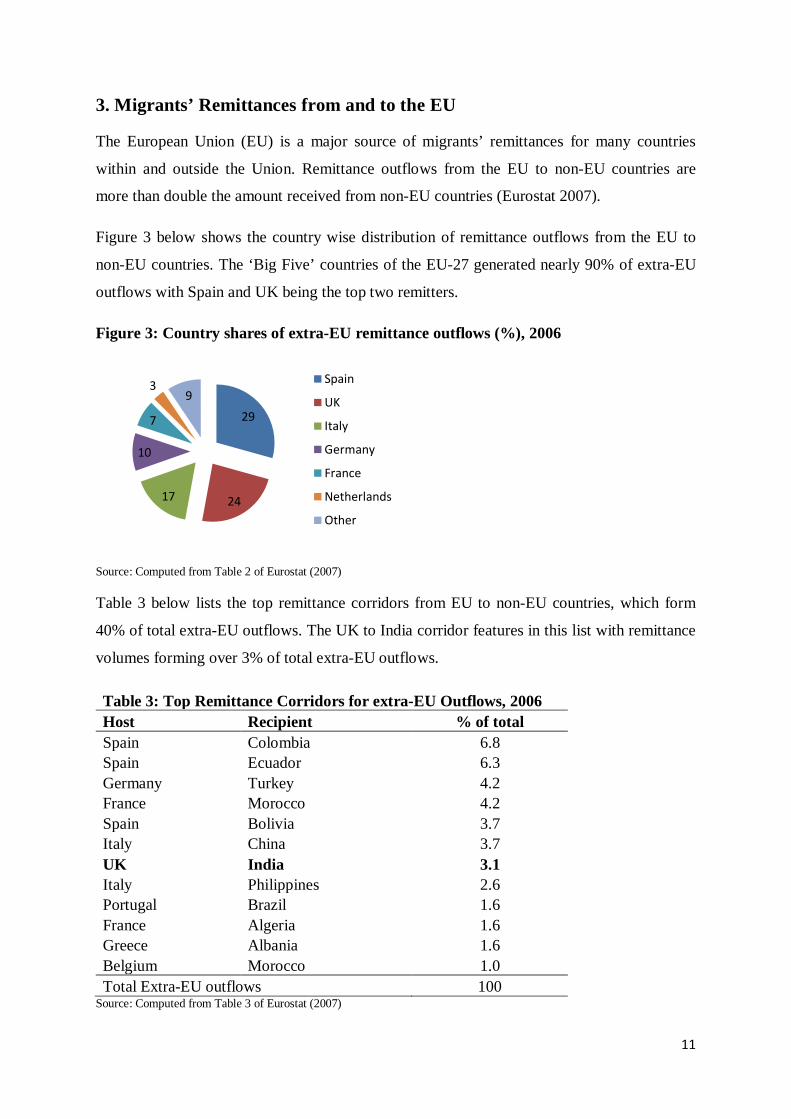
Figure 3 below shows the country wise distribution of remittance outflows from the EU to
non-EU countries. The ‘Big Five’ countries of the EU-27 generated nearly 90% of extra-EU
outflows with Spain and UK being the top two remitters.
Figure 3: Country shares of extra-EU remittance outflows (%), 2006
Source: Computed from Table 2 of Eurostat (2007)
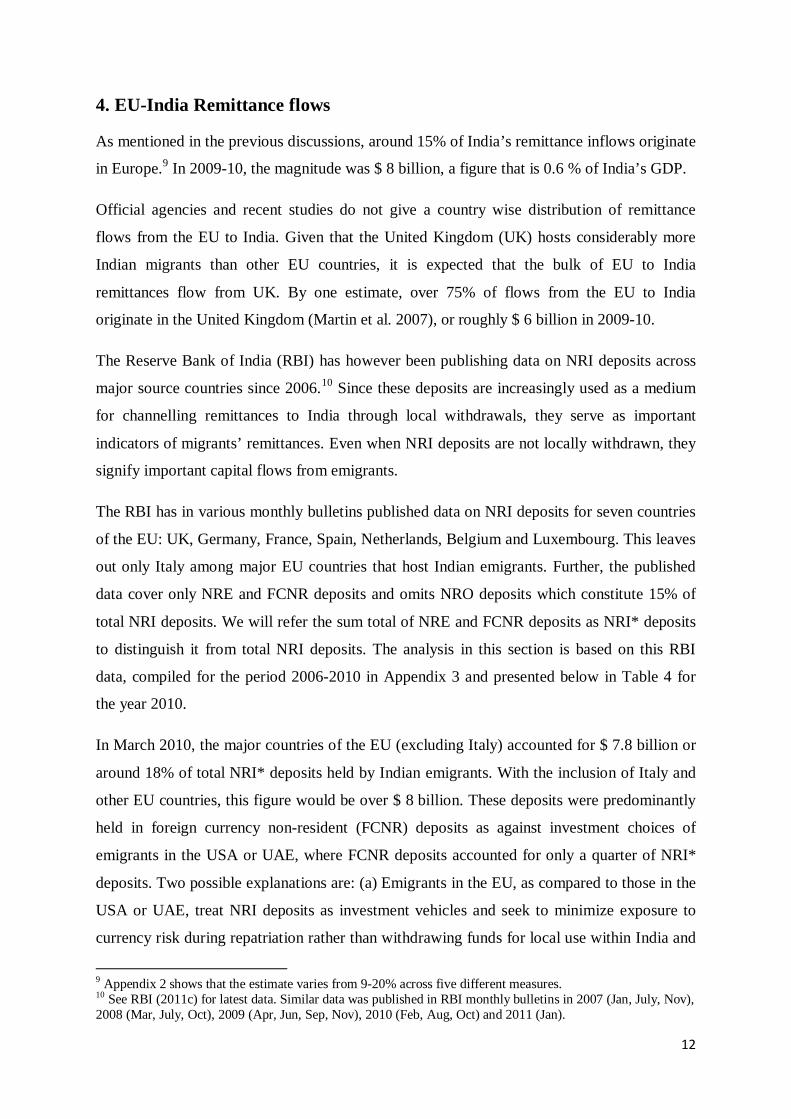
Table 3 below lists the top remittance corridors from EU to non-EU countries, which form
40% of total extra-EU outflows. The UK to India corridor features in this list with remittance
volumes forming over 3% of total extra-EU outflows.
Table 3: Top Remittance Corridors for extra-EU Outflows, 2006 Host Recipient % of total Spain Colombia 6.8 Spain Ecuador 6.3 Germany Turkey 4.2 France Morocco 4.2 Spain Bolivia 3.7 Italy China 3.7 UK India 3.1 Italy Philippines 2.6 Portugal Brazil 1.6 France Algeria 1.6 Greece Albania 1.6 Belgium Morocco 1.0 Total Extra-EU outflows 100
Source: Computed from Table 3 of Eurostat (2007)
29
2417
10
7
39
Spain
UK
Italy
Germany
France
Netherlands
Other
12
4. EU-India Remittance flows
As mentioned in the previous discussions, around 15% of India’s remittance inflows originate
in Europe.9 In 2009-10, the magnitude was $ 8 billion, a figure that is 0.6 % of India’s GDP.
Official agencies and recent studies do not give a country wise distribution of remittance
flows from the EU to India. Given that the United Kingdom (UK) hosts considerably more
Indian migrants than other EU countries, it is expected that the bulk of EU to India
remittances flow from UK. By one estimate, over 75% of flows from the EU to India
originate in the United Kingdom (Martin et al. 2007), or roughly $ 6 billion in 2009-10.
The Reserve Bank of India (RBI) has however been publishing data on NRI deposits across
major source countries since 2006.10 Since these deposits are increasingly used as a medium
for channelling remittances to India through local withdrawals, they serve as important
indicators of migrants’ remittances. Even when NRI deposits are not locally withdrawn, they
signify important capital flows from emigrants.
The RBI has in various monthly bulletins published data on NRI deposits for seven countries
of the EU: UK, Germany, France, Spain, Netherlands, Belgium and Luxembourg. This leaves
out only Italy among major EU countries that host Indian emigrants. Further, the published
data cover only NRE and FCNR deposits and omits NRO deposits which constitute 15% of
total NRI deposits. We will refer the sum total of NRE and FCNR deposits as NRI* deposits
to distinguish it from total NRI deposits. The analysis in this section is based on this RBI
data, compiled for the period 2006-2010 in Appendix 3 and presented below in Table 4 for
the year 2010.
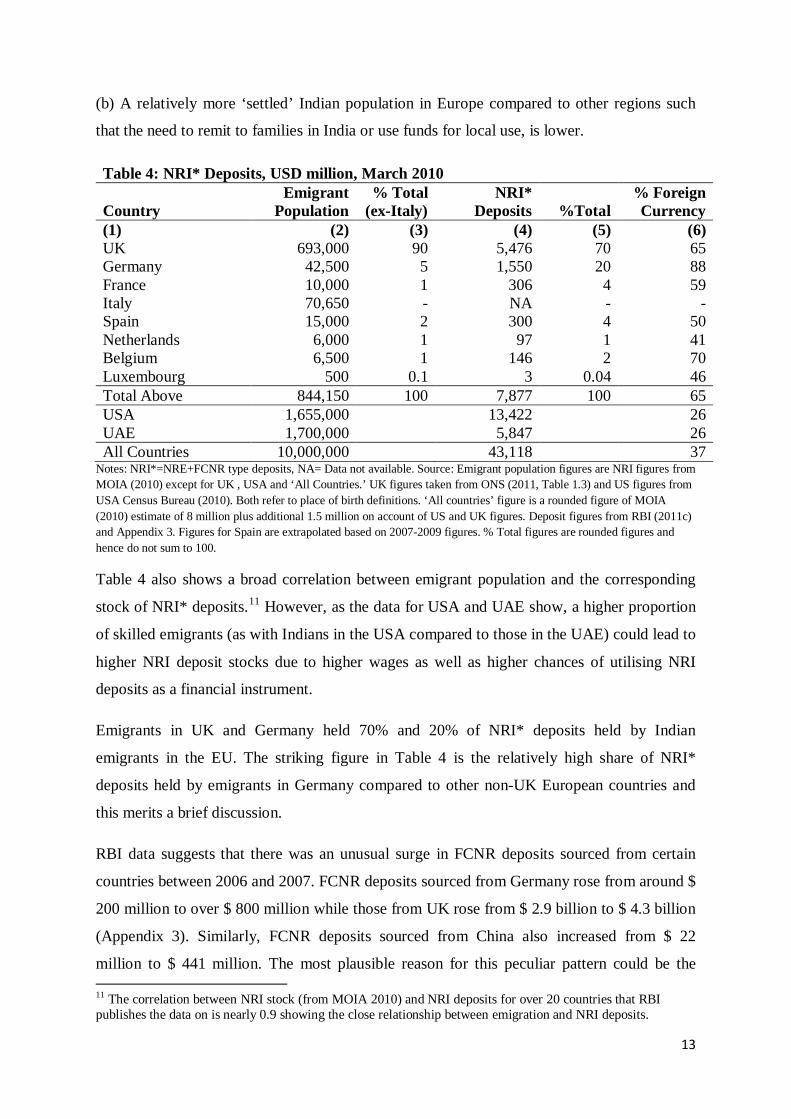
In March 2010, the major countries of the EU (excluding Italy) accounted for $ 7.8 billion or
around 18% of total NRI* deposits held by Indian emigrants. With the inclusion of Italy and
other EU countries, this figure would be over $ 8 billion. These deposits were predominantly
held in foreign currency non-resident (FCNR) deposits as against investment choices of
emigrants in the USA or UAE, where FCNR deposits accounted for only a quarter of NRI*
deposits. Two possible explanations are: (a) Emigrants in the EU, as compared to those in the
USA or UAE, treat NRI deposits as investment vehicles and seek to minimize exposure to
currency risk during repatriation rather than withdrawing funds for local use within India and
9 Appendix 2 shows that the estimate varies from 9-20% across five different measures. 10 See RBI (2011c) for latest data. Similar data was published in RBI monthly bulletins in 2007 (Jan, July, Nov), 2008 (Mar, July, Oct), 2009 (Apr, Jun, Sep, Nov), 2010 (Feb, Aug, Oct) and 2011 (Jan).
13
(b) A relatively more ‘settled’ Indian population in Europe compared to other regions such
that the need to remit to families in India or use funds for local use, is lower.
Table 4: NRI* Deposits, USD million, March 2010
Country Emigrant
Population % Total
(ex-Italy) NRI*
Deposits %Total % Foreign Currency
(1) (2) (3) (4) (5) (6) UK 693,000 90 5,476 70 65 Germany 42,500 5 1,550 20 88 France 10,000 1 306 4 59 Italy 70,650 - NA - - Spain 15,000 2 300 4 50 Netherlands 6,000 1 97 1 41 Belgium 6,500 1 146 2 70 Luxembourg 500 0.1 3 0.04 46 Total Above 844,150 100 7,877 100 65 USA 1,655,000
13,422
26
UAE 1,700,000 5,847 26 All Countries 10,000,000 43,118 37
Notes: NRI*=NRE+FCNR type deposits, NA= Data not available. Source: Emigrant population figures are NRI figures from MOIA (2010) except for UK , USA and ‘All Countries.’ UK figures taken from ONS (2011, Table 1.3) and US figures from USA Census Bureau (2010). Both refer to place of birth definitions. ‘All countries’ figure is a rounded figure of MOIA (2010) estimate of 8 million plus additional 1.5 million on account of US and UK figures. Deposit figures from RBI (2011c) and Appendix 3. Figures for Spain are extrapolated based on 2007-2009 figures. % Total figures are rounded figures and hence do not sum to 100.
Table 4 also shows a broad correlation between emigrant population and the corresponding
stock of NRI* deposits.11 However, as the data for USA and UAE show, a higher proportion
of skilled emigrants (as with Indians in the USA compared to those in the UAE) could lead to
higher NRI deposit stocks due to higher wages as well as higher chances of utilising NRI
deposits as a financial instrument.
Emigrants in UK and Germany held 70% and 20% of NRI* deposits held by Indian
emigrants in the EU. The striking figure in Table 4 is the relatively high share of NRI*
deposits held by emigrants in Germany compared to other non-UK European countries and
this merits a brief discussion.
RBI data suggests that there was an unusual surge in FCNR deposits sourced from certain
countries between 2006 and 2007. FCNR deposits sourced from Germany rose from around $
200 million to over $ 800 million while those from UK rose from $ 2.9 billion to $ 4.3 billion
(Appendix 3). Similarly, FCNR deposits sourced from China also increased from $ 22
million to $ 441 million. The most plausible reason for this peculiar pattern could be the 11 The correlation between NRI stock (from MOIA 2010) and NRI deposits for over 20 countries that RBI publishes the data on is nearly 0.9 showing the close relationship between emigration and NRI deposits.
14
recycling of the India Millennium Deposits that raised $ 5.5 billion in 2001 and matured in
December 2005, into FCNR deposits (See Appendix 1). However, the fact that these high
levels of FCNR deposits have been sustained till 2010 suggests that the surge between 2006
and 2007 was not a one-off event and that emigrant investors from these countries have
continued to invest in Indian deposits. It should also be pointed out that Germany hosts
substantially more NRE deposits than any other non-UK EU country so that it can be
reasonably argued that outside of UK, Germany is the most important source of capital flows,
and perhaps remittances, from EU to India. This could be because of (a) A higher proportion
of high skilled Indian emigrants in Germany relative to other EU countries (b) A large
proportion of NRI deposits being held by companies owned by NRI’s rather than individual
NRI’s and (c) A higher emigrant workforce in Germany relative to France and Spain than
what is currently estimated in official statistics.
The RBI has not yet published NRI deposit data for Italy. In the absence of other information,
we estimate the figure for Italy to be around $ 300-500 million i.e. slightly higher than the
figure of France and Spain but substantially lower than that of Germany due to a relatively
lower skilled emigrant workforce. By a similar reasoning, other EU countries which host
Indian emigrants such as Ireland and Greece would have NRI deposits in the order of $ 50-
100 million.
Overall, two conclusions can be drawn from the data:
(a) Outside of UK, Germany constitutes the largest source of emigrant capital flows and
perhaps migrants’ remittances, from the EU to India.
(b) Since these flows largely enter FCNR deposits, they are more likely to be capital flows
than unrequited transfers or remittances.
15
Remittances from India to EU
Workers from Nepal and Bangladesh form the bulk of the immigrant workforce in India.
However, a growing number of high skilled expatriates from USA and Europe work in
technology hubs such as Bangalore or Hyderabad and in the financial hub of Mumbai.
According to newspaper reports, the number of expatriates in Bangalore has risen to 10,000,
most of them from USA and Europe.
Remittances outflows from India by way of ‘compensation of employees’ has increased from
$ 500 million in 2001 to over $ 1.5 billion between 2001 and 2010, presumably due to the
rise in high skilled expatriates working in India. If 10% to 30% of these flows are attributed
to expatriates from the EU, remittance outflows from India to the EU would lie in the range
of $150-500 million. However, these estimates are based only on informed guesswork and
should be treated with caution.
4. Conclusion
Remittance flows as unrequited transfers and emigrant capital flows substantially bolster
India’s balance of payments at the macro level and support household consumption plans and
investments choices at the micro level.
With remittance inflows of around $ 8 billion from the EU to India and outflows of less than
$ 500 million from India to the EU, the magnitude of net remittance flows from Europe to
India can be estimated to lie between $ 7- 9 billion, with a fair degree of accuracy. The high
magnitude of EU to India remittances, a figure that is 0.6 % of India’s GDP, highlights an
important contribution made by Indian emigrants in the EU to India. Indian emigrants in the
EU held over $ 8 billion worth NRI deposits or nearly 20% of the NRI deposits in the Indian
banking system signifying an important source of capital flow. Apart from UK, Germany is
an important source of emigrant capital flows, and perhaps remittance flows, to India.
In the foreseeable future, with growing emigration to the EU, remittance flows from EU to
India will continue to mark an important contribution to India’s disposable income.
16
Appendix 1: Measuring Migrants’ Remittances to India
Migrant’s financial flows to India are accounted in different parts of India’s Balance of Payments, prepared by the Reserve Bank of India (RBI). Generally, the Private Transfers statement in the Invisibles Section of the Current Account accounts for the bulk of these flows.
Today, the Private Transfers statement consists of 4 items: (a) Inward Remittances from Indian workers abroad for Family Maintenance, etc. (b) Local Withdrawals/Redemptions from Non Resident Indian (NRI) deposits (c) Personal gifts/donations to charitable/religious institutions in India (d) Gold and Silver brought through passenger baggage.
Item (a) refers to the direct flow of money sent to families back home and by way of repatriation of savings. Until 1998, the RBI would show a separate classification for ‘Receipts towards Family Maintenance’ and ‘Repatriation of Savings by Indian residents abroad.’ Since 1998, it clubbed both items (and a few marginal items) under the broad title of ‘Inward Remittance for Family Maintenance, etc.’ Prior to 1998, repatriation of savings generally formed over half of the flows under the subsequently clubbed category. The data is collected from banks under the International Transaction Reporting System (IRTS) as well as from a survey of unclassified receipts for small value transactions (Singh 2006). In Figure 1, the ‘Family Maintenance and Repatriation of Savings’ series relates to item (a) for the period post 1997 and the addition of the two components prior to 1997.
Item (c), Personal gifts/donations to charitable/religious institutions in India, could include migrants’ financial flows but there is no evidence to ascertain the volume attributable to migrants. The figures for this item compare well with those reported by the Home Ministry under the Foreign Contribution Regulation Act, 2010, in which case the ‘migrant’ component appears to be quite small. Before 1990, this item formed roughly 30% of Private Transfers inflows. However, its share has fallen to around 5% of Private Transfers inflows today, amounting to roughly $2 billion in 2010. This item is excluded in our estimate of migrants’ remittances.
Item (d), Gold and Silver brought through passenger baggage, was introduced in 1993, amounting to around $2 billion till 1998 and then abruptly falling to under $50 million in subsequent years. It represents the fallout of the liberalisation of gold imports in the early 90’s. As it distorts the trend and is of low significance today, this item is omitted in our estimate of migrants’ remittances.
Apart from direct flows, substantial financial flows occur through the medium of NRI banking deposits. The deposit facility was started in 1970, though RBI publishes data only post 1975. Item (b), ‘Local Withdrawals/Redemptions from NRI deposits’ was created in the Private Transfers statement only in 1997 to demarcate outflows from NRI deposits entering India against those going back abroad. Thus, money locally withdrawn or redeemed from rupee-NRI deposits are now shown as Capital Account outflows as well as Current Account inflows under the Private Transfers statement. This data is reported by Authorised Dealers or Banks to the RBI on a monthly basis (Singh 2006).
17
Apart from the Private Transfers statement, migrants’ financial flows are also reflected in the ‘Compensation of Employees’ account in the Invisibles section of the Current account, referring to ‘wages received by Indians working on foreign contracts.’ This captures financial flows of temporary migrants, working abroad for less than a year. This item was brought in the accounts only in 1999, growing from roughly $100 million in 2000 to a little under $1 billion in 2010.
Our estimate of Migrants’ Remittances = Family Maintenance and Repatriation of Savings + Local Withdrawals/Redemptions from NRI deposits + Compensation of Employees. For the Financial Year ending 2009, the figures read as $ 45,328 million = $ 23,886 million + $ 20,617 million + $ 825 million, respectively.
The following data sources are used to construct the times series shown in Figure 1:
Family Maintenance and Repatriation of Savings: From 1970 to 1989, RBI (1993) monograph, from 1990 to 1997, RBI (1999), for 1998 and 1999, RBI (2001), from 2000 to 2009, RBI (2010) and for 2010, RBI (2011a).
Local Withdrawals/Redemptions of NRI deposits: For 1997, it includes $3.4 billion as local redemptions from NRNRD type deposits plus the $1 billion India Development bonds transferred to Indian residents (RBI 1999). For 1998 and 1999, RBI (2001), for 2000 to 2009, RBI (2010) and for 2010, RBI (2011a).
Compensation of Employees: From 1999 to 2010, RBI (2011b).
The three types of flows are for financial years ending in March. For example, migrants’ remittances of $ 45,328 million in 2009 are to be interpreted as flows between April 2008 and March 2009. Wherever, the original figures were in Rupees, they were converted to USD using the exchange rate for the relevant year. Figures for 2009 are ‘revised’ while figures for 2010 are ‘partially revised.’ The time series post-1997 is more representative of migrants’ remittances as it incorporates the portion of NRI deposits entering India.
Figure 1 also shows total NRI deposits outstanding as of March in the given year, taken from RBI (1993) for the period up to 1990 and from RBI (2011b) for the period till 2010. In addition to these deposits, three 5-year diaspora bonds have been issued in the last two decades: India Development Bonds (1991) raising $ 1.6 billion, Resurgent India Bonds (1998) raising $ 4.32 billion and India Millenium Deposits (2000) raising over $ 5 billion. On maturity, a part of the investments were kept back in India as either transfer to residents or to NRI deposits. These are reflected in the total outstanding NRI deposits or as part of local withdrawals in the years of maturity.
Lastly, these figures report only official data. Prior to the mid 90’s, a significant part of migrants’ remittances operated through the informal hawala network in order to circumvent strict foreign exchange controls. Unofficial remittances, however, are likely to form a very small part of migrants’ remittances today, due to more liberal foreign exchange policies, better banking facilities and more efficient money transfer mechanisms.
18
Appendix 2: Source Regions for Migrants’ Remittances to India
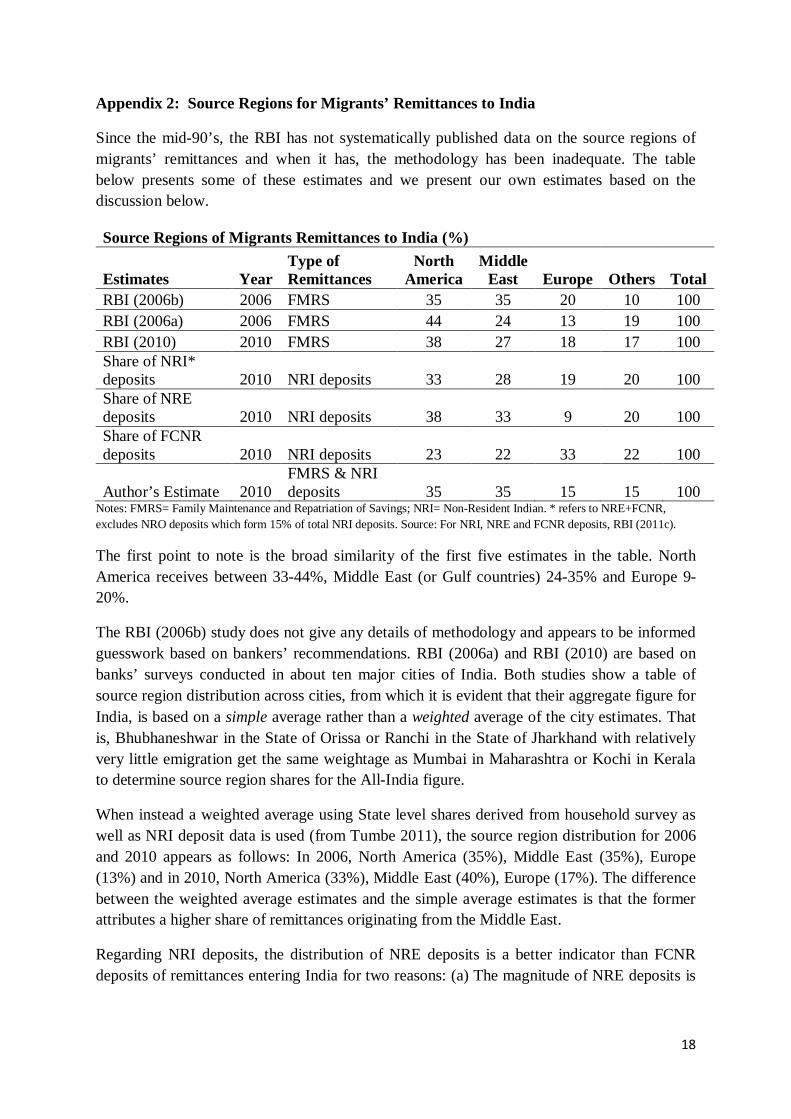
Since the mid-90’s, the RBI has not systematically published data on the source regions of migrants’ remittances and when it has, the methodology has been inadequate. The table below presents some of these estimates and we present our own estimates based on the discussion below.
Source Regions of Migrants Remittances to India (%)
Estimates Year Type of Remittances
North America
Middle East Europe Others Total
RBI (2006b) 2006 FMRS 35 35 20 10 100 RBI (2006a) 2006 FMRS 44 24 13 19 100 RBI (2010) 2010 FMRS 38 27 18 17 100 Share of NRI* deposits 2010 NRI deposits 33 28 19 20 100 Share of NRE deposits 2010 NRI deposits 38 33 9 20 100 Share of FCNR deposits 2010 NRI deposits 23 22 33 22 100
Author’s Estimate 2010 FMRS & NRI deposits 35 35 15 15 100
Notes: FMRS= Family Maintenance and Repatriation of Savings; NRI= Non-Resident Indian. * refers to NRE+FCNR, excludes NRO deposits which form 15% of total NRI deposits. Source: For NRI, NRE and FCNR deposits, RBI (2011c).
The first point to note is the broad similarity of the first five estimates in the table. North America receives between 33-44%, Middle East (or Gulf countries) 24-35% and Europe 9-20%.
The RBI (2006b) study does not give any details of methodology and appears to be informed guesswork based on bankers’ recommendations. RBI (2006a) and RBI (2010) are based on banks’ surveys conducted in about ten major cities of India. Both studies show a table of source region distribution across cities, from which it is evident that their aggregate figure for India, is based on a simple average rather than a weighted average of the city estimates. That is, Bhubhaneshwar in the State of Orissa or Ranchi in the State of Jharkhand with relatively very little emigration get the same weightage as Mumbai in Maharashtra or Kochi in Kerala to determine source region shares for the All-India figure.
When instead a weighted average using State level shares derived from household survey as well as NRI deposit data is used (from Tumbe 2011), the source region distribution for 2006 and 2010 appears as follows: In 2006, North America (35%), Middle East (35%), Europe (13%) and in 2010, North America (33%), Middle East (40%), Europe (17%). The difference between the weighted average estimates and the simple average estimates is that the former attributes a higher share of remittances originating from the Middle East.
Regarding NRI deposits, the distribution of NRE deposits is a better indicator than FCNR deposits of remittances entering India for two reasons: (a) The magnitude of NRE deposits is
19
nearly double that of FCNR deposits and (b) Only withdrawals/ redemptions from rupee deposits are counted as unrequited transfers in the Indian Balance of Payments.
Taking due note of these considerations, the estimated source region distribution is as follows: North America (35%), Middle East (35%), Europe (15%) and Others (15%).
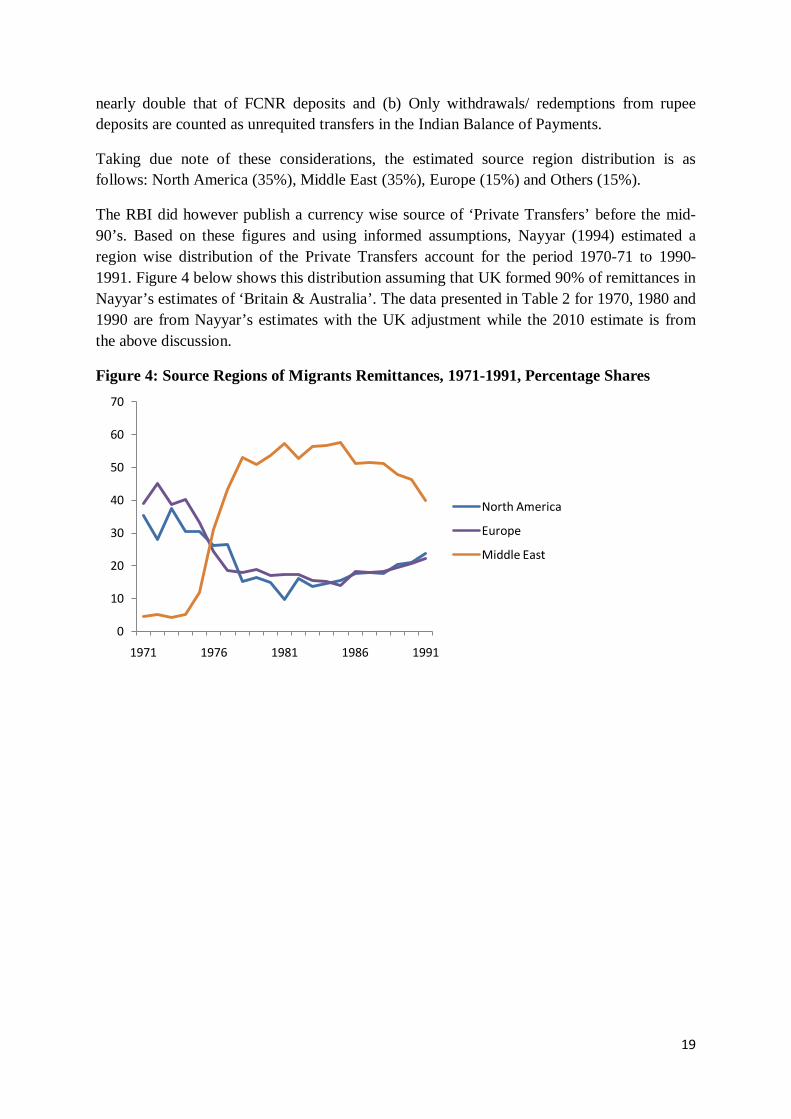
The RBI did however publish a currency wise source of ‘Private Transfers’ before the mid-90’s. Based on these figures and using informed assumptions, Nayyar (1994) estimated a region wise distribution of the Private Transfers account for the period 1970-71 to 1990-1991. Figure 4 below shows this distribution assuming that UK formed 90% of remittances in Nayyar’s estimates of ‘Britain & Australia’. The data presented in Table 2 for 1970, 1980 and 1990 are from Nayyar’s estimates with the UK adjustment while the 2010 estimate is from the above discussion.
Figure 4: Source Regions of Migrants Remittances, 1971-1991, Percentage Shares
0
10
20
30
40
50
60
70
1971 1976 1981 1986 1991
North America
Europe
Middle East
20
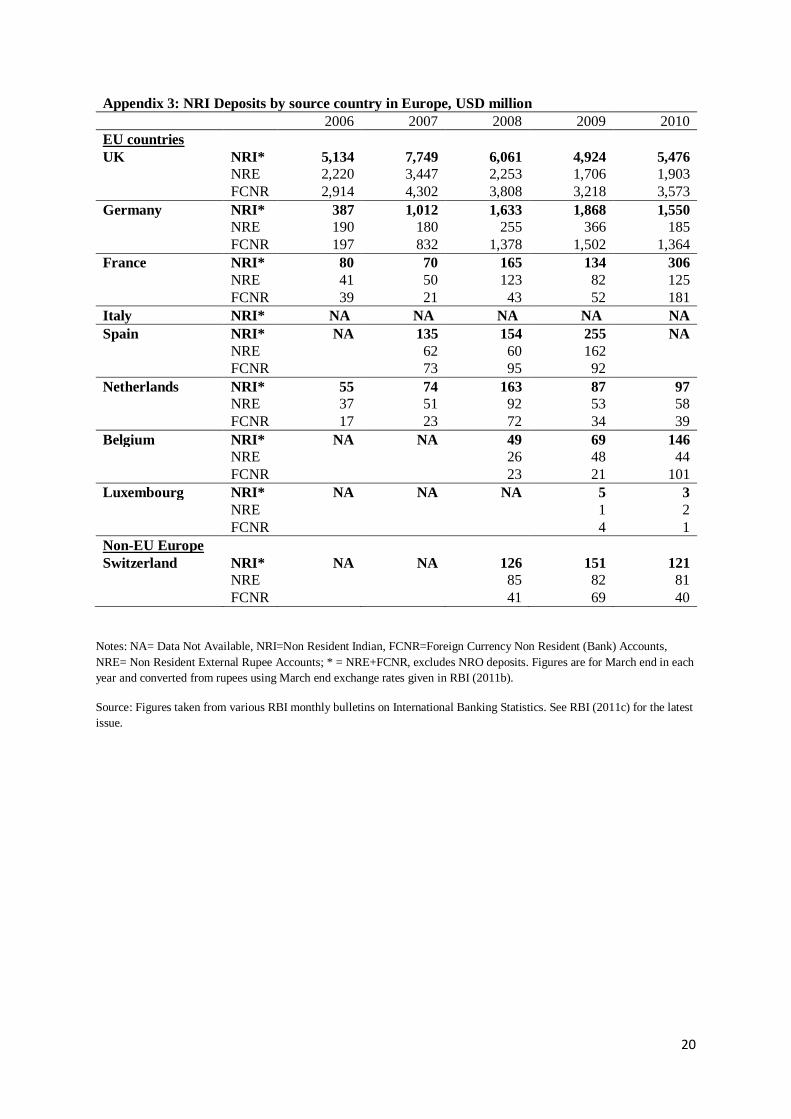
Appendix 3: NRI Deposits by source country in Europe, USD million 2006 2007 2008 2009 2010 EU countries
UK NRI* 5,134 7,749 6,061 4,924 5,476
NRE 2,220 3,447 2,253 1,706 1,903
FCNR 2,914 4,302 3,808 3,218 3,573 Germany NRI* 387 1,012 1,633 1,868 1,550
NRE 190 180 255 366 185
FCNR 197 832 1,378 1,502 1,364 France NRI* 80 70 165 134 306
NRE 41 50 123 82 125
FCNR 39 21 43 52 181 Italy NRI* NA NA NA NA NA Spain NRI* NA 135 154 255 NA
NRE
62 60 162
FCNR 73 95 92 Netherlands NRI* 55 74 163 87 97
NRE 37 51 92 53 58
FCNR 17 23 72 34 39 Belgium NRI* NA NA 49 69 146
NRE
26 48 44
FCNR 23 21 101 Luxembourg NRI* NA NA NA 5 3
NRE
1 2
FCNR 4 1 Non-EU Europe
Switzerland NRI* NA NA 126 151 121
NRE
85 82 81
FCNR 41 69 40
Notes: NA= Data Not Available, NRI=Non Resident Indian, FCNR=Foreign Currency Non Resident (Bank) Accounts, NRE= Non Resident External Rupee Accounts; * = NRE+FCNR, excludes NRO deposits. Figures are for March end in each year and converted from rupees using March end exchange rates given in RBI (2011b).
Source: Figures taken from various RBI monthly bulletins on International Banking Statistics. See RBI (2011c) for the latest issue.
21
List of References
Eurostat (2007). “Remittance flows to and from the EU.” Eurostat Methodologies and Working Papers. Office for Official Publications of the European Communities, 2007, Luxembourg.
Martin, S. J., Jorgensen, N. and Labeaga, J.M. (2007). “The Volume and Geography of Remittances from the EU.” European Commission.
MOIA (2010). “Population of Overseas Indians.” Ministry of Overseas Indian Affairs, http://moia.gov.in/writereaddata/pdf/NRISPIOS-Data.pdf. Accessed on September 20, 2011.
Gupta, P and Gordon, J (2004). “NRI Deposits in India: Trends and Determinants.” Economic & Political Weekly. 39 (37), 4165-4174.
Nayyar, D. (1994). “Migration, Remittances and Capital Flows: The Indian Experience.” Oxford University Press, Delhi.
ONS (2011). “Population by Country of Birth and Nationality Jan 10-Dec 10. Office of National Statistics, UK. http://www.ons.gov.uk/ons/taxonomy/index.html?nscl=International+Migration. Accessed on September 25, 2011.
RBI (1993). “India’s Balance of Payments 1948-49 to 1988-89.” Monograph. Department of Economic Analysis and Policy. Reserve Bank of India. Bombay.
RBI (1999). “Invisibles in India’s Balance of Payments: 1989-90 to 1996-97.” April Bulletin. Reserve Bank of India, Mumbai.
RBI (2001). “Invisibles in India’s Balance of Payments: 1997-98 to 1999-2000.” January Bulletin. Reserve Bank of India, Mumbai.
RBI (2006a). “Invisibles in India’s Balance of Payments.” November Bulletin. Reserve Bank of India, Mumbai.
RBI (2006b). “Report of the Working Group on Cost of NRI Remittances.” May 2006. Reserve Bank of India, Mumbai.
RBI (2009). “Composition and Ownership Pattern of Deposits with Scheduled Commercial Banks: March 2008.” November Bulletin. Reserve Bank of India, Mumbai.
RBI (2010). “Invisibles in India’s Balance of Payments: An Analysis of Trade in Services, Remittances and Income.” March Bulletin. Reserve Bank of India, Mumbai.
RBI (2011a). “Developments in India’s Balance of Payments during Third Quarter (October-December) of 2010-11: Trade, Invisibles and Capital Account.” May Bulletin. Reserve Bank of India, Mumbai. RBI (2011b). “Handbook of Statistics on Indian Economy 2010-11.” Reserve Bank of India, Mumbai. RBI (2011c). “International Banking Statistics of India: June and September 2010.” April Bulletin. Reserve Bank of India, Mumbai. Singh, B (2006). “Cross-Border Workers’ Remittances : Transmission Channels and Measurement Issues in India.” Paper for the First Meeting of the Luxembourg Group on Remittance Statistics. Available online at http://mpra.ub.uni-muenchen.de/12145. Accessed on December 25, 2011.

22
Tumbe, C. (2011). “Remittances in India: Facts and Issues.” The Indian Journal of Labour Economics, 54 (3), 479-501. USA Census Bureau (2010). “Place of Birth of the Foreign-Born Population: 2009.” American Community Survey Briefs. http://www.census.gov/population/foreign/. Accessed on September 25, 2011. World Bank (2011). “Migration and Remittances Factbook 2011.” The World Bank, Washington DC.