Embed Size (px)
Citation preview

PUBLIC SECTOR
EU Funds in Central and Eastern
Europe 2011
kpmg.com/cee

© 2012 KPMG Central and Eastern Europe Ltd., a limited liability company and a member firm of the KPMG network of independent member firms affiliated with KPMG International Cooperative (“KPMG International”), a Swiss entity. All rights reserved. Designed by KPMG in Poland.
2 | Section or Brochure name

© 2012 KPMG Central and Eastern Europe Ltd., a limited liability company and a member firm of the KPMG network of independent member firms affiliated with KPMG International Cooperative (“KPMG International”), a Swiss entity. All rights reserved. Designed by KPMG in Poland.
Table of contentsIntroduction
Foreword 4
EU Funds covered by this document 5
Definitions 6
General approach 7
Basic information 8
Progress of EU funds implementation (31 December 2011) 9
Contracted and payment ratios 10
Implementation of EU Funds for 2007-11 by intervention type 11
Summary of findings 13
Summary 14
Country overviews
Bulgaria 16
Czech Republic 18
Estonia 20
Hungary 22
Latvia 24
Lithuania 26
Poland 28
Romania 30
Slovakia 32
Slovenia 34
EU Funds in Central and Eastern Europe 2011 | 3

4 | EU Funds in Central and Eastern Europe 2011
© 2012 KPMG Central and Eastern Europe Ltd., a limited liability company and a member firm of the KPMG network of independent member firms affiliated with KPMG International Cooperative (“KPMG International”), a Swiss entity. All rights reserved. Designed by KPMG in Poland.
Foreword
EU Funds in Central and Eastern Europe – Progress report 2007-11, has been compiled by KPMG’s Public Sector team in Central & Eastern Europe (CEE) based on the input gathered from all KPMG practices within the Region which are present and operate in the Member States.
Since CEE region countries joined the European Union in 2004 and in 2007, it has become apparent that effective utilisation of EU support offers the opportunity to foster the success of their economic performance. Accordingly, the responsibility of the Member States includes the utilisation of the offered support in an appropriate manner thus enhancing the level of cohesion.
Developing an appropriate, focused strategy for the allocation of EU funds constitutes the first element only, though at the same time constituing the basic step in the implementation of the EU cohesion policy. The successful implementation and absorption of EU funds is contingent not only upon the effectiveness the Member States’ administrative systems, but also with regards to the activity of the potential beneficiaries.
The purpose of this report is to provide an overview of the progress of the National Strategic Reference Frameworks in the second period of the programming period 2007-13. It is the time during which all Member States are in the process of preparation of plans for the upcoming programming period of 2014-2020. Successes and experiences from the current programming period constitute a good foundation and source of knowledge for the every country. Drawing appropriate conclusions from the gathered experiences should be applied in the process of drawing up strategies thus also to be able to prove to the European Union that the given Member State will consume the funds in a more productive manner within the upcoming European Union financial perspective.
We believe that this report will assist stakeholders in the process of elaboration of a comprehensive picture of the status of implementation within the every CEE country as well as within the whole Region and that will be applied as the supporting ground for the elaboration of future strategies.
The hereby publication was prepared between the period of March-June 2012, involving 10 KPMG practices in CEE. We would like to thank all those who provided country level inputs and constituted the part of the whole process.

EU Funds in Central and Eastern Europe 2011 | 5
© 2012 KPMG Central and Eastern Europe Ltd., a limited liability company and a member firm of the KPMG network of independent member firms affiliated with KPMG International Cooperative (“KPMG International”), a Swiss entity. All rights reserved. Designed by KPMG in Poland.
Introduction
This document introduces Community co-financed programmes covered by each Member State’s National Strategic Reference Framework. Therefore, within the framework of this document, we concentrate on the implementation of Operational Programmes co-financed by the following Structural Funds:
European Regional Development Fund (ERDF)
The ERDF aims to promote economic and social cohesion by addressing main regional imbalances and participating in the development and conversion of regions, while ensuring synergy with assistance from other Structural Funds.
• Investment which contributes to creating sustainable jobs
• Investment in infrastructure
• Support for local and regional investments (SMEs, R&D, information society, etc.)
• Financial instruments (JEREMIE, JESSICA, JASPERS, JASMINE)
• Investment in education and health
Cohesion Fund (CF)
The purpose of the CF is to co-finance actions in the fields of environment and transport infrastructure of common interest, with a view to promote economic and social cohesion and solidarity among Member States.
• Investment in major infrastructure projects (e.g. TEN-T)
• Investment in major environmental projects
• Support renewable energy
• Investment in sustainable transport
European Social Fund (ESF)
The ESF has been set up to reduce differences in prosperity and living standards across EU Member States and regions. In order to promote employment conditions, the ESF supports companies so that they are equipped better to face new challenges.
• Improving human resources
• Increasing the adaptability of workers and firms, enterprises and entrepreneurs
• Improving access to employment and sustainability
• Improving the social inclusion of less-favored persons
• Strengthening institutional capacity at national, regional and local levels
• Mobilization for reforms in the fields of employment and inclusion

6 | EU Funds in Central and Eastern Europe 2011
© 2012 KPMG Central and Eastern Europe Ltd., a limited liability company and a member firm of the KPMG network of independent member firms affiliated with KPMG International Cooperative (“KPMG International”), a Swiss entity. All rights reserved. Designed by KPMG in Poland.
Available budget 2007-13
“Available budget 2007-13” is the sum of EU co-financing and national public contribution (i.e. the amount accessible for applicants or potential beneficiaries). This budget had been set in each country’s National Strategic Reference Framework and has been approved by the European Commission.
Contracted grants
Contracted grants are the amounts for which the contract has been signed by the competent authority (Managing Authority or Intermediary/Implementing Body) and the final beneficiary by 31 December 2011. The amount of contracted grants includes the EU co-financing and national public contribution together.
Paid grants
Paid grants are the amount of grants (including advance payments) which have been disbursed to the final beneficiaries by 31 December 2011. The amount of paid grants includes the EU co-financing and national public contribution together.
Contracted ratio
Contracted ratio equals the amount of contracted grants until the end of 2011, divided by the budget available for 2007-13.
Payment ratio
Payment ratio equals the amount of actual paid grants until the end of 2011, divided by the budget available for 2007-13.
Intervention type
Intervention types used in this presentation are not based on any official classification; they rather provide a useful tool that is based on generally applied terms (such as transport or healthcare).
Countries covered by this presentation:
• Bulgaria
• Czech Republic
• Estonia
• Hungary
• Latvia
• Lithuania
• Poland
• Romania
• Slovakia
• Slovenia
Population of the CEE region (2011) 101.8 million
Annual GDP of the CEE region (2011) EUR 937.9 billion
GDP per capita of the CEE region (2011) EUR 9,214
Definitions

EU Funds in Central and Eastern Europe 2011 | 7
© 2012 KPMG Central and Eastern Europe Ltd., a limited liability company and a member firm of the KPMG network of independent member firms affiliated with KPMG International Cooperative (“KPMG International”), a Swiss entity. All rights reserved. Designed by KPMG in Poland.
Objectives
• Providing an overview of basic CEE country information
• Aggregating data for EU funds and available budget in CEE countries for the period of 2007-13
• Presenting contracted and paid grants as well as contracted and payment ratios achieved in implementation of EU funds during 2007-11
General approach
• All data included in this section are based on individual, publicly available information at the national level, derived from CEE countries that are covered in this report
• GDP and population data are taken from the Eurostat database
• Country figures have been collected by local KPMG practices
• Amounts of financial resources originate from the financial table of the related framework programmes of 2007-13, which are approved by the European Commission
• Variation of exchange rates may impinge on the actual values of contracted and paid grants regarding those Member States which are still not part of the euro zone
General approach

8 | EU Funds in Central and Eastern Europe 2011
© 2012 KPMG Central and Eastern Europe Ltd., a limited liability company and a member firm of the KPMG network of independent member firms affiliated with KPMG International Cooperative (“KPMG International”), a Swiss entity. All rights reserved. Designed by KPMG in Poland.
During the period of 2007-13, 10 CEE countries have access to nearly EUR 210 billion from mainstream programmes co-financed from the ERDF, CF and ESF.
On an annual basis, this amount is 3.2% of the annual GDP of the region, according to 2011 Eurostat data.
Division by country
The amount of allocated EU funds varies by country; the most is allocated for Poland, which has the biggest population among the CEE countries. However, the highest EU fund per capita is in the Czech Republic and Estonia
40%
15%
14%
11%
6%
4%
4%2% 2% 2%
Poland
Czech Republic
Hungary
Romania
Slovakia
Bulgaria
Lithuania
Latvia
Slovenia
Estonia
Bul
garia
Cze
ch
Rep
ub
lic
Est
on
ia
Hu
nga
ry
Latv
ia
Lith
uan
ia
Pola
nd
Ro
man
ia
Slo
vaki
a
Slo
ven
ia
CE
E to
tal
"Population* (million)"
7.4 10.5 1.3 10.0 2.2 3.2 38.2 21.4 5.4 2.1 101.8
"Annual GDP* (bn EUR)"
38.5 154.7 15.3 95.5 19.1 28.6 363.6 119.0 67.5 36.2 937.9
"GDP per capita (EUR)"
5,225 14,684 11,405 9,564 8,589 8,827 9,518 5,555 12,410 17,644 9,214
"Available budget 2007-13 (million EUR)"
8,019 30,771 4,108 29,319 4,941 7,431 82,872 23,251 13,600 4,825 209,138
Available budget 2007-13
Source: Eurostat, 2011
Total available budget in CEE 2007-13 EUR 209.1 billion
Available budget in CEE 2007-13 per capita EUR 2,055
Available budget in CEE per GDP 3.2%
Total contracted grants 2007-11 EUR 139.9 billion
Contracted grants per capita EUR 1,374
Total paid grants 2007-11 EUR 60.8 billion Paid grants per capita EUR 598
Basic information

EU Funds in Central and Eastern Europe 2011 | 9
© 2012 KPMG Central and Eastern Europe Ltd., a limited liability company and a member firm of the KPMG network of independent member firms affiliated with KPMG International Cooperative (“KPMG International”), a Swiss entity. All rights reserved. Designed by KPMG in Poland.
In the period of 2007–13, EUR 209.1 billion in total, including national public contribution, may be spent on the improvement of economic and social cohesion. The budgets have been set according to different considerations among the Member States through their National Strategic Regional Framework Programmes.
Out of the total allocation, the beneficiaries in the 10 CEE countries have committed EUR 139.9 billion, which is the two-thirds of the total available budget (2007-13).
* EU co-financing + national public contribution after any reallocations
Regarding payments, by the end of 2011 more than 43% of the contracted grants i.e. EUR 60.8 billion were distributed to the beneficiaries
Top performers Estonia, Latvia
Above average performers Bulgaria, Lithuania, Czech Republic
Below average performers Slovakia, Slovenia, Poland, Hungary, Romania
0
500
1,000
1,500
2,000
2,500
3,000
3,500
0 1,000 2,000 3,000 4,000
BG
CZ
EE
HU
LT
LV
PL
RO
SK
SI
Available budget 2007 - 2013 per capita (EUR)
Con
trac
ter
gra
nts
per
capi
ta (E
UR
)
Progress of EU funds implementation(31 December 2011)
Operational Programmes
Available budget* 2007-13
Contracted grants*
Paid grants* Contracted grants / capita
Payment / capita
mEUR mEUR mEUR EUR EUR
Bulgaria 8,019 6,333 1,516 860 206
Czech Republic 30,771 22,202 11,862 2,108 1,126
Estonia 4,108 3,859 1,805 2,879 1,347
Hungary 29,319 18,837 8,337 1,886 835
Latvia 4,941 4,277 2,151 1,918 965
Lithuania 7,431 5,799 3,232 1,787 996
Poland 82,872 52,440 23,097 1,373 605
Romania 23,251 14,610 3,152 682 147
Slovakia 13,600 8,661 3,842 1,593 707
Slovenia 4,825 2,858 1,849 1,394 902
TOTAL 209,138 139,875 60,844 1,374 598

10 | EU Funds in Central and Eastern Europe 2011
© 2012 KPMG Central and Eastern Europe Ltd., a limited liability company and a member firm of the KPMG network of independent member firms affiliated with KPMG International Cooperative (“KPMG International”), a Swiss entity. All rights reserved. Designed by KPMG in Poland.
Contracted ratio
After five years of implementation, 10 CEE countries have contracted altogether 67% of their budget allocated for the 7-year programming period. Considering the fact that the budget should be committed by the end of 2013, this ratio is rather low.
Regarding the order, the three Baltic countries occupy first three positions, with Estonia’s contracted ratio closest to 100 percent, whereas Bulgaria displays the biggest increase by 79% of contracted ratio.
Payment ratio
The overall CEE level payment ratio is 29%, which is quite low on a time proportional basis.
As regards the payment, the three Baltic countries i.e. Estonia, Latvia and Lithuania take the lead: their payment ratio exceeds 40%.
Half of the CEE countries (Czech Republic, Slovenia, Hungary, Slovakia and Poland) paid between 28 and 39% of their available budget. While, the Romanian and Bulgarian ratios have increased slightly since the last year and both show values under 20%.
67%
29%
* Data regarding 2010 for Estonia have been revised
Contracted and payment ratios
(2010) * (2009) (2008)
1 Estonia 94% 80% 48% 11%
2 Latvia 87% 67% 45% 0%
3 Bulgaria 79% 37% 24% 11%
4 Lithuania 78% 76% 47% 18%
5 Czech Republic 72% 56% 28% 16%
6 Hungary 64% 51% 38% 20%
7 Slovakia 64% 56% 24% 12%
8 Poland 63% 53% 25% 3%
9 Romania 63% 45% 16% 5%
10 Slovenia 59% 48% 34% 23%
CEE average 53% 28% 9%
(2010)* (2009)
1 Estonia 44% 29% 11%
2 Latvia 44% 29% 15%
3 Lithuania 43% 30% 14%
4 Czech Republic 39% 26% 9%
5 Slovenia 38% 27% 15%
6 Hungary 28% 16% 9%
7 Slovakia 28% 17% 5%
8 Poland 28% 16% 6%
9 Bulgaria 19% 10% 3%
10 Romania 14% 7% 3%
CEE average 17% 7%

EU Funds in Central and Eastern Europe 2011 | 11
© 2012 KPMG Central and Eastern Europe Ltd., a limited liability company and a member firm of the KPMG network of independent member firms affiliated with KPMG International Cooperative (“KPMG International”), a Swiss entity. All rights reserved. Designed by KPMG in Poland.
Implementation of EU funds for 2007-11 by intervention type
The amounts of available budget and contracted grants by intervention type vary as follows:
* In Latvia energy interventions include environment related resources
Contracted grants 2007-11 (EUR million)
Available budget* 2007 - 2013
Intervention type Bulgaria Czech Republic
Estonia Hungary Latvia* Lithuania Poland Romania Slovakia Slovenia Total
Enviroment 1,754 4,895 839 4,342 0 1,242 8,594 5,437 2,084 645 29,832
Transport 1,938 8 ,532 729 7,670 1,491 1,106 30,327 6,452 3,979 984 63,207
Healthcare 0 0 221 1,685 844 0 658 0 285 0 3,693
Human resource development
1,165 3,851 666 1,370 328 1,023 12,669 4,615 2,347 1,040 29,074
Energy 0 1,209 73 407 1,073 603 3,144 726 199 188 7,622
Economic development
1,325 4,279 679 4,997 292 911 10,447 2,845 1,283 1,046 28,104
Public sector 174 1,458 0 4,568 24 725 611 235 916 114 8,825
TA 314 1,179 81 1,331 111 220 2,637 906 459 104 7,340
Innovations, R&D 0 3,395 365 991 455 603 10,666 646 1,384 704 19,210
Settlement development
1,349 1,973 457 1,957 323 999 3,117 1,391 664 0 12,230
CEE total 8,019 30,771 4,108 29,319 4,941 7,431 82,872 23,251 13,600 4,825 209,138
Contracted grants
Intervention type Bulgaria Czech Republic
Estonia Hungary Latvia* Lithuania Poland Romania Slovakia Slovenia Total
Enviroment 1,030 1,205 746 2,490 0 1,117 5 ,753 4,402 1,401 127 18,271
Transport 2,408 8,005 670 5,697 1,336 713 17,770 3,250 1,979 322 42,152
Healthcare 0 0 223 1,120 804 0 553 0 286 0 2,986
Human resource development
755 3,057 620 982 306 759 9,102 3,763 2,023 775 22,142
Energy 0 649 74 238 809 511 1,076 102 158 63 3,680
Economic development
821 3,172 788 3,700 268 725 7,321 1,522 680 677 19,673
Public sector 103 1 078 0 2,027 26 637 343 108 385 104 4 811
TA 185 691 40 1,049 91 93 1,234 218 386 101 4,088
Innovations, R&D 0 2,783 317 354 345 441 7,241 443 852 688 13,465
Settlement development
1,032 1,563 381 1178 290 802 2,047 802 512 0 8,607
CEE total 6,333 22,202 3,859 18,837 4,277 5,799 52,440 14,610 8,661 2,858 139,875
* In Latvia energy interventions include environment related resources
Implementation of EU Funds for 2007 – 2011 by intervention type
12 | EU Funds in Central and Eastern Europe 2011
© 2012 KPMG Central and Eastern Europe Ltd., a limited liability company and a member firm of the KPMG network of independent member firms affiliated with KPMG International Cooperative (“KPMG International”), a Swiss entity. All rights reserved. Designed by KPMG in Poland.
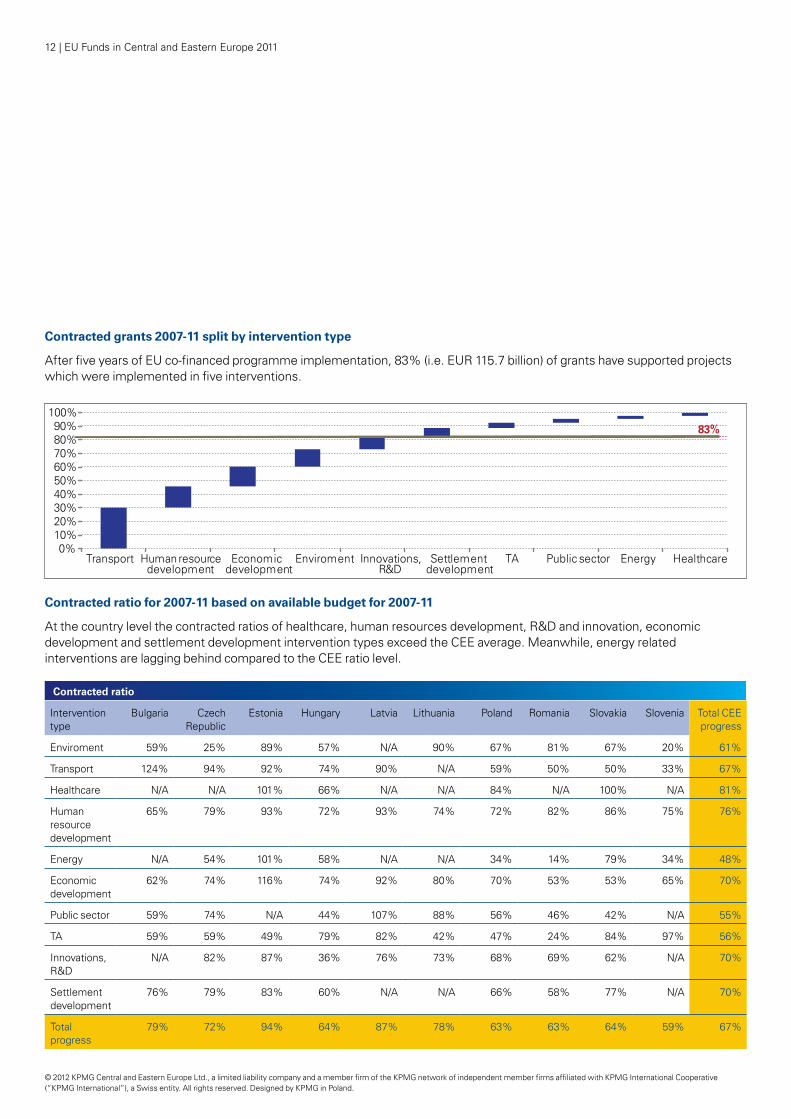
Contracted grants 2007-11 split by intervention type
After five years of EU co-financed programme implementation, 83% (i.e. EUR 115.7 billion) of grants have supported projects which were implemented in five interventions.
0%10%20%30%40%50%60%70%80%90%
100%
Transport Human resource development
Economic development
Enviroment Innovations, R&D
Settlement development
TA Public sector Energy Healthcare
83%
Contracted ratio for 2007-11 based on available budget for 2007-11
At the country level the contracted ratios of healthcare, human resources development, R&D and innovation, economic development and settlement development intervention types exceed the CEE average. Meanwhile, energy related interventions are lagging behind compared to the CEE ratio level.
Contracted ratio
Intervention type
Bulgaria Czech Republic
Estonia Hungary Latvia Lithuania Poland Romania Slovakia Slovenia Total CEE progress
Enviroment 59% 25% 89% 57% N/A 90% 67% 81% 67% 20% 61%
Transport 124% 94% 92% 74% 90% N/A 59% 50% 50% 33% 67%
Healthcare N/A N/A 101% 66% N/A N/A 84% N/A 100% N/A 81%
Human resource development
65% 79% 93% 72% 93% 74% 72% 82% 86% 75% 76%
Energy N/A 54% 101% 58% N/A N/A 34% 14% 79% 34% 48%
Economic development
62% 74% 116% 74% 92% 80% 70% 53% 53% 65% 70%
Public sector 59% 74% N/A 44% 107% 88% 56% 46% 42% N/A 55%
TA 59% 59% 49% 79% 82% 42% 47% 24% 84% 97% 56%
Innovations, R&D
N/A 82% 87% 36% 76% 73% 68% 69% 62% N/A 70%
Settlement development
76% 79% 83% 60% N/A N/A 66% 58% 77% N/A 70%
Total progress
79% 72% 94% 64% 87% 78% 63% 63% 64% 59% 67%

EU Funds in Central and Eastern Europe 2011 | 13
© 2012 KPMG Central and Eastern Europe Ltd., a limited liability company and a member firm of the KPMG network of independent member firms affiliated with KPMG International Cooperative (“KPMG International”), a Swiss entity. All rights reserved. Designed by KPMG in Poland.
Implementation progress 2007-11 by country
During the five years of implementation of the 2007 – 2013 programming period, EUR 139.9 billion worth of grants have been contracted by the 10 CEE countries. This amount is 67% of the total available budget allocated for 2007 – 2013 period.
Until the end of 2011, EUR 60.8 billion (i.e. 29%) of the available budget and 43% of the contracted grants were distributed to beneficiaries.
Implementation progress 2007-11 by intervention type
By the end of 2011, most intervention types performed around average contracted ratio between 48% and 81%.
The majority of grants, EUR 102,24 billion, i.e. 73% of total contracted grants, have been contracted for transport, human resources development, economic development and environment related projects.
516
3
13
34
37
10
6 2Bulgaria
Czech Republic
Estonia
Hungary
Latvia
Lithuania
Poland
Romania
Slovakia
Slovenia
33
67
grants to be contracted
contracted grants
0% 20% 40% 60% 80% 100%
B…
C…
E…
H…
LV
LT
PL
R…
S…
SI Enviroment
Transport
Human resource development
Economic development
Innovations, R&D
Other
0% 20% 40% 60% 80% 100%
Estonia
Latvia
Lithuania
Czech Republic
Slovenia
Hungary
Slovakia
Bulgaria
Romania
Poland
Contracted ratio
Payment ratio
29% 67%
Contracted grants by country
Contracted and payment ratio, 2007-11
Summary of findings

14 | EU Funds in Central and Eastern Europe 2011
© 2012 KPMG Central and Eastern Europe Ltd., a limited liability company and a member firm of the KPMG network of independent member firms affiliated with KPMG International Cooperative (“KPMG International”), a Swiss entity. All rights reserved. Designed by KPMG in Poland.
Effectiveness of use of EU funds.
The year 2011 is the fifth year of this financial perspective, i.e. 71.5 percent of time to contract them has passed. When comparing the contracting ratio of individual countries to the CEE average, two groups of beneficiaries may be distinguished: these, where contracting ratio is above that limes and five countries below that level: Hungary, Slovakia, Poland, Romania and Slovenia. Interestingly, it is difficult to find common characteristics of them: they are small and large, with good, moderate or poor economic situation, belonging to the first or second wave of EU members from the CEE region.
More homogenous analysis comes from comparison of the payment ratio. Assuming that the first year of new perspective is intended for contracting only, and then two following years for projects realization, then only 2010 is the first year when we can expect higher payment ratio (see table on previous slide), then we could expect this ratio to be around 50% now. None of the counties has achieved this level, but leaders are the Baltic countries (44 or 43%), followed closely by Czech Republic (39%) and Slovenia (38%). Few countries are slightly below 30% (Hungary, Poland and Slovakia –28% each), and Bulgaria and Romania far behind (below 20%). The last two countries are experiencing this financial perspective for the first time and since it is a process of learning by beneficiaries and implementing agencies, their position is understandable
to some extent. In case of Hungary, Poland and Slovakia, the problems are more complicated, as the low payment ratio goes with low contracting ratio, while these countries should be expected to have already learned all pre-accession and EU funds over last 17 years.
In Hungary, the lowest contracting and payment ratio measures are: environment and energy; social renewal and electronic public administration. In Poland, contracting of all OP is below expected level, in particular Infrastructure and Environment; payment of Infrastructure and Environment and Innovative Economy is also below (in that case, mainly a measure for e-administration is pushing the ratio down). In Slovakia, the lowest one is the Information Society OP but also Transport, Education and Research & Development OP are on unsatisfactory levels.
We have not performed any in-depth research in case of these OP which are in the lowest ranks of implementation, but based on our experience and public information, we may conclude that problems in using the funds for infrastructural, environmental, e-administration and R&D goals may result from:
• poor feasibility study development;
• limited number of good concepts how these funds may be used, and
• poor project management skills, including poor procurement practices.
HUNGARY Contracted Payment
Environment & Energy
57% 11%
Social renewal 42% 28%
Social infrastructure
71% 26%
Electronic public
administration
49% 28%
Regional 64% 40%
POLAND Contracted Payment
Infrastructure & Environment
59% 20%
Human capital 69% 41%
Innovative economy
70% 25%
Regional 65% 36%
SLOVAKIA Contracted Payment
Transport 50% 23%
Environment 68% 25%
Research & Development
61% 24%
Information society
29% 9%
Education 51% 20%
*red numbers mean that contracting / payment ratio for given measure in the country are below the expected level for CEE
Summary

15 | EU Funds in Central and Eastern Europe 2011
Country overviews
© 2012 KPMG Central and Eastern Europe Ltd., a limited liability company and a member firm of the KPMG network of independent member firms affiliated with KPMG International Cooperative (“KPMG International”), a Swiss entity. All rights reserved. Designed by KPMG in Poland.

16 | EU Funds in Central and Eastern Europe 2011
© 2012 KPMG Central and Eastern Europe Ltd., a limited liability company and a member firm of the KPMG network of independent member firms affiliated with KPMG International Cooperative (“KPMG International”), a Swiss entity. All rights reserved. Designed by KPMG in Poland.
BulgariaFor the 2007-13 programming period, Bulgaria’s National Strategic Reference Framework was launched, covering seven Operational Programmes with EUR6.67 billion contribution from the ERDF, CF and ESF.
Complemented by national public contribution, the total budget of the framework programme amounts to EUR8 billion.
By the end of 2011, the beneficiaries in Bulgaria signed contracts for EUR 6.3 billion, which is the four-fifths of the total available budget. Out of this amount, EUR 1.5 billion was paid to the beneficiaries, which accounts for the one -fifth of the contracted grants and 19% of the total available budget.
As a result of the implementation, the contracted grants per capita in Bulgaria equal to EUR 860, while the paid grants per capita are considerably lower, with only EUR 206 per capita.
-
1 000
2 000
3 000
4 000
5 000
6 000
7 000
8 000
9 000
Available budget 2007 -13
Contracted grants Paid grants
mEU
R
Population 7.4 million
GDP per capita in 2011 EUR 5,225
Available budget 2007-13 EUR 8 billion
Contracted grants EUR 6.3 billion
Contracted ratio 79%
Paid grants EUR 1.5 billion
Payment ratio 19%
Progress of EU funds
Contracted ratio: 79%
Payment ratio: 19%

EU Funds in Central and Eastern Europe 2011 | 17
© 2012 KPMG Central and Eastern Europe Ltd., a limited liability company and a member firm of the KPMG network of independent member firms affiliated with KPMG International Cooperative (“KPMG International”), a Swiss entity. All rights reserved. Designed by KPMG in Poland.
The progress of the implementation of seven Bulgarian Operational Programmes by the end of 2011 is presented in the following table:
* ERDF, ESF or CF + national public contribution altogether
Operational Programmes Available budget* 2007-13 Contracted grants* Paid grants*
mEUR mEUR mEUR
Regional Development OP 1,601 1,176 324
Development of the Competitiveness of the Bulgarian Economy OP
1,162 728 272
Environment OP 1,801 1,054 205
Transport OP 2,003 2,441 454
Human Resources Development OP 1,214 797 197
Administrative Capacity OP 181 108 51
Technical Assistance OP 57 29 13
Total 8,019 6,333 1,516
Contracted ratio Payment ratio
% %
73% 20%
63%
23%
59% 11%
122% 23%
66% 16%
60% 28%
51% 23%
79% 19%

18 | EU Funds in Central and Eastern Europe 2011
© 2012 KPMG Central and Eastern Europe Ltd., a limited liability company and a member firm of the KPMG network of independent member firms affiliated with KPMG International Cooperative (“KPMG International”), a Swiss entity. All rights reserved. Designed by KPMG in Poland.
Czech RepublicIn the 2007-13 period, the National Strategic Reference Framework covers 17 OPs, eight sectoral, seven regional and two Objective 2 OPs, with a total Community contribution of EUR 26.3 billion. The community contribution is complemented by national public resources, providing a total budget of EUR 30.7 billion.
Within the Czech National Strategic Reference Framework, EUR 22.2 billion have been contracted with beneficiaries, accounting for 72% of the available budget for seven-years. Out of this amount, EUR 11.8 billion have already been paid to the beneficiaries, representing nearly 40% of the allocated budget.
The contracted ratio at the level of 72% is obviously time proportional, which means that the framework programme is on the right track. A 39% payment ratio places the Czech Republic in the TOP5, among the CEE countries.
Population 10.5 million
GDP per capita in 2011 EUR 14,684
Available budget 2007-13 EUR 30.7 billion
Contracted grants EUR 22.2 billion
Contracted ratio 72%
Paid grants EUR 11.8 billion
Payment ratio 39%
Available budget 2007 -13
Contracted grants Paid grants
0
5 000
10 000
15 000
20 000
25 000
30 000
35 000
m E
UR
Progress of EU funds
Contracted ratio: 72%
Payment ratio: 39%

EU Funds in Central and Eastern Europe 2011 | 19
© 2012 KPMG Central and Eastern Europe Ltd., a limited liability company and a member firm of the KPMG network of independent member firms affiliated with KPMG International Cooperative (“KPMG International”), a Swiss entity. All rights reserved. Designed by KPMG in Poland.
The progress of the implementation of 17 Czech Operational Programmes by the end of 2011 is presented in the following table:
Operational Programmes Available budget* 2007-13 Contracted grants* Paid grants*
mEUR mEUR mEUR
Enterprise and Innovation OP 3,554 2,614 1,003
Research and Development for Innovations OP
2,431 2,017 514
Human Resources and Employment OP 2 ,138 1,624 676
Education for Competitiveness OP 2,117 1,720 645 Environment OP 5,789 1,538 1,224
Transport OP 6,771 6,611 4,606 Integrated OP 1,850 1,344 356
Technical Assistance OP 290 161 50 Prague OP – Competitiveness 276 240 150
Prague OP – Adaptability 126 85 72 South-West OP 723 592 298
South-East OP 819 709 457 Central Moravia OP 767 468 383
North-West OP 871 672 409 North-East OP 764 722 444
Moravia-Silesia OP 834 567 304 Central Bohemia OP 651 519 271
Total 30,771 22,202 11,862
Contracted ratio Payment ratio
% %
74% 28%
83% 21%
76% 32%
81% 30%27% 21%
98% 68%73% 19%
56% 17%87% 54%
68% 58%82% 41%
87% 56%61% 50%
77% 47%95% 58%
68% 36%80% 42%
72% 39%
* ERDF, ESF or CF + national public contribution altogether
20 | EU Funds in Central and Eastern Europe 2011
© 2012 KPMG Central and Eastern Europe Ltd., a limited liability company and a member firm of the KPMG network of independent member firms affiliated with KPMG International Cooperative (“KPMG International”), a Swiss entity. All rights reserved. Designed by KPMG in Poland.
Available budget 2007 -13
Contracted grants Paid grants
-
500
1 000
1 500
2 000
2 500
3 000
3 500
4 000
4 500
m E
UR
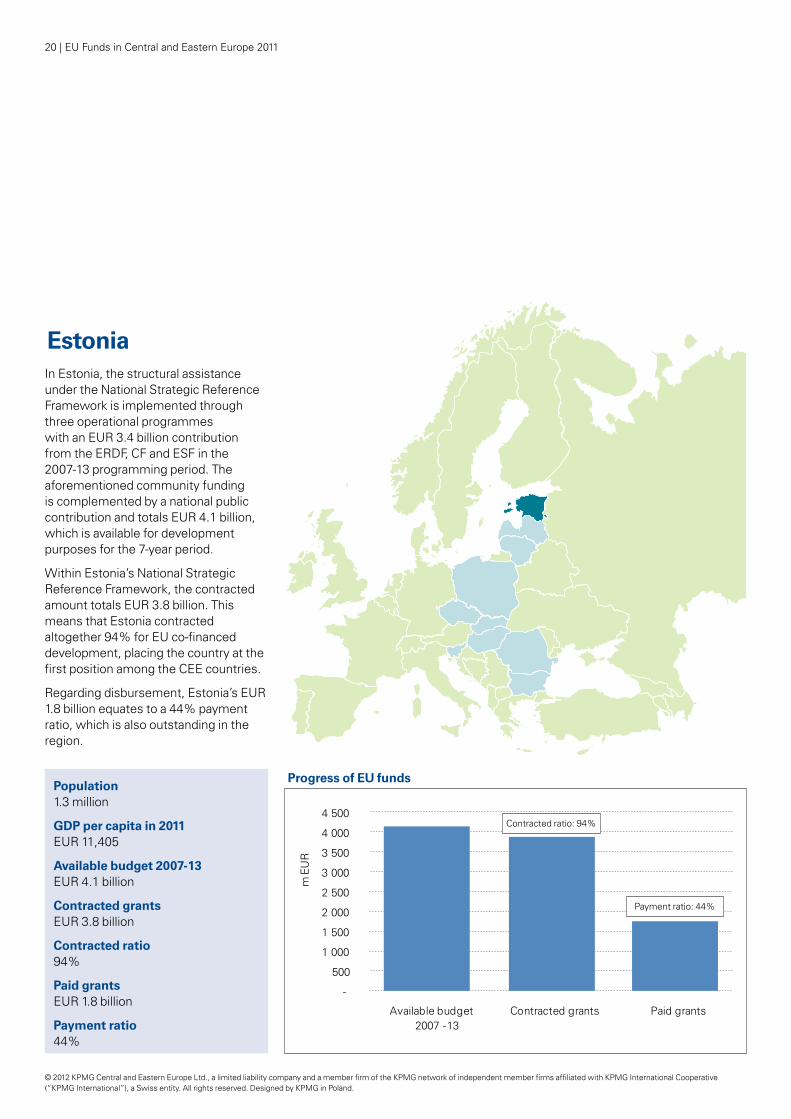
Population 1.3 million
GDP per capita in 2011 EUR 11,405
Available budget 2007-13 EUR 4.1 billion
Contracted grants EUR 3.8 billion
Contracted ratio 94%
Paid grants EUR 1.8 billion
Payment ratio 44%
EstoniaIn Estonia, the structural assistance under the National Strategic Reference Framework is implemented through three operational programmes with an EUR 3.4 billion contribution from the ERDF, CF and ESF in the 2007-13 programming period. The aforementioned community funding is complemented by a national public contribution and totals EUR 4.1 billion, which is available for development purposes for the 7-year period.
Within Estonia’s National Strategic Reference Framework, the contracted amount totals EUR 3.8 billion. This means that Estonia contracted altogether 94% for EU co-financed development, placing the country at the first position among the CEE countries.
Regarding disbursement, Estonia’s EUR 1.8 billion equates to a 44% payment ratio, which is also outstanding in the region.
Progress of EU funds
Contracted ratio: 94%
Payment ratio: 44%

EU Funds in Central and Eastern Europe 2011 | 21
© 2012 KPMG Central and Eastern Europe Ltd., a limited liability company and a member firm of the KPMG network of independent member firms affiliated with KPMG International Cooperative (“KPMG International”), a Swiss entity. All rights reserved. Designed by KPMG in Poland.
* ERDF, ESF or CF + national public contribution altogether
Operational Programmes Available budget* 2007-13 Contracted grants* Paid grants*
mEUR mEUR mEUR
Human Resources Development OP 461 427 231
Development of Economic Environment OP
1,807 1,792 880
Development of the Living Environment OP
1,840 1,641 694
Total 4 108 3 859 1 805
Contracted ratio Payment ratio
% %
92% 50%
99% 49%
89% 38%
94% 44%
The progress of the implementation of three Estonian Operational Programmes by the end of 2011 is presented in the following table:

22 | EU Funds in Central and Eastern Europe 2011
© 2012 KPMG Central and Eastern Europe Ltd., a limited liability company and a member firm of the KPMG network of independent member firms affiliated with KPMG International Cooperative (“KPMG International”), a Swiss entity. All rights reserved. Designed by KPMG in Poland.
HungaryIn the 2007-13 programming period, Hungary’s National Strategic Reference Framework, the so-called New Hungary Development Plan, covers 15 operational programmes: seven sectoral, six regional, one Objective 2 and one technical assistance OP. The programme is implemented by EUR 24.9 billion in community ERDF, CF and ESF co-financing. Complemented by the national public contribution, the available budget for the seven years totals EUR 29.3 billion.
During five years of implementation, altogether EUR 18.8 billion grants have been contracted within the New Hungary Development Plan. This means that the beneficiaries have already signed contracts for 64% of the total available budget.
As far as the disbursement is concerned, by the end of 2011, one-fourth of the contracted grants were paid out to the beneficiaries. This amount is slightly more than a quarter of the total funds allocated for the 2007-13 programming period.
Population 10 million
GDP per capita in 2011 EUR 9,564
Available budget 2007-13 EUR 29.3 billion
Contracted grants EUR 18.8 billion
Contracted ratio 64%
Paid grants EUR 8.3 billion
Payment ratio 28%
Available budget 2007 -13
Contracted grants Paid grants
-
5 000
10 000
15 000
20 000
25 000
30 000
35 000
m E
UR
Progress of EU funds
Contracted ratio: 64%
Payment ratio: 28%
EU Funds in Central and Eastern Europe 2011 | 23
© 2012 KPMG Central and Eastern Europe Ltd., a limited liability company and a member firm of the KPMG network of independent member firms affiliated with KPMG International Cooperative (“KPMG International”), a Swiss entity. All rights reserved. Designed by KPMG in Poland.
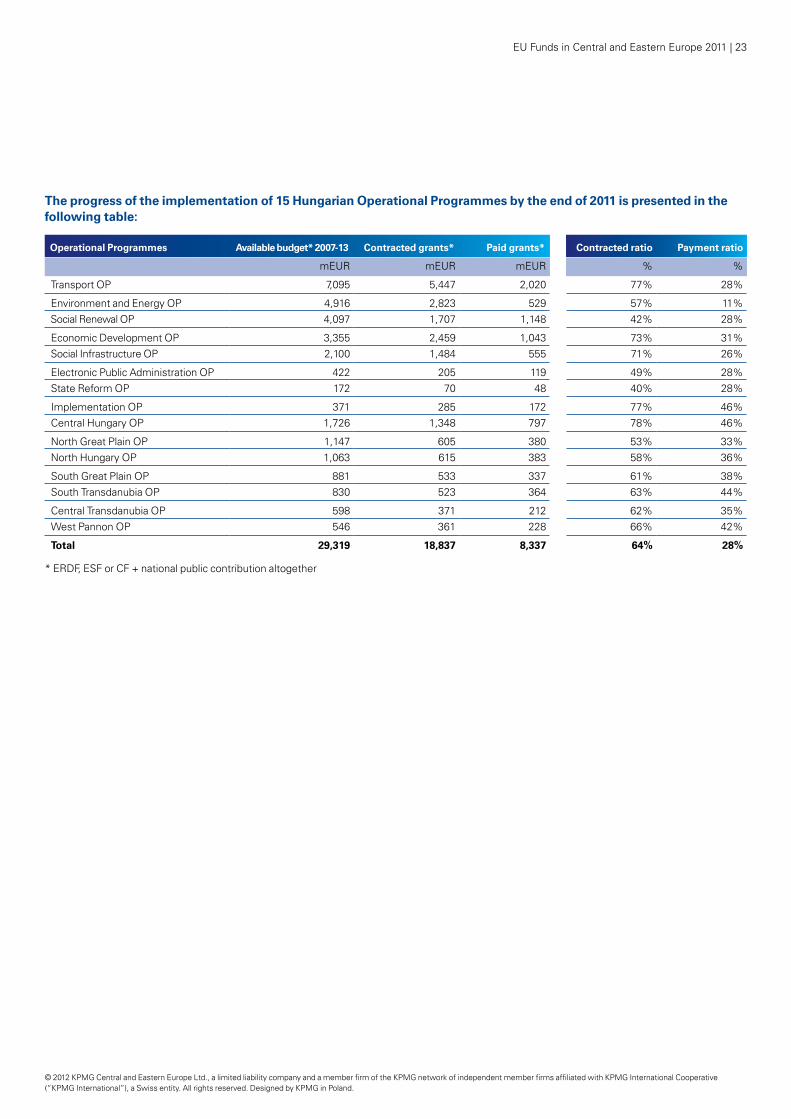
The progress of the implementation of 15 Hungarian Operational Programmes by the end of 2011 is presented in the following table:
Operational Programmes Available budget* 2007-13 Contracted grants* Paid grants*
mEUR mEUR mEUR
Transport OP 7,095 5,447 2,020
Environment and Energy OP 4,916 2,823 529 Social Renewal OP 4,097 1,707 1,148
Economic Development OP 3,355 2,459 1,043 Social Infrastructure OP 2,100 1,484 555
Electronic Public Administration OP 422 205 119 State Reform OP 172 70 48
Implementation OP 371 285 172 Central Hungary OP 1,726 1,348 797
North Great Plain OP 1,147 605 380 North Hungary OP 1,063 615 383
South Great Plain OP 881 533 337 South Transdanubia OP 830 523 364
Central Transdanubia OP 598 371 212 West Pannon OP 546 361 228
Total 29,319 18,837 8,337
Contracted ratio Payment ratio
% %
77% 28%
57% 11%42% 28%
73% 31%71% 26%
49% 28%40% 28%
77% 46%78% 46%
53% 33%58% 36%
61% 38%63% 44%
62% 35%66% 42%
64% 28%
* ERDF, ESF or CF + national public contribution altogether

24 | EU Funds in Central and Eastern Europe 2011
© 2012 KPMG Central and Eastern Europe Ltd., a limited liability company and a member firm of the KPMG network of independent member firms affiliated with KPMG International Cooperative (“KPMG International”), a Swiss entity. All rights reserved. Designed by KPMG in Poland.
LatviaIn the 2007-13 period Latvia’s National Strategic Reference Framework programme covers three OPs, which are co-financed by the European Union in the amount of EUR 4.5 billion.
According to the Community rules, this amount is complemented by national public resources. Thus, the total amount of available funds, to which the applicants can apply for grants, totals EUR 4.9 bilion.
By the end of 2011, as part of the Latvian National Strategic Reference Framework programme, the level of the contracted grants reached 87% with a 44% disbursement, which represents amounts of EUR 4.3 billion and EUR 2.2 billion, respectively.
At a CEE level, the Latvian programmes have displayed one of the best performance in the region in terms of contracted grants’ share. A 44% rate of payment also represents an outstanding result among the 10 CEE countries.
Population 2.2 million
GDP per capita in 2011 EUR 8,589
Available budget 2007-13 EUR 4.9 billion
Contracted grants EUR 4.3 billion
Contracted ratio 87%
Paid grants EUR 2.2 billion
Payment ratio 44%
Available budget 2007 -13
Contracted grants Paid grants
-
1 000
2 000
3 000
4 000
5 000
6 000
m E
UR
Progress of EU funds
Contracted ratio: 87%
Payment ratio: 44%

EU Funds in Central and Eastern Europe 2011 | 25
© 2012 KPMG Central and Eastern Europe Ltd., a limited liability company and a member firm of the KPMG network of independent member firms affiliated with KPMG International Cooperative (“KPMG International”), a Swiss entity. All rights reserved. Designed by KPMG in Poland.
* ERDF, ESF or CF + national public contribution altogether
The progress of the implementation of three Latvian Operational Programmes by the end of 2011 is presented in the following table:
Operational Programmes Available budget* 2007-13 Contracted grants* Paid grants*
mEUR mEUR mEUR
Infrastructure and Services OP 3,518 3,049 1,384
Entrepreneurship and Innovations OP 770 635 362
Human Resources and Employment OP 653 593 406
Total 4,941 4,277 2,151
Contracted ratio Payment ratio
% %
87% 39%
82% 47%
91% 62%
87% 44%

26 | EU Funds in Central and Eastern Europe 2011
© 2012 KPMG Central and Eastern Europe Ltd., a limited liability company and a member firm of the KPMG network of independent member firms affiliated with KPMG International Cooperative (“KPMG International”), a Swiss entity. All rights reserved. Designed by KPMG in Poland.
LithuaniaIn the 2007-13 period, EUR 6.8 billion ERDF, CF and ESF worth of funding were allocated to Lithuania’s National Strategic Reference Framework.
The above-mentioned amount, complemented by national public contributions, totals EUR 7.3 billion in grants, which can be spent on the development of the country’s cohesion objectives.
During the first four years of implementation, EUR 5.8 billion was contracted within the National Strategic Reference Framework, 78% of the total available budget for the period of 2007-13. The amount of paid grants reached EUR 3.2 billion, which accounts for 43% of the available funds and more than half of the total contracted grants.
The contracted ratio of the Lithuanian EU framework programme is high when compared to the respective data in the CEE region. This can be considered an outstanding performance as the first call for tenders was barely in 2008.
Available budget 2007 -13
Contracted grants Paid grants
-
1 000
2 000
3 000
4 000
5 000
6 000
7 000
8 000
m E
UR
Progress of EU funds
Contracted ratio: 78%
Payment ratio: 43%
Population 3.2 million
GDP per capita in 2011 EUR 8,827
Available budget 2007-13 EUR 7.4 billion
Contracted grants EUR 5.8 billion
Contracted ratio 78%
Paid grants EUR 3.2 billion
Payment ratio 43%

EU Funds in Central and Eastern Europe 2011 | 27
© 2012 KPMG Central and Eastern Europe Ltd., a limited liability company and a member firm of the KPMG network of independent member firms affiliated with KPMG International Cooperative (“KPMG International”), a Swiss entity. All rights reserved. Designed by KPMG in Poland.
The progress of the implementation of four Lithuanian Operational Programmes by the end of 2011 is presented in the following table:
Operational Programmes Available budget* 2007-13 Contracted grants* Paid grants*
mEUR mEUR mEUR
Economic Growth OP 3,268 2,408 1,408
Programme for Promotion of Cohesion OP 3,010 2,574 1,310
Human Resources Development OP 1,044 775 481
Technical assistance OP 110 43 33
Total 7,431 5,799 3,232
Contracted ratio Payment ratio
% %
74% 43%
86% 44%
74% 46%
39% 30%
78% 43%
* ERDF, ESF or CF + national public contribution altogether

28 | EU Funds in Central and Eastern Europe 2011
© 2012 KPMG Central and Eastern Europe Ltd., a limited liability company and a member firm of the KPMG network of independent member firms affiliated with KPMG International Cooperative (“KPMG International”), a Swiss entity. All rights reserved. Designed by KPMG in Poland.
Population 38.2 million
GDP per capita in 2011 EUR 9,518
Available budget 2007-13 EUR 82.8 billion
Contracted grants EUR 52.4 billion
Contracted ratio 63%
Paid grants EUR 23 billion
Payment ratio 28%
Available budget 2007 -13
Contracted grants Paid grants
-
10 000
20 000
30 000
40 000
50 000
60 000
70 000
80 000
90 000
m E
UR
PolandIn the 2007-13 period, Poland’s main programming document, the National Cohesion Strategy covers 21 operational programmes: four sectoral, 16 regional and one technical assistance OP.
The EU funds available for the framework programme equals EUR 65.3 billion, which is the biggest amount for development in the CEE. When complemented by the national public contribution, it totals EUR 82.8 billion.
By the end of 2011, Polish beneficiaries had signed contracts for EUR 52.4 billion within the framework of the National Cohesion Strategy. This amount accounts for 63% of the total budget.
In the meantime, more than 40% of the contracted grants, i.e. approximately EUR 23 billion, was disbursed to the beneficiaries, which represents 28% of the total allocated budget for the 7-year period.
Progress of EU funds
Contracted ratio: 63%
Payment ratio: 28%

EU Funds in Central and Eastern Europe 2011 | 29
© 2012 KPMG Central and Eastern Europe Ltd., a limited liability company and a member firm of the KPMG network of independent member firms affiliated with KPMG International Cooperative (“KPMG International”), a Swiss entity. All rights reserved. Designed by KPMG in Poland.
The progress of the implementation of the Polish Operational Programmes by the end of 2011 is presented in the following table:
* ERDF, ESF or CF + national public contribution altogether
**Average exchange rate of Euro in relation to Polish złoty (PLN) in 2011: EUR1 = PLN4.1206 (source: EBC)
*** Exchange rate of Euro in relation to Polish złoty in 2011: EUR1 = PLN4.1579 (source: data prepared by the Ministry of Regional Development in Poland
Operational Programmes Available budget* 2007-13 Contracted grants* Paid grants*
mEUR mEUR mEUR
Human Capital OP*** 11,420 7,831 4,654 Innovative Economy OP** 10,180 7,111 2,539
Infrustracture and Environment OP** 37,565 22,049 7,472 Development of Eastern Poland OP** 2 675 1 681 799
Technical Assistance OP** 608 298 207 Lower Silesia OP** 1,577 921 505
Kujawsko−Pomorskie OP** 1,179 756 387 Lubelskie OP** 1,403 891 469
Lubuskie OP** 517 379 254 Lódzkie OP** 1,230 997 447
Lesser Poland OP** 1,790 1,103 554 Mazovia OP** 2,153 1,325 720
Opolskie OP** 578 431 279 Subcarpatihan OP** 1,345 932 554
Podlaskie OP** 793 447 273 Pomerania OP** 1,129 859 469
Zachodniopomorskie OP** 983 682 365 Greater Poland OP** 1,640 1,225 729
Swietokrzyskie OP** 854 562 375Silesia OP** 2,025 1,156 666
Warminsko−Mazurskie OP** 1,229 804 380 Total 82,872 52,440 23,097
Contracted ratio Payment ratio
% %
69% 41%70% 25%
59% 20%63% 30%
49% 34%58% 32%
64% 33%63% 33%
73% 49%81% 36%
62% 31%62% 33%
75% 48%69% 41%
56% 34%76% 42%
69% 37%75% 44%
66% 44%57% 33%
65% 31%63% 28%

30 | EU Funds in Central and Eastern Europe 2011
© 2012 KPMG Central and Eastern Europe Ltd., a limited liability company and a member firm of the KPMG network of independent member firms affiliated with KPMG International Cooperative (“KPMG International”), a Swiss entity. All rights reserved. Designed by KPMG in Poland.
RomaniaIn the period 2007-13, the Romanian National Development Plan is implemented through five sectoral, one regional and one technical assistance OP under the “Convergence” Objective.
In the framework of the National Development Plan, Romania is scheduled to obtain EUR 19.2 billion from ERDF, CF and ESF. Complemented by a national public contribution, the entire amount available to beneficiaries totals EUR 23.3 billion.
By December 2011, EUR 14.6 billion in grants had been contracted in the framework of the Romanian National Development Plan. The contracted ratio is slightly below the CEE level’s ratio.
Out of this amount, EUR 3.2 billion in grants were disbursed to the beneficiaries, accounting for less than 15% of the available budget for seven years.
Population 21.4 million
GDP per capita in 2011 EUR 5,555
Available budget 2007-13 EUR 23.3 billion
Contracted grants EUR 14.6 billion
Contracted ratio 63%
Paid grants EUR 3.2 billion
Payment ratio 14%
Available budget 2007 -13
Contracted grants Paid grants
-
5 000
10 000
15 000
20 000
25 000
m E
UR
Progress of EU funds
Contracted ratio: 63%
Payment ratio: 14%

EU Funds in Central and Eastern Europe 2011 | 31
© 2012 KPMG Central and Eastern Europe Ltd., a limited liability company and a member firm of the KPMG network of independent member firms affiliated with KPMG International Cooperative (“KPMG International”), a Swiss entity. All rights reserved. Designed by KPMG in Poland.
The progress of the implementation of seven Romanian Operational Programmes by the end of 2011 is presented in the following table:
* ERDF, ESF or CF + national public contribution altogether
Operational Programmes Available budget* 2007-13 Contracted grants* Paid grants*
mEUR mEUR mEUR
Transport OP 5,698 2,222 157 Environment OP 5,611 4,436 577
Regional OP 4,384 3,332 1,016 Human Resources Development OP 4,089 3,168 894
Increase of Economic Competitiveness OP 3,011 1,280 460 Administrative Capacity Development OP 246 112 26
Technical Assistance OP 213 61 21 Total 23,251 14,610 3,152
Contracted ratio Payment ratio
% %
39% 3%79% 10%
76% 23%77% 22%
42% 15%45% 11%
29% 10%63% 14%

32 | EU Funds in Central and Eastern Europe 2011
© 2012 KPMG Central and Eastern Europe Ltd., a limited liability company and a member firm of the KPMG network of independent member firms affiliated with KPMG International Cooperative (“KPMG International”), a Swiss entity. All rights reserved. Designed by KPMG in Poland.
SlovakiaIn the 2007-13 period, the National Strategic Reference Framework covers eight sectoral, one regional, one Objective 2 and one technical assistance OP with a total Community contribution of EUR 11.36 billion.
The received EU funded budget is supplemented by a national public contribution, which results in a total sum of EUR 13.6 billion, available for development purposes.
By the end of 2011, within the National Strategic Reference Framework Slovakia had contracted EUR 8.6 billion in total, which is 64% of the total budget available for EU co-financed development. Out of this amount, EUR 3.8 billion were paid to the beneficiaries, accounting for 28% of the total budget allocated for seven years.
Population 5.4 million
GDP per capita in 2011 EUR 12,410
Available budget 2007-13 EUR 13.6 billion
Contracted grants EUR 8.6 billion
Contracted ratio 64%
Paid grants EUR 3.8 billion
Payment ratio 28%
Available budget 2007 -13
Contracted grants Paid grants
0
2 000
4 000
6 000
8 000
10 000
12 000
14 000
16 000
m E
UR
Progress of EU funds
Contracted ratio: 64%
Payment ratio: 28%

EU Funds in Central and Eastern Europe 2011 | 33
© 2012 KPMG Central and Eastern Europe Ltd., a limited liability company and a member firm of the KPMG network of independent member firms affiliated with KPMG International Cooperative (“KPMG International”), a Swiss entity. All rights reserved. Designed by KPMG in Poland.
The progress of the implementation of 11 Slovakian Operational Programmes by the end of 2011 is presented in the following table:
* ERDF, ESF or CF + national public contribution altogether
Operational Programmes Available budget* 2007-13 Contracted grants* Paid grants*
mEUR mEUR mEUR
Transport OP 3,846 1,909 898Environment OP 2,141 1,449 537
Regional OP 1,829 1,578 781Research and Development OP 1,423 874 338
Informatisation of Society OP 1,162 337 108Employment and Social Inclusion OP 1,037 946 440
Competitiveness and Economic Growth OP 914 746 384Education OP 727 374 143
Health OP 294 295 125Technical Assistance OP 115 98 49
Bratislava Region OP 112 56 40Total 13,600 8,661 3,842
Contracted ratio Payment ratio
% %
50% 23%68% 25%
86% 43%61% 24%
29% 9%91% 42%
82% 42%51% 20%
100% 43%86% 43%
50% 35%64% 28%

34 | EU Funds in Central and Eastern Europe 2011
© 2012 KPMG Central and Eastern Europe Ltd., a limited liability company and a member firm of the KPMG network of independent member firms affiliated with KPMG International Cooperative (“KPMG International”), a Swiss entity. All rights reserved. Designed by KPMG in Poland.
SloveniaIn the 2007-13 programming period, Slovenia’s main EU co-funded programme is the National Development Plan. The framework programme covers two sectoral and one regional operational programme, and budgets EUR 4.1 billion from ERDF and ESF co-financing.
This amount complemented by national public contributions equals to EUR 4.8 billion, which is finally available for beneficiaries for development purposes.
By the end of 2011, projects worth EUR 2.8 billion in grants were contracted by the beneficiaries of the Operational Programmes of the Slovenian National Development Plan. This amount is nearly one-third of the total available budget allocated for development in Slovenia for the 2007-13 period.
Out of the contracted grants, EUR 1.8 billion has been disbursed, accounting for the 70% of the contracted grants and 38% of the total budget for seven years.
Population 2,1 million
GDP per capita in 2011 EUR 17,644
Available budget 2007-13 EUR 4.8 billion
Contracted grants EUR 2.8 billion
Contracted ratio 59%
Paid grants EUR 1.8 billion
Payment ratio 38%
Available budget 2007 -13
Contracted grants Paid grants
-
1 000
2 000
3 000
4 000
5 000
6 000
m E
UR
Progress of EU funds
Contracted ratio: 64%
Payment ratio: 28%
EU Funds in Central and Eastern Europe 2011 | 35
© 2012 KPMG Central and Eastern Europe Ltd., a limited liability company and a member firm of the KPMG network of independent member firms affiliated with KPMG International Cooperative (“KPMG International”), a Swiss entity. All rights reserved. Designed by KPMG in Poland.
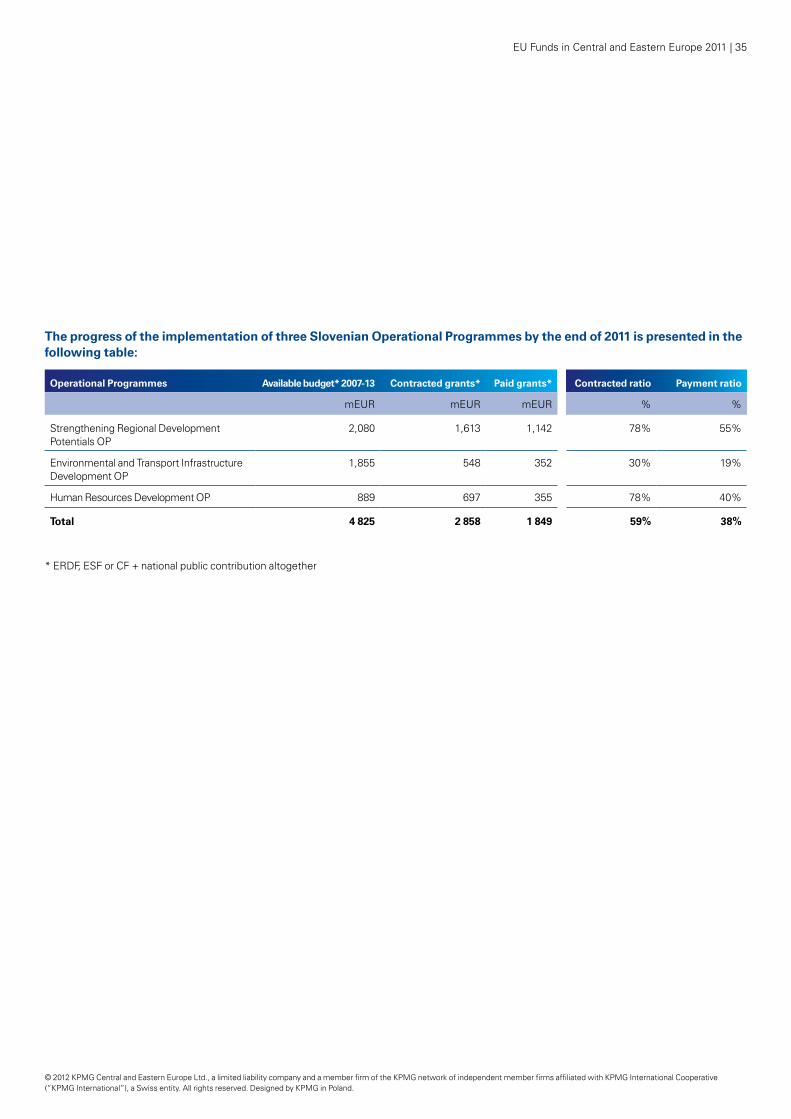
The progress of the implementation of three Slovenian Operational Programmes by the end of 2011 is presented in the following table:
* ERDF, ESF or CF + national public contribution altogether
Operational Programmes Available budget* 2007-13 Contracted grants* Paid grants*
mEUR mEUR mEUR
Strengthening Regional Development Potentials OP
2,080 1,613 1,142
Environmental and Transport Infrastructure Development OP
1,855 548 352
Human Resources Development OP 889 697 355
Total 4 825 2 858 1 849
Contracted ratio Payment ratio
% %
78% 55%
30% 19%
78% 40%
59% 38%


KPMG in BulgariaGergana MantarkovaManaging PartnerT: +359 2 9697 500E: [email protected]
KPMG in the Czech RepublicEva RackováPartner, Public SectorT: +420 222 123 121E: [email protected]
KPMG in the Baltic states(Estonia, Latvia and Lithuania)Stephen YoungSenior PartnerT: +371 67 038 062E: [email protected]
KPMG in HungaryAndrea NestorDirectorT: +36 1 887 7249E: [email protected]
KPMG in PolandMiroslaw ProppéPartner, Head of Government and Infrastructure in CEET: +48 22 528 1112E: [email protected]
KPMG in RomaniaDaniela NemoianuExecutive PartnerT: +40 741 800 732E: [email protected]
KPMG in SlovakiaPeter BorakPartner, AdvisoryT: +42 1 259 984 902E: [email protected]
KPMG in SloveniaSonja ZnidarcicPartnerT: +386 0 1 236 43 00E: [email protected]
KPMG W POLSCE
Rynek poligraficzny w Polsce
Badanie KPMG i PBKG
kpmg.pl
© 2012 KPMG Central and Eastern Europe Ltd., a limited liability company and a member firm of the KPMG network of independent member firms affiliated with KPMG International Cooperative (“KPMG International”), a Swiss entity. All rights reserved. Designed by KPMG in Poland.