Embed Size (px)
Citation preview
Special Report EU-funded airport infrastructures: poor value for money
EN 2014 NO 21
EUROPEANCOURTOF AUDITORS

EUROPEAN COURT OF AUDITORS 12, rue Alcide De Gasperi 1615 Luxembourg LUXEMBOURG
Tel. +352 4398-1
E-mail: [email protected] Internet: http://eca.europa.eu
Twitter: @EUAuditorsECA YouTube: EUAuditorsECA
More information on the European Union is available on the Internet (http://europa.eu).
Luxembourg: Publications Office of the European Union, 2014
ISBN 978-92-872-1253-5doi:10.2865/96815
© European Union, 2014Reproduction is authorised provided the source is acknowledged.
Printed in Luxembourg
EU-funded airport infrastructures: poor value for money
(pursuant to Article 287(4), second subparagraph, TFEU)
Special Report
EN 2014 NO 21
02Contents
Paragraph
Glossary
I–V Executive summary
1–15 Introduction
1–5 Main characteristics of air transport in Europe
6–8 EU air transport policy and funding of airport infrastructures
9–11 The management of investments in airport infrastructures under the ERDF and CF
12–15 Types of airport infrastructures examined
16–21 Audit scope and approach
22–67 Observations
22–26 Need for new or upgraded infrastructures demonstrated for half of the airports examined
27 Delays in constructions for most and cost overruns for half of the airports examined
28–35 More than half of the constructions were under-used
36–38 EU funding for investments which are not cost-effective
39–45 Seven of the 20 audited airports are not financially self-sustainable
46–48 Forecast of passenger numbers significantly over-optimistic for 12 of the 20 airports examined
49–52 Limited impact of EU-funded investments on passenger numbers, customer service and job creation
53–59 Similar investments in airports in close proximity to each other
60–65 Planning of investments in airport infrastructures generally not coordinated at national level
66–67 Limited information available to the Commission on EU funding of airports
03Contents
68–72 Conclusions and recommendations
Annex I — ERDF and CF allocations between 2000 and 2013 for airport infrastructures per Member State
Annex II — List of airports and projects audited
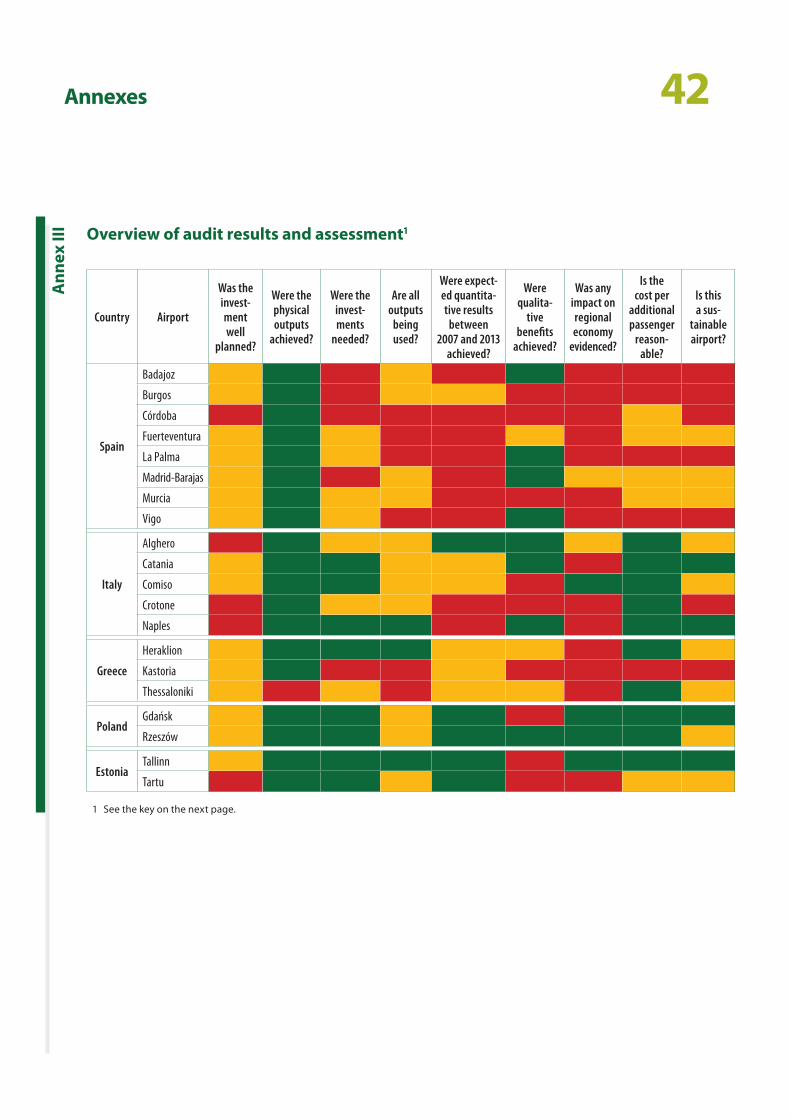
Annex III — Overview of audit results and assessment
Annex IV — Catchment area analysis of individual airports
Reply of the Commission
04Glossary
Airport infrastructure investments: Investments on the landside and airside of airports. Landside infrastructure investments include the construction of new terminal buildings, extensions of existing terminals and connections to the road and rail network. Airside infrastructure investments include the construction of runway, taxi‑way, exit‑way and apron space, air traffic control infrastructure and equipment and safety equipment.
Air traffic movement (ATM): A landing or take‑off at an airport of an aeroplane engaged in air transport. Airside capacity is usually measured in terms of ATMs per hour — indicating the number of aeroplanes able to land, park or take‑off within 1 hour.
Catchment area: The area of influence of an airport to attract visitors and customers, depending on the population nearby and the surface transport possibilities.
Cohesion policy funds: Funds to promote the policy which aims at strengthening economic and social cohesion within the European Union, reducing the gap in the level of development between the regions of the EU. This audit concerned in particular: (i) the European Regional Development Fund (ERDF): aimed at investing in infrastructure, creating or preserving jobs, sustaining local development initiatives and activities of small and medium‑sized enterprises, and (ii) the Cohesion Fund (CF): aimed at strengthening economic and social cohesion by financing environment and transport projects in Member States with a per capita GNI of less than 90 % of the EU average.
Directorate-General (DG): A department of the European Commission (EC). In this audit, the relevant DGs were DG Regional and Urban Policy and DG Mobility and Transport.
Managing authority: The body at national, regional or local level designated by the Member State that proposes the operational programme for adoption to the Commission and that is responsible for its subsequent management and implementation.
Major project (MP) and cohesion fund project (CFP): A project which comprises of an economically indivisible series of works fulfilling a precise technical function having clearly identified aims and whose total cost taken into account in determining the contribution of the funds exceeds 50 million euro. The approval of the Commission is required for both MPs and CFPs at individual project level.
Operational programme (OP): The document prepared at central or regional level in a Member State and approved by the Commission which takes the form of a consistent set of priorities comprising multiannual measures.
05Executive summary
IThrough this audit, the Court analysed EU‑funded investments in airport infrastructures and examined whether:
— there was a demonstrated need for these investments;
— constructions were completed on time and on budget;
— the newly built (or upgraded) infrastructures were fully used.
In addition, the Court assessed whether these invest‑ments resulted in higher passenger numbers and in an improved customer service. Finally, the Court ana‑lysed whether the EU‑funded airports were financially sustainable.
IIThe audit focused on 20 EU‑funded airports in five Member States (Estonia, Greece, Spain, Italy and Poland). These airports received a total EU funding of 666 million euro during the 2000–06 and 2007–13 programme periods through the European Regional Development Fund (ERDF) and the Cohesion fund (CF).
IIIThe overall conclusion is that the EU‑funded invest‑ments in airports produced poor value for money: too many airports (which were often in close proximity to each other) were funded and in many cases the EU‑funded infrastructures were oversized. Only half of the audited airports succeeded in increasing their passenger numbers and improvements in customer service were either not measured or not evidenced.
IVThe Court also observes that the EU funding was not cost‑effective and that seven of the 20 airports exam‑ined are not profitable and, as a result, there is the risk that they may need to be closed unless they receive continuous public financial support. This is particularly the case with small regional airports having fewer than 100 000 passengers per year. The Court also noted that the EU funding is not well coordinated by the Member States and, in particular as regards major projects and cohesion fund projects, is insufficiently supervised by the Commission, leading to over‑ cap acity and poor value for money.
VThe Court recommends that:
(i) the Commission should ensure during the 2014–20 programme period that Member States only al‑locate EU funding to airport infrastructures in those airports which are financially viable and for which investment needs have been properly assessed and demonstrated. This should also be part of the approval and monitoring of operational programmes carried out by the Commission;
(ii) the Member States should have coherent regional, national and supranational plans for airport development to avoid over‑capacity, duplica‑tion and uncoordinated investments in airport infrastructures.
06Introduction
Main characteristics of air transport in Europe
01 Air transport is the dominant form of passenger transportation over long distances but it also serves the needs of many middle‑distance travellers. According to Eurocontrol, air traffic in Europe will nearly double by 2030 and Europe will not be in a position to meet a large part of this demand due to a shortage of runway and ground infrastructure, mainly at major hub airports.
02 There are over 500 commercial airports in Europe today, divided into:
(i) hub airports, providing a full range of services (business/leisure, domestic/intra‑European/inter‑continental) and bringing together traffic from smaller airports; and
(ii) regional airports connecting remote regions to the centres of economic activity, feeding hub air‑ports but also having direct flights to other regional airports.
03 The main hub airports in Europe with at least 5 million passengers per year1 capture 78 % of the total European air traffic; airports with between 1 and 5 million passengers per year have 18 % of the overall numbers whereas smaller airports with less than 1 million passengers per year are only used by 4 % of passengers.
04 Air transport is an important eco‑nomic area: European airports directly and indirectly employ over a million people working for airlines as well as on maintenance, catering services, retailing and air traffic control. As such, airlines and airports contribute more than 140 billion euro to the European GDP2.
05 However, profitability is often prob‑lematic: despite the fact that, between 2001 and 2010, traffic at regional airports in Europe increased by nearly 60 %, nearly half (48 %) of Europe’s airports were loss‑making in 2010. This is in particular the case for smaller, regional airports which the public authorities may wish to maintain for socioeconomic reasons.
EU air transport policy and funding of airport infrastructures
06 Since the early 1990s, EU air transport policy3 has aimed at overcoming cap‑acity problems by building additional infrastructure, but also by making better use of existing facilities. Such optimisation could be achieved via a more efficient use of slots4, better ground‑handling services and better integration with the railway network.
1 For classification rules see ‘Community guidelines on financing of airports and start‑up aid to airlines departing to regional airports’, Section 1.2.1(12) (OJ C 312, 9.12.2005, p. 1).
2 http://ec.europa.eu/transport/modes/air/internal_market
3 Council Regulation (EEC) No 95/93 of 18 January 1993 on common rules for the allocation of slots at Community airports (OJ L 14, 22.1.1993, p. 1); White Paper ‘European transport policy for 2010: time to decide’ (COM(2001) 370 final of 12.9.2001); ‘Keep Europe moving — sustainable mobility for our continent’ (COM(2006) 314 final of 22.6.2006); ‘An action plan for airport capacity, efficiency and safety in Europe’ (COM(2006) 819 final of 24 .1.2007); White Paper ‘Roadmap to a single European transport area — towards a competitive and resource efficient transport system’ (COM(2011) 144 final of 28.3.2011).
4 A permission given to use the full range of airport infrastructure necessary to operate an air service at an airport on a specific date and time for the purpose of landing or take‑off.
07Introduction
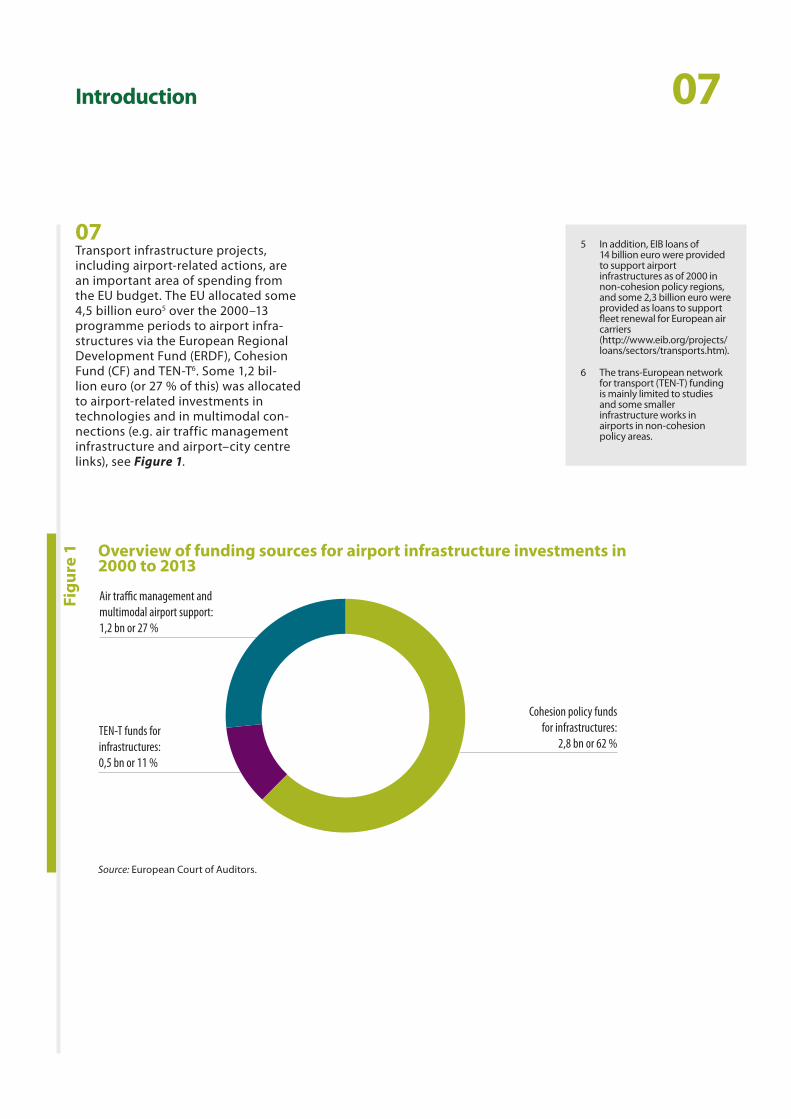
07 Transport infrastructure projects, including airport‑related actions, are an important area of spending from the EU budget. The EU allocated some 4,5 billion euro5 over the 2000–13 programme periods to airport infra‑structures via the European Regional Development Fund (ERDF), Cohesion Fund (CF) and TEN‑T6. Some 1,2 bil‑lion euro (or 27 % of this) was allocated to airport‑related investments in technologies and in multimodal con‑nections (e.g. air traffic management infrastructure and airport–city centre links), see Figure 1.
Overview of funding sources for airport infrastructure investments in 2000 to 2013
Figu
re 1
Air traffic management andmultimodal airport support:1,2 bn or 27 %
TEN-T funds forinfrastructures:0,5 bn or 11 %
Cohesion policy fundsfor infrastructures:
2,8 bn or 62 %
Source: European Court of Auditors.
5 In addition, EIB loans of 14 billion euro were provided to support airport infrastructures as of 2000 in non‑cohesion policy regions, and some 2,3 billion euro were provided as loans to support fleet renewal for European air carriers (http://www.eib.org/projects/loans/sectors/transports.htm).
6 The trans‑European network for transport (TEN‑T) funding is mainly limited to studies and some smaller infrastructure works in airports in non‑cohesion policy areas.
08Introduction
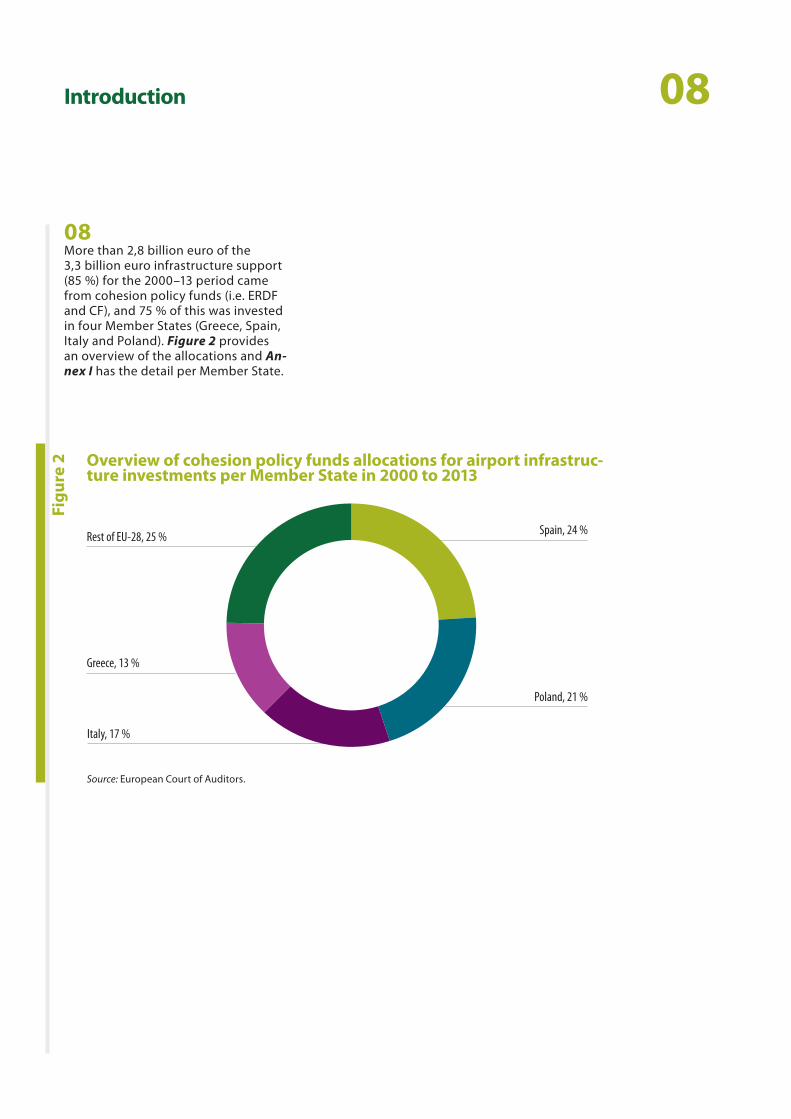
08 More than 2,8 billion euro of the 3,3 billion euro infrastructure support (85 %) for the 2000–13 period came from cohesion policy funds (i.e. ERDF and CF), and 75 % of this was invested in four Member States (Greece, Spain, Italy and Poland). Figure 2 provides an overview of the allocations and An-nex I has the detail per Member State.
Overview of cohesion policy funds allocations for airport infrastruc-ture investments per Member State in 2000 to 2013
Figu
re 2
Source: European Court of Auditors.
Italy, 17 %
Greece, 13 %
Rest of EU-28, 25 %
Poland, 21 %
Spain, 24 %
09Introduction
The management of investments in airport infrastructures under the ERDF and CF
09 The responsibility for EU spending under the ERDF and CF is shared between the Commission and the Member States7. The Commission establishes guidelines for the planning of operational programmes (OPs), and negotiates, approves and monitors the implementation of the OPs proposed by the managing authorities in the Member States.
10 The Commission bears overall respon‑sibility for the proper use of funds, as it is responsible for supervising the set‑up and operation of control systems in the Member States, and for reimbursing approved expenditure. The managing authority is responsible for the OP management and imple‑mentation, while Commission approval is required for both major projects and CF projects8.
11 Implementing bodies, acting on behalf of the managing authorities, are usually in charge of managing the airport infrastructure project itself. For the projects examined, the entities concerned were AENA (Spain), ENAC and ENAV (Italy) and Tallinn airport (Estonia). In Poland, the centre for EU transport projects carries out functions the managing authority has delegated to it and projects are managed by the beneficiaries, whereas in Greece the HCAA, a public service owning and managing all airports, except Athens airport, is responsible for prioritisation and selection of airport infrastructure investment projects.
Types of airport infrastructures examined
12 Airport infrastructures can be either landside or airside. Landside infra‑structure investments include the construction of new terminal build‑ings, extensions of existing terminals and connections to the road and rail network. Airside infrastructure in‑vestments include runway, taxi‑way, exit‑way and apron‑space construc‑tions, air traffic control infrastructure and equipment and safety equipment.
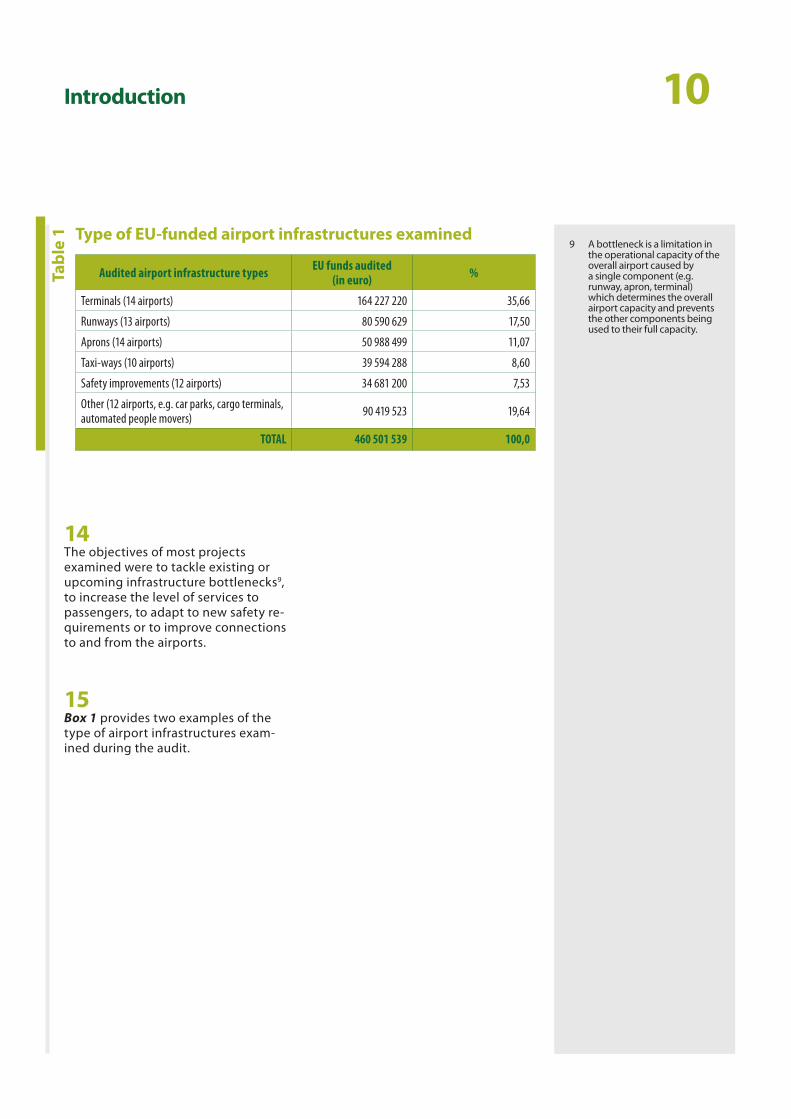
13 Most investments in the sample of projects examined were for airside infrastructures: these covered invest‑ments in runways, aprons, taxi‑ways as well as safety improvements in 18 of the 20 airports. Landside infra‑structure investments were mainly the construction of new terminals or extensions to existing terminals. The remainder of the audited funds were spent on miscellaneous infrastructures such as car parks, cargo terminals and automated people movers. Table 1 provides a general overview of the EU co‑financing per type of infrastructure.
7 http://ec.europa.eu/regional_policy/how/index_en.cfm
8 The Commission approval for all cohesion fund projects applies only to the 2000–06 programme period; in the 2007–13 period, such approval was only needed for projects costing more than 50 million euro.
10Introduction
Tabl
e 1 Type of EU-funded airport infrastructures examined
Audited airport infrastructure types EU funds audited (in euro) %
Terminals (14 airports) 164 227 220 35,66
Runways (13 airports) 80 590 629 17,50
Aprons (14 airports) 50 988 499 11,07
Taxi‑ways (10 airports) 39 594 288 8,60
Safety improvements (12 airports) 34 681 200 7,53
Other (12 airports, e.g. car parks, cargo terminals, automated people movers) 90 419 523 19,64
TOTAL 460 501 539 100,0
9 A bottleneck is a limitation in the operational capacity of the overall airport caused by a single component (e.g. runway, apron, terminal) which determines the overall airport capacity and prevents the other components being used to their full capacity.
14 The objectives of most projects examined were to tackle existing or upcoming infrastructure bottlenecks9, to increase the level of services to passengers, to adapt to new safety re‑quirements or to improve connections to and from the airports.
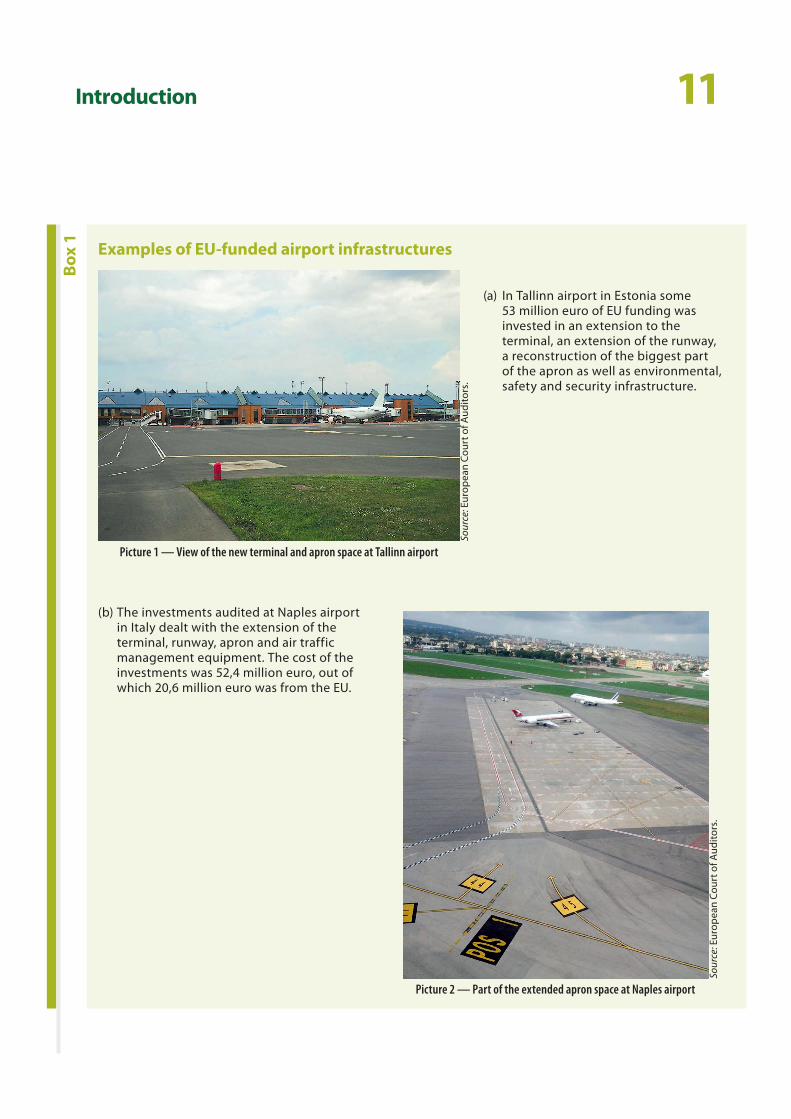
15 Box 1 provides two examples of the type of airport infrastructures exam‑ined during the audit.
11Introduction
Examples of EU-funded airport infrastructures
Box
1
Sour
ce: E
urop
ean
Cour
t of A
udito
rs.
Picture 1 — View of the new terminal and apron space at Tallinn airport
Sour
ce: E
urop
ean
Cour
t of A
udito
rs.
Picture 2 — Part of the extended apron space at Naples airport
(a) In Tallinn airport in Estonia some 53 million euro of EU funding was invested in an extension to the terminal, an extension of the runway, a reconstruction of the biggest part of the apron as well as environmental, safety and security infrastructure.
(b) The investments audited at Naples airport in Italy dealt with the extension of the terminal, runway, apron and air traffic management equipment. The cost of the investments was 52,4 million euro, out of which 20,6 million euro was from the EU.
12Audit scope and approach
16 Through this audit, the Court analysed EU‑funded investments in airport in‑frastructures and examined whether:
ο there was a demonstrated need for these investments;
ο constructions were completed on time and on budget;
ο the newly built (or upgraded) infra‑structures were fully used.
In addition, the Court assessed whether these investments resulted in higher passenger numbers and in an improved customer service. Finally, the Court analysed whether the EU‑funded airports were financially sustainable.
17 The audit focused on 20 EU‑funded airports in five Member States (Estonia, Greece, Spain, Italy and Poland). These airports received a total EU funding of 666 million euro during the 2000–06 and 2007–13 programme periods through the ERDF and the CF, out of which 460 million euro was audited.
18 Eight airports were selected for audit in Spain, five in Italy, three in Greece, two in Poland and two in Estonia. The sample selection methodology was that:
(i) all airports which had major pro‑jects and cohesion fund projects were selected10;
(ii) five airports were selected randomly;
(iii) five airports were selected on the basis of risk assessment. The re‑maining11 four airports were select‑ed because these were the airports with the largest amounts spent on infrastructure projects other than major projects and cohesion fund projects. Annex II provides a list of the audited airports with the amounts audited, implementation periods and types of infrastructure audited per airport.
19 The audit comprised a desk review of relevant legislation, air transport plan‑ning documents of the five Member States and publications of the main in‑dustry associations (including Airports Council International, Air Transport Re‑search Society, Eurocontrol, IATA, Inter‑national Transport Forum — OECD, etc.). It also involved on‑the‑spot audit visits to assess the outputs, results and impacts of the EU funding and the financial situation of the airports. The audit scope did not include an analysis of state aid issues in relation to airport infrastructures.
20 The audit work was carried out be‑tween May 2013 and May 2014.
10 This concerns six airports: three in Spain, one in Italy, one in Greece and one in Estonia.
11 The audit concentrated on mainland airports: small airports on islands, wherever possible, were excluded from the audited population, as generally these would exhibit lower economies of scale and also the population has limited possibilities to choose another airport.
13Audit scope and approach
21 The Court notes the following.
ο The long‑term trend of air trans‑port demand is positive: despite a temporary dip following the eco‑nomic crisis, there was a recovery of air transport numbers in Europe in 2010, with a 3,4 % increase in total number of passengers compared to 200912. Overall, EU‑27 passenger numbers increased by 6 % between 2007 and 2013.
ο The national averages for all airports in the five Member States examined in this report had an average growth of 2 % between 2007 and 2013.
ο While there was a limited and temporary crisis effect noted in 2007 and 2008, growth returned to the air transport sector for the rest of the audited period. There‑fore the economic crisis did not significantly affect the results of the airport infrastructure projects examined.
12 Eurostat, ‘Air transport recovers in 2010’, Issue number 21/2012 (http://epp.eurostat.ec.europa.eu/cache/ITY_OFFPUB/KS‑SF‑12‑021/EN/KS‑SF‑12‑021‑EN.PDF).
14Observations
Need for new or upgraded infrastructures demonstrated for half of the airports examined
22 During the audit the Court assessed whether at landside there had been a need for the investments in termi‑nals. To this purpose, the Court com‑pared the yearly number of passengers per m² before and after the invest‑ment using as criteria the European benchmark13 of 104 annual passengers per m².
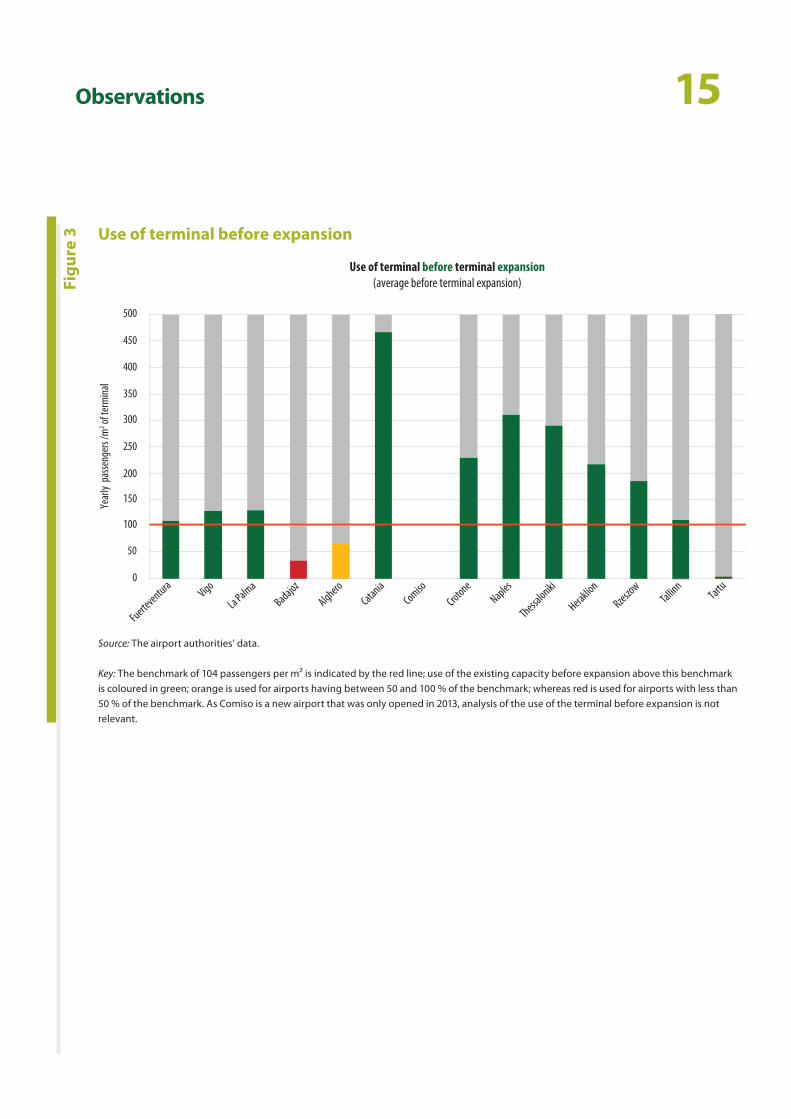
23 In 10 of the 14 terminal construction projects, there was a demonstrable need for expansion to avoid future sat‑uration or projected bottlenecks (Cata‑nia, Crotone, Naples, Fuerteventura, La Palma, Vigo, Heraklion, Thessaloniki, Rzeszów and Tallinn). In two cases (Co‑miso and Tartu), new terminals were needed to allow the operation of com‑mercial traffic. However, there was no pressing need for terminal expansions at Alghero (5,2 million euro of EU funds spent) or Badajoz (6 million euro of EU funds spent): sporadic hourly peaks at these airports could have been better dealt with through temporary solu‑tions14, rather than building permanent infrastructures which are for the most part under‑used (see Figure 3).
24 Similarly, at airside, half of the runway and apron expansions financed with EU money were needed to manage peak hour bottlenecks: in nine of the 18 EU‑funded airside investments, there was evidence that capacity expansion was needed (Badajoz, La Palma, Murcia, Vigo, Catania, Naples, Gdansk, Rzeszow and Tallinn). In three cases (Córdoba, Fuerteventura and Kastoria), the need for a cap‑acity expansion was not justified: the existing airside infrastructure was more than sufficient to cope with the forecast demand even in the long run in Córdoba and Fuerteventura, while in Kastoria the business case supporting the project to extend the runway was not adequate.
25 Overall, in 9 of the 20 airports audited, one or more of the projects sampled for audit were not needed at all. This represents 28 % or 129 million euro of the EU funding to airports examined.
13 ‘2012 Airport Benchmarking Report’, Air Transport Research Society (ATRS) (http://www.atrsworld.org/docs/KeyFindings2012ATRSBench‑markingReport‑June22.pdf).
14 E.g. hiring more (part‑time) staff to speed up the handling of incoming or departing passengers; installing temporary and mobile infrastructures to transport passengers between airside and landside.
15Observations
Use of terminal before expansion
Figu
re 3
Source: The airport authorities’ data.
Key: The benchmark of 104 passengers per m² is indicated by the red line; use of the existing capacity before expansion above this benchmark is coloured in green; orange is used for airports having between 50 and 100 % of the benchmark; whereas red is used for airports with less than 50 % of the benchmark. As Comiso is a new airport that was only opened in 2013, analysis of the use of the terminal before expansion is not relevant.
Ye
arly
passe
nger
s /m
2 of te
rmina
l
Fuerteventura Vigo
La PalmaBadajoz
AlgheroCatania
ComisoCrotone
Naples
Thessaloniki
Heraklion
Rzeszow
Tallinn
Tartu
500
450
400
350
300
250
200
150
100
50
0
Use of terminal before terminal expansion(average before terminal expansion)
16Observations
Examples of EU-funded airport infrastructures
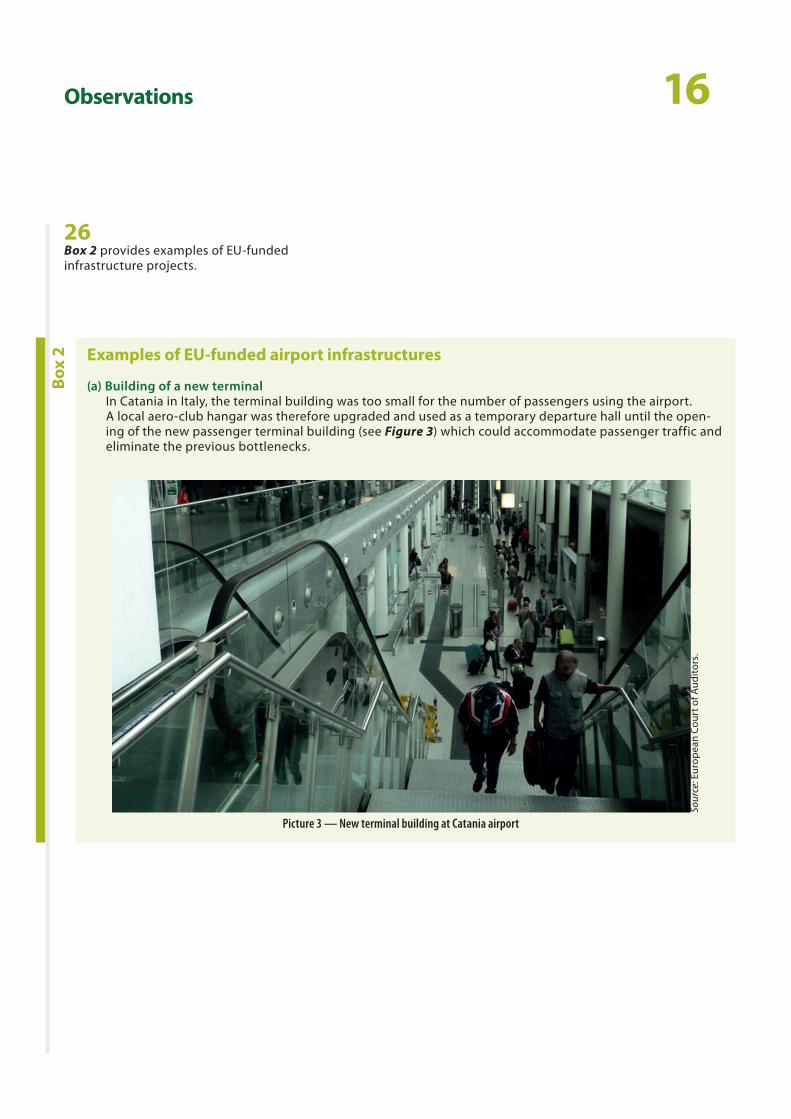
(a) Building of a new terminalIn Catania in Italy, the terminal building was too small for the number of passengers using the airport. A local aero‑club hangar was therefore upgraded and used as a temporary departure hall until the open‑ing of the new passenger terminal building (see Figure 3) which could accommodate passenger traffic and eliminate the previous bottlenecks.
Box
2
26 Box 2 provides examples of EU‑funded infrastructure projects.
Picture 3 — New terminal building at Catania airport
Sour
ce: E
urop
ean
Cour
t of A
udito
rs.
17Observations
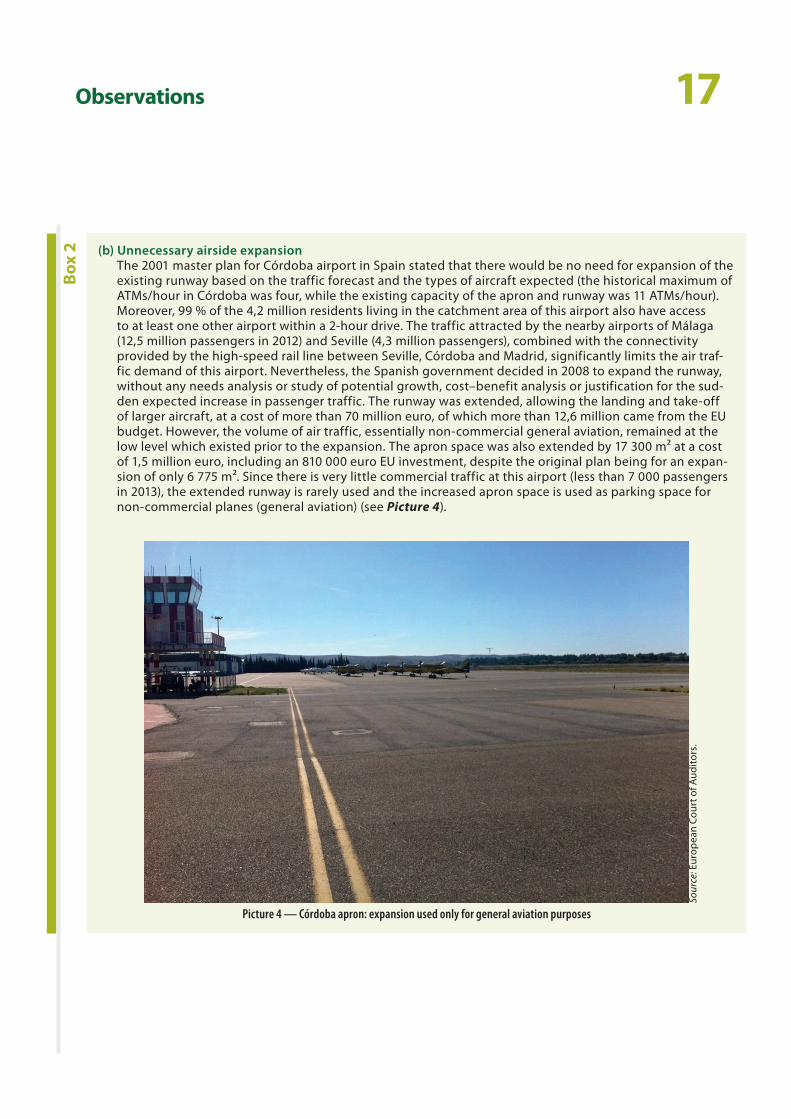
(b) Unnecessary airside expansionThe 2001 master plan for Córdoba airport in Spain stated that there would be no need for expansion of the existing runway based on the traffic forecast and the types of aircraft expected (the historical maximum of ATMs/hour in Córdoba was four, while the existing capacity of the apron and runway was 11 ATMs/hour). Moreover, 99 % of the 4,2 million residents living in the catchment area of this airport also have access to at least one other airport within a 2‑hour drive. The traffic attracted by the nearby airports of Málaga (12,5 million passengers in 2012) and Seville (4,3 million passengers), combined with the connectivity provided by the high‑speed rail line between Seville, Córdoba and Madrid, significantly limits the air traf‑fic demand of this airport. Nevertheless, the Spanish government decided in 2008 to expand the runway, without any needs analysis or study of potential growth, cost–benefit analysis or justification for the sud‑den expected increase in passenger traffic. The runway was extended, allowing the landing and take‑off of larger aircraft, at a cost of more than 70 million euro, of which more than 12,6 million came from the EU budget. However, the volume of air traffic, essentially non‑commercial general aviation, remained at the low level which existed prior to the expansion. The apron space was also extended by 17 300 m² at a cost of 1,5 million euro, including an 810 000 euro EU investment, despite the original plan being for an expan‑sion of only 6 775 m². Since there is very little commercial traffic at this airport (less than 7 000 passengers in 2013), the extended runway is rarely used and the increased apron space is used as parking space for non‑commercial planes (general aviation) (see Picture 4).
Box
2
Picture 4 — Córdoba apron: expansion used only for general aviation purposes
Sour
ce: E
urop
ean
Cour
t of A
udito
rs.
18Observations
Delays in constructions for most and cost overruns for half of the airports examined
27 The Court also examined whether the examined airport infrastructure pro‑jects were completed on time and on budget. The audit found that:
ο at the time of the audit, all but one project had been completed;
ο there were delays in construction and in the final delivery of the airport infrastructures in 17 of the 20 audited airports15. In 14 cases, the delay was more than a year with the average delay being 23 months. The longest delays were noted in Murcia‑San Javier, Thes‑saloniki and Naples16; and
ο there were cost overruns noted at 9 of the 20 audited airports, result‑ing in approximately 95,5 mil‑lion euro more being spent than initially budgeted (eight of these nine airports17 had cost overruns of several million euros). The high‑est cost overrun was noted in La Palma, with 25,6 million euro on the projects audited, and Thes‑saloniki, where the runway exten‑sion to the sea had a cost overrun of 21,7 million euro at the time of the audit. These cost overruns are more than 10 % of the total cost amount for these nine airports and are covered by national budgets18.
More than half of the constructions were under-used
28 The IATA19 manual suggests a careful approach when investing in airport infrastructure, recommending a policy of modular growth20. European Com‑mission guidance on such building stressed the need to make better use of existing capacity in the first instance and only build infrastructures which are necessary, proportional to the ob‑jective set and which have satisfactory medium‑term prospects for use21.
29 The Court examined the actual use of the EU‑funded infrastructures in the audited airports. To this purpose the Court assessed the use of the addition‑al terminal space created by analysing the annual number of passengers per m² as well as the use of the terminal at the peak hour. For airside invest‑ments, the Court examined the use of the capacity created by analysing the evolution of the ATM numbers.
15 The airports without any delay in the building and delivery of the infrastructure compared to initial planning were Crotone, Gdansk and Tartu.
16 In Murcia‑San Javier, the airside facilities, the control tower and the runway were put into operation 5 years after their completion; in Thessaloniki, the delay was 4,5 years for the terminal project; in Naples, the delay was 4,5 years for the air traffic management project despite the fact that the contracting authorities had awarded works directly for reasons of urgency.
17 The exception is the airport of Badajoz, where a small overrun of 223 000 euro or 2,8 % of the budget was noted.
18 In another audit the Court also noted similar weaknesses in project preparation in an airport infrastructure project financed under TEN‑T spending. In the case of Berlin Brandenburg international airport, planning documents were not ready and had to be modified during the tendering process, leading to significant cost overruns.
19 The International Air Transport Association is the trade association for the world’s airlines. It represents some 240 airlines or more than 84 % of total air traffic. IATA supports airline activity and helps formulate industry policy and standards.
20 Building of infrastructure in a modular fashion (phases) and at intervals to keep slightly ahead of demand, and to maintain predetermined and required levels of service. Source: Section C1.13.7 of the 2004 IATA Airport Development Reference Manual.
21 Point 61 of ‘Community guidelines on financing of airports and start‑up aid to airlines departing from regional airports’ (OJ C 312, 9.12.2005, p. 1).
19Observations
Yearly terminal utilisation rate after terminal expansion
Figu
re 4
Source: The airport authorities’ data.
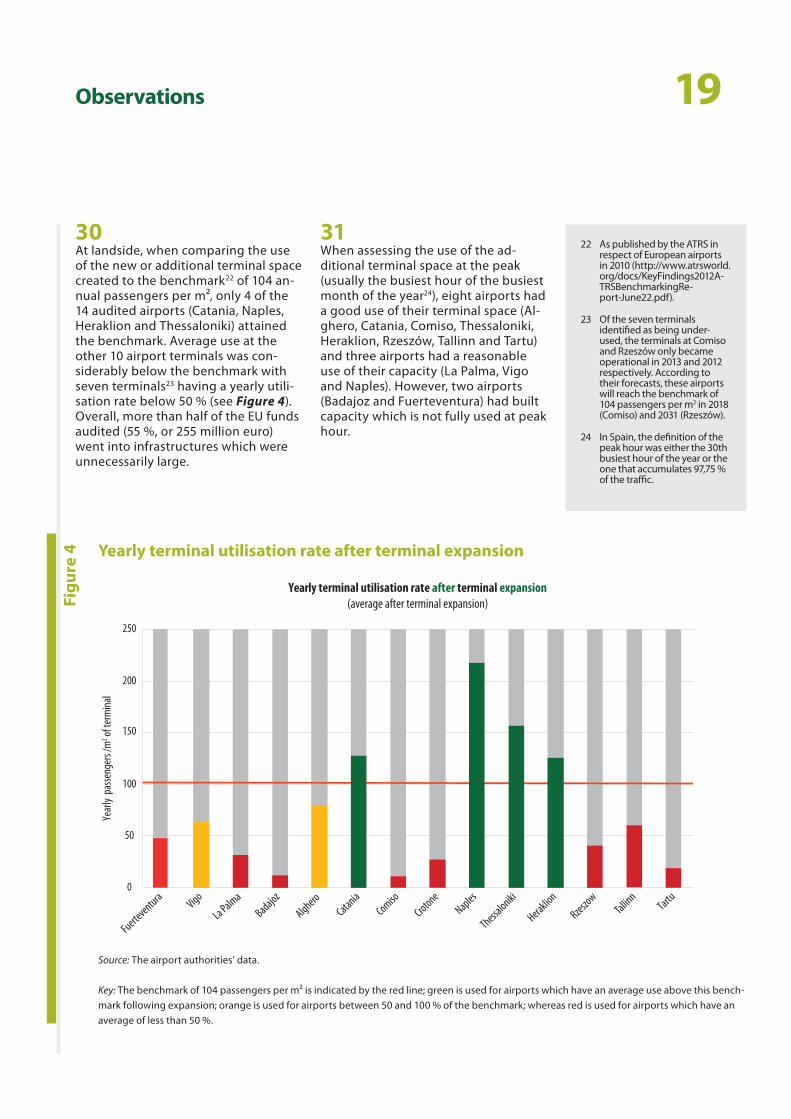
Key: The benchmark of 104 passengers per m² is indicated by the red line; green is used for airports which have an average use above this bench‑mark following expansion; orange is used for airports between 50 and 100 % of the benchmark; whereas red is used for airports which have an average of less than 50 %.
Fuerteventura Vigo
La Palma
Badajoz
AlgheroCatania
Comiso
CrotoneNaples
Thessaloniki
Heraklion
Rzeszow
Tallinn
Tartu
250
200
150
100
50
0
Year
ly pa
ssen
gers
/m2 of
term
inal
Yearly terminal utilisation rate after terminal expansion(average after terminal expansion)
30 At landside, when comparing the use of the new or additional terminal space created to the benchmark22 of 104 an‑nual passengers per m², only 4 of the 14 audited airports (Catania, Naples, Heraklion and Thessaloniki) attained the benchmark. Average use at the other 10 airport terminals was con‑siderably below the benchmark with seven terminals23 having a yearly utili‑sation rate below 50 % (see Figure 4). Overall, more than half of the EU funds audited (55 %, or 255 million euro) went into infrastructures which were unnecessarily large.
31 When assessing the use of the ad‑ditional terminal space at the peak (usually the busiest hour of the busiest month of the year24), eight airports had a good use of their terminal space (Al‑ghero, Catania, Comiso, Thessaloniki, Heraklion, Rzeszów, Tallinn and Tartu) and three airports had a reasonable use of their capacity (La Palma, Vigo and Naples). However, two airports (Badajoz and Fuerteventura) had built capacity which is not fully used at peak hour.
22 As published by the ATRS in respect of European airports in 2010 (http://www.atrsworld.org/docs/KeyFindings2012A‑TRSBenchmarkingRe‑port‑June22.pdf).
23 Of the seven terminals identified as being under‑used, the terminals at Comiso and Rzeszów only became operational in 2013 and 2012 respectively. According to their forecasts, these airports will reach the benchmark of 104 passengers per m2 in 2018 (Comiso) and 2031 (Rzeszów).
24 In Spain, the definition of the peak hour was either the 30th busiest hour of the year or the one that accumulates 97,75 % of the traffic.
20Observations
Examples of oversized infrastructures
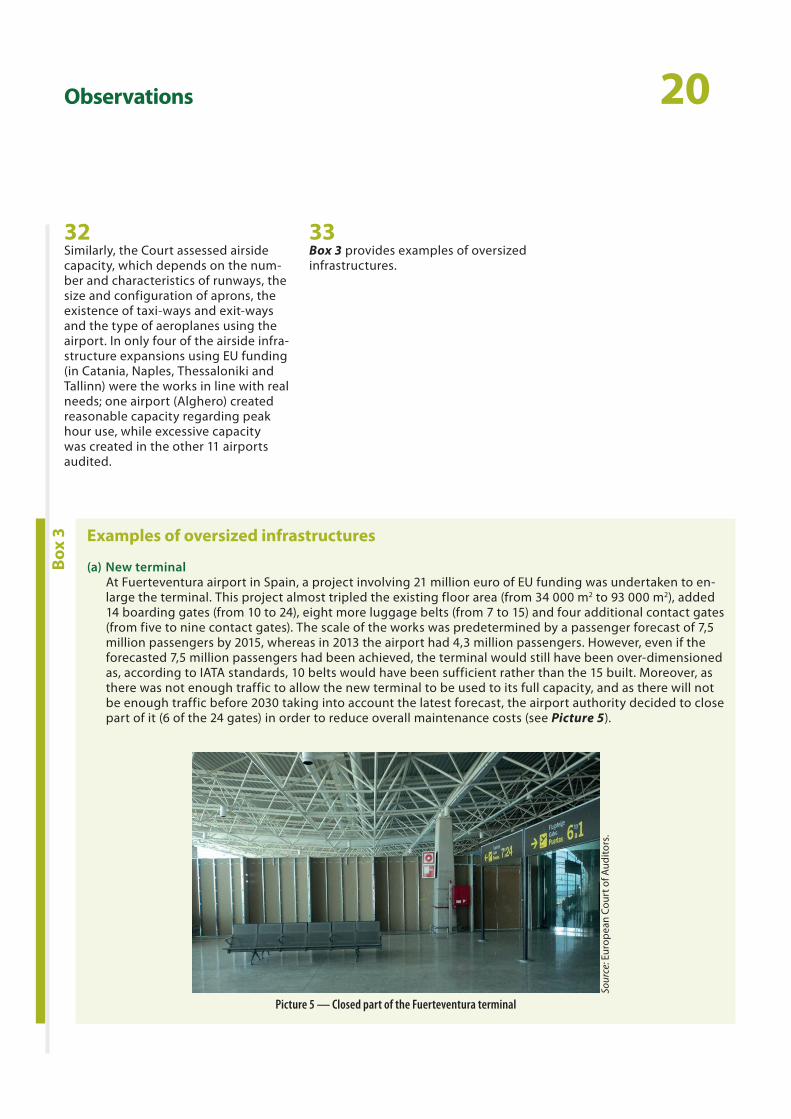
(a) New terminalAt Fuerteventura airport in Spain, a project involving 21 million euro of EU funding was undertaken to en‑large the terminal. This project almost tripled the existing floor area (from 34 000 m2 to 93 000 m2), added 14 boarding gates (from 10 to 24), eight more luggage belts (from 7 to 15) and four additional contact gates (from five to nine contact gates). The scale of the works was predetermined by a passenger forecast of 7,5 million passengers by 2015, whereas in 2013 the airport had 4,3 million passengers. However, even if the forecasted 7,5 million passengers had been achieved, the terminal would still have been over‑ dimensioned as, according to IATA standards, 10 belts would have been sufficient rather than the 15 built. Moreover, as there was not enough traffic to allow the new terminal to be used to its full capacity, and as there will not be enough traffic before 2030 taking into account the latest forecast, the airport authority decided to close part of it (6 of the 24 gates) in order to reduce overall maintenance costs (see Picture 5).
Box
3
32 Similarly, the Court assessed airside capacity, which depends on the num‑ber and characteristics of runways, the size and configuration of aprons, the existence of taxi‑ways and exit‑ways and the type of aeroplanes using the airport. In only four of the airside infra‑structure expansions using EU funding (in Catania, Naples, Thessaloniki and Tallinn) were the works in line with real needs; one airport (Alghero) created reasonable capacity regarding peak hour use, while excessive capacity was created in the other 11 airports audited.
33 Box 3 provides examples of oversized infrastructures.
Sour
ce: E
urop
ean
Cour
t of A
udito
rs.
Picture 5 — Closed part of the Fuerteventura terminal
21Observations
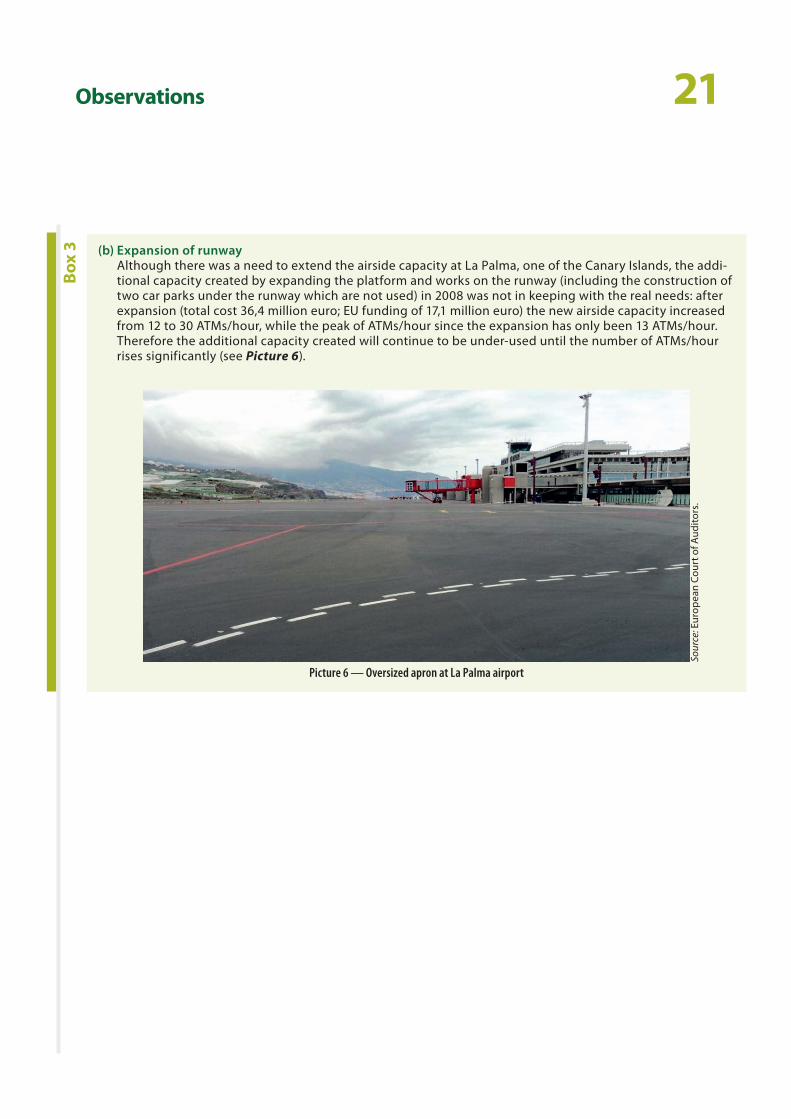
(b) Expansion of runwayAlthough there was a need to extend the airside capacity at La Palma, one of the Canary Islands, the addi‑tional capacity created by expanding the platform and works on the runway (including the construction of two car parks under the runway which are not used) in 2008 was not in keeping with the real needs: after expansion (total cost 36,4 million euro; EU funding of 17,1 million euro) the new airside capacity increased from 12 to 30 ATMs/hour, while the peak of ATMs/hour since the expansion has only been 13 ATMs/hour. Therefore the additional capacity created will continue to be under‑used until the number of ATMs/hour rises significantly (see Picture 6).
Box
3
Sour
ce: E
urop
ean
Cour
t of A
udito
rs.
Picture 6 — Oversized apron at La Palma airport
22Observations
Empty and unused airport infrastructures
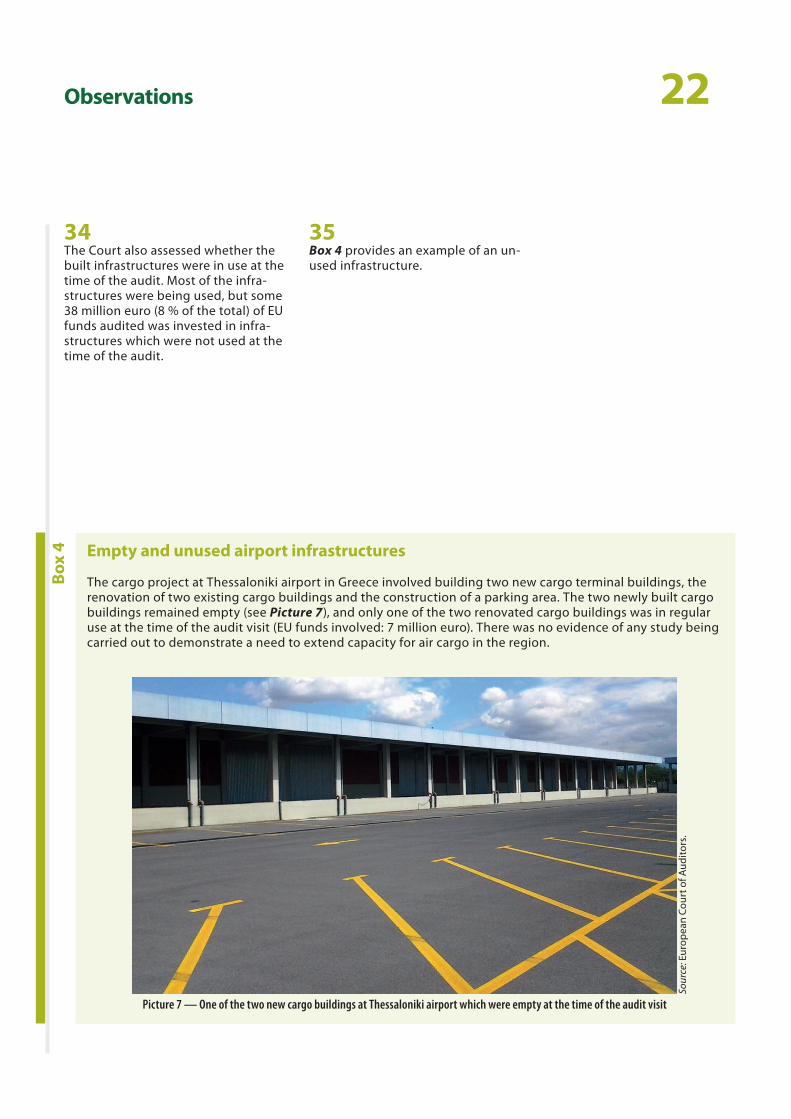
The cargo project at Thessaloniki airport in Greece involved building two new cargo terminal buildings, the renovation of two existing cargo buildings and the construction of a parking area. The two newly built cargo buildings remained empty (see Picture 7), and only one of the two renovated cargo buildings was in regular use at the time of the audit visit (EU funds involved: 7 million euro). There was no evidence of any study being carried out to demonstrate a need to extend capacity for air cargo in the region.
Box
4
34 The Court also assessed whether the built infrastructures were in use at the time of the audit. Most of the infra‑structures were being used, but some 38 million euro (8 % of the total) of EU funds audited was invested in infra‑structures which were not used at the time of the audit.
35 Box 4 provides an example of an un‑used infrastructure.
Sour
ce: E
urop
ean
Cour
t of A
udito
rs.
Picture 7 — One of the two new cargo buildings at Thessaloniki airport which were empty at the time of the audit visit
23Observations
EU funding for investments which are not cost-effective
36 For infrastructure projects, at the pro‑ject application approval stage, an in‑vestment decision is made based upon the projected costs and revenues of future operation. Theoretically the pro‑ject should only go ahead if forecast revenues more than cover costs and ideally make a contribution towards financial sustainability. The risk to EU investment in such projects would be that the forecast costs and revenues turn out to have been unrealistic. For the type of project examined, the main areas of concern would be a failure to see the expected increase in passen‑ger numbers or that costs have been underestimated.
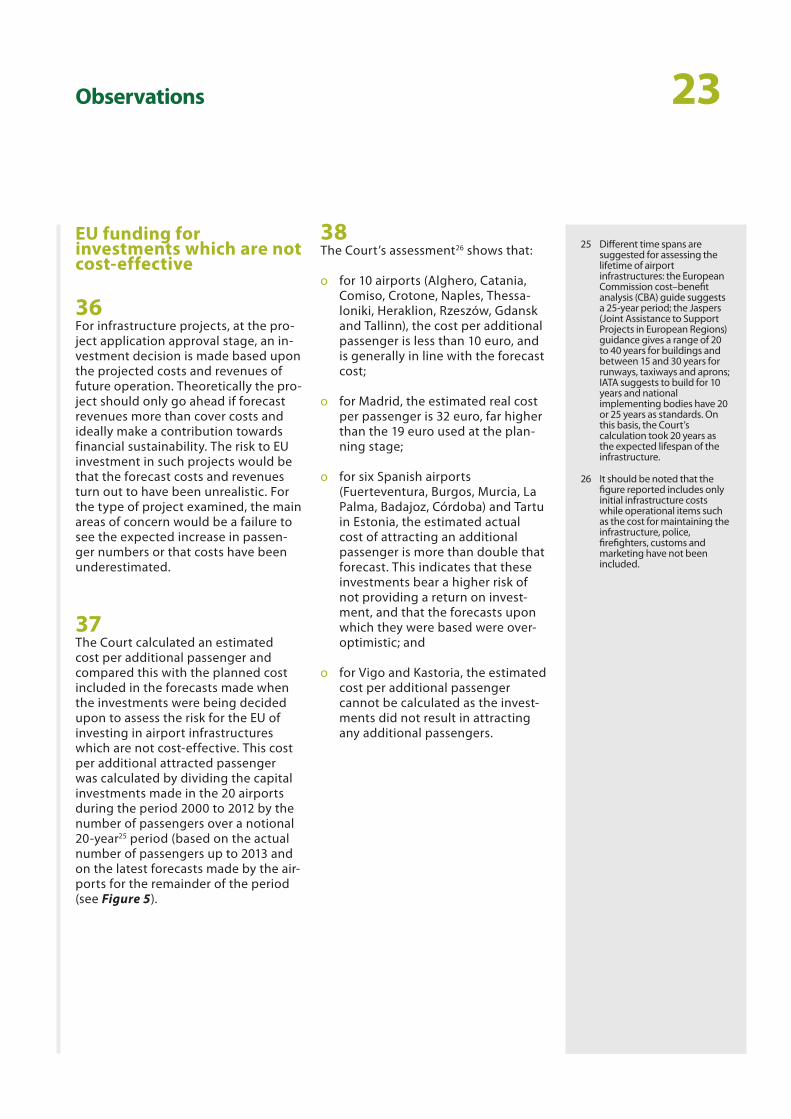
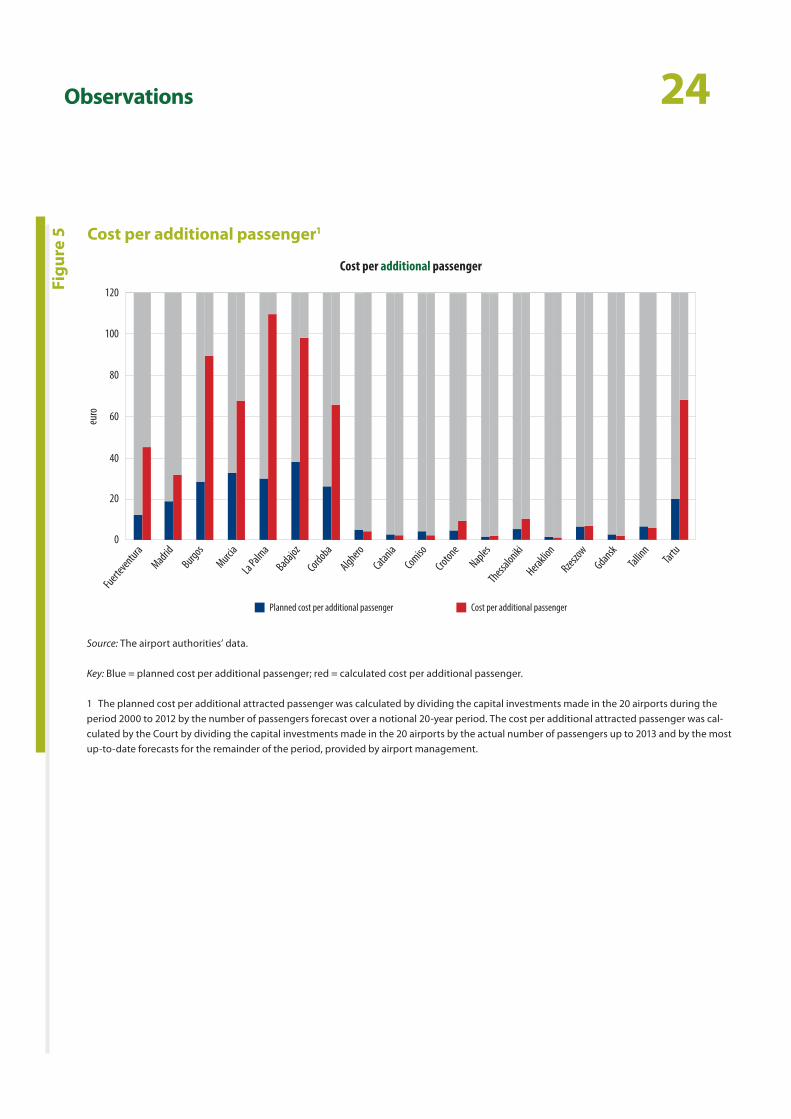
37 The Court calculated an estimated cost per additional passenger and compared this with the planned cost included in the forecasts made when the investments were being decided upon to assess the risk for the EU of investing in airport infrastructures which are not cost‑effective. This cost per additional attracted passenger was calculated by dividing the capital investments made in the 20 airports during the period 2000 to 2012 by the number of passengers over a notional 20‑year25 period (based on the actual number of passengers up to 2013 and on the latest forecasts made by the air‑ports for the remainder of the period (see Figure 5).
38 The Court’s assessment26 shows that:
ο for 10 airports (Alghero, Catania, Comiso, Crotone, Naples, Thessa‑loniki, Heraklion, Rzeszów, Gdansk and Tallinn), the cost per additional passenger is less than 10 euro, and is generally in line with the forecast cost;
ο for Madrid, the estimated real cost per passenger is 32 euro, far higher than the 19 euro used at the plan‑ning stage;
ο for six Spanish airports (Fuerteventura, Burgos, Murcia, La Palma, Badajoz, Córdoba) and Tartu in Estonia, the estimated actual cost of attracting an additional passenger is more than double that forecast. This indicates that these investments bear a higher risk of not providing a return on invest‑ment, and that the forecasts upon which they were based were over‑optimistic; and
ο for Vigo and Kastoria, the estimated cost per additional passenger cannot be calculated as the invest‑ments did not result in attracting any additional passengers.
25 Different time spans are suggested for assessing the lifetime of airport infrastructures: the European Commission cost–benefit analysis (CBA) guide suggests a 25‑year period; the Jaspers (Joint Assistance to Support Projects in European Regions) guidance gives a range of 20 to 40 years for buildings and between 15 and 30 years for runways, taxiways and aprons; IATA suggests to build for 10 years and national implementing bodies have 20 or 25 years as standards. On this basis, the Court’s calculation took 20 years as the expected lifespan of the infrastructure.
26 It should be noted that the figure reported includes only initial infrastructure costs while operational items such as the cost for maintaining the infrastructure, police, firefighters, customs and marketing have not been included.
24Observations
Cost per additional passenger1
Figu
re 5
Source: The airport authorities’ data.
Key: Blue = planned cost per additional passenger; red = calculated cost per additional passenger.
1 The planned cost per additional attracted passenger was calculated by dividing the capital investments made in the 20 airports during the period 2000 to 2012 by the number of passengers forecast over a notional 20‑year period. The cost per additional attracted passenger was cal‑culated by the Court by dividing the capital investments made in the 20 airports by the actual number of passengers up to 2013 and by the most up‑to‑date forecasts for the remainder of the period, provided by airport management.
0
20
40
60
80
100
120
FuerteventuraMadridBurgos
MurciaLa Palm
aBadajoz
Tartu
Tallinn
Gdansk
Rzeszow
Heraklion
Thessaloniki
Naples
Comiso
Catania
Alghero
Cordoba
Crotone
Planned cost per additional passenger Cost per additional passenger
euro
Cost per additional passenger
25Observations
Seven of the 20 audited airports are not financially self-sustainable
39 The Court also assessed whether the audited airports are financially self‑sustainable and profitable27. To this end the Court carried out an analy‑sis of the financial statements of the airports.
40 The analysis showed that 4 of the 20 audited airports were regularly profitable during the audited period (Catania, Naples, Tallinn and Gdansk). Seven airports, whilst not yet profit‑able, had prospects of breaking even in the medium term (Fuerteventura, Madrid‑Barajas, Murcia, Alghero, Co‑miso, Rzeszów and Tartu) but another seven airports audited (Badajoz, Bur‑gos, Córdoba, La Palma, Vigo, Crotone and Kastoria) made significant losses between 2007 and 2012.
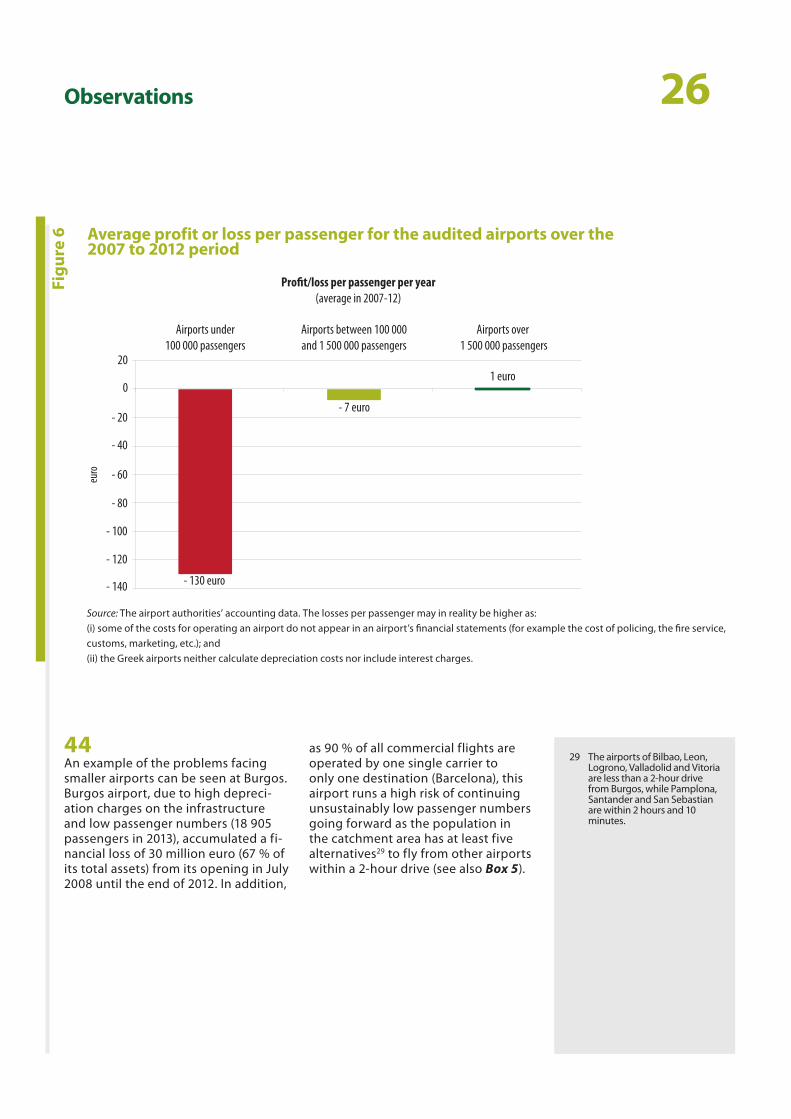
41 The Court also calculated a profit or loss per passenger using the airports’ financial statements and categorised the airports using three thresholds based on the number of passengers served on average during the audited period: fewer than 100 000 passen‑gers, between 100 000 and 1 500 000 passengers, and more than 1 500 000 passengers. This analysis (see Figure 6) shows that airports with fewer than 100 000 passengers per year made an average loss per passenger of 130 euro over the period.
42 Although not the only factor, the low number of passengers at many of the airports audited suggests that there is a high risk that there will not be a financial turnaround in the medium term (the lower the passenger num‑bers, the higher the loss per passenger as such items as high fixed costs or depreciation are spread across a rela‑tively small number). Typically, those with fewer than 100 000 passengers per year are smaller regional airports, which will struggle to remain in opera‑tion without continuing financial sup‑port from public funds.
43 Investments in airport infrastructure also imply costs in future years for both operations and maintenance. Therefore, any decision to invest in such airports needs to be based upon convincing evidence that the socioeco‑nomic benefits will outweigh the often significant costs involved28.
27 Based on the financial statements provided by the HCAA for the airports of Thessaloniki, Heraklion and Kastoria only an estimation of cash flows could be produced by the Court.
28 For example, in order to cut costs while maintaining the operability of smaller airports, the Spanish Ministry of Development decided in June 2012 to reduce the maintenance costs of 17 airports having fewer than 500 000 passengers per year, and decreased their weekly operating hours and staff numbers.
26Observations
Average profit or loss per passenger for the audited airports over the 2007 to 2012 period
Figu
re 6
Source: The airport authorities’ accounting data. The losses per passenger may in reality be higher as:(i) some of the costs for operating an airport do not appear in an airport’s financial statements (for example the cost of policing, the fire service, customs, marketing, etc.); and(ii) the Greek airports neither calculate depreciation costs nor include interest charges.
29 The airports of Bilbao, Leon, Logrono, Valladolid and Vitoria are less than a 2‑hour drive from Burgos, while Pamplona, Santander and San Sebastian are within 2 hours and 10 minutes.
20
0
- 20
- 40
- 60
- 80
- 100
- 120
- 140
euro
Profit/loss per passenger per year (average in 2007-12)
Airports over 1 500 000 passengers
Airports between 100 000and 1 500 000 passengers
Airports under100 000 passengers
1 euro
- 7 euro
- 130 euro
44 An example of the problems facing smaller airports can be seen at Burgos. Burgos airport, due to high depreci‑ation charges on the infrastructure and low passenger numbers (18 905 passengers in 2013), accumulated a fi‑nancial loss of 30 million euro (67 % of its total assets) from its opening in July 2008 until the end of 2012. In addition,
as 90 % of all commercial flights are operated by one single carrier to only one destination (Barcelona), this airport runs a high risk of continuing unsustainably low passenger numbers going forward as the population in the catchment area has at least five alternatives29 to fly from other airports within a 2‑hour drive (see also Box 5).
27Observations
Example of an airport which is not financially self-sustainable
In Kastoria, airport revenue was 176 000 euro for 2005–12 whilst, during the same period, the total cost of keeping the airport open was 7,7 million euro. For the period given, the total number of passengers was 25 thousand people representing a loss of about 275 euro per passenger. Some 16,5 million euro (5,6 mil‑lion euro of EU funds) has been invested in an extension to the runway at this airport which has up to the time of this report never been used by the type of aircraft for which the extension was built. This cannot be consid‑ered as an effective use of public funds.
Box
5
45 According to the Airports Council International (ACI) Economics Report 2011, airports with over 5 million pas‑sengers per year can operate profit‑ably, airports having between 1 and 5 million passengers per year can meet their operational expenses and the revenues of smaller airports cannot even cover their variable costs. This is in keeping with the Court’s own calcu‑lations outlined in Figure 6.
Forecast of passenger numbers significantly over-optimistic for 12 of the 20 airports examined
46 The Court assessed the quality and the reliability of the traffic forecasts that were prepared to support the invest‑ment decisions, examining the diver‑gences with the actual evolution of passenger numbers.
47 The Court found that the forecasts of additional passenger numbers con‑tained within these plans were sig‑nificantly over‑optimistic in 12 out of 20 airports. For example, in Córdoba, in 2013, 6 955 passengers travelled, against 179 000 forecast, and for Crotone, the numbers were 28 892 pas‑sengers, against 306 000 forecast.
28Observations
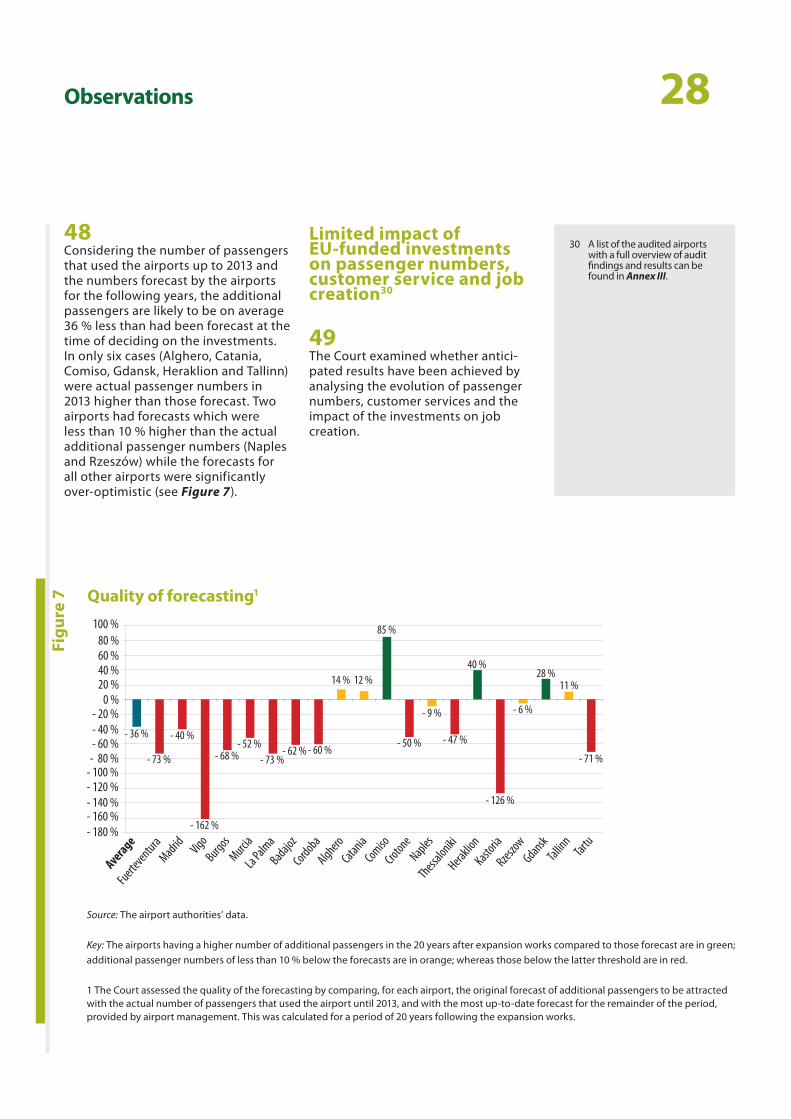
48 Considering the number of passengers that used the airports up to 2013 and the numbers forecast by the airports for the following years, the additional passengers are likely to be on average 36 % less than had been forecast at the time of deciding on the investments. In only six cases (Alghero, Catania, Comiso, Gdansk, Heraklion and Tallinn) were actual passenger numbers in 2013 higher than those forecast. Two airports had forecasts which were less than 10 % higher than the actual additional passenger numbers (Naples and Rzeszów) while the forecasts for all other airports were significantly over‑optimistic (see Figure 7).
Limited impact of EU-funded investments on passenger numbers, customer service and job creation30
49 The Court examined whether antici‑pated results have been achieved by analysing the evolution of passenger numbers, customer services and the impact of the investments on job creation.
30 A list of the audited airports with a full overview of audit findings and results can be found in Annex III.
Quality of forecasting1
Figu
re 7
Source: The airport authorities’ data.
Key: The airports having a higher number of additional passengers in the 20 years after expansion works compared to those forecast are in green; additional passenger numbers of less than 10 % below the forecasts are in orange; whereas those below the latter threshold are in red.
1 The Court assessed the quality of the forecasting by comparing, for each airport, the original forecast of additional passengers to be attracted with the actual number of passengers that used the airport until 2013, and with the most up‑to‑date forecast for the remainder of the period, provided by airport management. This was calculated for a period of 20 years following the expansion works.
- 180 %- 160 %- 140 %
100 %80 %60 %40 %20 %
0 %- 20 %- 40 %- 60 %
- 80 %- 100 %- 120 %
FuerteventuraMadrid
BurgosMurcia
La Palma
Badajoz
Tartu
Tallinn
Gdansk
Kastoria
Heraklion
Thessaloniki
Naples
Comiso
Catania
Alghero
Cordoba
Crotone
Vigo
Rzeszow
Average
- 73 %
- 36 %
- 162 %
- 40 %
- 68 %- 52 %
- 73 %- 62 % - 60 % - 50 %
- 9 %
- 47 %
- 126 %
- 6 %
- 71 %
11 %28 %
40 %
85 %
12 %14 %
29Observations
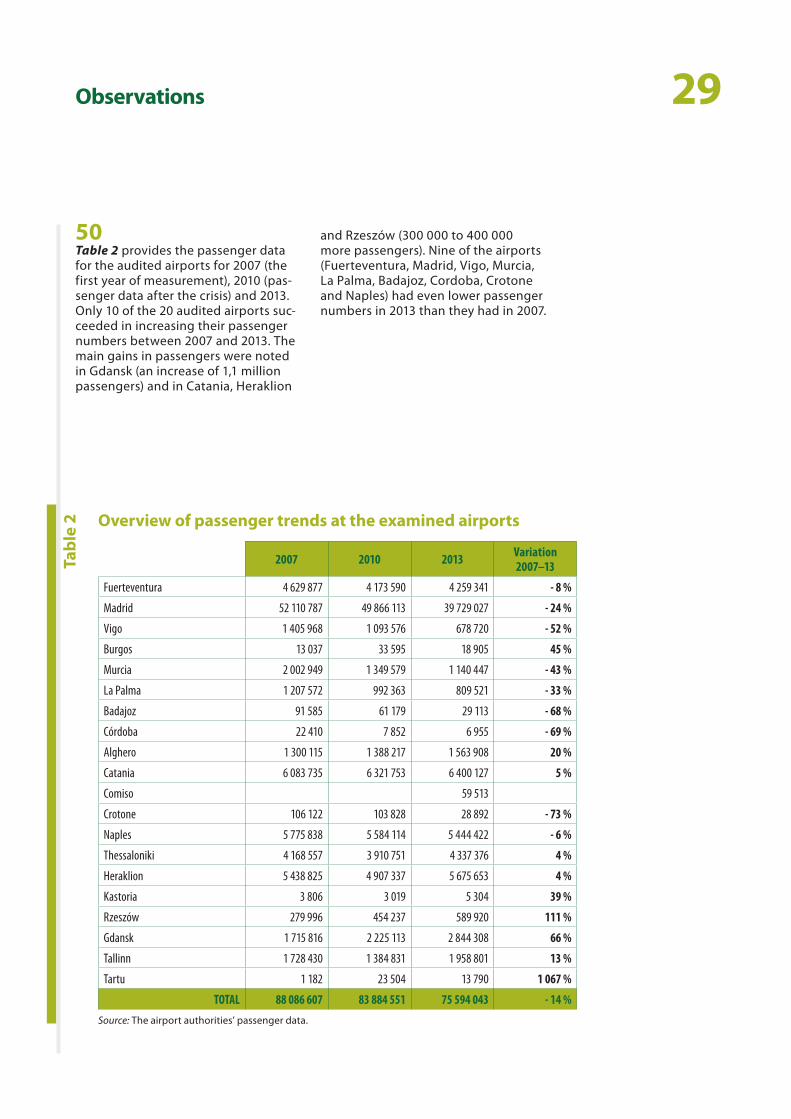
50 Table 2 provides the passenger data for the audited airports for 2007 (the first year of measurement), 2010 (pas‑senger data after the crisis) and 2013. Only 10 of the 20 audited airports suc‑ceeded in increasing their passenger numbers between 2007 and 2013. The main gains in passengers were noted in Gdansk (an increase of 1,1 million passengers) and in Catania, Heraklion
and Rzeszów (300 000 to 400 000 more passengers). Nine of the airports (Fuerteventura, Madrid, Vigo, Murcia, La Palma, Badajoz, Cordoba, Crotone and Naples) had even lower passenger numbers in 2013 than they had in 2007.
Overview of passenger trends at the examined airports
2007 2010 2013 Variation 2007–13
Fuerteventura 4 629 877 4 173 590 4 259 341 - 8 %
Madrid 52 110 787 49 866 113 39 729 027 - 24 %
Vigo 1 405 968 1 093 576 678 720 - 52 %
Burgos 13 037 33 595 18 905 45 %
Murcia 2 002 949 1 349 579 1 140 447 - 43 %
La Palma 1 207 572 992 363 809 521 - 33 %
Badajoz 91 585 61 179 29 113 - 68 %
Córdoba 22 410 7 852 6 955 - 69 %
Alghero 1 300 115 1 388 217 1 563 908 20 %
Catania 6 083 735 6 321 753 6 400 127 5 %
Comiso 59 513
Crotone 106 122 103 828 28 892 - 73 %
Naples 5 775 838 5 584 114 5 444 422 - 6 %
Thessaloniki 4 168 557 3 910 751 4 337 376 4 %
Heraklion 5 438 825 4 907 337 5 675 653 4 %
Kastoria 3 806 3 019 5 304 39 %
Rzeszów 279 996 454 237 589 920 111 %
Gdansk 1 715 816 2 225 113 2 844 308 66 %
Tallinn 1 728 430 1 384 831 1 958 801 13 %
Tartu 1 182 23 504 13 790 1 067 %
TOTAL 88 086 607 83 884 551 75 594 043 - 14 %
Source: The airport authorities’ passenger data.
Tabl
e 2
30Observations
51 Evidence showing improvements in customer service was limited. At three airports (Fuerteventura, Thessaloniki and Heraklion) EU‑funded projects had specific objectives to increase the quality of service to passengers. Surveys among passengers and airlines using ‘satisfaction indicators’ generally indicated an upward trend of customer service since 2010 at these three airports. This was also the case for eight others (Badajoz, La Palma, Madrid‑Barajas, Vigo, Alghero, Catania, Naples and Rzeszów). In the remain‑ing nine airports, there was either no improvement in the quality of service provided to passengers, or no meas‑urement of whether such improve‑ments had taken place.
52 Job creation and economic growth are generally claimed to be good reasons for investing in airports. The Court found, however, that socioeconomic benefits were generally not measured. There was also little evidence that ad‑ditional jobs were created as a result of the EU investments in the audited projects. In the case of four airports (Comiso, Rzeszów, Gdansk and Tallinn), a limited number of newly created permanent jobs can be directly linked to the EU projects audited. Studies provided by Madrid‑Barajas, Alghero and Gdansk indicate generic benefits for a region from the siting of an air‑port and its operation. However, these studies do not establish a link between an improvement in regional GDP figures and EU‑funded investments in airport infrastructures.
Similar investments in airports in close proximity to each other
53 The Court also examined the area of influence of the airports, i.e. their capacity to attract visitors and cus‑tomers (the catchment area) which depends on the population nearby and the surface transport possibili‑ties. To this purpose the Court used the latest Eurostat data available on current road connections, traffic speed data, population and potential tour‑ist numbers31. The Court analysed the overlaps of catchment areas, applying a uniform criterion of 120 minutes’ driving distance32.
54 This analysis (all charts for the audited airports are in Annex IV) indicates the following.
ο For 13 out of 18 audited airports33, significant overlaps34 exist with the catchment areas of neighbouring airports, and in many cases there are overlaps with several catch‑ment areas. The vast majority of the population living in the catch‑ment area of the airports audited had several other opportunities within a 2‑hour drive to travel by air via a neighbouring airport. Only five airports of the audited sample (Madrid‑Barajas, Badajoz, Tartu, Tallinn and Rzeszów) were located in places where the majority of the population had limited oppor‑tunities to choose an alternative airport within a 2‑hour drive.
31 The latest road data available was from the 2009 TeleAtlas road network. Population data were based on the 2006 population grid. Tourism data were also from 2006, derived from nights spent in tourist accommodations and number of beds. Airport locations were taken from the reference database of Eurostat (GISCO). Nearby competitor airports were identified based on the number of passengers per year (airports having fewer than 15 000 passengers per year were not considered).
32 While accepting that each individual airport has its own specificities, the Court has opted to use an overall 2‑hour catchment area definition for its assessment, as this was supported by various references in the relevant literature: e.g. Starkie 2008, Marucci and Gatta, 2009. In addition, many passengers go beyond this time: for example there are regular bus lines scheduled to bring passengers from the audited airport of Tartu to Riga in 3,5 hours (https://www.airbaltic.com/en/bus).
33 The airports of Fuerteventura and La Palma were excluded from this assessment, as these are single‑island airports.
34 The Court considers an overlap to be significant if more than 75 % of the population has access to multiple airports within a range of 120 minutes’ driving time.
31Observations
ο There is a proliferation of airports very close to each other which invested in similar infrastructure (terminals, aprons, runways): although most airports had sig‑nificant overlaps, there was little consideration given to investments in neighbouring airports, which would have been necessary for rational planning and optimising the use of EU funds.
55 An alternative analysis carried out by the Court, using the 90 minutes’ driving distance as criterion which has also been used by the Commission in a 2013 study35, has resulted in similar findings36.
56 Only some airports used catchment area analysis in their future invest‑ment planning. However, each airport had a differently defined catchment area as none of the Member States had established a common defini‑tion. Catchment area analysis was generally not used to identify overlaps between airports in close proximity to each other and their consequences on growth potential. This often resulted in the double counting of potential passengers in the totals used by each airport to justify its expansion (for example, the master plans of Catania and Comiso airports, both of which received significant EU funds, double counted a major part of the population living in the catchment area of both airports).
57 The impact of the investments made in the nearby airports or the impact of competing modes of surface transport was usually not taken into considera‑tion when deciding whether or not to expand an airport’s capacity (see the two examples in Box 6). A notable exception was Madrid‑Barajas airport, where traffic forecasts were adjusted to take into account the fact that the air route to Barcelona would lose 40 % of its passengers as a result of the expected opening of a high‑speed rail line.
35 Commission publication ‘Measuring accessibility to passenger flights in Europe: Towards harmonised indicators at regional level’, Regional Focus, 01/2013, September 2013.
36 The percentage of residents with access to multiple airports — when using the 90 minutes’ instead of the 120 minutes’ driving distance criterion — remains over 75 % for 12 audited airports.
32Observations
Examples of catchment area analysis
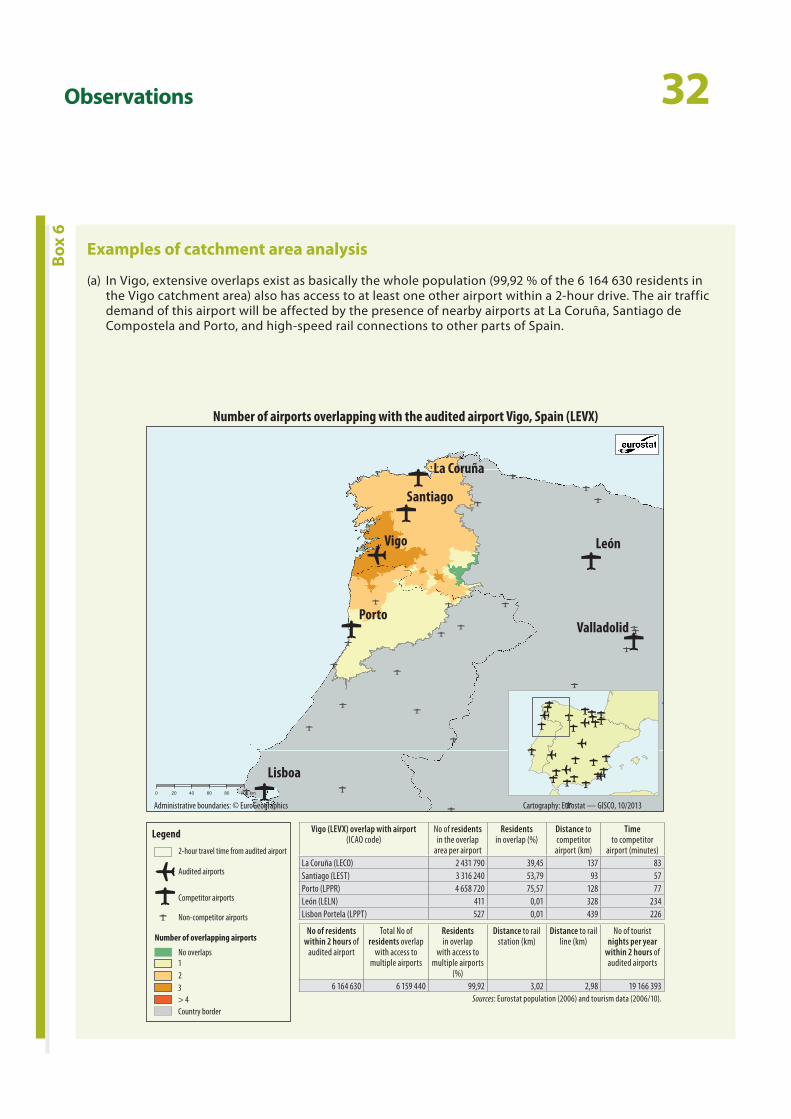
(a) In Vigo, extensive overlaps exist as basically the whole population (99,92 % of the 6 164 630 residents in the Vigo catchment area) also has access to at least one other airport within a 2‑hour drive. The air traffic demand of this airport will be affected by the presence of nearby airports at La Coruña, Santiago de Compostela and Porto, and high‑speed rail connections to other parts of Spain.
Box
6
Lisboa
Santiago
Vigo
La Coruña
León
Valladolid
Porto
0 20 40 60 80 100 km
Number of airports overlapping with the audited airport Vigo, Spain (LEVX)
123
Cartography: Eurostat — GISCO, 10/2013
Legend
2-hour travel time from audited airport
Audited airports
Competitor airports
Non-competitor airports
Number of overlapping airports
No overlaps
> 4Country border
Administrative boundaries: © EuroGeographics
Vigo (LEVX) overlap with airport(ICAO code)
No of residents in the overlap
area per airport
Residentsin overlap (%)
Distance to competitor
airport (km)
Timeto competitor
airport (minutes)La Coruña (LECO) 2 431 790 39,45 137 83Santiago (LEST) 3 316 240 53,79 93 57Porto (LPPR) 4 658 720 75,57 128 77León (LELN) 411 0,01 328 234Lisbon Portela (LPPT) 527 0,01 439 226
No of residents within 2 hours of
audited airport
Total No of residents overlap
with access to multiple airports
Residents in overlap
with access to multiple airports
(%)
Distance to rail station (km)
Distance to rail line (km)
No of tourist nights per year
within 2 hours of audited airports
6 164 630 6 159 440 99,92 3,02 2,98 19 166 393Sources: Eurostat population (2006) and tourism data (2006/10).
33Observations
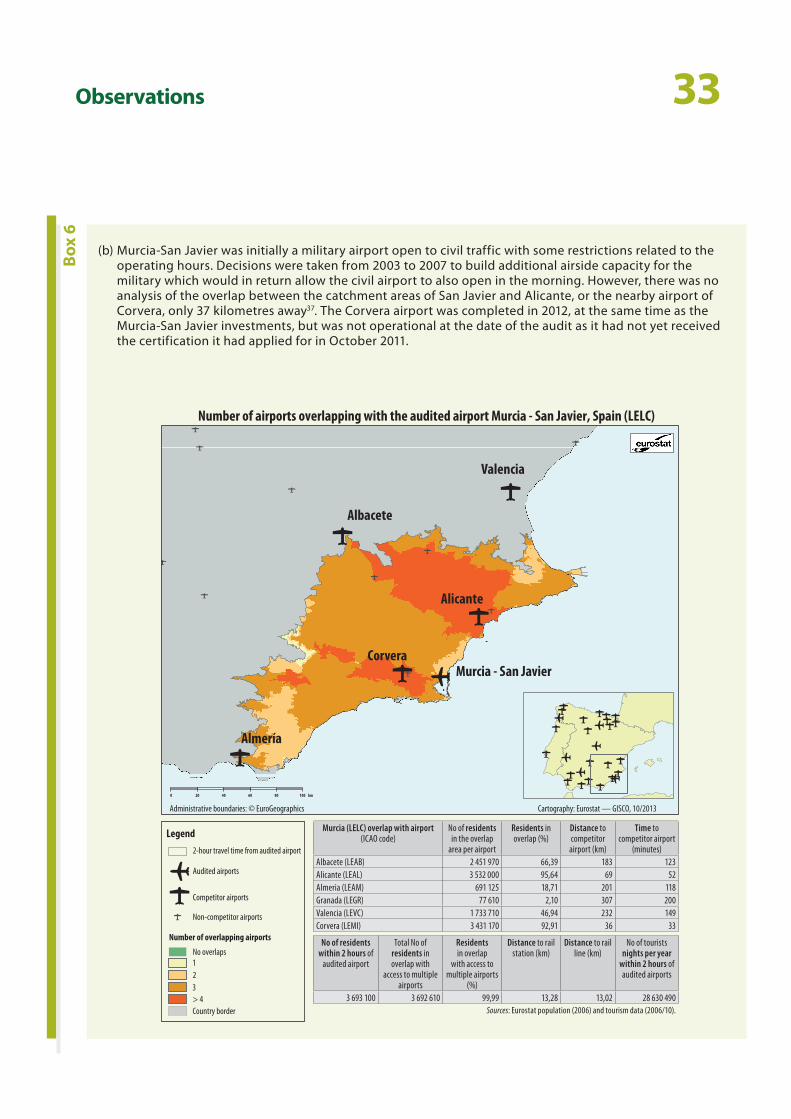
(b) Murcia‑San Javier was initially a military airport open to civil traffic with some restrictions related to the operating hours. Decisions were taken from 2003 to 2007 to build additional airside capacity for the military which would in return allow the civil airport to also open in the morning. However, there was no analysis of the overlap between the catchment areas of San Javier and Alicante, or the nearby airport of Corvera, only 37 kilometres away37. The Corvera airport was completed in 2012, at the same time as the Murcia‑San Javier investments, but was not operational at the date of the audit as it had not yet received the certification it had applied for in October 2011.
Box
6
0 20 40 60 80 100 km
Albacete
Almería
CorveraMurcia - San Javier
Alicante
Valencia
Number of airports overlapping with the audited airport Murcia - San Javier, Spain (LELC)
Administrative boundaries: © EuroGeographics Cartography: Eurostat — GISCO, 10/2013
123
Legend
2-hour travel time from audited airport
Audited airports
Competitor airports
Non-competitor airports
Number of overlapping airports
No overlaps
> 4Country border
Murcia (LELC) overlap with airport(ICAO code)
No of residents in the overlap
area per airport
Residents inoverlap (%)
Distance tocompetitor
airport (km)
Time to competitor airport
(minutes)Albacete (LEAB) 2 451 970 66,39 183 123Alicante (LEAL) 3 532 000 95,64 69 52Almeria (LEAM) 691 125 18,71 201 118Granada (LEGR) 77 610 2,10 307 200Valencia (LEVC) 1 733 710 46,94 232 149Corvera (LEMI) 3 431 170 92,91 36 33
No of residents within 2 hours of
audited airport
Total No of residents in overlap with
access to multiple airports
Residents in overlap
with access to multiple airports
(%)
Distance to rail station (km)
Distance to rail line (km)
No of tourists nights per year
within 2 hours of audited airports
3 693 100 3 692 610 99,99 13,28 13,02 28 630 490Sources: Eurostat population (2006) and tourism data (2006/10).
34Observations
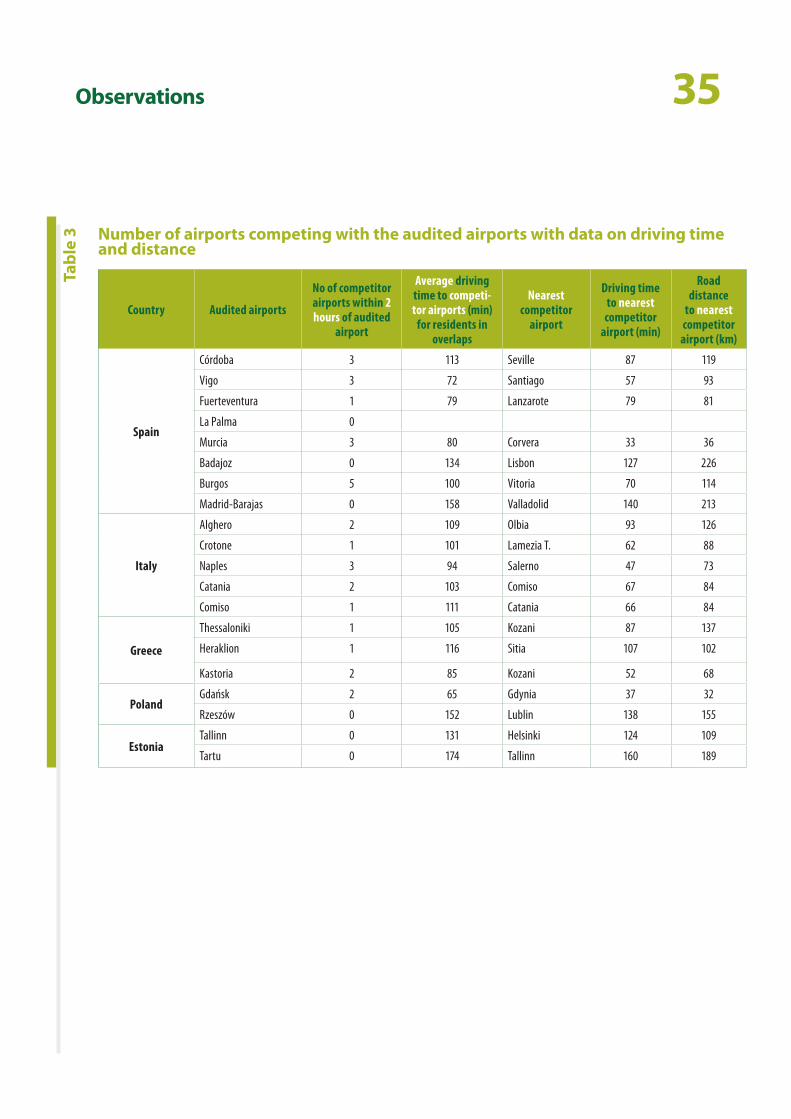
58 For the airports of Córdoba, Vigo, Mur‑cia, Burgos, Alghero, Crotone, Naples, Catania, Comiso, Kastoria and Gdansk, overlaps in their catchment areas were particularly pronounced. The nearest competitor airport is in most cases only a 1‑hour drive away and 97 % of those living within 2 hours of these 11 airports also have access to at least another airport within a 2‑hour drive. In Córdoba, Vigo, Murcia and Naples, there are three competitor airports within a 2‑hour drive and in the case of Burgos there are five competitor airports within the same range, see Table 3.
59 The definition used by the Commis‑sion for issuing state aid decisions is that the catchment area of an air‑port in general means a geographic market boundary that is normally set at around 100 kilometres or around 60 minutes’ travelling time by car, bus, train or high‑speed train. On the basis of new guidelines on state aid adopted in February 2014, the Commission adopted a number of decisions con‑cerning investment and operating aid to airports and airlines highlighting that: (i) subsidies to airport infrastruc‑tures which are too close to each other do not contribute to regional acces‑sibility or development, and (ii) the duplication of unprofitable infrastruc‑ture is a waste of taxpayers’ money which distorts competition between airports38. These observations are in keeping with the Court’s audit results.
37 In 2003, the idea of the new airport in Corvera was approved by the ministry and the airport was declared to be of a general interest for the state. The tender for concession was awarded in May 2007; the technical design project was completed in June 2008 and the physical installations completed in April 2012.
38 Statement of the Vice‑President of the Commission, Joaquín Almunia, 1.10.2014; see also: IP/14/1065, MEMO/14/544.
35Observations
Number of airports competing with the audited airports with data on driving time and distance
Country Audited airports
No of competitor airports within 2 hours of audited
airport
Average driving time to competi-tor airports (min)
for residents in overlaps
Nearest competitor
airport
Driving time to nearest
competitor airport (min)
Road distance
to nearest competitor
airport (km)
Spain
Córdoba 3 113 Seville 87 119
Vigo 3 72 Santiago 57 93
Fuerteventura 1 79 Lanzarote 79 81
La Palma 0
Murcia 3 80 Corvera 33 36
Badajoz 0 134 Lisbon 127 226
Burgos 5 100 Vitoria 70 114
Madrid‑Barajas 0 158 Valladolid 140 213
Italy
Alghero 2 109 Olbia 93 126
Crotone 1 101 Lamezia T. 62 88
Naples 3 94 Salerno 47 73
Catania 2 103 Comiso 67 84
Comiso 1 111 Catania 66 84
Greece
Thessaloniki 1 105 Kozani 87 137
Heraklion 1 116 Sitia 107 102
Kastoria 2 85 Kozani 52 68
PolandGdańsk 2 65 Gdynia 37 32
Rzeszów 0 152 Lublin 138 155
EstoniaTallinn 0 131 Helsinki 124 109
Tartu 0 174 Tallinn 160 189
Tabl
e 3
36Observations
Planning of investments in airport infrastructures generally not coordinated at national level
60 The Court examined the robustness of the long‑term strategies on airport de‑velopments of the five Member States visited, checking whether there was a strategic framework for a coherent development of all airports within its territory based upon the identification of needs.
61 The Court found that at the time the decisions were taken on the main air‑port investments in the audit sample, only one of the five Member States had a long‑term strategic vision: in Poland there was an ‘Airports develop‑ment programme’ with a list of airport infrastructure investments deemed necessary.
62 There was no strategic long‑term air‑port development plan in Spain, Italy, Greece or Estonia. These countries had general and long‑term plans encom‑passing all modes of transport which, however: (i) had no particular focus on either air travel or airport develop‑ment, and (ii) were not coordinated with developments in other transport modes which could potentially com‑pete with air traffic.
63 Master plans usually existed for indi‑vidual airports and described their geographical and economic context. However, only 11 of the 20 airports (Badajoz, Burgos, Fuerteventura, La Palma, Madrid‑Barajas, Murcia, Vigo, Catania, Heraklion, Thessaloniki and Kastoria) included a needs assessment for additional infrastructure invest‑ments for the airport in their plans.
64 The objectives set for the audited airport projects were usually neither quantified nor time‑scaled. They tended to be expressed in terms of construction outputs, such as: ‘to build an airport for 400 000 passengers per year’, or to ‘increase the level of service to passengers and improve infrastructures’. Once the projects were implemented, the Member State authorities checked the outputs but did not usually check whether, or to what extent, the project objectives had been achieved.
65 The indicators used to measure project success tended to be physical output indicators and the number of jobs cre‑ated during construction. In the few cases where there were results indica‑tors, they were either not sufficiently specific or they lacked a baseline or a stipulation as to how and when their achievement should be measured. Sometimes, project data were ag‑gregated with other projects making it impossible to measure ex post the achievement of individual project ob‑jectives39. As a result, the management and monitoring systems in Member States usually only compared achieved outputs using physical indicators.
39 For example, the indicator ‘expected growth in domestic passenger numbers’ for the 2007–13 projects at Tartu airport does not allow analysis of airport passenger growth as airport passenger numbers are included with ferry passenger numbers.
37Observations
Limited information available to the Commission on EU funding of airports
66 The way the shared management reporting system worked in the 2000–06 period meant that informa‑tion on ERDF infrastructure projects in EU airports was not available to the Commission until the closure of the operational programme (at the end of 2009 at the earliest). There should have been an improvement for the 2007–13 multiannual financing period as managing authorities were sup‑posed to publish information on such projects on their website. However, there is still no full overview of airport infrastructure projects financed by the ERDF and CF.
67 This situation prevents the Commis‑sion from having a complete picture of all EU investments going to airports and limits its possibilities for moni‑toring and ensuring that policies are properly designed and implemented.
38Conclusions and recommendations
68 The overall conclusion is that the EU‑funded investments in airports pro‑duced poor value for money: too many airports (which were often in close proximity to each other) were funded and in many cases the EU‑funded infrastructures were oversized.
69 In particular, the Court found that:
ο a need for the EU‑funded invest‑ments in airport infrastructure could be demonstrated for around half of the projects examined (based on a benchmarking with comparable airports, paragraphs 22 to 26);
ο there were delays in construction and the final delivery of airport infrastructures in 17 and cost over‑runs in 9 of the 20 airports exam‑ined (paragraph 27);
ο more than half of the newly built (or upgraded) infrastructures were not fully used. In some cases, this was even the case at peak hours (paragraphs 28 to 35).
70 The Court also observes that the EU funding was not cost‑effective and that 7 of the 20 airports examined are not profitable and, as a result, there is the risk that they may need to be closed unless they receive continuous public financial support. This is par‑ticularly the case with small regional airports having fewer than 100 000 passengers per year (paragraphs 36 to 48).
71 Moreover, the EU‑funded investments did not always lead to anticipated results: actual passenger numbers fell significantly short of initial forecasts and only 10 of the 20 airports suc‑ceeded in increasing their passenger numbers between 2007 and 2013. Improvements in customer service were in most cases not measured and therefore difficult to assess (para‑graphs 49 to 52).
Recommendation 1
The Court recommends that the Commission should ensure during the 2014–20 programme period that Member States only allocate EU fund‑ing to airport infrastructures in those airports which are financially viable and for which investment needs have been properly assessed and demon‑strated. This should be part of the approval and monitoring of opera‑tional programmes carried out by the Commission.
39Conclusions and recommendations
72 In many cases EU funding is provided to airports in close proximity to each other. The Court’s analysis showed that for 13 of 18 airports examined, signifi‑cant overlaps exist with the catchment areas of neighbouring airports. This can result in over‑capacity and is poor value for money (paragraphs 53 to 59). Finally, the EU funding of airports is not well coordinated at national level and, in particular as regards major projects and cohesion fund projects, is insufficiently supervised by the Com‑mission. For projects selected by Mem‑ber States, the Commission generally does not know which airports receive funding and how much they receive (paragraphs 60 to 67).
Recommendation 2
The Court recommends that the Member States should have coherent regional, national or supranational plans for airport development to avoid over‑capacity, duplication and un‑coordinated investments in airport infrastructures.
This Report was adopted by Chamber II, headed by Mr Henri GRETHEN, Member of the Court of Auditors, in Luxembourg at its meeting of 12 November 2014.
For the Court of Auditors
Vítor Manuel da SILVA CALDEIRA President
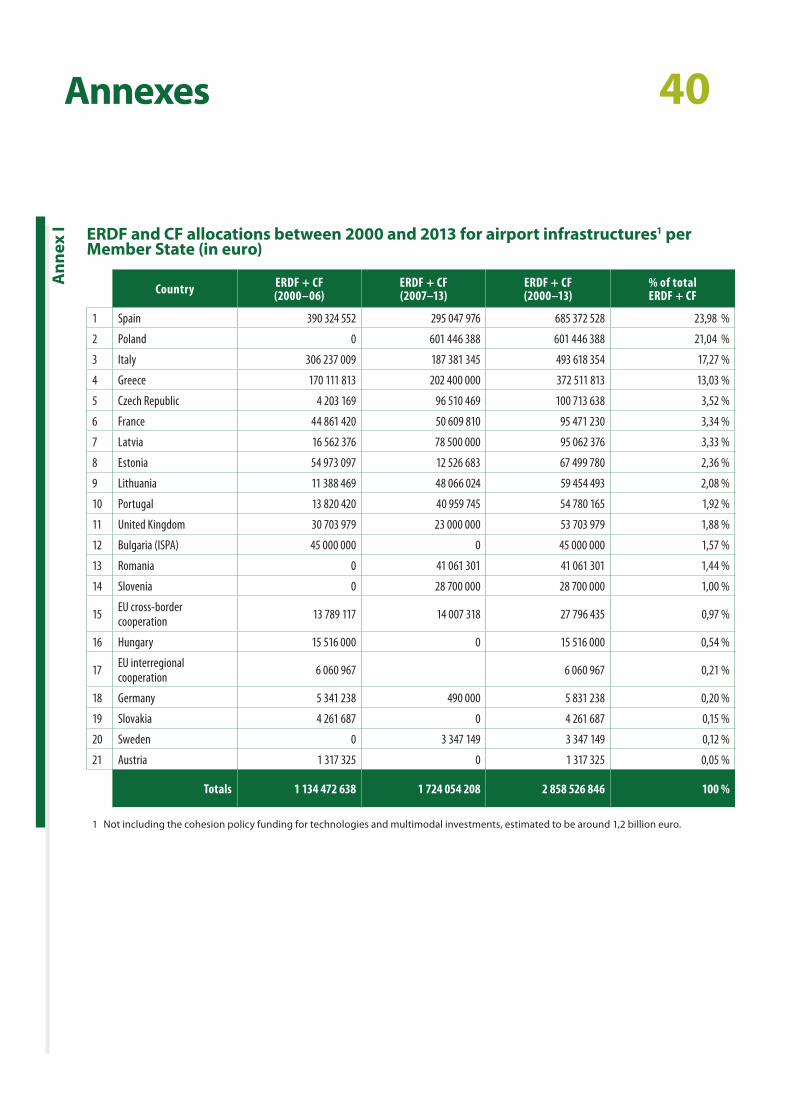
40AnnexesA
nnex
I ERDF and CF allocations between 2000 and 2013 for airport infrastructures1 per Member State (in euro)
Country ERDF + CF (2000–06)
ERDF + CF (2007–13)
ERDF + CF (2000–13)
% of total ERDF + CF
1 Spain 390 324 552 295 047 976 685 372 528 23,98 %
2 Poland 0 601 446 388 601 446 388 21,04 %
3 Italy 306 237 009 187 381 345 493 618 354 17,27 %
4 Greece 170 111 813 202 400 000 372 511 813 13,03 %
5 Czech Republic 4 203 169 96 510 469 100 713 638 3,52 %
6 France 44 861 420 50 609 810 95 471 230 3,34 %
7 Latvia 16 562 376 78 500 000 95 062 376 3,33 %
8 Estonia 54 973 097 12 526 683 67 499 780 2,36 %
9 Lithuania 11 388 469 48 066 024 59 454 493 2,08 %
10 Portugal 13 820 420 40 959 745 54 780 165 1,92 %
11 United Kingdom 30 703 979 23 000 000 53 703 979 1,88 %
12 Bulgaria (ISPA) 45 000 000 0 45 000 000 1,57 %
13 Romania 0 41 061 301 41 061 301 1,44 %
14 Slovenia 0 28 700 000 28 700 000 1,00 %
15 EU cross‑border cooperation 13 789 117 14 007 318 27 796 435 0,97 %
16 Hungary 15 516 000 0 15 516 000 0,54 %
17 EU interregional cooperation 6 060 967 6 060 967 0,21 %
18 Germany 5 341 238 490 000 5 831 238 0,20 %
19 Slovakia 4 261 687 0 4 261 687 0,15 %
20 Sweden 0 3 347 149 3 347 149 0,12 %
21 Austria 1 317 325 0 1 317 325 0,05 %
Totals 1 134 472 638 1 724 054 208 2 858 526 846 100 %
1 Not including the cohesion policy funding for technologies and multimodal investments, estimated to be around 1,2 billion euro.

41AnnexesA
nnex
II List of airports and projects audited
Country AirportEU funds
for projects audited
Start date (main works)
End date (main works)
Audited termi-
nals (EU funding)
Audited aprons
(EU funding)
Audited taxiways
(EU funding)
Audited runways
(EU funding)
Audited safety and
control tower
systems (EU funding)
Other (e.g. APM, cargo, car park) (EU funding)
Spain
Badajoz 6 134 779 2008 2010 4 047 417 1 409 190 84 785 593 387
Burgos 191 603 2007 2008 191 603
Córdoba 13 468 562 2006 2008 810 855 12 657 707
Fuerteventura 53 695 604 2004 2010 21 358 194 7 549 633 3 464 284 17 463 071 2 631 649 1 228 773
La Palma 49 764 569 2004 2010 26 315 005 13 661 002 3 435 400 220 835 6 132 327
Madrid 41 043 520 2000 2007 41 043 520
Murcia 20 396 706 2004 2011 2 636 907 2 937 427 2 775 913 12 046 459
Vigo 6 058 451 2006 2009 734 640 2 459 015 2 017 122 847 674
Italy
Alghero 13 278 792 2001 2007 5 179 050 2 338 322 2 482 393 2 192 707 1 086 320
Catania 44 660 578 2002 2006 28 012 093 2 688 203 6 090 574 2 329 754 5 539 954
Comiso 20 263 062 2004 2010 5 209 079 1 366 465 1 578 057 5 607 996 5 183 279 1 318 186
Crotone 4 736 007 2006 2011 869 283 1 877 056 1 199 550 437 453 352 665
Naples 20 649 583 2000 2009 5 517 072 2 817 663 5 106 493 3 124 613 4 083 742
Greece
Thessaloniki 54 054 434 2001 2009 11 779 105 1 524 912 23 908 629 16 841 788
Heraklion 9 240 605 2001 2005 9 240 605
Kastoria 5 635 060 1999 2003 5 635 060
PolandGdańsk 13 732 481 2007 2012 1 401 465 5 594 565 6 736 451
Rzeszów 18 597 944 2009 2013 15 686 246 2 090 980 820 718
EstoniaTallinn 53 093 520 2005 2008 29 212 175 10 308 691 10 665 438 288 579 2 618 637
Tartu 11 805 499 2008 2012 1 067 256 776 027 776 027 776 027 8 410 162
Population audited
460 501 359 164 227 220 50 988 499 39 594 288 80 590 629 34 681 200 90 419 523
In % 35,66 % 11,07 % 8,60 % 17,50 % 7,53 % 19,64 %
42Annexes
Ann
ex II
I Overview of audit results and assessment1
Country Airport
Was the invest-ment well
planned?
Were the physical outputs
achieved?
Were the invest-ments
needed?
Are all outputs
being used?
Were expect-ed quantita-tive results
between 2007 and 2013
achieved?
Were qualita-
tive benefits
achieved?
Was any impact on regional economy
evidenced?
Is the cost per
additional passenger
reason-able?
Is this a sus-
tainable airport?
Spain
Badajoz
Burgos
Córdoba
Fuerteventura
La Palma
Madrid‑Barajas
Murcia
Vigo
Italy
Alghero
Catania
Comiso
Crotone
Naples
Greece
Heraklion
Kastoria
Thessaloniki
PolandGdańsk
Rzeszów
EstoniaTallinn
Tartu
1 See the key on the next page.
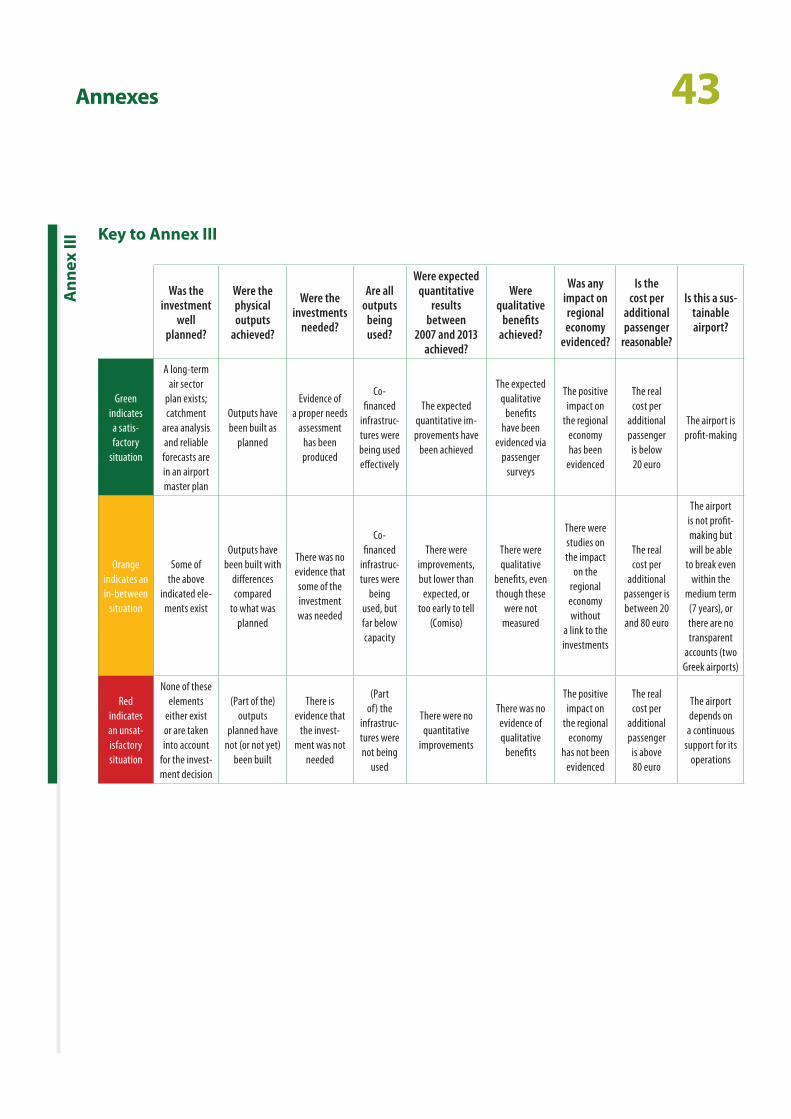
43AnnexesA
nnex
III
Was the investment
well planned?
Were the physical outputs
achieved?
Were the investments
needed?
Are all outputs
being used?
Were expected quantitative
results between
2007 and 2013 achieved?
Were qualitative
benefits achieved?
Was any impact on regional economy
evidenced?
Is the cost per
additional passenger
reasonable?
Is this a sus-tainable airport?
Green indicates a satis‑factory
situation
A long‑term air sector
plan exists; catchment
area analysis and reliable forecasts are in an airport master plan
Outputs have been built as
planned
Evidence of a proper needs
assessment has been produced
Co‑financed
infrastruc‑tures were being used effectively
The expected quantitative im‑provements have
been achieved
The expected qualitative
benefits have been
evidenced via passenger
surveys
The positive impact on
the regional economy has been
evidenced
The real cost per
additional passenger is below 20 euro
The airport is profit‑making
Orange indicates an in‑between
situation
Some of the above
indicated ele‑ments exist
Outputs have been built with
differences compared
to what was planned
There was no evidence that some of the investment was needed
Co‑financed
infrastruc‑tures were
being used, but far below capacity
There were improvements, but lower than
expected, or too early to tell
(Comiso)
There were qualitative
benefits, even though these
were not measured
There were studies on the impact
on the regional economy without
a link to the investments
The real cost per
additional passenger is between 20 and 80 euro
The airport is not profit‑making but will be able
to break even within the
medium term (7 years), or there are no transparent
accounts (two Greek airports)
Red indicates an unsat‑isfactory situation
None of these elements
either exist or are taken into account
for the invest‑ment decision
(Part of the) outputs
planned have not (or not yet)
been built
There is evidence that
the invest‑ment was not
needed
(Part of) the
infrastruc‑tures were not being
used
There were no quantitative
improvements
There was no evidence of qualitative
benefits
The positive impact on
the regional economy
has not been evidenced
The real cost per
additional passenger
is above 80 euro
The airport depends on
a continuous support for its
operations
Key to Annex III
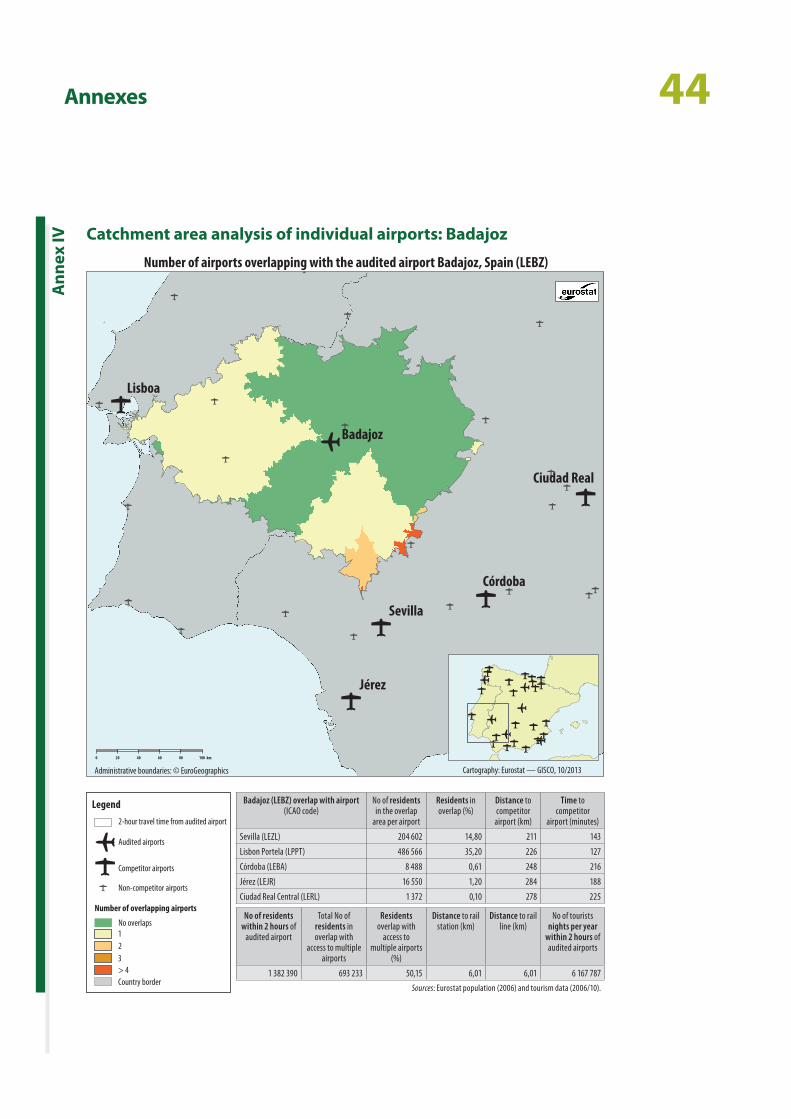
44Annexes
Ann
ex IV Catchment area analysis of individual airports: Badajoz
Córdoba
Badajoz
Jérez
Lisboa
Sevilla
Ciudad Real
0 20 40 60 80 100 km
Administrative boundaries: © EuroGeographics
Number of airports overlapping with the audited airport Badajoz, Spain (LEBZ)
Cartography: Eurostat — GISCO, 10/2013
123
Legend
2-hour travel time from audited airport
Audited airports
Competitor airports
Non-competitor airports
Number of overlapping airports
No overlaps
> 4Country border
Badajoz (LEBZ) overlap with airport (ICAO code)
No of residents in the overlap
area per airport
Residents in overlap (%)
Distance to competitor
airport (km)
Time to competitor
airport (minutes)
Sevilla (LEZL) 204 602 14,80 211 143
Lisbon Portela (LPPT) 486 566 35,20 226 127
Córdoba (LEBA) 8 488 0,61 248 216
Jérez (LEJR) 16 550 1,20 284 188
Ciudad Real Central (LERL) 1 372 0,10 278 225
No of residents within 2 hours of
audited airport
Total No of residents in overlap with
access to multiple airports
Residents overlap with
access to multiple airports
(%)
Distance to rail station (km)
Distance to rail line (km)
No of tourists nights per year
within 2 hours of audited airports
1 382 390 693 233 50,15 6,01 6,01 6 167 787
Sources: Eurostat population (2006) and tourism data (2006/10).
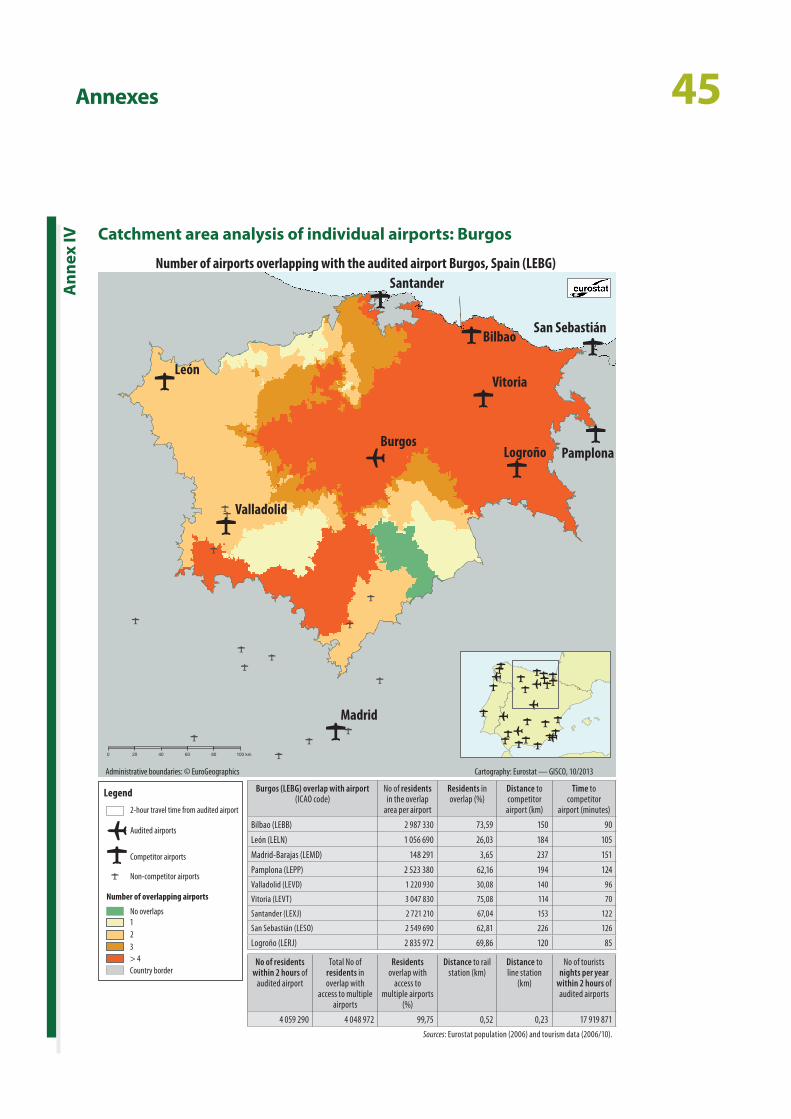
45Annexes
Catchment area analysis of individual airports: Burgos
Ann
ex IV
Administrative boundaries: © EuroGeographics Cartography: Eurostat — GISCO, 10/2013
Madrid
Burgos
León
Bilbao
Vitoria
Logroño Pamplona
Santander
Valladolid
San Sebastián
0 20 40 60 80 100 km
Number of airports overlapping with the audited airport Burgos, Spain (LEBG)
123
Legend
2-hour travel time from audited airport
Audited airports
Competitor airports
Non-competitor airports
Number of overlapping airports
No overlaps
> 4Country border
Burgos (LEBG) overlap with airport(ICAO code)
No of residents in the overlap
area per airport
Residents in overlap (%)
Distance to competitor
airport (km)
Time to competitor
airport (minutes)
Bilbao (LEBB) 2 987 330 73,59 150 90
León (LELN) 1 056 690 26,03 184 105
Madrid‑Barajas (LEMD) 148 291 3,65 237 151
Pamplona (LEPP) 2 523 380 62,16 194 124
Valladolid (LEVD) 1 220 930 30,08 140 96
Vitoria (LEVT) 3 047 830 75,08 114 70
Santander (LEXJ) 2 721 210 67,04 153 122
San Sebastián (LESO) 2 549 690 62,81 226 126
Logroño (LERJ) 2 835 972 69,86 120 85
No of residents within 2 hours of
audited airport
Total No of residents in overlap with
access to multiple airports
Residents overlap with
access to multiple airports
(%)
Distance to rail station (km)
Distance to line station
(km)
No of tourists nights per year
within 2 hours of audited airports
4 059 290 4 048 972 99,75 0,52 0,23 17 919 871
Sources: Eurostat population (2006) and tourism data (2006/10).
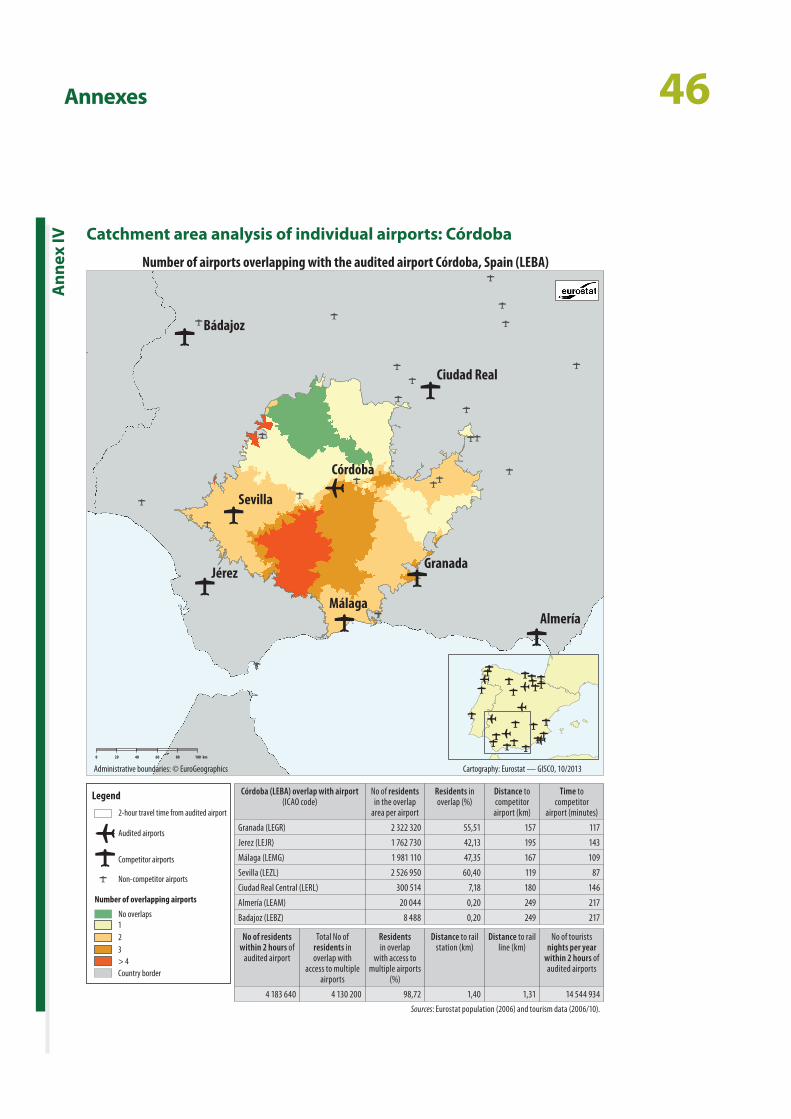
46Annexes
Catchment area analysis of individual airports: Córdoba
Ann
ex IV
Ciudad Real
Sevilla
Jérez
Málaga
Granada
Almería
Córdoba
Number of airports overlapping with the audited airport Córdoba, Spain (LEBA)
Bádajoz
0 20 40 60 80 100 km
Administrative boundaries: © EuroGeographics Cartography: Eurostat — GISCO, 10/2013
123
Legend
2-hour travel time from audited airport
Audited airports
Competitor airports
Non-competitor airports
Number of overlapping airports
No overlaps
> 4Country border
Córdoba (LEBA) overlap with airport (ICAO code)
No of residents in the overlap
area per airport
Residents in overlap (%)
Distance to competitor
airport (km)
Time to competitor
airport (minutes)
Granada (LEGR) 2 322 320 55,51 157 117
Jerez (LEJR) 1 762 730 42,13 195 143
Málaga (LEMG) 1 981 110 47,35 167 109
Sevilla (LEZL) 2 526 950 60,40 119 87
Ciudad Real Central (LERL) 300 514 7,18 180 146
Almería (LEAM) 20 044 0,20 249 217
Badajoz (LEBZ) 8 488 0,20 249 217
No of residents within 2 hours of
audited airport
Total No of residents in overlap with
access to multiple airports
Residents in overlap
with access to multiple airports
(%)
Distance to rail station (km)
Distance to rail line (km)
No of tourists nights per year
within 2 hours of audited airports
4 183 640 4 130 200 98,72 1,40 1,31 14 544 934
Sources: Eurostat population (2006) and tourism data (2006/10).
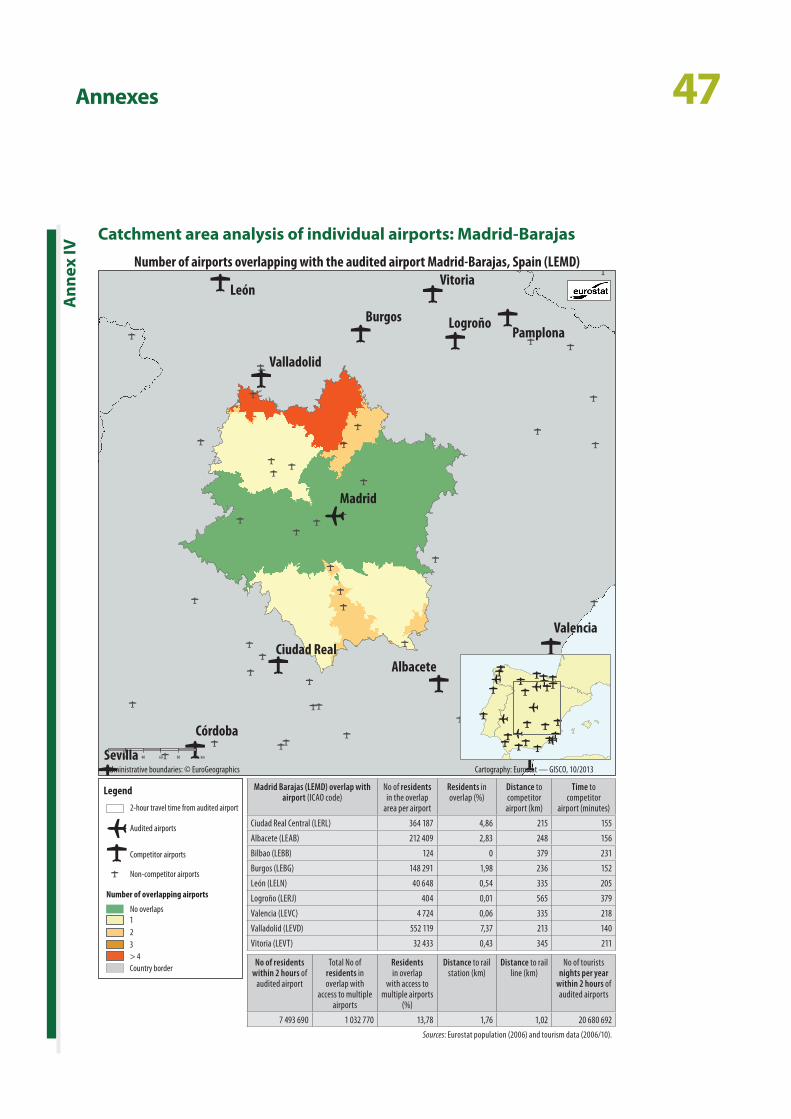
47Annexes
Catchment area analysis of individual airports: Madrid-Barajas
Ann
ex IV
Ciudad Real
Burgos
Madrid
León
Jerez
Málaga
Corvera
Vitoria
Sevilla
Granada
Logroño
Valencia
Pamplona
Valladolid
Albacete
Córdoba
Administrative boundaries: © EuroGeographics Cartography: Eurostat — GISCO, 10/2013
0 20 40 60 80 100 km
Number of airports overlapping with the audited airport Madrid-Barajas, Spain (LEMD)
123
Legend
2-hour travel time from audited airport
Audited airports
Competitor airports
Non-competitor airports
Number of overlapping airports
No overlaps
> 4Country border
Madrid Barajas (LEMD) overlap with airport (ICAO code)
No of residents in the overlap
area per airport
Residents in overlap (%)
Distance to competitor
airport (km)
Time to competitor
airport (minutes)
Ciudad Real Central (LERL) 364 187 4,86 215 155
Albacete (LEAB) 212 409 2,83 248 156
Bilbao (LEBB) 124 0 379 231
Burgos (LEBG) 148 291 1,98 236 152
León (LELN) 40 648 0,54 335 205
Logroño (LERJ) 404 0,01 565 379
Valencia (LEVC) 4 724 0,06 335 218
Valladolid (LEVD) 552 119 7,37 213 140
Vitoria (LEVT) 32 433 0,43 345 211
No of residents within 2 hours of
audited airport
Total No of residents in overlap with
access to multiple airports
Residents in overlap
with access to multiple airports
(%)
Distance to rail station (km)
Distance to rail line (km)
No of tourists nights per year
within 2 hours of audited airports
7 493 690 1 032 770 13,78 1,76 1,02 20 680 692
Sources: Eurostat population (2006) and tourism data (2006/10).
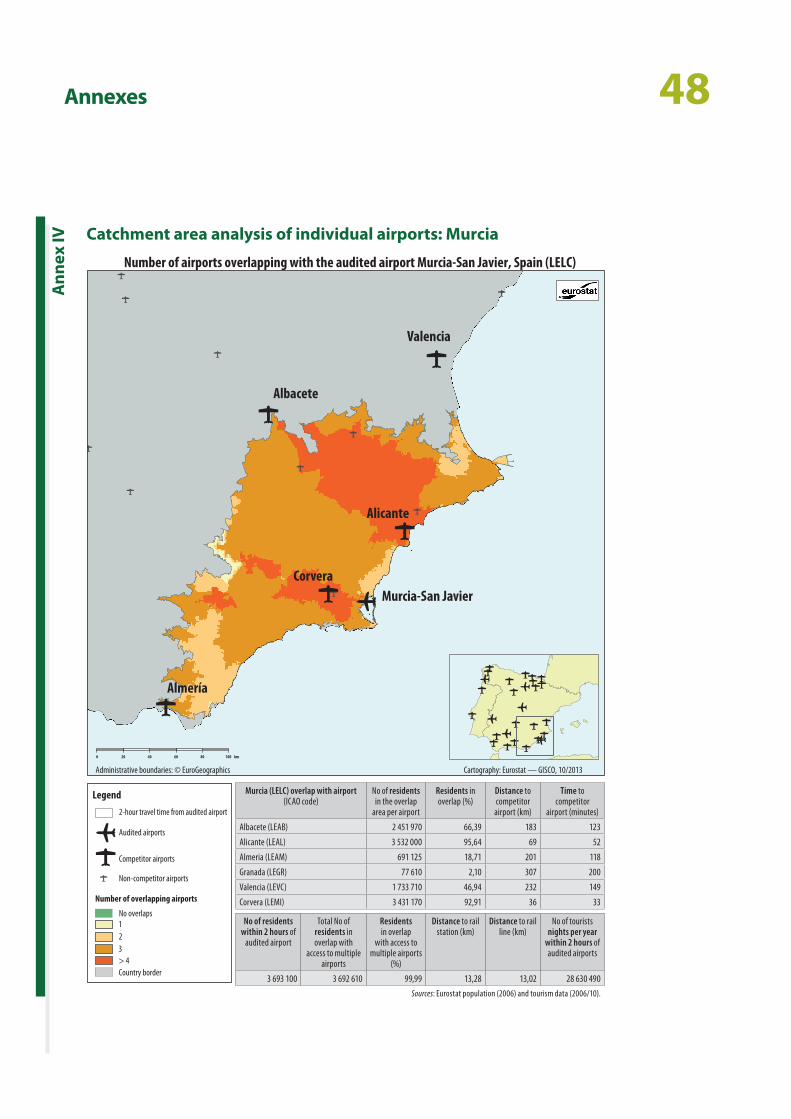
48Annexes
Catchment area analysis of individual airports: Murcia
Ann
ex IV
0 20 40 60 80 100 km
Albacete
Almería
CorveraMurcia- San Javier
Alicante
Valencia
Number of airports overlapping with the audited airport Murcia-San Javier, Spain (LELC)
Administrative boundaries: © EuroGeographics Cartography: Eurostat — GISCO, 10/2013
123
Legend
2-hour travel time from audited airport
Audited airports
Competitor airports
Non-competitor airports
Number of overlapping airports
No overlaps
> 4Country border
Murcia (LELC) overlap with airport (ICAO code)
No of residents in the overlap
area per airport
Residents in overlap (%)
Distance to competitor
airport (km)
Time to competitor
airport (minutes)
Albacete (LEAB) 2 451 970 66,39 183 123
Alicante (LEAL) 3 532 000 95,64 69 52
Almeria (LEAM) 691 125 18,71 201 118
Granada (LEGR) 77 610 2,10 307 200
Valencia (LEVC) 1 733 710 46,94 232 149
Corvera (LEMI) 3 431 170 92,91 36 33
No of residents within 2 hours of
audited airport
Total No of residents in overlap with
access to multiple airports
Residents in overlap
with access to multiple airports
(%)
Distance to rail station (km)
Distance to rail line (km)
No of tourists nights per year
within 2 hours of audited airports
3 693 100 3 692 610 99,99 13,28 13,02 28 630 490
Sources: Eurostat population (2006) and tourism data (2006/10).
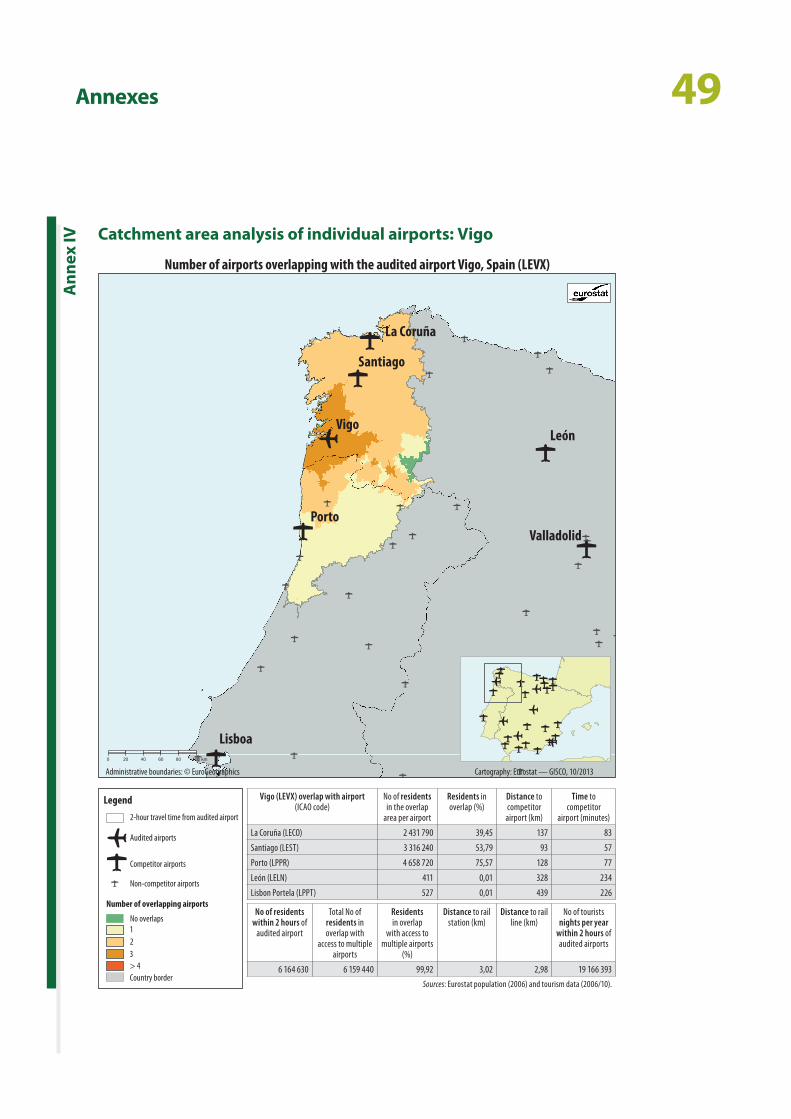
49Annexes
Catchment area analysis of individual airports: Vigo
Ann
ex IV
r
Lisboa
Santiago
Vigo
La Coruña
León
Valladolid
Porto
0 20 40 60 80 100 km
Number of airports overlapping with the audited airport Vigo, Spain (LEVX)
Administrative boundaries: © EuroGeographics Cartography: Eurostat — GISCO, 10/2013
123
Legend
2-hour travel time from audited airport
Audited airports
Competitor airports
Non-competitor airports
Number of overlapping airports
No overlaps
> 4Country border
Vigo (LEVX) overlap with airport(ICAO code)
No of residents in the overlap
area per airport
Residents in overlap (%)
Distance to competitor
airport (km)
Time to competitor
airport (minutes)
La Coruña (LECO) 2 431 790 39,45 137 83
Santiago (LEST) 3 316 240 53,79 93 57
Porto (LPPR) 4 658 720 75,57 128 77
León (LELN) 411 0,01 328 234
Lisbon Portela (LPPT) 527 0,01 439 226
No of residents within 2 hours of
audited airport
Total No of residents in overlap with
access to multiple airports
Residents in overlap
with access to multiple airports
(%)
Distance to rail station (km)
Distance to rail line (km)
No of tourists nights per year
within 2 hours of audited airports
6 164 630 6 159 440 99,92 3,02 2,98 19 166 393
Sources: Eurostat population (2006) and tourism data (2006/10).
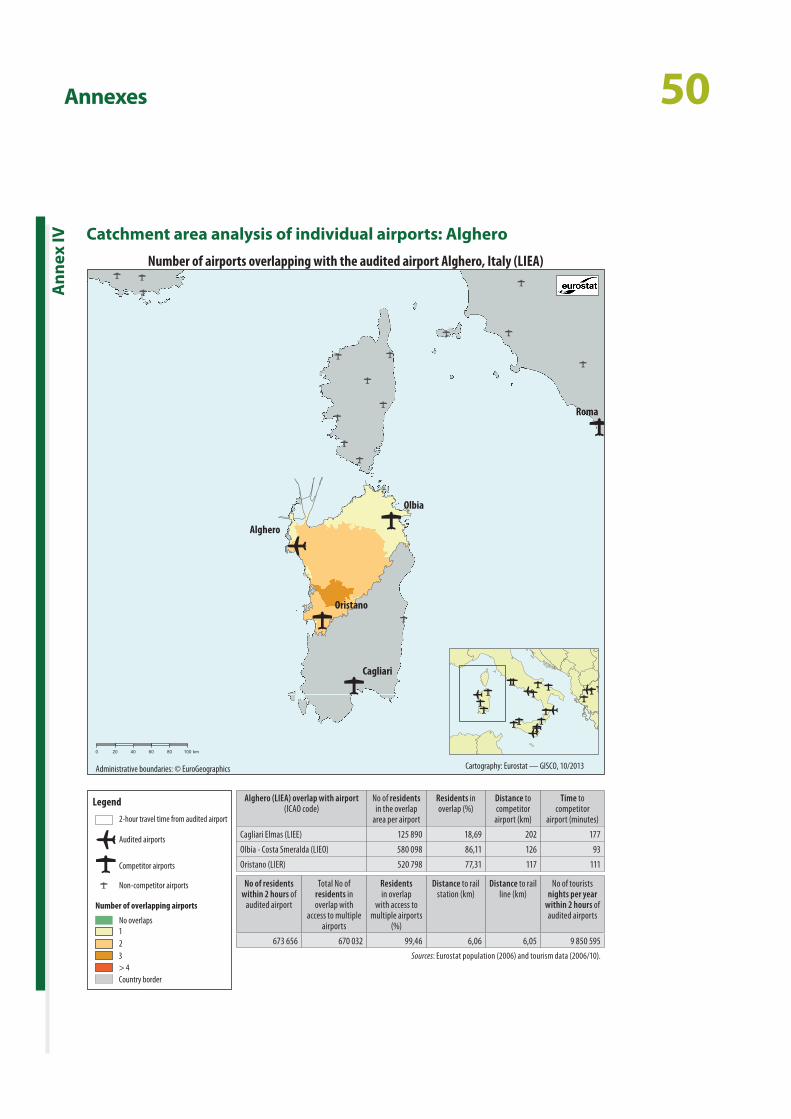
50Annexes
Catchment area analysis of individual airports: Alghero
Ann
ex IV
Catania-Fontanarossa
Roma
Cagliari
Oristano
Olbia
Alghero
0 20 40 60 80 100 km
Administrative boundaries: © EuroGeographics
Number of airports overlapping with the audited airport Alghero, Italy (LIEA)
Cartography: Eurostat — GISCO, 10/2013
123
Legend
2-hour travel time from audited airport
Audited airports
Competitor airports
Non-competitor airports
Number of overlapping airports
No overlaps
> 4Country border
Alghero (LIEA) overlap with airport (ICAO code)
No of residents in the overlap
area per airport
Residents in overlap (%)
Distance to competitor
airport (km)
Time to competitor
airport (minutes)
Cagliari Elmas (LIEE) 125 890 18,69 202 177
Olbia ‑ Costa Smeralda (LIEO) 580 098 86,11 126 93
Oristano (LIER) 520 798 77,31 117 111
No of residents within 2 hours of
audited airport
Total No of residents in overlap with
access to multiple airports
Residents in overlap
with access to multiple airports
(%)
Distance to rail station (km)
Distance to rail line (km)
No of tourists nights per year
within 2 hours of audited airports
673 656 670 032 99,46 6,06 6,05 9 850 595
Sources: Eurostat population (2006) and tourism data (2006/10).
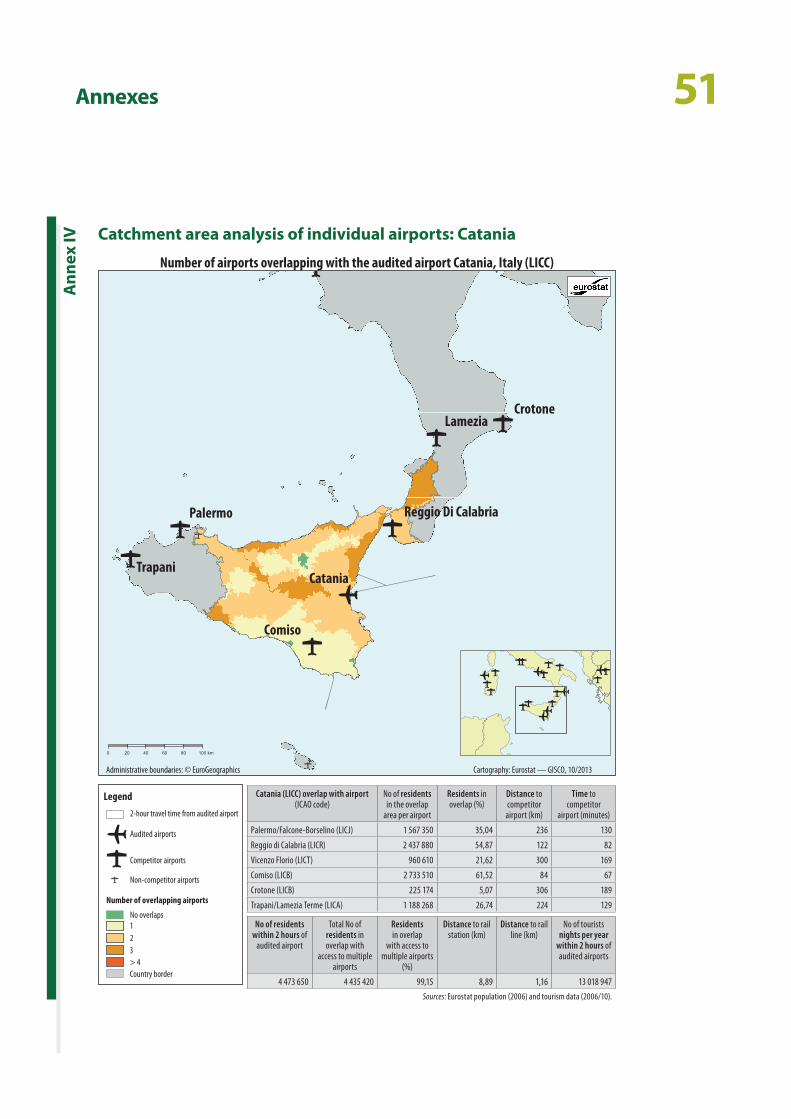
51Annexes
Catchment area analysis of individual airports: Catania
Ann
ex IV
Trapani
Lamezia
Reggio Di CalabriaPalermo
Salerno/Pontecagnano
Catania
Number of airports overlapping with the audited airport Catania, Italy (LICC)
Comiso
Crotone
0 20 40 60 80 100 km
Administrative boundaries: © EuroGeographics Cartography: Eurostat — GISCO, 10/2013
123
Legend
2-hour travel time from audited airport
Audited airports
Competitor airports
Non-competitor airports
Number of overlapping airports
No overlaps
> 4Country border
Catania (LICC) overlap with airport (ICAO code)
No of residents in the overlap
area per airport
Residents in overlap (%)
Distance to competitor
airport (km)
Time to competitor
airport (minutes)
Palermo/Falcone‑Borselino (LICJ) 1 567 350 35,04 236 130
Reggio di Calabria (LICR) 2 437 880 54,87 122 82
Vicenzo Florio (LICT) 960 610 21,62 300 169
Comiso (LICB) 2 733 510 61,52 84 67
Crotone (LICB) 225 174 5,07 306 189
Trapani/Lamezia Terme (LICA) 1 188 268 26,74 224 129
No of residents within 2 hours of
audited airport
Total No of residents in overlap with
access to multiple airports
Residents in overlap
with access to multiple airports
(%)
Distance to rail station (km)
Distance to rail line (km)
No of tourists nights per year
within 2 hours of audited airports
4 473 650 4 435 420 99,15 8,89 1,16 13 018 947
Sources: Eurostat population (2006) and tourism data (2006/10).
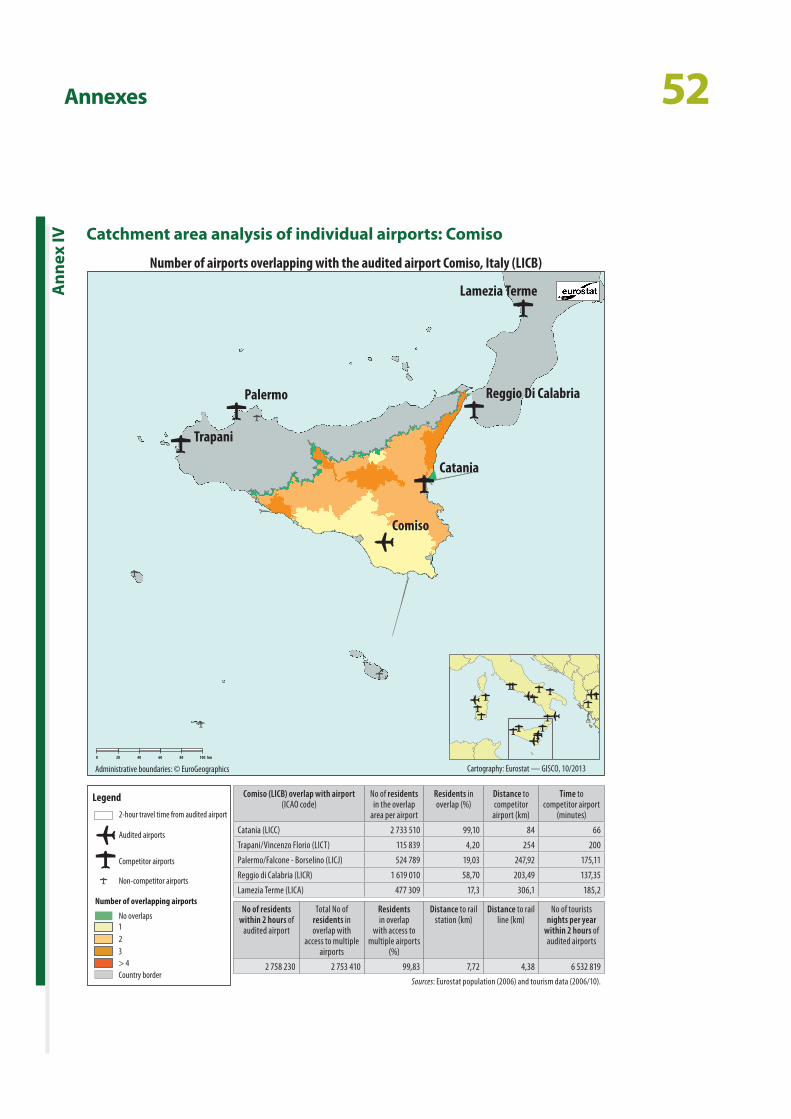
52Annexes
Catchment area analysis of individual airports: Comiso
Ann
ex IV
Administrative boundaries: © EuroGeographics
Trapani
Lamezia Terme
Reggio Di CalabriaPalermo
Catania
Number of airports overlapping with the audited airport Comiso, Italy (LICB)
Comiso
0 20 40 60 80 100 km
Cartography: Eurostat — GISCO, 10/2013
123
Legend
2-hour travel time from audited airport
Audited airports
Competitor airports
Non-competitor airports
Number of overlapping airports
No overlaps
> 4Country border
Comiso (LICB) overlap with airport (ICAO code)
No of residents in the overlap
area per airport
Residents in overlap (%)
Distance to competitor
airport (km)
Time to competitor airport
(minutes)
Catania (LICC) 2 733 510 99,10 84 66
Trapani/Vincenzo Florio (LICT) 115 839 4,20 254 200
Palermo/Falcone ‑ Borselino (LICJ) 524 789 19,03 247,92 175,11
Reggio di Calabria (LICR) 1 619 010 58,70 203,49 137,35
Lamezia Terme (LICA) 477 309 17,3 306,1 185,2
No of residents within 2 hours of
audited airport
Total No of residents in overlap with
access to multiple airports
Residents in overlap
with access to multiple airports
(%)
Distance to rail station (km)
Distance to rail line (km)
No of tourists nights per year
within 2 hours of audited airports
2 758 230 2 753 410 99,83 7,72 4,38 6 532 819
Sources: Eurostat population (2006) and tourism data (2006/10).
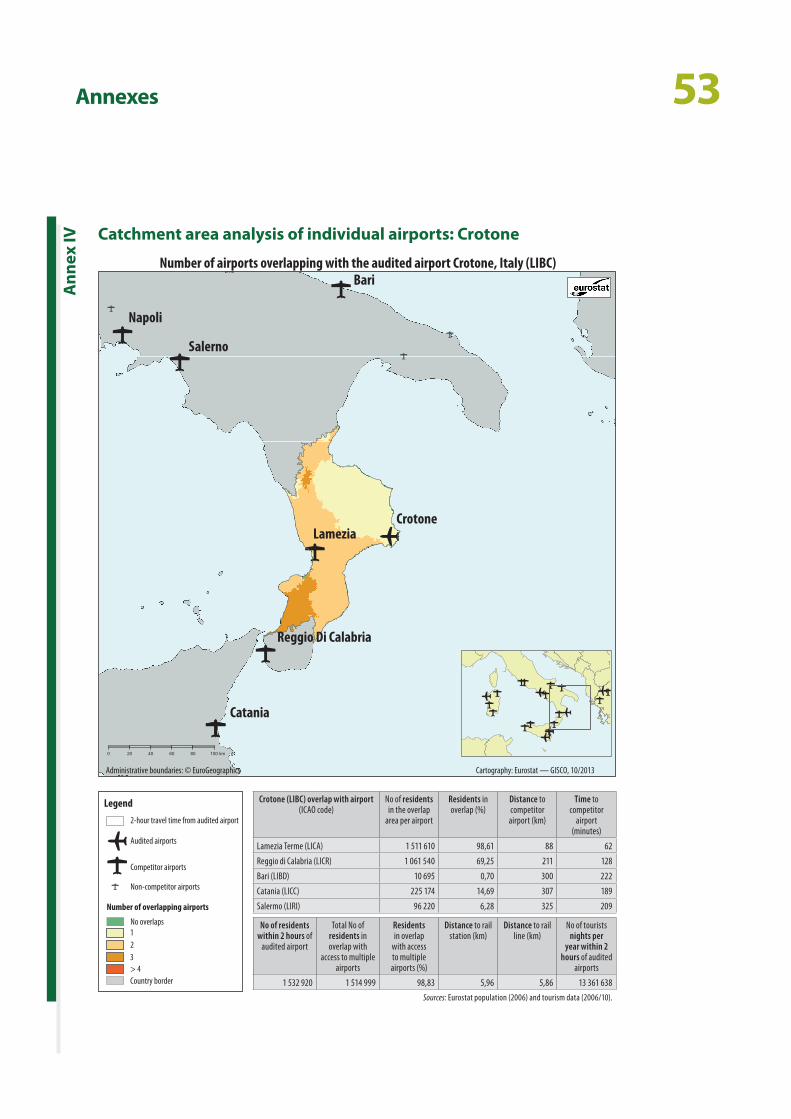
53Annexes
Catchment area analysis of individual airports: Crotone
Ann
ex IV
Napoli
CrotoneLamezia
Foggia/Gino Lisa
Reggio Di Calabria
Bari
Salerno
Catania
Number of airports overlapping with the audited airport Crotone, Italy (LIBC)
0 20 40 60 80 100 km
Administrative boundaries: © EuroGeographics Cartography: Eurostat — GISCO, 10/2013
123
Legend
2-hour travel time from audited airport
Audited airports
Competitor airports
Non-competitor airports
Number of overlapping airports
No overlaps
> 4Country border
Crotone (LIBC) overlap with airport (ICAO code)
No of residents in the overlap
area per airport
Residents in overlap (%)
Distance to competitor
airport (km)
Time to competitor
airport (minutes)
Lamezia Terme (LICA) 1 511 610 98,61 88 62
Reggio di Calabria (LICR) 1 061 540 69,25 211 128
Bari (LIBD) 10 695 0,70 300 222
Catania (LICC) 225 174 14,69 307 189
Salermo (LIRI) 96 220 6,28 325 209
No of residents within 2 hours of
audited airport
Total No of residents in overlap with
access to multiple airports
Residents in overlap
with access to multiple airports (%)
Distance to rail station (km)
Distance to rail line (km)
No of tourists nights per
year within 2 hours of audited
airports
1 532 920 1 514 999 98,83 5,96 5,86 13 361 638
Sources: Eurostat population (2006) and tourism data (2006/10).
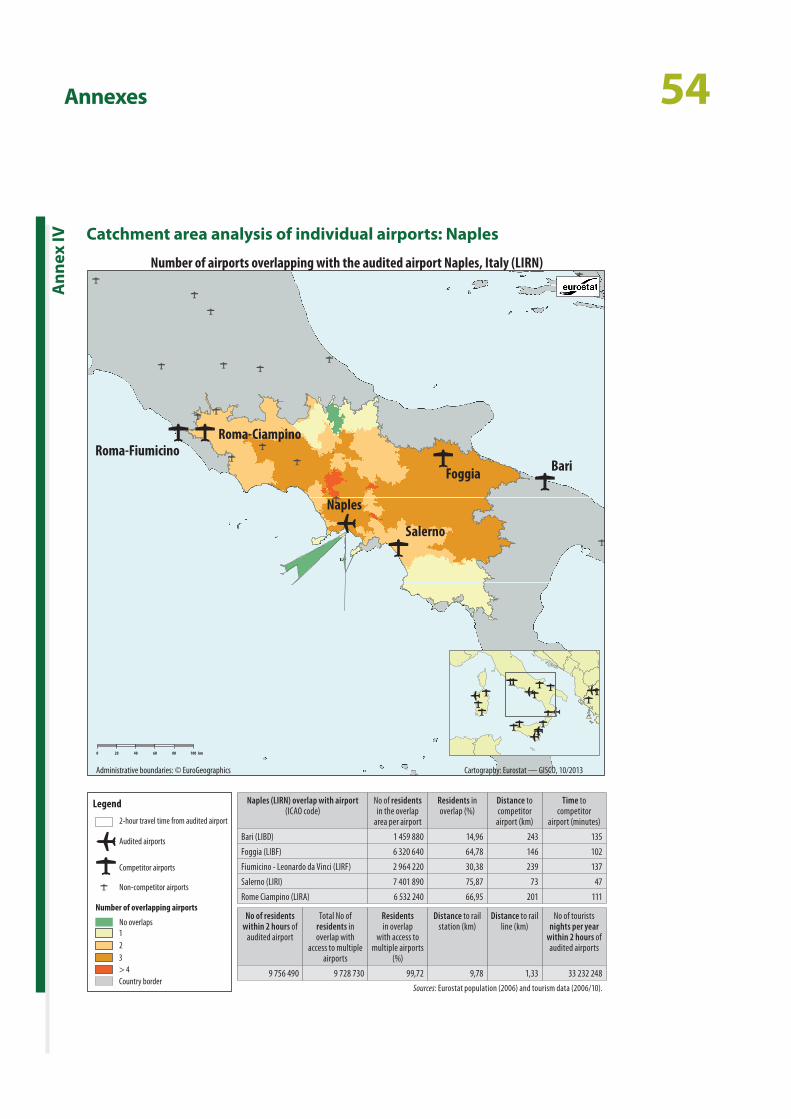
54Annexes
Catchment area analysis of individual airports: Naples
Ann
ex IV
Naples
Trapani-Birgi
Roma-Ciampino
Lamezia Terme
Roma-Fiumicino
Foggia
Reggio Di Calabria
Bari
Palermo-Punta Raisi
Salerno
Number of airports overlapping with the audited airport Naples, Italy (LIRN)
Crotone
0 20 40 60 80 100 km
Administrative boundaries: © EuroGeographics Cartography: Eurostat — GISCO, 10/2013
123
Legend
2-hour travel time from audited airport
Audited airports
Competitor airports
Non-competitor airports
Number of overlapping airports
No overlaps
> 4Country border
Naples (LIRN) overlap with airport (ICAO code)
No of residents in the overlap
area per airport
Residents in overlap (%)
Distance to competitor
airport (km)
Time to competitor
airport (minutes)
Bari (LIBD) 1 459 880 14,96 243 135
Foggia (LIBF) 6 320 640 64,78 146 102
Fiumicino ‑ Leonardo da Vinci (LIRF) 2 964 220 30,38 239 137
Salerno (LIRI) 7 401 890 75,87 73 47
Rome Ciampino (LIRA) 6 532 240 66,95 201 111
No of residents within 2 hours of
audited airport
Total No of residents in overlap with
access to multiple airports
Residents in overlap
with access to multiple airports
(%)
Distance to rail station (km)
Distance to rail line (km)
No of tourists nights per year
within 2 hours of audited airports
9 756 490 9 728 730 99,72 9,78 1,33 33 232 248
Sources: Eurostat population (2006) and tourism data (2006/10).
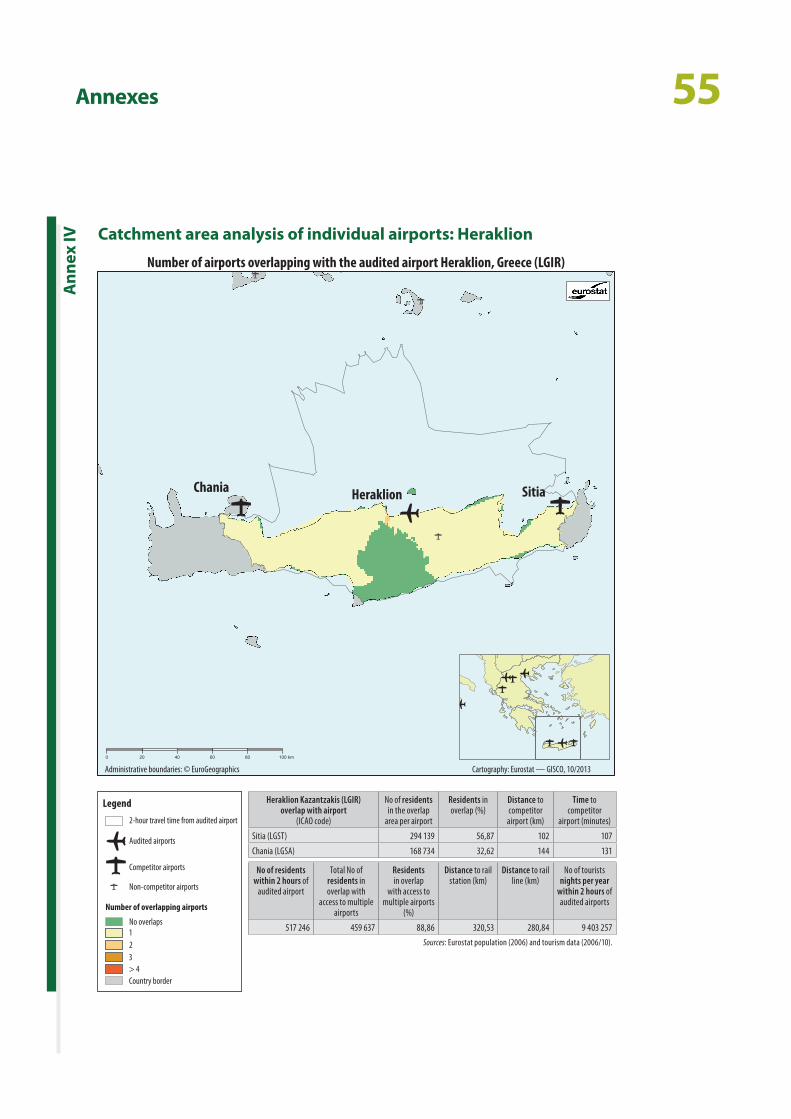
55Annexes
Catchment area analysis of individual airports: Heraklion
Ann
ex IV
SitiaChania
Number of airports overlapping with the audited airport Heraklion, Greece (LGIR)
Heraklion
0 20 40 60 80 100 km
Administrative boundaries: © EuroGeographics Cartography: Eurostat — GISCO, 10/2013
123
Legend
2-hour travel time from audited airport
Audited airports
Competitor airports
Non-competitor airports
Number of overlapping airports
No overlaps
> 4Country border
Heraklion Kazantzakis (LGIR)overlap with airport
(ICAO code)
No of residents in the overlap
area per airport
Residents in overlap (%)
Distance to competitor
airport (km)
Time to competitor
airport (minutes)
Sitia (LGST) 294 139 56,87 102 107
Chania (LGSA) 168 734 32,62 144 131
No of residents within 2 hours of
audited airport
Total No of residents in overlap with
access to multiple airports
Residents in overlap
with access to multiple airports
(%)
Distance to rail station (km)
Distance to rail line (km)
No of tourists nights per year
within 2 hours of audited airports
517 246 459 637 88,86 320,53 280,84 9 403 257
Sources: Eurostat population (2006) and tourism data (2006/10).
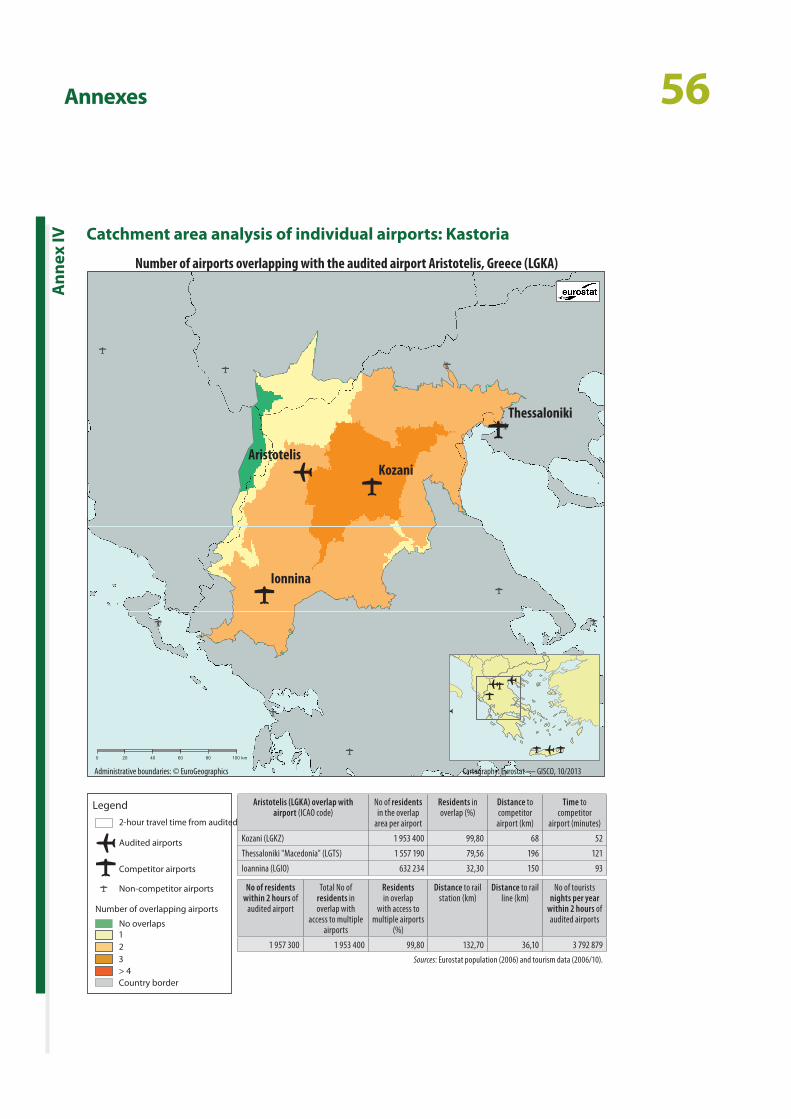
56Annexes
Catchment area analysis of individual airports: Kastoria
Ann
ex IV
Thessaloniki
Aristotelis
Ionnina
Kozani
Number of airports overlapping with the audited airport Aristotelis, Greece (LGKA)
0 20 40 60 80 100 km
Administrative boundaries: © EuroGeographics Cartography: Eurostat — GISCO, 10/2013
123
Legend
2-hour travel time from audited airport
Audited airports
Competitor airports
Non-competitor airports
Number of overlapping airports
No overlaps
> 4Country border
Aristotelis (LGKA) overlap with airport (ICAO code)
No of residents in the overlap
area per airport
Residents in overlap (%)
Distance to competitor
airport (km)
Time to competitor
airport (minutes)
Kozani (LGKZ) 1 953 400 99,80 68 52
Thessaloniki "Macedonia" (LGTS) 1 557 190 79,56 196 121
Ioannina (LGIO) 632 234 32,30 150 93
No of residents within 2 hours of
audited airport
Total No of residents in overlap with
access to multiple airports
Residents in overlap
with access to multiple airports
(%)
Distance to rail station (km)
Distance to rail line (km)
No of tourists nights per year
within 2 hours of audited airports
1 957 300 1 953 400 99,80 132,70 36,10 3 792 879
Sources: Eurostat population (2006) and tourism data (2006/10).
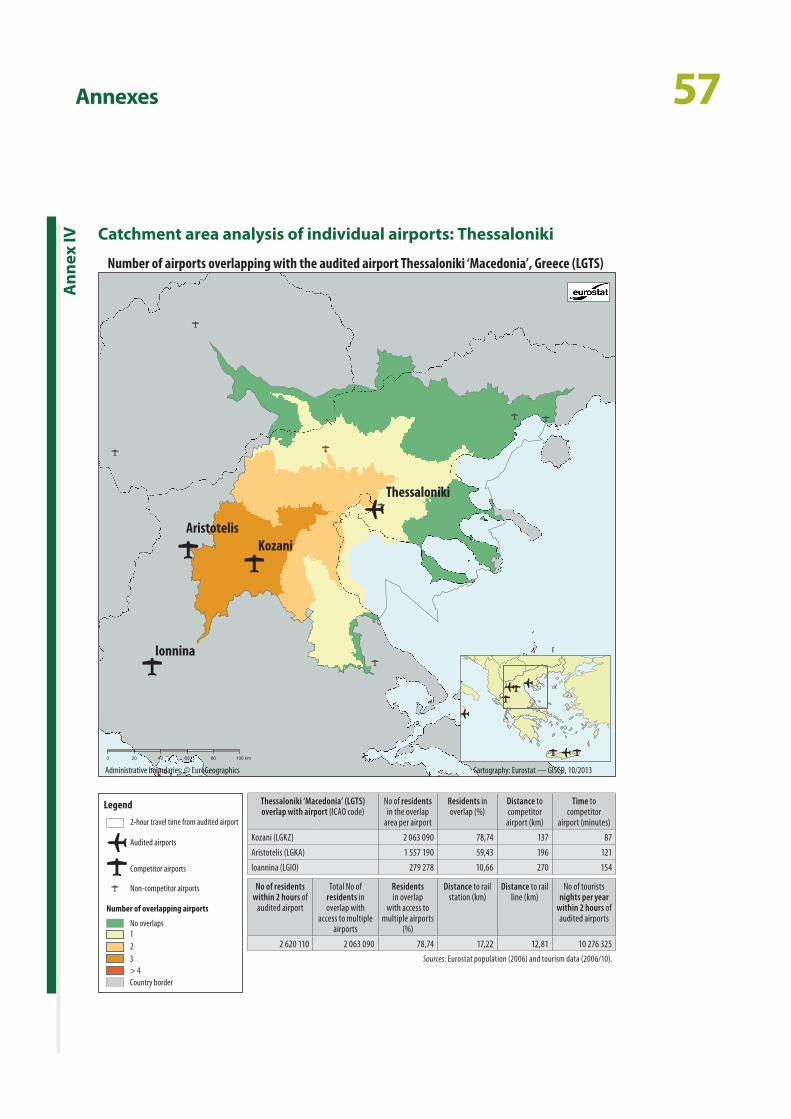
57AnnexesA
nnex
IV Catchment area analysis of individual airports: Thessaloniki
Thessaloniki
AristotelisKozani
Ionnina
Number of airports overlapping with the audited airport Thessaloniki ‘Macedonia’, Greece (LGTS)
0 20 40 60 80 100 km
Administrative boundaries: © EuroGeographics Cartography: Eurostat — GISCO, 10/2013
123
Legend
2-hour travel time from audited airport
Audited airports
Competitor airports
Non-competitor airports
Number of overlapping airports
No overlaps
> 4Country border
Thessaloniki ‘Macedonia’ (LGTS) overlap with airport (ICAO code)
No of residents in the overlap
area per airport
Residents in overlap (%)
Distance to competitor
airport (km)
Time to competitor
airport (minutes)
Kozani (LGKZ) 2 063 090 78,74 137 87
Aristotelis (LGKA) 1 557 190 59,43 196 121
Ioannina (LGIO) 279 278 10,66 270 154
No of residents within 2 hours of
audited airport
Total No of residents in overlap with
access to multiple airports
Residents in overlap
with access to multiple airports
(%)
Distance to rail station (km)
Distance to rail line (km)
No of tourists nights per year
within 2 hours of audited airports
2 620 110 2 063 090 78,74 17,22 12,81 10 276 325
Sources: Eurostat population (2006) and tourism data (2006/10).
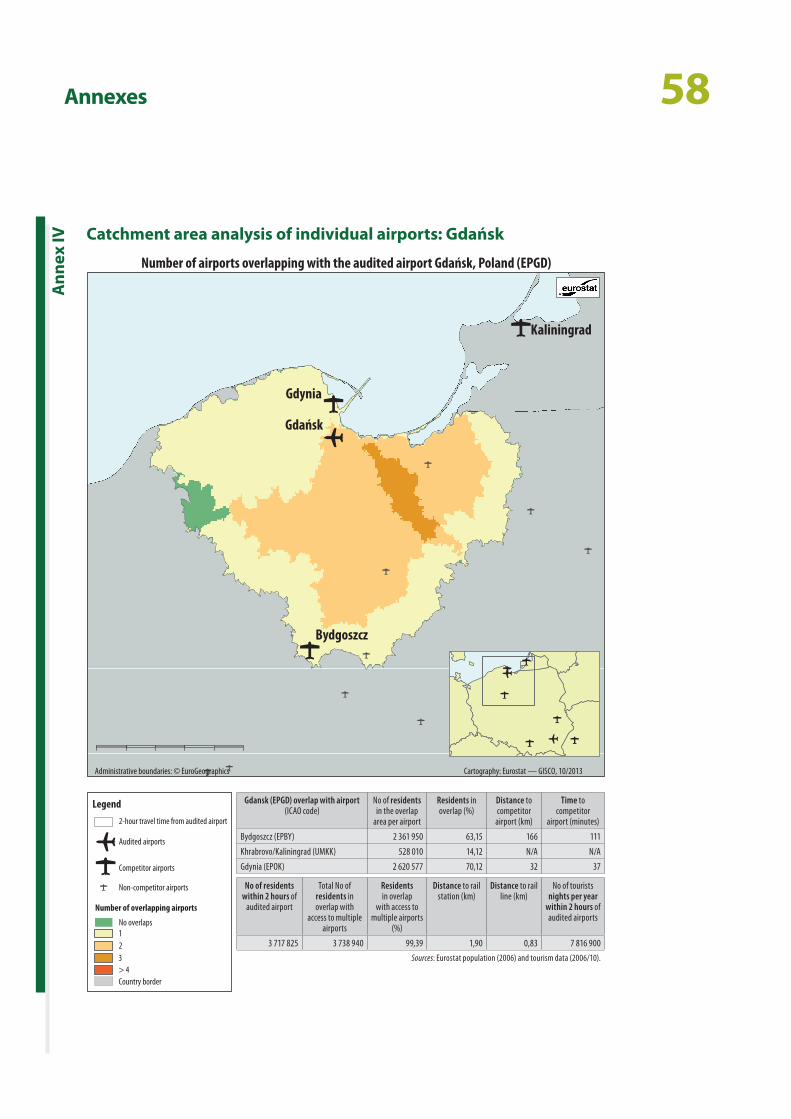
58Annexes
Catchment area analysis of individual airports: Gdańsk
Ann
ex IV
Gdynia
Bydgoszcz
Kaliningrad
Gdańsk
Administrative boundaries: © EuroGeographics
Number of airports overlapping with the audited airport Gdańsk, Poland (EPGD)
Cartography: Eurostat — GISCO, 10/2013
123
Legend
2-hour travel time from audited airport
Audited airports
Competitor airports
Non-competitor airports
Number of overlapping airports
No overlaps
> 4Country border
Gdansk (EPGD) overlap with airport (ICAO code)
No of residents in the overlap
area per airport
Residents in overlap (%)
Distance to competitor
airport (km)
Time to competitor
airport (minutes)
Bydgoszcz (EPBY) 2 361 950 63,15 166 111
Khrabrovo/Kaliningrad (UMKK) 528 010 14,12 N/A N/A
Gdynia (EPOK) 2 620 577 70,12 32 37
No of residents within 2 hours of
audited airport
Total No of residents in overlap with
access to multiple airports
Residents in overlap
with access to multiple airports
(%)
Distance to rail station (km)
Distance to rail line (km)
No of tourists nights per year
within 2 hours of audited airports
3 717 825 3 738 940 99,39 1,90 0,83 7 816 900
Sources: Eurostat population (2006) and tourism data (2006/10).
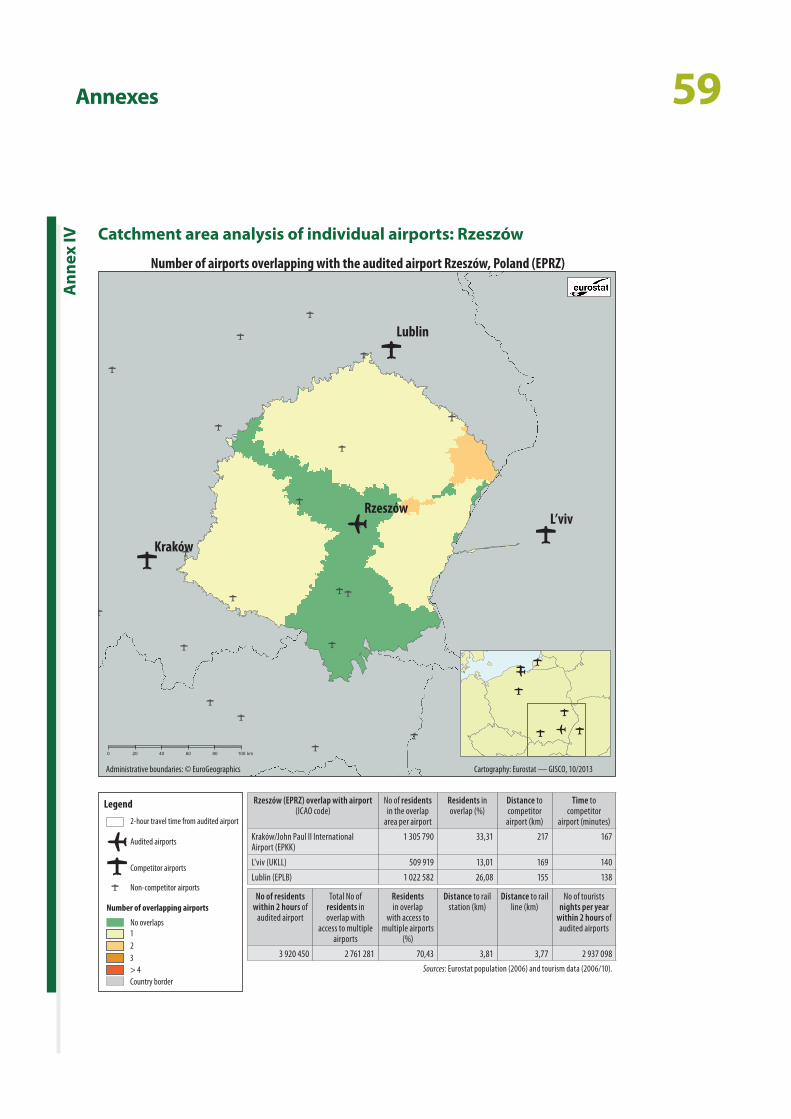
59AnnexesA
nnex
IV Catchment area analysis of individual airports: Rzeszów
Rzeszów
Number of airports overlapping with the audited airport Rzeszów, Poland (EPRZ)
Lublin
L’viv
Kraków
0 20 40 60 80 100 km
Administrative boundaries: © EuroGeographics Cartography: Eurostat — GISCO, 10/2013
123
Legend
2-hour travel time from audited airport
Audited airports
Competitor airports
Non-competitor airports
Number of overlapping airports
No overlaps
> 4Country border
Rzeszów (EPRZ) overlap with airport (ICAO code)
No of residents in the overlap
area per airport
Residents in overlap (%)
Distance to competitor
airport (km)
Time to competitor
airport (minutes)
Kraków/John Paul II InternationalAirport (EPKK)
1 305 790 33,31 217 167
L'viv (UKLL) 509 919 13,01 169 140
Lublin (EPLB) 1 022 582 26,08 155 138
No of residents within 2 hours of
audited airport
Total No of residents in overlap with
access to multiple airports
Residents in overlap
with access to multiple airports
(%)
Distance to rail station (km)
Distance to rail line (km)
No of tourists nights per year
within 2 hours of audited airports
3 920 450 2 761 281 70,43 3,81 3,77 2 937 098
Sources: Eurostat population (2006) and tourism data (2006/10).
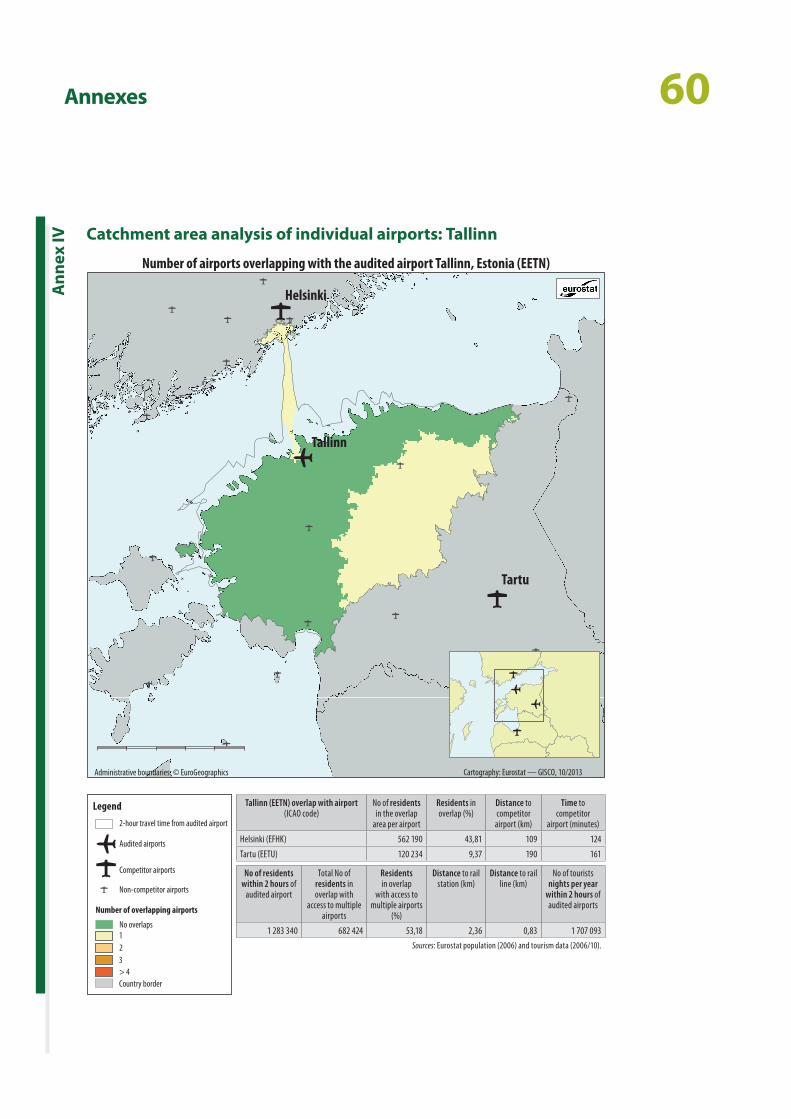
60Annexes
Catchment area analysis of individual airports: Tallinn
Ann
ex IV
Number of airports overlapping with the audited airport Tallinn, Estonia (EETN)
Tartu
RigaInternationalAirport
Helsinki
Tallinn
Administrative boundaries: © EuroGeographics Cartography: Eurostat — GISCO, 10/2013
123
Legend
2-hour travel time from audited airport
Audited airports
Competitor airports
Non-competitor airports
Number of overlapping airports
No overlaps
> 4Country border
Tallinn (EETN) overlap with airport (ICAO code)
No of residents in the overlap
area per airport
Residents in overlap (%)
Distance to competitor
airport (km)
Time to competitor
airport (minutes)
Helsinki (EFHK) 562 190 43,81 109 124
Tartu (EETU) 120 234 9,37 190 161
No of residents within 2 hours of
audited airport
Total No of residents in overlap with
access to multiple airports
Residents in overlap
with access to multiple airports
(%)
Distance to rail station (km)
Distance to rail line (km)
No of tourists nights per year
within 2 hours of audited airports
1 283 340 682 424 53,18 2,36 0,83 1 707 093
Sources: Eurostat population (2006) and tourism data (2006/10).
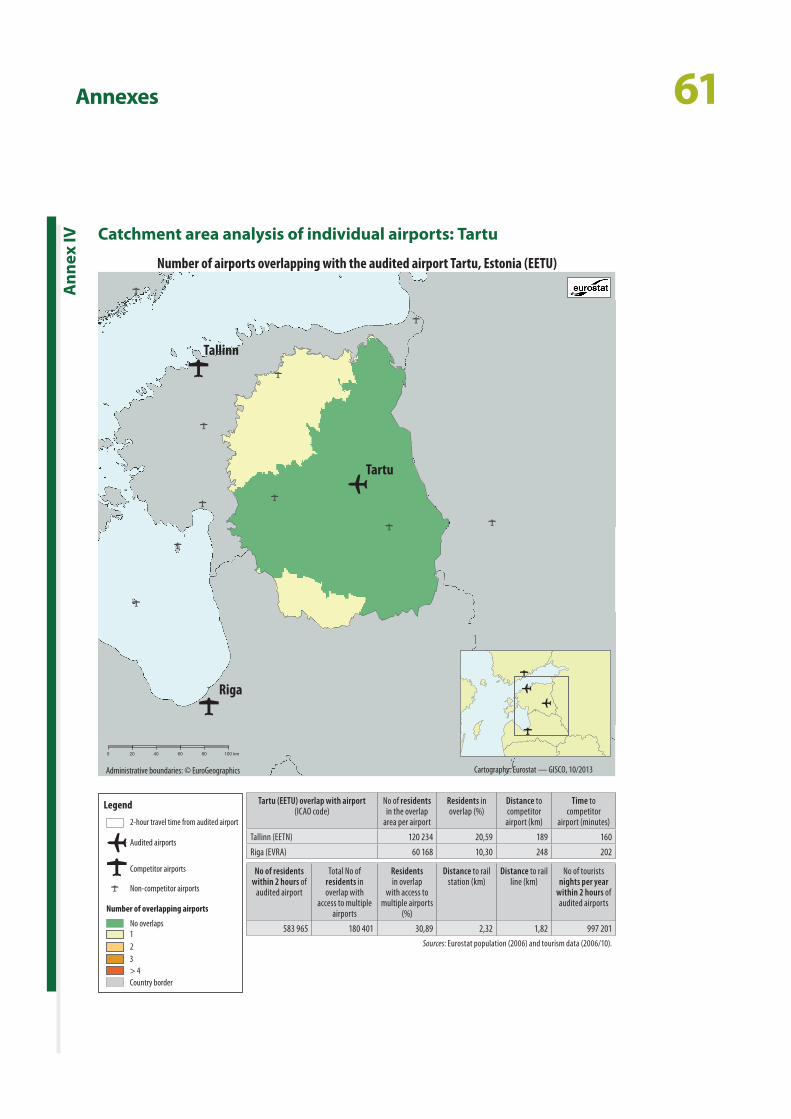
61AnnexesA
nnex
IV Catchment area analysis of individual airports: Tartu
Number of airports overlapping with the audited airport Tartu, Estonia (EETU)
Riga
Tartu
Tallinn
0 20 40 60 80 100 km
Administrative boundaries: © EuroGeographics Cartography: Eurostat — GISCO, 10/2013
123
Legend
2-hour travel time from audited airport
Audited airports
Competitor airports
Non-competitor airports
Number of overlapping airports
No overlaps
> 4Country border
Tartu (EETU) overlap with airport (ICAO code)
No of residents in the overlap
area per airport
Residents in overlap (%)
Distance to competitor
airport (km)
Time to competitor
airport (minutes)
Tallinn (EETN) 120 234 20,59 189 160
Riga (EVRA) 60 168 10,30 248 202
No of residents within 2 hours of
audited airport
Total No of residents in overlap with
access to multiple airports
Residents in overlap
with access to multiple airports
(%)
Distance to rail station (km)
Distance to rail line (km)
No of tourists nights per year
within 2 hours of audited airports
583 965 180 401 30,89 2,32 1,82 997 201
Sources: Eurostat population (2006) and tourism data (2006/10).
62
All major projects will have to go through a quality review, either by the Commission or by independ‑ent experts (Jaspers or other entities nominated by Member States and agreed by the Commission) before approval by the Commission.
IVThe Commission notes that regional airports may often serve communication purposes for a region or community and the public authorities may wish to maintain their functioning for other than sim‑ply financial reasons. That is why public transport infrastructures which are not profitable and require state support are kept in functioning.
The fact that the Commission does not have full detailed knowledge of all EU‑funded projects throughout the EU and throughout sectors does not mean that it fails to fulfil its regulatory supervisory role. On the contrary, the Commission exercises its supervisory role — often beyond its regulatory pre‑rogatives — through annual reporting and moni‑toring also at project‑by‑project level if needed, ad hoc treatment of problematic issues and specific audits. What is more, the Commission has in the past refused co‑financing to regional airports for which the business case was not evident and which did not seem justified from the cohesion point of view.
The Commission also notes that Cohesion Fund projects were directly approved by it in the 2000–06 period, while in the 2007–13 period they were included in the programmes and approved individually only if they were major projects. The Commission took steps in the 2007–13 period to improve the assessment of major projects, through the establishment of the Jaspers initiative, which provides technical assistance to Member States, the preparation of a comprehensive CBA guide and the use of outside expertise if needed.
Executive summary
IIIThe Commission acknowledges the Court’s con‑clusions for the audited projects of the 2000–06 and 2007–13 periods and accepts that in these programming periods support from cohesion fund‑ing for airport infrastructure did not in certain cases represent an effective use of EU funds. It wishes to underline that lessons have already been learned from this experience, and as a result there is a radi‑cally different approach in the legislation for the 2014–20 programming period.
The new regulatory framework has been made stricter when it comes to investing in airport infrastructures, limiting the possible options to improving the environmental performance or safety features of the infrastructures. On top of that, the Commission services are following a more limited line in the negotiations, focusing in particular on airports belonging to the core TEN‑T network.
As far as strategic planning is concerned, the new framework requires the existence of transport plans at regional or national level as a specific ex ante conditionality, which set out a comprehensive transport strategy per sector, the contribution to the completion of the TEN‑T and which include a list of projects to be implemented ( a ‘mature and realistic project pipeline’). The Commission takes these plans fully into account before approving any operational programme which provides for invest‑ments in the transport sector.
Concerning major projects, the Commission has adopted delegated and implementing acts that will define the quality review process and the quality elements of the cost–benefit analysis (CBA) to be respected by all major projects, such as the main benefits and costs by sector, list of risks to be con‑sidered, precise reference periods by sector, etc. In addition, CBA guidance will soon be issued includ‑ing practical recommendations for specific sectors and case studies to allow the beneficiaries to modu‑late their projects towards the best EU added value.
Reply of the Commission
Reply of the Commission 63
At another level, the Commission will intensify the monitoring and assessment of the ability of the EU air transport market to meet future challenges and opportunities.
Introduction
01The latest Eurocontrol ‘Challenges of growth 2013’ study confirms and reiterates the capacity chal‑lenge identified in previous studies.
In the most‑likely (capacity constrained) scenario, there will be 50 % more flights in 2035 than in 2012. Nearly two million flights will not be accommo‑dated (12 % of total demand for travel) because of reduced airport expansion plans. That is equivalent to an estimated 120 million passengers unable to make their return flights (in total, 240 million pas‑sengers per year).
In addition, by 2035, more than 20 airports will be running at or close to capacity, compared to just three in 2012 (hotspots — including airports in Spain and Greece).
This study shows that misplaced capacity is an issue for further discussion and that, based on the recently reported airport expansion plans, capacity shortages will occur in Europe in the next 20 years.
Source: ‘Challenges of growth 2013’ study, avail‑able at https://www.eurocontrol.int/articles/challenges‑growth.
06In its 2011 White Paper on transport policy, the Commission considered congestion as a major concern. It went on to affirm that ‘airport cap‑acity needs to be optimised and, where necessary, increased to face growing demand for travel1.
1 The 2011 White Paper ‘Roadmap to a single European transport area — Towards a competitive and resource efficient transport system’ (paragraph 28), available at http://eur‑lex.europa.eu/legal‑content/EN/ALL/;ELX_SESSIONID=HjP8JnxMmKkbg0nMHrxTqR3DX1042Lqfy2gdgLbQLf5rnTVZwSq6!1996567712?uri=CELEX:52011DC0144.
In the 2007–13 period, the Commission received 17 major project applications for airports. During the appraisal, the Commission paid significant atten‑tion to the issue of overall cost of the projects, their bene fits and added value for society. This resulted in specific cases such as the reduction of scope of projects (e.g. Lasi airport and Wroclaw airport) or the inclusion of conditions in the approval decision (for Gdansk airport due to construction plans for the adjacent airport in Gdynia). The Commission always carefully verified the demand analysis. In some cases, the Commission urged national authorities to abandon projects (e.g. airports in Kielce, and in Bialystok) due to insufficient demand and the Com‑mission’s concerns linked with the financial sustain‑ability of those airports.
V(i)The Commission accepts the recommendation and will implement it during the negotiations on operational programmes for the period 2014–20. The approach of the Commission’s services in the negotiations is that EU funding to airport infrastruc‑ture is focused in particular on airports belonging to the core TEN‑T network. The Commission also requires that the comprehensive transport master plans should serve as a basis for the choice of trans‑port investment priorities. All investments should contribute to delivering the objectives for the prior‑ity axis concerned and investments in any airport would in particular need to be subject to a prior detailed assessment of economic viability and competition (e.g. whether private operators could finance the investment). Finally, investments should be underpinned by plausible results of the required feasibility study and a positive CBA.
V(ii)The Commission agrees with the importance of coherent airport strategic planning as a means to avoid misplaced capacity in the future.
The Commission agrees with the recommendation which is addressed to the Member States (coherent regional, national and, where appropriate and pos‑sible, supranational plans for airport development). On its side, it will verify the implementation during the negotiations on operational programmes for the 2014–20 period through the assessment of transport plans in the framework of the fulfilment of ex ante conditionalities. See also reply to paragraphs 68 to 71.
Reply of the Commission 64
21 Second bullet pointThe Commission considers that there is no clear trend in air passenger transport development in the audited Member States. For the years 2007–13, air transport in Greece decreased by 3,3 % and in Spain by 3,5 %. In Spain, air passenger transport decreased in 2008, 2009, 2012 and 2013; in Greece it decreased in 2008, 2009, 2010 and 2012; and in Italy, it decreased in 2008, 2009, 2012 and 2013.
21 Third bullet pointThe Commission notes that the economy of the EU‑27 has been either in stagnation or in reces‑sion since 2007, with the only exceptions of 2010 and 2011. Some of the audited Member States experienced dramatic GDP drops: Greece is in its sixth consecutive year of recession, and Italy and Spain were in recession in four out of six years. Therefore, the Commission considers that the crisis has had a serious and continuous impact on air transport.
Observations
Common reply to paragraphs 28 and 30Airports are infrastructures which have a long life‑time. The Commission considers that the utilisation rate of airports should be verified over the lifetime of the investments made in order to assess whether they have fully reached their operational usage. In addition, building airport infrastructure in phases to keep close or just above the benchmark, while ideal, would in practice mean that works would have to be constantly carried out in the airport, requiring particular arrangements and disturbance in the functioning and services offered by the airport.
In its subsequent 2011 communication accom‑panying the airport package, the Commission confirmed that congestion at airports is an issue for Europe. Besides, if capacity on the ground is lacking, the success of the single European sky project as a whole will be threatened. At the same time, Europe’s aviation sector faces increased com‑petition and a shift in the global aviation market towards regions such as Asia Pacific, the Middle East and Latin America, which threaten Europe’s privi‑leged position as a cross‑road of the global aviation network and the benefits in terms of connectivity that this position provides2.
Audit scope and approach
21 First bullet pointWhile air transport has picked up in the EU‑27 since 2010, the Commission considers that there has been no general recovery in air transport in the years 2007–13. The average EU‑wide figures alone cannot reflect the different developments in air transport in different Member States which vary considerably between each other. In 2010, 21 Member States faced an increase and six a decrease in passenger volumes; in 2011, 25 an increase and two a decrease; in 2012, 18 an increase and nine a decrease; and in 2013, 21 an increase and six a decrease. The fluctuation between increase and decrease during the last few years was significant in Spain, Italy and Greece — the economic woes of all three being well documented. Eurostat data for 2013 confirm that air passenger numbers have not reached the pre‑crisis levels for Greece and Spain.
2 2011 communication on airport policy in the EU, available at http://ec.europa.eu/transport/modes/air/airports/index_en.htm.
Reply of the Commission 65
Common reply to paragraphs 53 to 55The definition used by the Commission for issuing state aid decisions is that the ‘catchment area of an airport in general means a geographic market boundary that is normally set at around 100 kilo‑metres or around 60 minutes travelling time by car, bus, train or high‑speed train. However, the catchment area of a given airport may be different and needs to take into account the specificities of each particular airport. The size and shape of the catchment area varies from airport to airport, and depends on various characteristics of the airport, including its business model, location and the des‑tinations it serves.’ The 100 km threshold (200 km if a high‑speed railway line exists) is also defined in Article 24 of the TEN‑T regulation setting out the criteria for air transport infrastructure components. As mentioned by the Court, in a recent study of the Commission’s services on accessibility to passenger flights in Europe, the Commission’s services drew conclusions on the basis of a catchment area of 90 minutes’ travel time to the airports. The Commis‑sion considers that the catchment areas should also take into account other elements such as the business model of the airport, number and type of destinations served, availability of airport capacity at other airports, public transport links, time‑sensi‑tive travellers and whether the airport mainly serves the residents or visitors coming to the area.
Regional airports often do not serve the same des‑tinations with the same frequency as their neigh‑bouring airports and even more so as the main airport in the Member State.
37The Commission considers it difficult to identify a trend in passenger traffic figures for the years 2007–13, on which the Court bases itself for the re‑calculation of the cost per additional passenger. The Commission therefore considers that an assessment on the basis of milestones and mid‑term reviews would provide a suitable basis for the assessment of the cost‑effectiveness of projects. See also the Com‑mission’s reply to paragraph 21.
Common reply to paragraphs 40 to 43For the purposes of assessing major projects in cohesion policy, financial sustainability is under‑stood by the Commission as the capacity of a pro‑ject to generate enough revenues to cover the operating costs in every year of its operation, and not the capacity to generate profits. Though indeed EU support should ideally be provided to profit‑able infrastructures, it happens that some transport infrastructures are loss‑generating, despite the existence of revenues, and in such cases the deci‑sion to provide EU support is based on whether the project is socioeconomically desirable (i.e. brings more benefits than costs).
45Regional airports may serve communication pur‑poses for a region or community and the public authorities may wish to maintain their function‑ing for other than simply financial reasons. That is why public transport infrastructures which are not profitable and require state support are kept in functioning.
50Air passenger transport in Spain decreased between 2007 and 2013 by some 3,5 % and in Greece by 3,3 %. The Commission considers that the audited airports followed this trend and noted also a decrease in traffic, which follows the course of the Spanish and Greek economies, which is in recession almost without interruption since 2007.
See also the Commission’s reply to paragraph 21.
Reply of the Commission 66
Conclusions and recommendations
Common reply to paragraphs 68 to 71The Commission acknowledges the Court’s con‑clusions for the audited projects of the 2000–06 and 2007–13 periods and accepts that in these programme periods support from cohesion funding for airport infrastructure did not in certain cases represent an effective use of EU funds. It wishes to underline that lessons have already been learned from this experience, and as a result there is a radi‑cally different approach in the legislation for the 2014–20 programme period.
The new regulatory framework has been made stricter when it comes to investing in airport infrastructures, limiting the possible options to improving the environmental performance or safety features of the infrastructures. On top of that, the Commission services are following a more limited line in the negotiations, focusing in particular on airports belonging to the core TEN‑T network.
As far as strategic planning is concerned, the new framework requires the existence of transport plans at regional or national level as a specific ex ante conditionality, which set out a comprehensive transport strategy per sector, the contribution to the completion of the TEN‑T and which include a list of projects to be implemented (a ‘mature and realistic project pipeline’). The Commission takes these plans fully into account before approving any operational programme which provides for invest‑ments in the transport sector.
Concerning major projects, the Commission has adopted delegated and implementing acts that will define the quality review process and the quality elements of the CBA to be respected by all major projects, such as the main benefits and costs by sector, list of risks to be considered, precise refer‑ence periods by sector, etc. In addition, CBA guid‑ance will be soon issued including practical recom‑mendations for specific sectors and case studies to allow the beneficiaries to modulate their projects towards the best EU added value.
Common reply to paragraphs 61 to 63As far as strategic planning is concerned, a radi‑cal reform has been put in place for the 2014–20 period, whereby the legal framework provides for the fulfilment of specific ex ante conditionalities in the transport sector, which require the existence of a specific comprehensive transport plan or frame‑work at national or regional level prior to approval of support to operational programmes. The trans‑port plan is to set out the contribution to the single European transport area, the core and comprehen‑sive TEN‑T where investment from the ERDF and the CF will be made, as well as a realistic and mature project pipeline for implementation by the opera‑tional programmes.
Operational programmes include an analysis of the situation and specific needs at the time of program‑ming and a link with the interventions planned. As such, the Commission considers them as planning documents for the purposes of EU co‑financed interventions.
Common reply to paragraphs 66 and 67Under the system of shared management, pow‑ers are shared between the Commission and the Member States, the latter being responsible for the day‑to‑day management and the former being responsible for the monitoring and overview at programme and not at project level. This means that the Commission is not supposed to and cannot base its implementation and monitoring compli‑ance activity by reference to detailed information on every single project, given that thousands of projects are co‑financed every year through cohe‑sion policy.
Reply of the Commission 67
72The definition used by the Commission for issuing state aid decisions is that ‘catchment area of an air‑port in general means a geographic market bound‑ary that is normally set at around 100 kilometres or around 60 minutes travelling time by car, bus, train or high‑speed train. However, the catchment area of a given airport may be different and needs to take into account the specificities of each particular air‑port. The size and shape of the catchment area var‑ies from airport to airport, and depends on various characteristics of the airport, including its business model, location and the destinations it serves.’ The 100 km threshold (200 km if a high‑speed railway line exists) is also defined in Article 24 of the TEN‑T regulation setting out the criteria for air transport infrastructure components. As mentioned by the Court, in a recent study of the Commission’s ser‑vices on accessibility to passenger flights in Europe, the Commission’s services drew conclusions on the basis of a catchment area of 90 minutes’ travel time to the airports. The Commission considers that the catchment areas should also take into account other elements such as the business model of the airport, number and type of destinations served, availability of airport capacity at other airports, public trans‑port links, time‑sensitive travellers and whether the airport mainly serves the residents or visitors com‑ing to the area.
Regional airports often do not serve the same des‑tinations with the same frequency as their neigh‑bouring airports and even more so as the main airport in the Member State.
The fact that the Commission does not have full detailed knowledge of all EU‑funded projects throughout the EU and throughout sectors does not mean that it fails to fulfil its regulatory supervisory role. On the contrary, the Commission exercises its supervisory role — often beyond its regulatory pre‑rogatives — through annual reporting and moni‑toring also at project‑by‑project level if needed, ad hoc treatment of problematic issues and specific audits. What is more, the Commission has in the past refused co‑financing to regional airports for which the business case was not evident and which did not seem justified from the cohesion point of view.
All major projects will have to go through a quality review, either by the Commission or by independ‑ent experts (Jaspers or other entities nominated by Member States and agreed by the Commission) before approval by the Commission.
69 First bullet pointThe Commission considers that the utilisation rate of the airport should be verified over the lifetime of the investments made in order to assess whether they have fully reached their operational usage.
70Regional airports may serve communication pur‑poses for a region or community and the public authorities may wish to maintain their functioning for other than simply financial reasons. That is why public transport infrastructures which are not prof‑itable and require state support are sometimes kept in functioning.
Recommendation 1The Commission accepts the recommendation and will implement it during the negotiations on operational programmes for the period 2014–20. The approach of the Commission’s services in the negotiations is that EU funding to airport infrastruc‑ture is focused in particular on airports belonging to the core TEN‑T network. The Commission also requires that the comprehensive transport master plans should serve as a basis for the choice of trans‑port investment priorities. All investments should contribute to delivering the objectives for the prior‑ity axis concerned and investments in any airport would in particular need to be subject to a prior detailed assessment of economic viability and competition (e.g. whether private operators could finance the investment). Finally, investments should be underpinned by plausible results of the required feasibility study and a positive CBA.
Reply of the Commission 68
Recommendation 2The Commission agrees with the importance of coherent airport strategic planning as a means to avoid misplaced capacity in the future.
The Commission agrees with the recommendation which is addressed to the Member States (coherent regional, national and, where appropriate and pos‑sible, supranational plans for airport development). On its side, it will verify the implementation dur‑ing the negotiations on operational programmes for the period 2014–20 through the assessment of transport plans in the framework of the fulfilment of ex ante conditionalities. See also the reply to paragraphs 68 to 71.
At another level, the Commission will intensify the monitoring and assessment of the ability of the EU air transport market to meet future challenges and opportunities.
The Commission also notes that Cohesion Fund projects were directly approved by it in the 2000–06 period, while in the 2007–13 period they were included in the programmes and approved individually only if they were major projects. The Commission took steps in the 2007–13 period to improve the assessment of major projects, through the establishment of the Jaspers initiative, which provides technical assistance to Member States, the preparation of a comprehensive CBA guide and the use of outside expertise if needed.
In the 2007–13 period, the Commission received 17 major project applications for airports. During the appraisal, the Commission paid significant atten‑tion to the issue of overall cost of the projects, their bene fits and added value for society. This resulted in specific cases such as the reduction of scope of projects (e.g. Lasi airport and Wroclaw airport) or the inclusion of conditions in the approval decision (for Gdansk airport due to construction plans for adjacent airport in Gdynia). The Commission always carefully verified the demand analysis. In some cases, the Commission urged national authorities to abandon projects (e.g. airports in Kielce, and in Bialystok) due to insufficient demand and the Com‑mission’s concerns linked with the financial sustain‑ability of those airports.

HOW TO OBTAIN EU PUBLICATIONS
Free publications:
• one copy: via EU Bookshop (http://bookshop.europa.eu);
• more than one copy or posters/maps: from the European Union’s representations (http://ec.europa.eu/represent_en.htm); from the delegations in non‑EU countries (http://eeas.europa.eu/delegations/index_en.htm); by contacting the Europe Direct service (http://europa.eu/europedirect/index_en.htm) or calling 00 800 6 7 8 9 10 11 (freephone number from anywhere in the EU) (*).(*) The information given is free, as are most calls (though some operators, phone boxes or hotels may charge you).
Priced publications:
• via EU Bookshop (http://bookshop.europa.eu).
Priced subscriptions:
• via one of the sales agents of the Publications Office of the European Union (http://publications.europa.eu/others/agents/index_en.htm).nts/index_en.htm).
QJ‑A
B‑14‑020‑EN‑N
ISSN
1977‑5679
The Court audited 20 airports in five Member States and found that EU funding is in many cases provided to airports in close proximity to each other: for 13 airports, significant overlaps exist with the catchment areas of neighbouring airports. This produced poor value for money and resulted in oversizing of the EU-funded infrastructures and in over-capacity. The Court also observes that the EU funding was not cost-effective and that seven of the airports examined are not profitable: these may need to be closed unless they receive continuous public financial support. The EU funding of airports is not well coordinated at national level and, in particular as regards major projects and cohesion fund projects, insufficiently supervised by the Commission which generally does not know which airports receive funding, and how much they receive.
EUROPEANCOURTOF AUDITORS