Embed Size (px)
Citation preview
Active tundishmetallurgy
(AcTuM)
doi:10.2777/62336
Active tundish metallurgy (AcTuM
)EU
EUR 25875
KI-NA-25875-EN
-N
The Active Tundish Metallurgy project aimed at improved, better guaranteed steel cleanness by applying tailored tundish slag with high capacity to efficiently absorb macro- and micro-inclusions from different steels.
Thermodynamic calculations showed that industrial partners’ slags used in their standard practice were either solid or have only limited capability to dissolve inclusions from steel at tundich temperatures.
Fundamental studies on factors influencing inclusion removal and inclusion cleanliness in tundish as well as thermodynamic calculations showed that more basic slag would lead to a more effective tundish slag having higher capacity to absorb inclusions compared to standard practice. Based on these results better slags and practices were proposed for industrial trials.
Experimental tests with the new proposed tundish powders showed improvement in steel cleanness compared to standard practice. At OvakoImatra due to good results with the usability of the new powder the old tundish powder practice was abandoned, and a new basic powder was adopted into regular use. At Sidenor new tundish cover is used for heats with special cleanness requirements, however length would be limited to 3 heats due to the excessive erosion of isostatic refractory pieces and slag cover hardening. At DEW good results with the new suggested cover powders will be verified in large scale production trail and based on these results their implementation to standard tundish practice will be evaluated. At Tata Steel two new powders have been tested with good results, but no long-term proof of cleanness improvements has been found and hence economic benefits cannot be shown.
Studies and reports
Research and Innovation EUR 25875 EN

EUROPEAN COMMISSION Directorate-General for Research and Innovation Directorate G — Industrial Technologies Unit G.5 — Research Fund for Coal and Steel
E-mail: [email protected] [email protected]
Contact: RFCS Publications
European Commission B-1049 Brussels
HOW TO OBTAIN EU PUBLICATIONS Free publications: • via EU Bookshop (http://bookshop.europa.eu);
• at the European Union’s representations or delegations. You can obtain their contact details on the Internet (http://ec.europa.eu) or by sending a fax to +352 2929-42758.
Priced publications: • via EU Bookshop (http://bookshop.europa.eu).
Priced subscriptions (e.g. annual series of the Official Journal of the European Union and reports of cases before the Court of Justice of the European Union): • via one of the sales agents of the Publications Office of the European Union
(http://publications.europa.eu/others/agents/index_en.htm).
European Commission
Research Fund for Coal and SteelActive tundish metallurgy
(AcTuM)
M. Kekkonen, L. Holappa, S. LouhenkilpiAalto University
Otakaari 1, 00076 Aalto, FINLAND
C. SchröderTU Bergakademie Freiberg
Akademiestraße 6, 09599 Freiberg, GERMANY
T. Rodríguez Durán, J. Ciriza CorcueraGerdau Investigacion y Desarrollo Europa S.A.
Barrio Ugarte s/n, 48970 Basauri, SPAIN
M. SernaFundación Tecnalia Research & Innovation
C/Geldo — Parque Tecnológico De Bizkaia, Edificio 700, 48160 Derio, SPAIN
K. VälimaaOvako Bar Oy Ab
Terästehtaantie 1, 55100 Imatra, FINLAND
W. LawTata Steel Research, Development and Technology
Teesside Technology Centre, P.O. Box 11, Grangetown, Middlesbrough TS6 6US, UNITED KINGDOM
D. LeuverinkDeutsche Edelstahlwerke GmbH
P.O. Box 101220, 57012 Siegen, GERMANY
Grant Agreement RFSR-CT-2008-00006 1 July 2008 to 31 December 2011
Final report
Directorate-General for Research and Innovation
2013 EUR 25875 EN

LEGAL NOTICE
Neither the European Commission nor any person acting on behalf of the Commission is responsible for the use which might be made of the following information.
The views expressed in this publication are the sole responsibility of the authors and do not necessarily reflect the views of the European Commission.
More information on the European Union is available on the Internet (http://europa.eu). Cataloguing data can be found at the end of this publication. Luxembourg: Publications Office of the European Union, 2013 ISBN 978-92-79-29039-8 doi:10.2777/62336 © European Union, 2013 Reproduction is authorised provided the source is acknowledged. Printed in Luxembourg Printed on white chlorine-free paper
Europe Direct is a service to help you find answers to your questions about the European Union
Freephone number (*):00 800 6 7 8 9 10 11
(*) Certain mobile telephone operators do not allow access to 00 800 numbers or these calls may be billed.
3
TABLE OF CONTENTS 1 FINAL SUMMARY .......................................................................................................................... 5
2 SCIENTIFIC AND TECHNICAL DESCRIPTION OF THE RESULTS ....................................... 11
2.1 OBJECTIVES OF THE PROJECT.................................................................................................... 11
2.2 COMPARISON OF INITIALLY PLANNED ACTIVITIES AND WORK ACCOMPLISHED ...................... 11
2.3 DESCRIPTION OF ACTIVITIES AND DISCUSSION......................................................................... 11 WP1 Characterisation of the current status and evaluation of potentials for improved
tundish practice .............................................................................................................. 11 Task 1.1 Collection and analyses of historical data, tundish slag and refractory........ 11 Task 1.2 Identification of production tundish cover practice with best cleanness
results ........................................................................................................... 18 Task 1.3 Evaluation of requirements for tundish slag to improve its inclusion
absorption capacity....................................................................................... 28 WP2 Dissolution kinetics of non-metallic inclusions ............................................................. 35
Task 2.1 Slags selection and production ..................................................................... 35 Task 2.2 Dissolution investigations using CLSM....................................................... 37 Task 2.3 Dissolution investigations using DHTT ....................................................... 40 Task 2.4 Analysis of element and compound distribution over dissolution area
(SEM-EDX and light microscopy)............................................................... 41 WP3 Tundish slag conditioning & process development ....................................................... 51
Task 3.1 Viscosity measurements ............................................................................... 51 Task 3.2 Interfacial tension measurements ................................................................. 53 Task 3.3 Wettability measurements ............................................................................ 56 Task 3.4 Thermodynamic calculations ....................................................................... 57 Task 3.5 Tundish slag conditioning technique development ...................................... 59 Task 3.6 Small tonnage pilot scale tests and evaluation ............................................. 74
WP4 Plant tests & simulations for best practice ..................................................................... 83 Task 4.1 Best practice development & slag conditioning........................................... 83 Task 4.2 Productivity analysis .................................................................................... 87 Task 4.3 Simulation with water model ....................................................................... 91 Task 4.4 CFD simulation with improved boundary condition for inclusion removal 94 Task 4.5 Tundish design optimization ........................................................................ 96
WP5 Comparative evaluation.................................................................................................. 99 Task 5.1 Industrial Trials ............................................................................................ 99 Task 5.2 Cost analysis............................................................................................... 107 Task 5.3 Concepts for industrial implementation ..................................................... 109
2.4 CONCLUSIONS......................................................................................................................... 111
2.5 EXPLOITATION AND IMPACT OF THE RESEARCH RESULTS...................................................... 113
LIST OF FIGURES ............................................................................................................................. 115
LIST OF TABLES .............................................................................................................................. 120
LIST OF ACRONYMS AND ABBREVIATIONS ..................................................................................... 122
LIST OF REFERENCES ...................................................................................................................... 122
APPENDICES…………………………………………………………………………………… …123

5
1 FINAL SUMMARY The overall objective of this project was to develop active tundish process by applying tailored tundish slag with high capacity to efficiently absorb macro- and micro-inclusions from different steels. To achieve this objective the research work in the project was divided into 6 work packages that were subdivided into various tasks. The objectives, outcomes as well as usefulness of the results of each task are summarised below. WP1 Characterisation of the current status and evaluation of potentials for improved tundish
practice
The objectives of this work package were to characterise the current status in steel plants concerning the role of tundish slag and refractory materials for steel cleanliness (Tasks 1.1 and 1.2) and to evaluate the potential of tundish slags with different compositions to absorb inclusions from steel (Task 1.3). Task 1.1 Collection and analyses of historical data, tundish slag and refractory
Industrial partners gathered historical data and information of their current tundish practice, developed slag and steel sampling methods and took samples from liquid slag and steel during the process for analyses. The collected data were used to identify the tundish cover practice with best cleanness results in Task 1.2 and to find out the capacity of different tundish slags to absorb inclusions in Task 1.3. In addition steel plants took and delivered process samples (cover powder/slag, steel, refractory material) for fundamental studies performed at TUBAF (WP 2, WP3: Tasks 3.1 and 3.2) and at Aalto (WP3: Task 3.3). Steel grades were selected for theoretical examination and experimental trials particularly to increase sequence length extension (via reduction in alumina and other species which can deteriorate steel quality or cause stopper wear) and grade families which have steel cleanness problems. The steel grades considered in this project by Sidenor were spring and micro alloy steel grades. At Ovako steel grades 100Cr6 and SEA1050; at Tata Steel C/Mn steel; and at DEW steel grades 100Cr6 and 16MnCrS5, were selected. Task 1.2 Identification of production tundish cover practice with best cleanness results
At Sidenor, two tundish cover powders (AM and AR) are used in the standard casting process. The difference in behaviour of these powders was evaluated by carrying out nine industrial trials, six with the AM powder and three with the AR. The cleanness of the steel samples was analysed by 3 different and complementary methods but no significant difference in the behavior of the two standard tundish cover powders when talking about inclusion removal was found. At Tata Steel three tundish cover powders are used currently. A data gathering exercise was undertaken involving plant data and some pilot scale work. This was to attempt to determine the compositional changes within the slag over time and to relate these to inclusion assimilation. There was evidence of increasing levels of manganese, silicon, aluminium, and calcium oxides in the slag bulk which increase by between 10 and 20% over a three ladle sequence. This indicates a pick up of alumina silicate inclusions, MgO from the refactory materials and CaO from ladle slag. Samples were also taken across the tundish, showing increased MgO (from tundish refactories) and lower Al2O3 (from reduced activity). Task 1.3 Evaluation of requirements for tundish slag to improve its inclusion absorption
capacity
In this task the potential of tundish slags used in the steel plants to absorb inclusions from steel was evaluated at Aalto. Based on the steel and slag analyses and casting data from steel plants (Task 1.1) thermodynamic calculations were performed by using FactSage programme and databases to find out the capacity of different tundish slags to absorb inclusions e.g. aluminium oxides from steel.
6
Thermodynamic calculations showed that industrial partners slags used in their standard practice were either solid or have only limited capability to dissolve inclusions from steel at tundich temperatures. These results gave guidelines for further investigations of better slag compositins for the plants in Tasks 3.4 and 3.5. WP2 Dissolution kinetics of non-metallic inclusions
When arrived near to the steel-slag interface the inclusions have opportunity to move through the interface and dissolve into the slag. The dissolution phenomenon is extremely important for the final steel cleanliness and therefore studied in this work package. The objectives of this work package were to measure dissolution kinetics of different oxide inclusions into slag in conditions relevant to casting tundish and to identify slag compositions with optimal dissolution of non-metallic inclusion (Task 2.2) as well as to study the difference in behaviour of different inclusion types and sizes (Tasks 2.3 and 2.4). Task 2.1 Slags selection and production
Slags taken from the industrial process by project partners as well as synthetic slags related to the industrial process were prepared and analysed for experimental studies performed at TUBAF in Tasks 2.2 and 2.3 as well as in Tasks 3.1 and 3.2. Task 2.2 Dissolution investigations using CLSM
The dissolution of Al2O3 and MgAl2O4 particles into industrial partners’ slags (standard and new) at tundish temperature was investigated by using CLSM method (Confocal Laser Scanning Microscope). This technique allows continuous in-situ observation of dissolution behaviour of inclusions in molten slags. The dissolution process is captured with a CCD camera and continuously recorded. Great variability was observed in dissolution rates of inclusions into different slags. The viscosity of the slag and slag position in the phase diagram were found to be important for the dissolution. The distance between slag and precipitation area can be stated as chemical driving force for the dissolution process. In general, both Al2O3 and Al2O3·MgO particles dissolved much slower in acid slags than basic slags. These observations were used to guide the selection of proper slag compositions for industrial trials. Task 2.3 Dissolution investigations using DHTT
In order to obtain intermediate information during the dissolution process, samples were investigated by using Double Hot Thermocouple Technique (DHTT). In the first step a small amount of slag was pre-melted between two thermocouples, which acted as heating and temperature controlling device in one. After quenching an oxide particle was placed on upper surface of the slag droplet. In the second step the sample was heated up to the desired temperature. After the softening of the slag the particle sank into the bulk and dissolution process started. The evolution of the particle shape was observed by a CCD camera. The dissolution process was interrupted by quenching before the particle was completely dissolved. Task 2.4 Analysis of element and compound distribution over dissolution area (SEM-EDX and
light microscopy)
After the DHTT experiments samples were prepared for metallographic and SEM-investigations. The interface between particle and slag was analysed with Scanning-Electron-Microscope including energy dispersive X-ray analyser. SEM-investigation showed that during the dissolution of alumina particles Mg-rich precipitations were formed in the particle-slag interface when slag contains MgO. This might be the reason for low dissolution rate of alumina into some of the slags. WP3 Tundish slag conditioning & process development
When entering to the steel – slag interface inclusions can be separate from the steel melt into the liquid slag. Several mechanisms can be of importance like gravity, velocity differences between phases and, especially in the final state interfacial phenomena (surface energy relations, wetting) in determining when an inclusion should cross the metal/slag interface. Thus the objectives of this work package were
7
to provide data of slag viscosity (Task 3.1) and interfacial phenomena (Tasks 3.2 and 3.3) related to inclusion removal in tundish. In addition based on the thermodynamic calculations the aims were to evaluate the capacity of different tundish slags to absorb inclusions and to propose better slag compositions for industrial tests (Tasks 3.4 and 3.5) as well as to develop tundish slag conditioning (Task 3.5). Task 3.1 Viscosity measurements
Viscosities of industrial partners’ slags (standard and new) were measured at TUBAF using rotating cylinder method. For the investigations 1600°C was chosen as maximum temperature. All investigated slags from Sidenor showed glassy solidification. The normally used start powder (AM) has higher viscosity than the other start powder (AR). At the end of tundish process the viscosity lowered. Also in the case of Ovako all investigated slags, except the standard start powder, showed glassy behaviour. In the standard start powder a huge increase in viscosity (break point) near to tundish operating temperature was observed. Slags with a high dissolution rate showed also low viscosity at experimental temperature. The viscosity experiments of slags from DEW showed that three of the investigated slags have a strong break point which marks the attendance of crystalline phases. However these break points were observed to be below the tundish working temperature. Other two slags were very viscous over the whole temperature range. Task 3.2 Interfacial tension measurements
Measurements of interfacial tension between industrial steels and tundish slags supplied by Ovako and Sidenor were undertaken at 1550°C using the drop weight method. In the case of SAE 1050 steel and tundish slags from Ovako it was found that increasing Al2O3 content of 5-10 % led to a higher interfacial tension. In the case of Sidenor it was found that interfacial tension between 57Cr3F steel and standard start powder AR was lower compared to the other standard start powder AM. This was due to higher Fe2O3 content in AR powder. Fluxes containing highly reducible oxides tends to produce low interfacial tension. Task 3.3 Wettability measurements
Wettability experiments were carried out at Aalto by investigating the interaction between alumina substrate and tundish slags (standard and new) from industrial partners. Also wettability between slag and refractory substrate was examined. After the experiments slag/substrate interface was analysed by SEM in order to investigate possible interaction between them. Wettability measurements showed that wetting characteristics of all investigated slags against alumina were very good and thus not considered to control alumina inclusions removal from steel-slag interface to liquid slag. Wetting angle between slag and dense alumina substrate was found to be lower using the new proposed slags compared to standard slags. In the case of low alumina containing slags reaction layer was formed in the slag-alumina interface. Experiments with refractory material as a substrate showed poor wettability between slags from Sidenor and refractory material. In the case of new slags little part of slag penetrated inside the refractory material. In the case of DEW all the new slags were observed to be quite aggressive against refractory material. This was observed also in the industrial trials. These and the results from Tasks 3.1 and 3.2 gave important basic knowledge for relation between slag chemistry and properties which are related to inclusion removal in tundish as well as guidelines for tundish slag optimisation. Task 3.4 Thermodynamic calculations
Thermodynamic calculations in Task 1.3 showed that the predominantly alumina-silicate tundish cover powders used at Tata Steel, Scunthorpe Works were close to saturation levels for absorption of alumina-related species. Ideally inclusion absorption behaviour for this slag might be improved by
8
some substitution of species to increase degree of fluxing of the slag and the liquid range under which alumino-silicates could continue to be absorbed. Also the kinetics of alumina absorption is improved at higher basicity. Therefore possibly addition of a CaO to promote lower melting point calcium aluminates and in increase slag basicity might lead to a more effective tundish slag. These aspects formed the focus for the thermodynamic study by Aalto in this task. Based on the thermodynamic calculations more basic slag with a long liquid range, allowing formation of low melting point calcium aluminates and with high capacity of assimilation of inclusions of this type was proposed for pilot (Task 3.6) and industrial scale (Task 5.1) tests at Tata Steel. Task 3.5 Tundish slag conditioning technique development
In order to find optimal tundish slag composition thermodynamic calculations were performed by Aalto to understand eventual reactions between slag and steel. Based on the calculation results more effective tundish slags having higher capacity to absorb inclusions compared to standard practice were proposed for Ovako and DEW. At Tecnalia laboratory trials with an induction furnace were carried out in order to compare the capacity of different tundish cover powders to absorb inclusions before the industrials trials at Sidenor (Task 5.1). However due to difficulties in preparation the samples obtained from the laboratory trials were not reliable and/or representative in order to investigate their performance in absorbing inclusions. At Ovako development of sampling and steel cleanness measuring methods for test casts (Task 4.2) were performed. Tata Steel carried out small induction furnace trials to assess practical aspects of fluxing for proposed tundish cover powder mixes before the pilot plant tests in Task 3.6. Task 3.6 Small tonnage pilot scale tests and evaluation
At Tata Steel the induction furnace trials were followed by eight pilot plant trials. Six of these trials were to provide further optimisation of the suggested mixes, whilst the final two trials were to consider another possible slag composition (high MgO content). The fluxing time of the proposed cover powder was found to be in the range of 5-10 minutes. This is considered adequate for fluxing in the production situation. Fluxing of the high MgO powder was difficult and only a small liquid layer was formed in the time available during the experiment (~10 minutes casting time). WP4 Plant tests & simulations for best practice
The objectives of Tasks 4.1-4.2 were to find out optimal slag composition and improved practice for different steel grades. This was performed by analysing the results of the test trials. Tasks 4.3-4.5 focused on finding optimal tundish design. Task 4.1 Best practice development & slag conditioning
Under this task Sidenor carried out industrial trial with the tundish configuration developed by Tecnalia in Task 4.5. No significant difference on the number and the size of the inclusions were observed. At Tata Steel a programme of plant sampling trials was undertaken to provide base data against which to compare the trial results. Task 4.2 Productivity analysis
At Sidenor industrial trials with the new powder resulted excessive refractory erosion in the isostatic pieces. This attack to the isostatic refractory gives as a result the necessity of changing the shroud tube each 2 heats, while with the standard powder it lasts 3 or even 4 heats, and the stopper rods suffered important erosion of around 1.6mm per heat (erosion with standard cover is 0.9mm per heat). It could be observed from the industrial trials that for working safely with the new tundish cover powder, it could be utilised in sequences of up to 3 heats without operative problems. At Ovako a test series with 38 heats were carried out. From the viewpoint of practicality, it was found during the trial sequences that the basic calcium-aluminate tundish powder tends to erode the stopper refractory quite fast. The effect on the tundish wear lining was not as detrimental. It was estimated that the limiting factor for the sequence length would be the stopper erosion. However, avoiding this problem should be possible by introducing a zirconia slag lines to the stoppers.
9
At Tata Steel the high MgO powder appeared to erode the refactories less, although this will need to be proven over the long term by routine inspection of the finished tundishes. There were no problems with the stopper rods, although very long sequences, where this tends to be a problem, were not trialled. The productivity analysis looked at any improvement in quality and its effects in the same format as Task 5.2. At DEW test series using new covering powders showed that the slags Repartect B808 and B809 damaged the tundish refractory lining. This is probably caused by fluoride (~2%), also erosion might have big influence since both of these slags are at least partly solid at the tundish temperature. Other slags, including Repartect B805 which contains about 5% fluoride, did not cause any significant problems. Task 4.3 Simulation with water model
The removal of inclusions from steel melt in the tundish to the covering slag takes place via transport processes of inclusions from the bulk steel to the steel – slag interface where inclusions can finally enter the slag and dissolve in it. Due to relatively short retention time in a tundish the main mechanisms to bring inclusions close to the top surface are convection and bulk fluid flow. The search of optimal flow patterns in tundish started by water model experiments at Tecnalia where a plexiglass water model of the six strand billet caster of Sidenor at ½ scale was built. Tracer’s injection experiments and LDA (Laser Doppler Anemometer) measurements were carried out in water model in order to adjust CFD simulation parameters. Good correlation between experiments/measurements and CFD results was obtained. Task 4.4 CFD simulation with improved boundary condition for inclusion removal
The commercial code Ansys Fluent was used in Tecnalia for CFD simulations of inclusion behaviour within the actual six strand billet caster of Sidenor. In the simulations default boundary condition of entrapment available in Ansys Fluent was used because differences were not observed between entrapment model of CFD code and improved boundary condition at slag surface. In the simulations residence time distribution data and removal efficiency of alumina inclusions was determined with current tundish configuration. These results were then used as a reference data in Task 4.5. Task 4.5 Tundish design optimization
In order to optimise the inclusion removal process three modifications for Sidenor’s current tundish were analysed by means of CFD simulations at Tecnalia. In relation to inclusion removal efficiencies the best configuration was obtained and tested in industrial trial at Sidenor. WP5 Comparative evaluation
The objectives of this work package were to carry out industrial trials with different steel grades using improved tundish slag practice and to compare the results with existing practice regarding steel cleanness (Task 5.1) and process economy (Task 5.2). The objective of Task 5.3 was to evaluate the developed concepts for industrial implementation. Task 5.1 Industrial Trials
In this task steel plants carried out extensive experimental campaigns with the new proposed tundish powders in industrial scale. The results were compared with existing practice regarding steel cleanness. Industrial trials at Sidenor showed that the new tundish cover powder has similar capacity of removing inclusions from the liquid steel than standard powders, but as interaction between the new cover powder and liquid steel was lower there was less contamination of slag in the steel, and as a consequence the cleanness was better when working with new powder. Trial heats at Ovako Imatra showed improvement both in micro- and macro-inclusion level on 100Cr6 steel grade while SAE1050 showed no improvement. This was suspected to be due to modifications of auxiliary equipment on the caster. These modifications were done on summer 2011, and SAE1050 trial heat was cast prior to the improvement and 100Cr6 after. At DEW industrial trials by using the new suggested cover powders
10
Repartect B804, Repartect B805, and LDSF-RG showed improvement in steel cleanness compared to standard practice. At Tata Steel industrial trials were carried out for both new powders. Initially there were problems with spreadability, but a new batch of powder improved this. Cleanness results were good, but could not be proven over the long term. Task 5.2 Cost analysis
At Sidenor a qualitative analysis was made in order to see till what extent the production practice with the new tundish cover powder worsens or not the casting process and steel cleanness. At Tata Steel cost and usage of different tundish powders were analysed and compared. In addition any improvement in steel quality and its benefits were quantified by investigating the effect of any decrease in rejects/downgrades. Task 5.3 Concepts for industrial implementation
In this task industrial implementation of the developed concepts was evaluated. At Sidenor new tundish powder is now used for heats with special cleanness requirements, however length would be limited to 3 heats due to the excessive erosion of isostatic refractory pieces and slag cover hardening. At Ovako Imatra the standard tundish practice with start powder and cover powder was abandoned after good results with the usability of the trial powder. At DEW good results with the new suggested cover powders will be verified in large scale production trails and based on these results their implementation to standard tundish practice will be evaluated. At Tata Steel the new powders will not be industrially implemented without further testing. A dual layer powder system is being considered. CONCLUSIONS
The overall objective of this project was to develop active tundish process by applying tailored tundish slag with high capacity to efficiently absorb macro- and micro-inclusions from different steels. The project started by evaluating the state-of-the-art of current “functionality” of tundish practice in the participating steel plants. Potentials for improved tundish slag design were evaluated by thermodynamic calculations using collected data from steel plants. Calculations showed that industrial partners slags used in their standard practice were either solid or have only limited capability to dissolve inclusions from steel at tundish temperatures. Thorough fundamental studies on factors influencing inclusion removal and inclusion cleanliness in tundish were performed in participating universities and research institutes. These included investigation of dissolution and interfacial phenomena, slag viscosity measurements as well as search of optimal flow pattern for inclusion removal by water model experiments and CFD modelling. Fundamental studies as well as thermodynamic calculations showed that more basic slag would lead to a more effective tundish slag having higher capacity to absorb inclusions compared to standard practice. Based on these results better slag compositions were proposed for industrial trials. Experimental tests with the new proposed tundish powders showed improvement in steel cleanness compared to standard practice. The new tundish practices developed in this project have been successfully implemented at Sidenor and Ovako steel works. At Sidenor the new tundish cover is now used for heats with special cleanness requirements, but the sequence length would be limited to 3 heats due to the excessive erosion of isostatic refractory pieces and slag cover hardening. In Ovako Imatra the tundish practices were altered due to the results obtained in this project. The old tundish powder practice with two tundish powders was abandoned, and a new, single layer, basic powder was adopted into regular use. At DEW industrial trials by using the new suggested cover powders showed improvement in steel cleanness. Their functionality will still be verified in a large scale production trails. Based on these results their implementation to standard tundish practice will be evaluated. At Tata Steel two new powders have been tested with good cleanness results, but no long term proof of cleanness improvements has been found and hence economic benefits cannot be proven.
11
2 SCIENTIFIC AND TECHNICAL DESCRIPTION OF THE RESULTS 2.1 OBJECTIVES OF THE PROJECT The Active Tundish Metallurgy project aimed at improved, better guaranteed steel cleanness by applying tailored tundish slag with high capacity to efficiently absorb macro- and micro-inclusions from different steels. Several sub-objectives were defined in order to achieve the overall objective. These were:
- Evaluation of state-of-the-art of current “functionality” of tundish practice and slags in steel plants and potentials for improved tundish slag.
- Thorough fundamental studies on factors influencing inclusion removal and inclusion cleanliness in tundish. These include investigation of dissolution and interfacial phenomena, slag viscosity measurements as well as search of optimal flow pattern for inclusion removal by water model experiments and CFD modelling.
- Tundish slag conditioning and process optimisation.
- Industrial trials with improved tundish practice, evaluation of results and industrial implementation. 2.2 COMPARISON OF INITIALLY PLANNED ACTIVITIES AND WORK ACCOMPLISHED No major deviations. However at Tata Steel the lead researcher on the project was on long term sick leave for the first two years of the project. The work was carried on by other members of the department, but the project lacked the drive and focus for its agenda to be pushed on the steelplant. So when it came to the critical period of getting plant buy-in and approval for industrial trials, there was a lack of relationships in key positions and understanding of what we were trying to achieve. Furthermore there were delays in ordering the trial powders as the suppliers were not accredited in the SAP system, and getting the powers environmentally approved for use on the steelplant. The effect on the project was to squeeze the timetable of the industrial trials into a smaller period than desirable and led to them being extended (with Tata Steel bearing the cost) beyond 31st December 2011. 2.3 DESCRIPTION OF ACTIVITIES AND DISCUSSION WP1 Characterisation of the current status and evaluation of potentials for improved
tundish practice Task 1.1 Collection and analyses of historical data, tundish slag and refractory The objectives of this task were to collect data concerning the present tundish practice at steel plants, to select steel grades for theoretical examination and experimental trials as well as to develop slag and steel sampling methods in order to collect representative and good quality samples for analyses and fundamental studies. Special data collection form (Appendix 1) was designed by Aalto and sent to all industrial partners in order to collect data (cover powders, refractory materials, slag and steel analyses etc.) from their current tundish practice. These data were then recorded and used in thermodynamic and mass balance calculations in Task 1.3 to find out the capacity of different tundish slags to absorb inclusions. In addition to the above mentioned data the steel plants were requested to deliver process samples (cover powder/slag, steel, refractory material) for fundamental studies performed at TUBAF (WP 2, WP3: Tasks 3.1 and 3.2) and at Aalto (WP3: Task 3.3). Steel grades were selected for theoretical examination and experimental trials particularly to increase sequence length extension (via reduction in alumina and other species which can deteriorate steel quality or cause stopper wear) and grade families which have steel cleanness problems. The steel grades
12
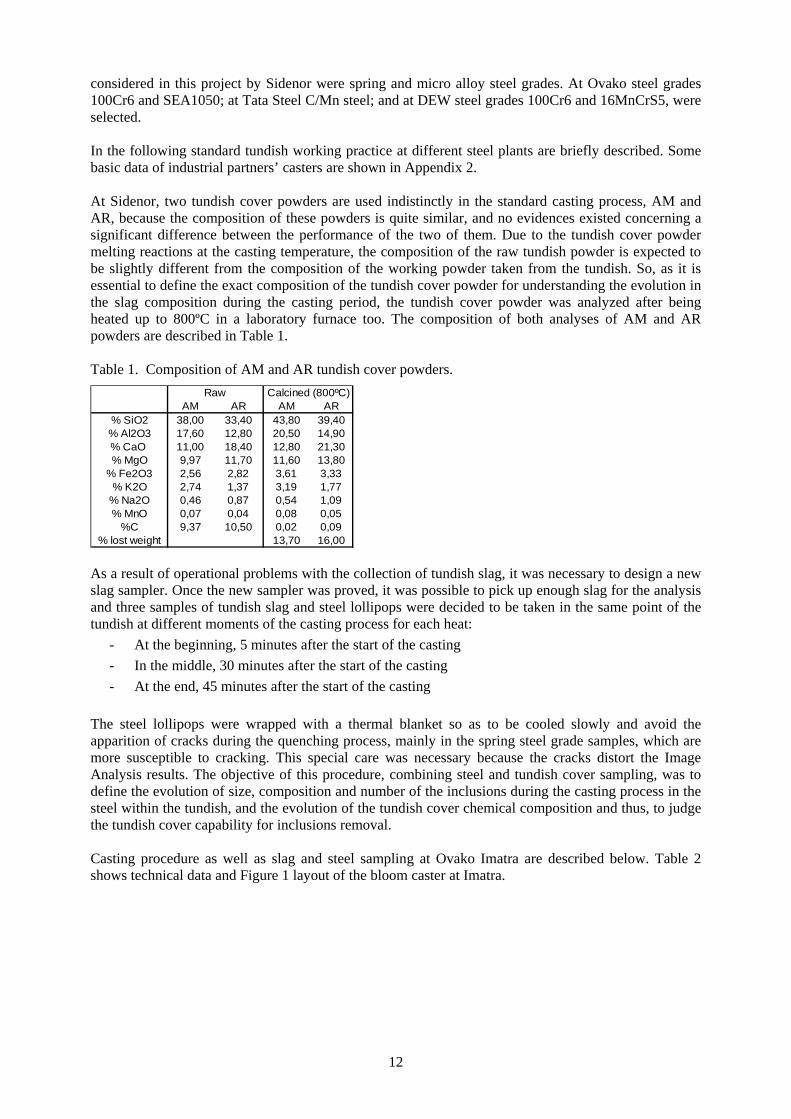
considered in this project by Sidenor were spring and micro alloy steel grades. At Ovako steel grades 100Cr6 and SEA1050; at Tata Steel C/Mn steel; and at DEW steel grades 100Cr6 and 16MnCrS5, were selected. In the following standard tundish working practice at different steel plants are briefly described. Some basic data of industrial partners’ casters are shown in Appendix 2. At Sidenor, two tundish cover powders are used indistinctly in the standard casting process, AM and AR, because the composition of these powders is quite similar, and no evidences existed concerning a significant difference between the performance of the two of them. Due to the tundish cover powder melting reactions at the casting temperature, the composition of the raw tundish powder is expected to be slightly different from the composition of the working powder taken from the tundish. So, as it is essential to define the exact composition of the tundish cover powder for understanding the evolution in the slag composition during the casting period, the tundish cover powder was analyzed after being heated up to 800ºC in a laboratory furnace too. The composition of both analyses of AM and AR powders are described in Table 1. Table 1. Composition of AM and AR tundish cover powders.
AM AR AM AR% SiO2 38,00 33,40 43,80 39,40% Al2O3 17,60 12,80 20,50 14,90% CaO 11,00 18,40 12,80 21,30% MgO 9,97 11,70 11,60 13,80
% Fe2O3 2,56 2,82 3,61 3,33% K2O 2,74 1,37 3,19 1,77
% Na2O 0,46 0,87 0,54 1,09% MnO 0,07 0,04 0,08 0,05
%C 9,37 10,50 0,02 0,09% lost weight 13,70 16,00
Raw Calcined (800ºC)
As a result of operational problems with the collection of tundish slag, it was necessary to design a new slag sampler. Once the new sampler was proved, it was possible to pick up enough slag for the analysis and three samples of tundish slag and steel lollipops were decided to be taken in the same point of the tundish at different moments of the casting process for each heat:
- At the beginning, 5 minutes after the start of the casting - In the middle, 30 minutes after the start of the casting - At the end, 45 minutes after the start of the casting
The steel lollipops were wrapped with a thermal blanket so as to be cooled slowly and avoid the apparition of cracks during the quenching process, mainly in the spring steel grade samples, which are more susceptible to cracking. This special care was necessary because the cracks distort the Image Analysis results. The objective of this procedure, combining steel and tundish cover sampling, was to define the evolution of size, composition and number of the inclusions during the casting process in the steel within the tundish, and the evolution of the tundish cover chemical composition and thus, to judge the tundish cover capability for inclusions removal. Casting procedure as well as slag and steel sampling at Ovako Imatra are described below. Table 2 shows technical data and Figure 1 layout of the bloom caster at Imatra.
13
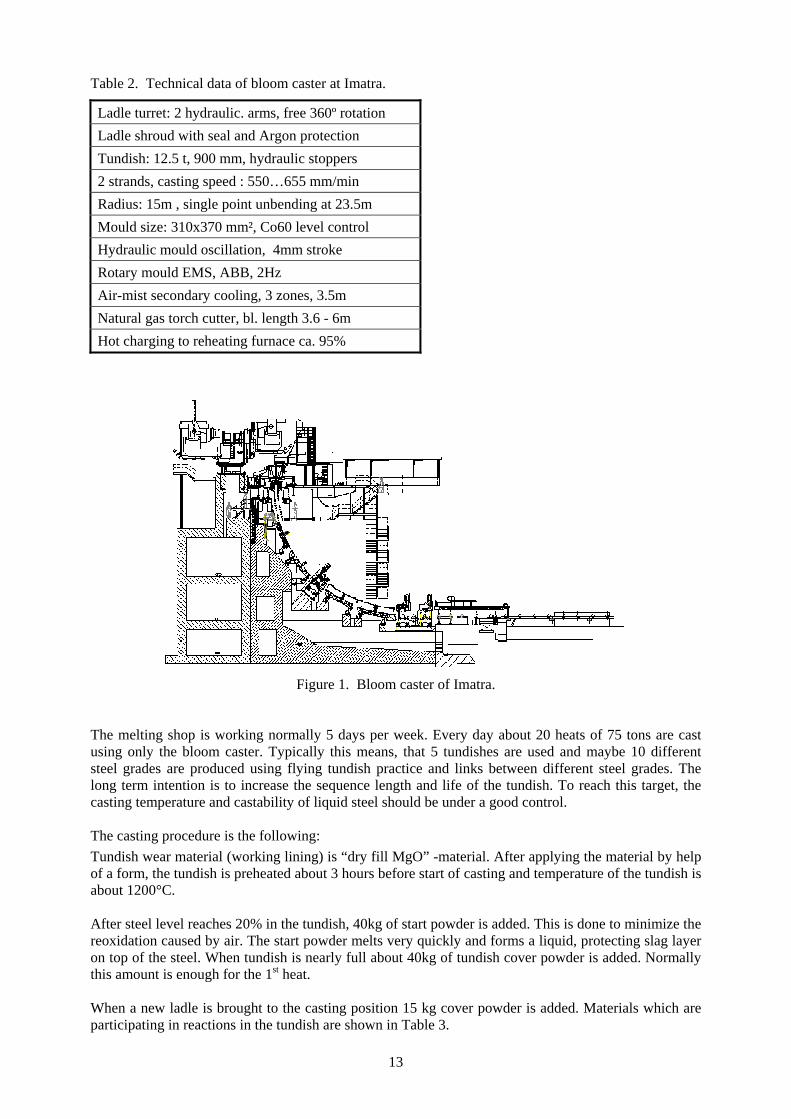
Table 2. Technical data of bloom caster at Imatra.
Ladle turret: 2 hydraulic. arms, free 360º rotation Ladle shroud with seal and Argon protection Tundish: 12.5 t, 900 mm, hydraulic stoppers 2 strands, casting speed : 550…655 mm/min Radius: 15m , single point unbending at 23.5m Mould size: 310x370 mm², Co60 level control Hydraulic mould oscillation, 4mm stroke Rotary mould EMS, ABB, 2Hz Air-mist secondary cooling, 3 zones, 3.5m Natural gas torch cutter, bl. length 3.6 - 6m Hot charging to reheating furnace ca. 95%
Figure 1. Bloom caster of Imatra.
The melting shop is working normally 5 days per week. Every day about 20 heats of 75 tons are cast using only the bloom caster. Typically this means, that 5 tundishes are used and maybe 10 different steel grades are produced using flying tundish practice and links between different steel grades. The long term intention is to increase the sequence length and life of the tundish. To reach this target, the casting temperature and castability of liquid steel should be under a good control. The casting procedure is the following: Tundish wear material (working lining) is “dry fill MgO” -material. After applying the material by help of a form, the tundish is preheated about 3 hours before start of casting and temperature of the tundish is about 1200°C. After steel level reaches 20% in the tundish, 40kg of start powder is added. This is done to minimize the reoxidation caused by air. The start powder melts very quickly and forms a liquid, protecting slag layer on top of the steel. When tundish is nearly full about 40kg of tundish cover powder is added. Normally this amount is enough for the 1st heat. When a new ladle is brought to the casting position 15 kg cover powder is added. Materials which are participating in reactions in the tundish are shown in Table 3.
14
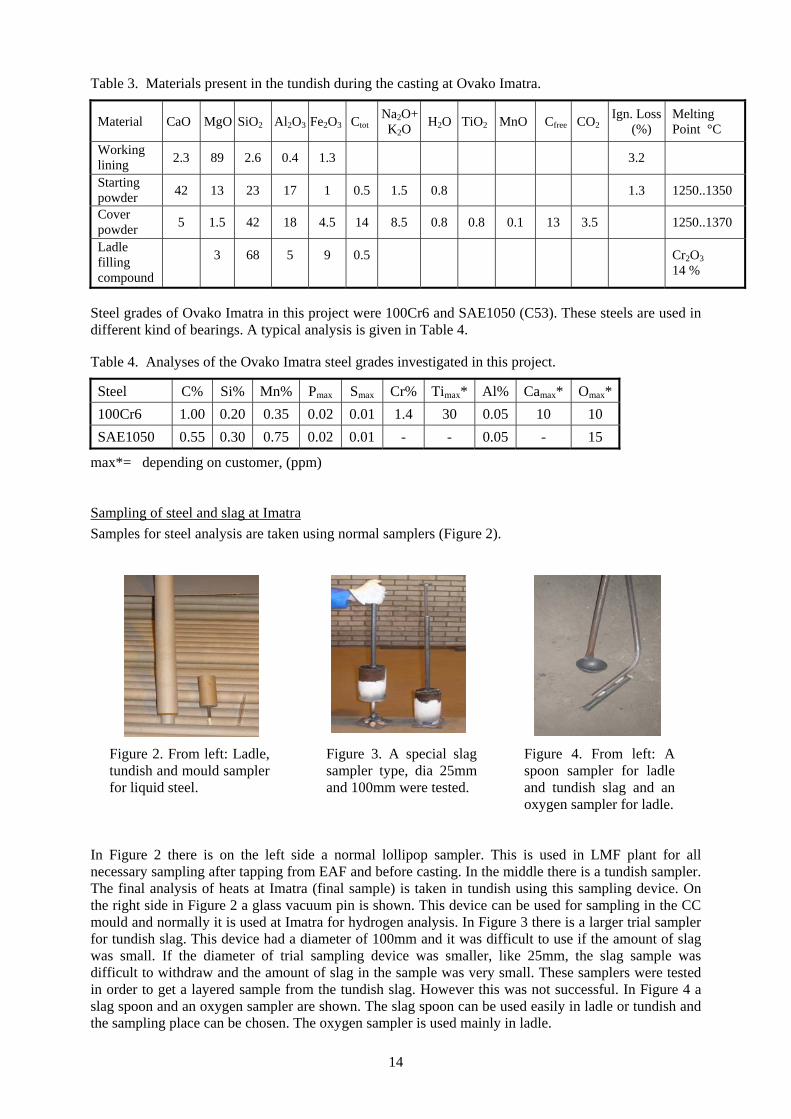
Table 3. Materials present in the tundish during the casting at Ovako Imatra.
Material CaO MgO SiO2 Al2O3 Fe2O3 Ctot Na2O+ K2O H2O TiO2 MnO Cfree CO2
Ign. Loss (%)
Melting Point °C
Working lining 2.3 89 2.6 0.4 1.3 3.2
Starting powder 42 13 23 17 1 0.5 1.5 0.8 1.3 1250..1350
Cover powder 5 1.5 42 18 4.5 14 8.5 0.8 0.8 0.1 13 3.5 1250..1370
Ladle filling compound
3 68 5 9 0.5 Cr2O3 14 %
Steel grades of Ovako Imatra in this project were 100Cr6 and SAE1050 (C53). These steels are used in different kind of bearings. A typical analysis is given in Table 4. Table 4. Analyses of the Ovako Imatra steel grades investigated in this project.
Steel C% Si% Mn% Pmax Smax Cr% Timax* Al% Camax* Omax* 100Cr6 1.00 0.20 0.35 0.02 0.01 1.4 30 0.05 10 10 SAE1050 0.55 0.30 0.75 0.02 0.01 - - 0.05 - 15
max*= depending on customer, (ppm) Sampling of steel and slag at Imatra Samples for steel analysis are taken using normal samplers (Figure 2).
Figure 2. From left: Ladle, tundish and mould sampler for liquid steel.
Figure 3. A special slag sampler type, dia 25mm and 100mm were tested.
Figure 4. From left: A spoon sampler for ladle and tundish slag and an oxygen sampler for ladle.
In Figure 2 there is on the left side a normal lollipop sampler. This is used in LMF plant for all necessary sampling after tapping from EAF and before casting. In the middle there is a tundish sampler. The final analysis of heats at Imatra (final sample) is taken in tundish using this sampling device. On the right side in Figure 2 a glass vacuum pin is shown. This device can be used for sampling in the CC mould and normally it is used at Imatra for hydrogen analysis. In Figure 3 there is a larger trial sampler for tundish slag. This device had a diameter of 100mm and it was difficult to use if the amount of slag was small. If the diameter of trial sampling device was smaller, like 25mm, the slag sample was difficult to withdraw and the amount of slag in the sample was very small. These samplers were tested in order to get a layered sample from the tundish slag. However this was not successful. In Figure 4 a slag spoon and an oxygen sampler are shown. The slag spoon can be used easily in ladle or tundish and the sampling place can be chosen. The oxygen sampler is used mainly in ladle.
15
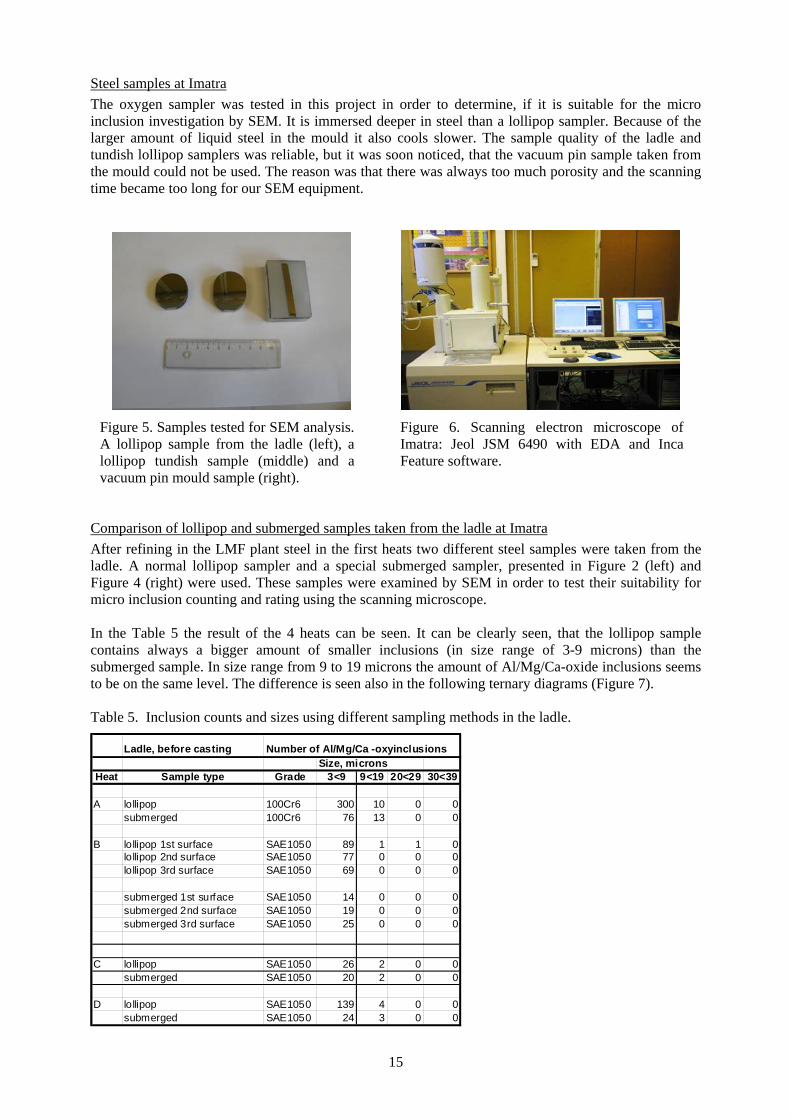
Steel samples at Imatra The oxygen sampler was tested in this project in order to determine, if it is suitable for the micro inclusion investigation by SEM. It is immersed deeper in steel than a lollipop sampler. Because of the larger amount of liquid steel in the mould it also cools slower. The sample quality of the ladle and tundish lollipop samplers was reliable, but it was soon noticed, that the vacuum pin sample taken from the mould could not be used. The reason was that there was always too much porosity and the scanning time became too long for our SEM equipment.
Figure 5. Samples tested for SEM analysis. A lollipop sample from the ladle (left), a lollipop tundish sample (middle) and a vacuum pin mould sample (right).
Figure 6. Scanning electron microscope of Imatra: Jeol JSM 6490 with EDA and Inca Feature software.
Comparison of lollipop and submerged samples taken from the ladle at Imatra After refining in the LMF plant steel in the first heats two different steel samples were taken from the ladle. A normal lollipop sampler and a special submerged sampler, presented in Figure 2 (left) and Figure 4 (right) were used. These samples were examined by SEM in order to test their suitability for micro inclusion counting and rating using the scanning microscope. In the Table 5 the result of the 4 heats can be seen. It can be clearly seen, that the lollipop sample contains always a bigger amount of smaller inclusions (in size range of 3-9 microns) than the submerged sample. In size range from 9 to 19 microns the amount of Al/Mg/Ca-oxide inclusions seems to be on the same level. The difference is seen also in the following ternary diagrams (Figure 7). Table 5. Inclusion counts and sizes using different sampling methods in the ladle.
Ladle, before casting Number of Al/Mg/Ca -oxyinclusionsSize, microns
Heat Sample type Grade 3<9 9<19 20<29 30<39
A lollipop 100Cr6 300 10 0 0submerged 100Cr6 76 13 0 0
B lollipop 1st surface SAE1050 89 1 1 0lollipop 2nd surface SAE1050 77 0 0 0lollipop 3rd surface SAE1050 69 0 0 0
submerged 1st surface SAE1050 14 0 0 0submerged 2nd surface SAE1050 19 0 0 0submerged 3rd surface SAE1050 25 0 0 0
C lollipop SAE1050 26 2 0 0submerged SAE1050 20 2 0 0
D lollipop SAE1050 139 4 0 0submerged SAE1050 24 3 0 0
16
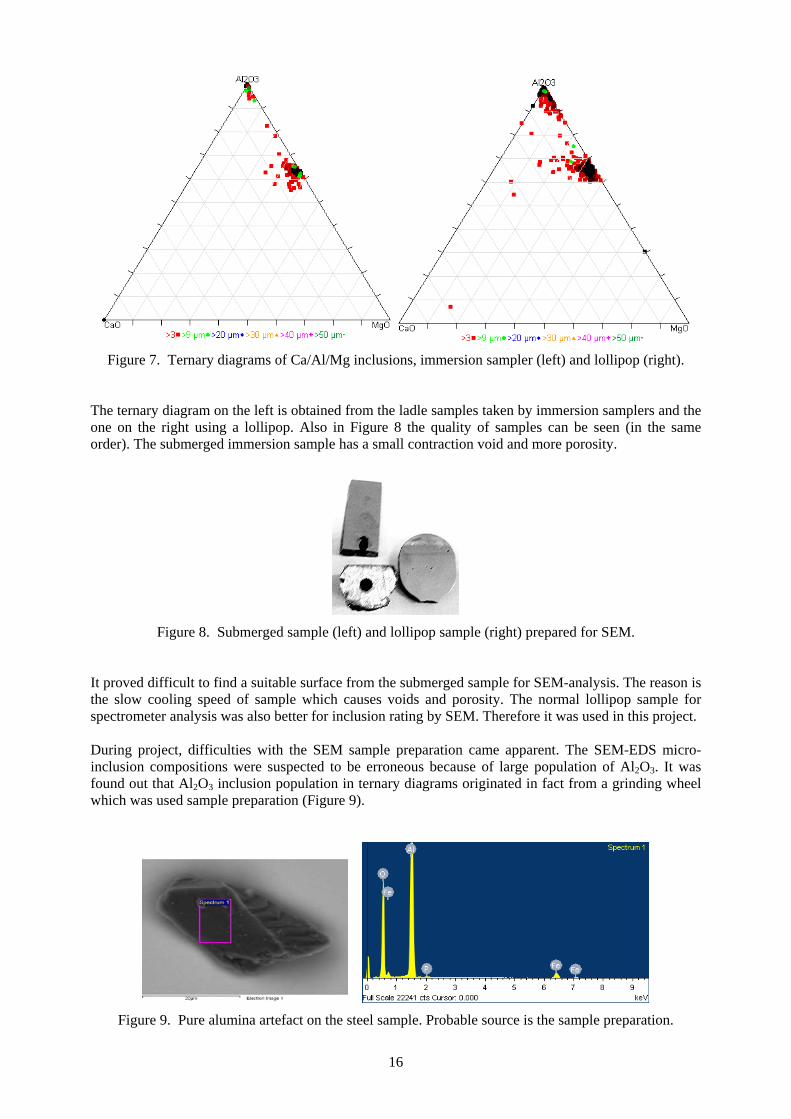
Figure 7. Ternary diagrams of Ca/Al/Mg inclusions, immersion sampler (left) and lollipop (right).
The ternary diagram on the left is obtained from the ladle samples taken by immersion samplers and the one on the right using a lollipop. Also in Figure 8 the quality of samples can be seen (in the same order). The submerged immersion sample has a small contraction void and more porosity.
Figure 8. Submerged sample (left) and lollipop sample (right) prepared for SEM.
It proved difficult to find a suitable surface from the submerged sample for SEM-analysis. The reason is the slow cooling speed of sample which causes voids and porosity. The normal lollipop sample for spectrometer analysis was also better for inclusion rating by SEM. Therefore it was used in this project. During project, difficulties with the SEM sample preparation came apparent. The SEM-EDS micro-inclusion compositions were suspected to be erroneous because of large population of Al2O3. It was found out that Al2O3 inclusion population in ternary diagrams originated in fact from a grinding wheel which was used sample preparation (Figure 9).
Figure 9. Pure alumina artefact on the steel sample. Probable source is the sample preparation.
17
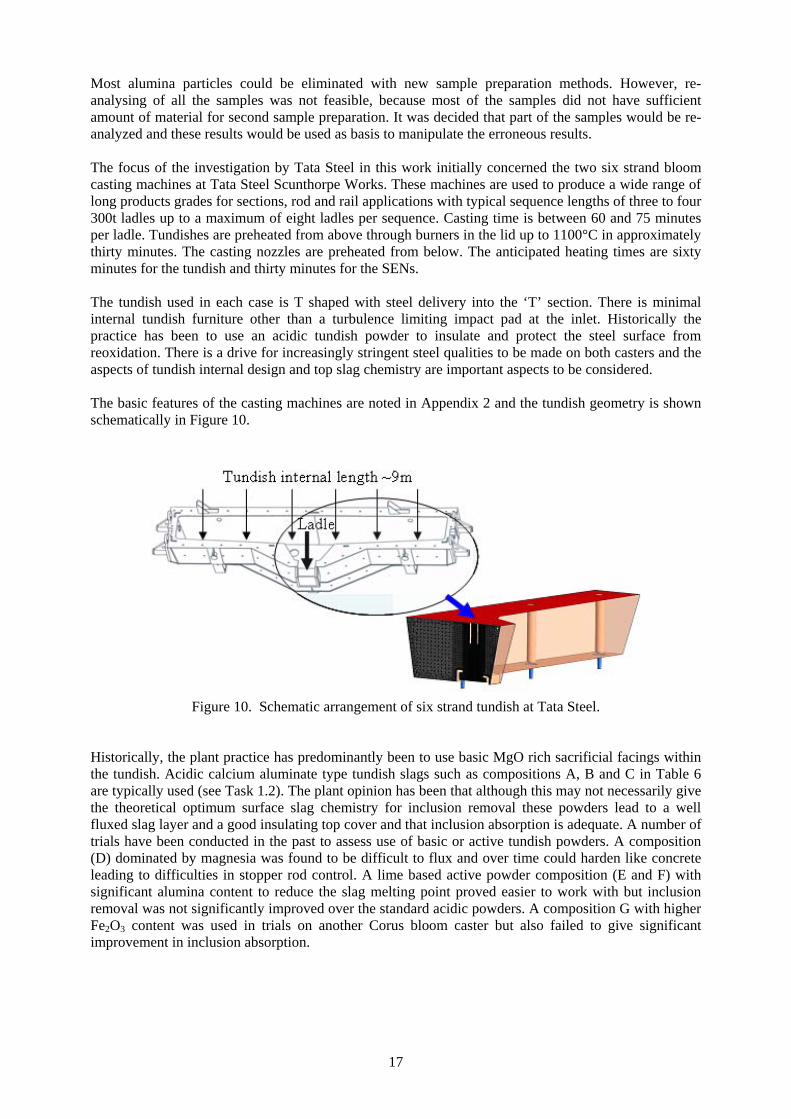
Most alumina particles could be eliminated with new sample preparation methods. However, re-analysing of all the samples was not feasible, because most of the samples did not have sufficient amount of material for second sample preparation. It was decided that part of the samples would be re-analyzed and these results would be used as basis to manipulate the erroneous results. The focus of the investigation by Tata Steel in this work initially concerned the two six strand bloom casting machines at Tata Steel Scunthorpe Works. These machines are used to produce a wide range of long products grades for sections, rod and rail applications with typical sequence lengths of three to four 300t ladles up to a maximum of eight ladles per sequence. Casting time is between 60 and 75 minutes per ladle. Tundishes are preheated from above through burners in the lid up to 1100°C in approximately thirty minutes. The casting nozzles are preheated from below. The anticipated heating times are sixty minutes for the tundish and thirty minutes for the SENs. The tundish used in each case is T shaped with steel delivery into the ‘T’ section. There is minimal internal tundish furniture other than a turbulence limiting impact pad at the inlet. Historically the practice has been to use an acidic tundish powder to insulate and protect the steel surface from reoxidation. There is a drive for increasingly stringent steel qualities to be made on both casters and the aspects of tundish internal design and top slag chemistry are important aspects to be considered. The basic features of the casting machines are noted in Appendix 2 and the tundish geometry is shown schematically in Figure 10.
Figure 10. Schematic arrangement of six strand tundish at Tata Steel.
Historically, the plant practice has predominantly been to use basic MgO rich sacrificial facings within the tundish. Acidic calcium aluminate type tundish slags such as compositions A, B and C in Table 6 are typically used (see Task 1.2). The plant opinion has been that although this may not necessarily give the theoretical optimum surface slag chemistry for inclusion removal these powders lead to a well fluxed slag layer and a good insulating top cover and that inclusion absorption is adequate. A number of trials have been conducted in the past to assess use of basic or active tundish powders. A composition (D) dominated by magnesia was found to be difficult to flux and over time could harden like concrete leading to difficulties in stopper rod control. A lime based active powder composition (E and F) with significant alumina content to reduce the slag melting point proved easier to work with but inclusion removal was not significantly improved over the standard acidic powders. A composition G with higher Fe2O3 content was used in trials on another Corus bloom caster but also failed to give significant improvement in inclusion absorption.
18
Table 6. Compositions of main components in some tundish powders tested at Tata Steel.
A B C D E F G Al2O3 35 32 34 7.5 18 43 21 SiO2 47 45 42 20 3 2 37 Fe2O3 1 2.5 1.5 5 0.5 1 7.5 TiO2 1 1 0.6 0.5 - 1.5 - CaO 0.2 0.5 0.1 4 60 52 2 MgO 0.5 0.5 0.2 50 12 1 1 K2O & Na2O 1.5 1.5 1 1.7 0.5 - 9 Ignition loss 18 22 21 13 9 - 18
The latter observations may indicate that the controlling influence lies with transport of the inclusions to the melt surface rather than the wetting characteristics of the slag and its ability to absorb them. At Tata Steel there is significant interest in optimising these aspects of tundish design as well as the tundish cover chemistry. One of the options that the production plant would like to investigate is the effect of tundish ‘furniture’ and/or argon bubbling to encourage the rise of inclusions to the surface for capture by an optimised slag. However the argon bubbling scheme in particular requires significant modification of the tundishes and a capital spending commitment which is being held up at a higher level of management. Table 7. Tundish slags and refactory materials used at Tata Steel.
Slags Stelcover 52C Stelcover 5S Vesuvius TP112R Tuncast 270/1 Monolite T87-70 C added 2 9.7 - - - Fe oxides 3.3 2.2 1.4 4.4 4.6 CaO 0.1 0.1 0.1 0.6 1 SiO2 44.4 40.9 32 24 23.5 MgO 0.3 0.35 0.2 70 69.5 Al2O3 32.7 30.2 33.5 - 1.5 S 0.15 1.5 - - - TiO2 0.8 0.6 0.6 - -
Task 1.2 Identification of production tundish cover practice with best cleanness
results The objective of this task was to identify production tundish cover practise with best cleanness results. At Sinenor two different steel grades were selected for being studied in this project: spring as clean steel grade; and microalloy, with more inclusions dissolved in it. Samples of spring and microalloy steel sequences cast with both standard (AM or AR) tundish cover powders were collected so as to compare the results of the cleanness and be able to identify the best tundish cover practice. Nine industrial trials were done with the standard powders, six with the AM powder and three with the AR. The cleanness of the tundish lollipops was analysed by 3 different and complementary methods:
- Pulse Discrimination Analysis - Optical Emission Spectroscopy, PDA-OES: number and rough chemical composition of the inclusions
- Image Analysis: number and size of inclusions (distribution) - Electronic Microscopy, SEM-SFEG (Scanning Electron Microscope - Scan Field Emission Gun):
chemical composition and size of the inclusions A brief description of the results obtained with the different analysis techniques is shown next.
19
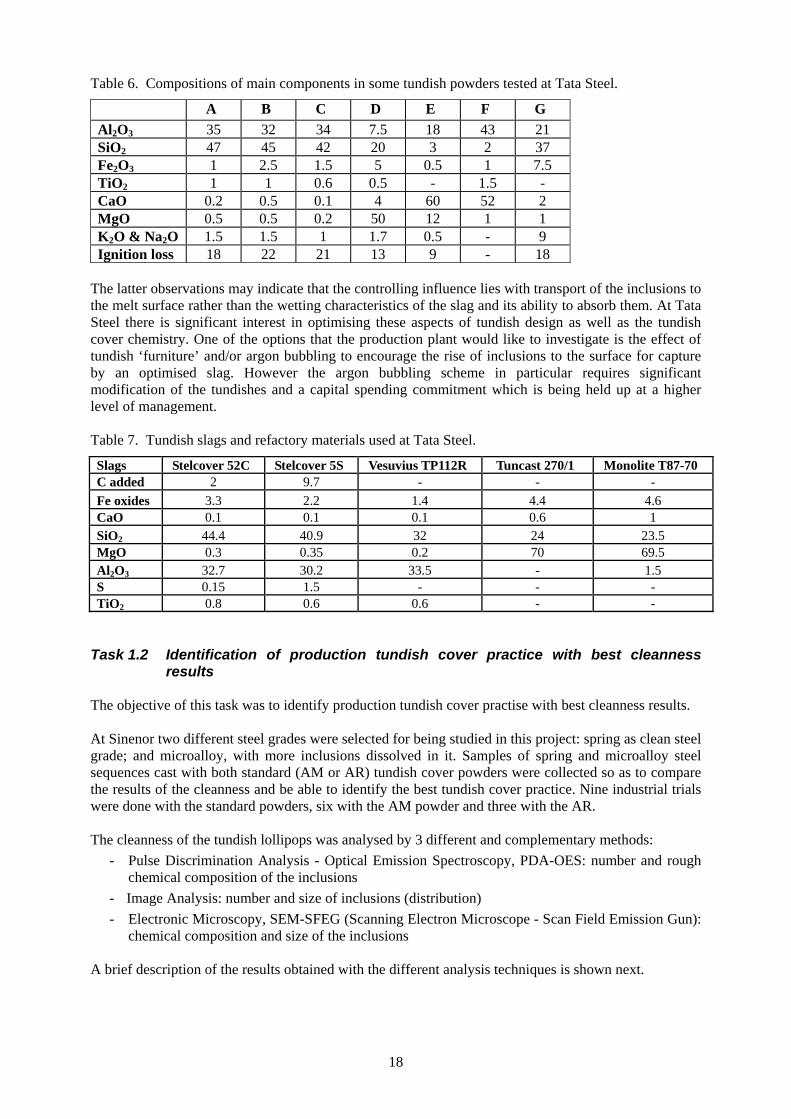
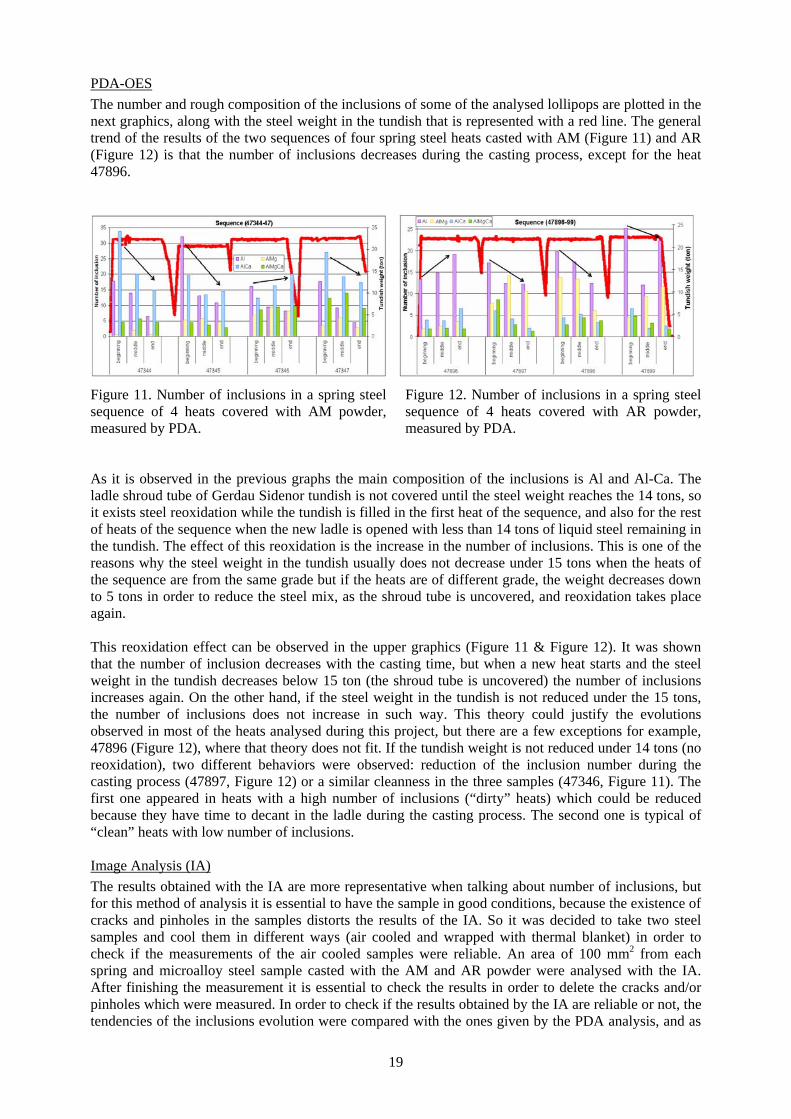
PDA-OES The number and rough composition of the inclusions of some of the analysed lollipops are plotted in the next graphics, along with the steel weight in the tundish that is represented with a red line. The general trend of the results of the two sequences of four spring steel heats casted with AM (Figure 11) and AR (Figure 12) is that the number of inclusions decreases during the casting process, except for the heat 47896.
Figure 11. Number of inclusions in a spring steel sequence of 4 heats covered with AM powder, measured by PDA.
Figure 12. Number of inclusions in a spring steel sequence of 4 heats covered with AR powder, measured by PDA.
As it is observed in the previous graphs the main composition of the inclusions is Al and Al-Ca. The ladle shroud tube of Gerdau Sidenor tundish is not covered until the steel weight reaches the 14 tons, so it exists steel reoxidation while the tundish is filled in the first heat of the sequence, and also for the rest of heats of the sequence when the new ladle is opened with less than 14 tons of liquid steel remaining in the tundish. The effect of this reoxidation is the increase in the number of inclusions. This is one of the reasons why the steel weight in the tundish usually does not decrease under 15 tons when the heats of the sequence are from the same grade but if the heats are of different grade, the weight decreases down to 5 tons in order to reduce the steel mix, as the shroud tube is uncovered, and reoxidation takes place again. This reoxidation effect can be observed in the upper graphics (Figure 11 & Figure 12). It was shown that the number of inclusion decreases with the casting time, but when a new heat starts and the steel weight in the tundish decreases below 15 ton (the shroud tube is uncovered) the number of inclusions increases again. On the other hand, if the steel weight in the tundish is not reduced under the 15 tons, the number of inclusions does not increase in such way. This theory could justify the evolutions observed in most of the heats analysed during this project, but there are a few exceptions for example, 47896 (Figure 12), where that theory does not fit. If the tundish weight is not reduced under 14 tons (no reoxidation), two different behaviors were observed: reduction of the inclusion number during the casting process (47897, Figure 12) or a similar cleanness in the three samples (47346, Figure 11). The first one appeared in heats with a high number of inclusions (“dirty” heats) which could be reduced because they have time to decant in the ladle during the casting process. The second one is typical of “clean” heats with low number of inclusions. Image Analysis (IA) The results obtained with the IA are more representative when talking about number of inclusions, but for this method of analysis it is essential to have the sample in good conditions, because the existence of cracks and pinholes in the samples distorts the results of the IA. So it was decided to take two steel samples and cool them in different ways (air cooled and wrapped with thermal blanket) in order to check if the measurements of the air cooled samples were reliable. An area of 100 mm2 from each spring and microalloy steel sample casted with the AM and AR powder were analysed with the IA. After finishing the measurement it is essential to check the results in order to delete the cracks and/or pinholes which were measured. In order to check if the results obtained by the IA are reliable or not, the tendencies of the inclusions evolution were compared with the ones given by the PDA analysis, and as
20
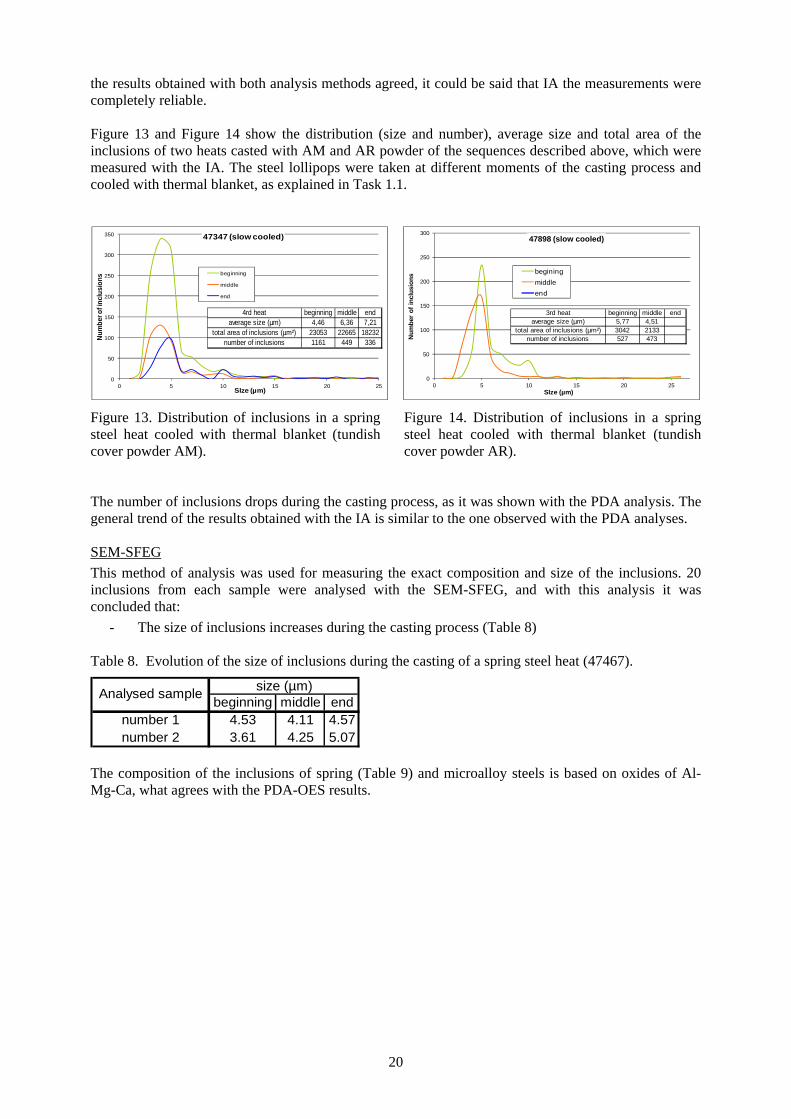
the results obtained with both analysis methods agreed, it could be said that IA the measurements were completely reliable. Figure 13 and Figure 14 show the distribution (size and number), average size and total area of the inclusions of two heats casted with AM and AR powder of the sequences described above, which were measured with the IA. The steel lollipops were taken at different moments of the casting process and cooled with thermal blanket, as explained in Task 1.1.
0
50
100
150
200
250
300
350
0 5 10 15 20 25
Num
ber o
f inc
lusi
ons
SIze (µm)
47347 (slow cooled)
beginning
middle
end
4rd heat beginning middle endaverage size (µm) 4,46 6,36 7,21
total area of inclusions (µm²) 23053 22665 18232number of inclusions 1161 449 336
0
50
100
150
200
250
300
0 5 10 15 20 25
Num
ber
of in
clus
ions
SIze (µm)
47898 (slow cooled)
beginingmiddleend
3rd heat beginning middle endaverage size (µm) 5,77 4,51
total area of inclusions (µm²) 3042 2133number of inclusions 527 473
Figure 13. Distribution of inclusions in a spring steel heat cooled with thermal blanket (tundish cover powder AM).
Figure 14. Distribution of inclusions in a spring steel heat cooled with thermal blanket (tundish cover powder AR).
The number of inclusions drops during the casting process, as it was shown with the PDA analysis. The general trend of the results obtained with the IA is similar to the one observed with the PDA analyses. SEM-SFEG This method of analysis was used for measuring the exact composition and size of the inclusions. 20 inclusions from each sample were analysed with the SEM-SFEG, and with this analysis it was concluded that: - The size of inclusions increases during the casting process (Table 8) Table 8. Evolution of the size of inclusions during the casting of a spring steel heat (47467).
beginning middle endnumber 1 4.53 4.11 4.57number 2 3.61 4.25 5.07
size (µm)Analysed sample
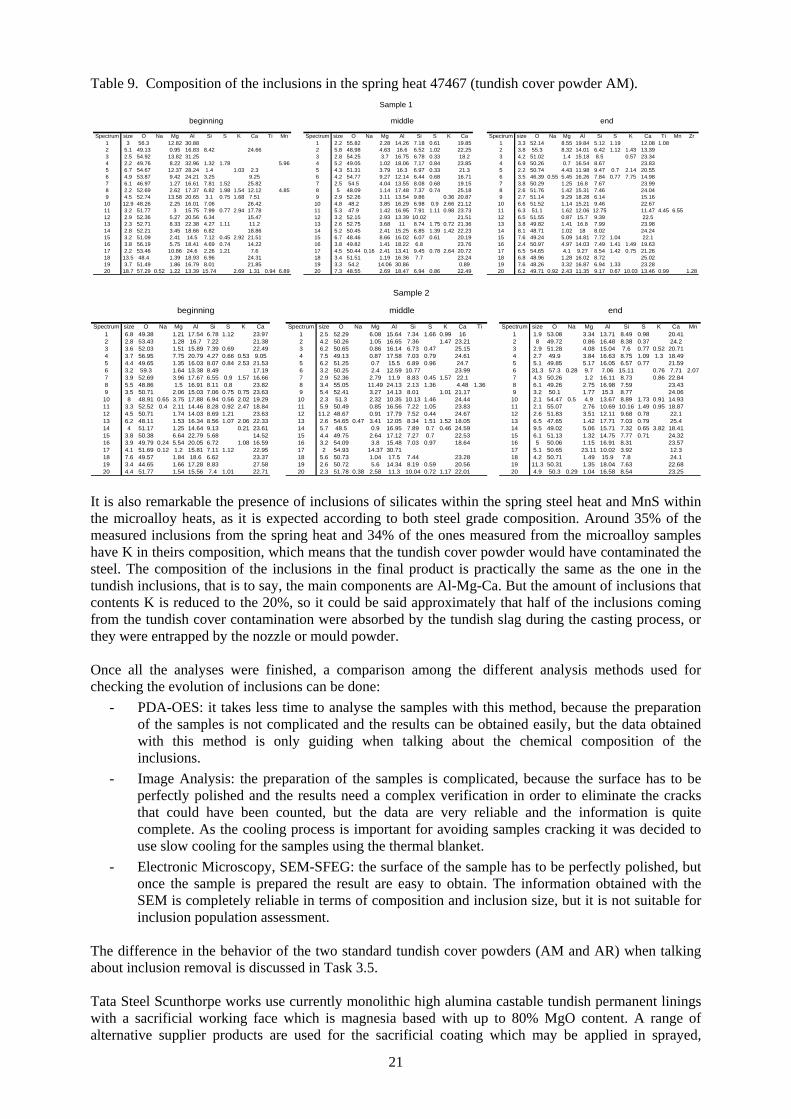
The composition of the inclusions of spring (Table 9) and microalloy steels is based on oxides of Al-Mg-Ca, what agrees with the PDA-OES results.
21
Table 9. Composition of the inclusions in the spring heat 47467 (tundish cover powder AM).
Spectrum size O Na Mg Al Si S K Ca Ti Mn Spectrum size O Na Mg Al Si S K Ca Spectrum size O Na Mg Al Si S K Ca Ti Mn Zr1 3 56.3 12.82 30.88 1 2.2 55.82 2.28 14.26 7.18 0.61 19.85 1 3.3 52.14 8.55 19.84 5.12 1.19 12.08 1.082 5.1 49.13 0.95 16.83 8.42 24.66 2 5.8 48.98 4.63 16.6 6.52 1.02 22.25 2 3.8 55.3 8.32 14.01 6.42 1.12 1.43 13.393 2.5 54.92 13.82 31.25 3 2.8 54.25 3.7 16.75 6.78 0.33 18.2 3 4.2 51.02 1.4 15.18 8.5 0.57 23.344 2.2 49.76 8.22 32.96 1.32 1.78 5.96 4 5.2 49.05 1.02 18.06 7.17 0.84 23.85 4 6.9 50.26 0.7 16.54 8.67 23.835 6.7 54.67 12.37 28.24 1.4 1.03 2.3 5 4.3 51.31 3.79 16.3 6.97 0.33 21.3 5 2.2 50.74 4.43 11.98 9.47 0.7 2.14 20.556 4.9 53.87 9.42 24.21 3.25 9.25 6 4.2 54.77 9.27 12.14 6.44 0.68 16.71 6 3.5 46.39 0.55 5.45 16.26 7.84 0.77 7.75 14.987 6.1 46.97 1.27 16.61 7.81 1.52 25.82 7 2.5 54.5 4.04 13.55 8.08 0.68 19.15 7 3.8 50.29 1.25 16.8 7.67 23.998 2.2 52.69 2.62 17.37 6.82 1.98 1.54 12.12 4.85 8 5 48.09 1.14 17.48 7.37 0.74 25.18 8 2.6 51.76 1.42 15.31 7.46 24.049 4.5 52.74 13.58 20.65 3.1 0.75 1.68 7.51 9 2.9 52.26 3.11 13.54 9.86 0.36 20.87 9 2.7 51.14 9.29 18.28 6.14 15.1610 12.9 48.26 2.25 16.01 7.06 26.42 10 4.8 48.2 3.85 16.29 6.98 0.9 2.66 21.12 10 6.6 51.52 1.14 15.21 9.46 22.6711 3.2 51.77 3 15.75 7.99 0.77 2.94 17.78 11 5.3 47.9 1.42 16.95 7.91 1.11 0.98 23.73 11 6.3 51.1 1.62 12.06 12.75 11.47 4.45 6.5512 2.9 52.36 5.27 20.56 6.34 15.47 12 3.2 52.15 2.93 13.39 10.02 21.51 12 6.5 51.55 0.87 15.7 9.39 22.513 2.3 52.71 8.33 22.38 4.27 1.11 11.2 13 2.6 52.75 3.68 11 8.74 1.75 0.72 21.36 13 3.8 49.82 1.41 16.8 7.99 23.9814 2.8 52.21 3.45 18.66 6.82 18.86 14 5.2 50.45 2.41 15.25 6.85 1.39 1.42 22.23 14 8.1 48.71 1.02 18 8.02 24.2415 3.2 51.09 2.41 14.5 7.12 0.45 2.92 21.51 15 6.7 48.46 8.66 16.02 6.07 0.61 20.19 15 7.6 49.24 5.09 14.81 7.72 1.04 22.116 3.8 56.19 5.75 18.41 4.69 0.74 14.22 16 3.8 49.82 1.41 18.22 6.8 23.76 16 2.4 50.97 4.97 14.03 7.49 1.41 1.49 19.6317 2.2 53.46 10.86 24.6 2.26 1.21 7.6 17 4.5 50.44 0.16 2.41 13.41 9.45 0.78 2.64 20.72 17 6.5 54.65 4.1 9.27 8.54 1.42 0.75 21.2618 13.5 48.4 1.39 18.93 6.96 24.31 18 3.4 51.51 1.19 16.36 7.7 23.24 18 6.8 48.96 1.28 16.02 8.72 25.0219 3.7 51.49 1.86 16.79 8.01 21.85 19 3.3 54.2 14.06 30.86 0.89 19 7.6 48.26 3.32 16.87 6.94 1.33 23.2820 18.7 57.29 0.52 1.22 13.39 15.74 2.69 1.31 0.94 6.89 20 7.3 48.55 2.69 18.47 6.94 0.86 22.49 20 6.2 49.71 0.92 2.43 11.35 9.17 0.67 10.03 13.46 0.99 1.28
Sample 1
middlebeginning end
Spectrum size O Na Mg Al Si S K Ca Spectrum size O Na Mg Al Si S K Ca Ti Spectrum size O Na Mg Al Si S K Ca Mn1 6.8 49.38 1.21 17.54 6.78 1.12 23.97 1 2.5 52.29 6.08 15.64 7.34 1.66 0.99 16 1 1.9 53.08 3.34 13.71 8.49 0.98 20.412 2.8 53.43 1.28 16.7 7.22 21.38 2 4.2 50.26 1.05 16.65 7.36 1.47 23.21 2 8 49.72 0.86 16.48 8.38 0.37 24.23 3.6 52.03 1.51 15.89 7.39 0.69 22.49 3 6.2 50.65 0.86 16.14 6.73 0.47 25.15 3 2.9 51.28 4.08 15.04 7.6 0.77 0.52 20.714 3.7 56.95 7.75 20.79 4.27 0.66 0.53 9.05 4 7.5 49.13 0.87 17.58 7.03 0.79 24.61 4 2.7 49.9 3.84 16.63 8.75 1.09 1.3 18.495 4.4 49.65 1.35 16.03 8.07 0.84 2.53 21.53 5 6.2 51.25 0.7 15.5 6.89 0.96 24.7 5 5.1 49.85 5.17 16.05 6.57 0.77 21.596 3.2 59.3 1.64 13.38 8.49 17.19 6 3.2 50.25 2.4 12.59 10.77 23.99 6 31.3 57.3 0.28 9.7 7.06 15.11 0.76 7.71 2.077 3.9 52.69 3.96 17.67 6.55 0.9 1.57 16.66 7 2.9 52.36 2.79 11.9 8.83 0.45 1.57 22.1 7 4.3 50.26 1.2 16.11 8.73 0.86 22.848 5.5 48.86 1.5 16.91 8.11 0.8 23.82 8 3.4 55.05 11.49 24.13 2.13 1.36 4.48 1.36 8 6.1 49.26 2.75 16.98 7.59 23.439 3.5 50.71 2.06 15.03 7.06 0.75 0.75 23.63 9 5.4 52.41 3.27 14.13 8.01 1.01 21.17 9 3.2 50.1 1.77 15.3 8.77 24.0610 8 48.91 0.65 3.75 17.88 6.94 0.56 2.02 19.29 10 2.3 51.3 2.32 10.35 10.13 1.46 24.44 10 2.1 54.47 0.5 4.9 13.67 8.89 1.73 0.91 14.9311 3.3 52.52 0.4 2.11 14.46 8.28 0.92 2.47 18.84 11 5.9 50.49 0.85 16.56 7.22 1.05 23.83 11 2.1 55.07 2.76 10.69 10.16 1.49 0.95 18.8712 4.5 50.71 1.74 14.03 8.69 1.21 23.63 12 11.2 48.67 0.91 17.79 7.52 0.44 24.67 12 2.6 51.83 3.51 12.11 9.68 0.78 22.113 6.2 48.11 1.53 16.34 8.56 1.07 2.06 22.33 13 2.6 54.65 0.47 3.41 12.05 8.34 1.51 1.52 18.05 13 6.5 47.65 1.42 17.71 7.03 0.79 25.414 4 51.17 1.25 14.64 9.13 0.21 23.61 14 5.7 48.5 0.9 16.95 7.89 0.7 0.46 24.59 14 9.5 49.02 5.06 15.71 7.32 0.65 3.82 18.4115 3.8 50.38 6.64 22.79 5.68 14.52 15 4.4 49.75 2.64 17.12 7.27 0.7 22.53 15 6.1 51.13 1.32 14.75 7.77 0.71 24.3216 3.9 49.79 0.24 5.54 20.05 6.72 1.08 16.59 16 3.2 54.09 3.8 15.48 7.03 0.97 18.64 16 5 50.06 1.15 16.91 8.31 23.5717 4.1 51.69 0.12 1.2 15.81 7.11 1.12 22.95 17 2 54.93 14.37 30.71 17 5.1 50.65 23.11 10.02 3.92 12.318 7.6 49.57 1.84 18.6 6.62 23.37 18 5.6 50.73 1.04 17.5 7.44 23.28 18 4.2 50.71 1.49 15.9 7.8 24.119 3.4 44.65 1.66 17.28 8.83 27.58 19 2.6 50.72 5.6 14.34 8.19 0.59 20.56 19 11.3 50.31 1.35 18.04 7.63 22.6820 4.4 51.77 1.54 15.56 7.4 1.01 22.71 20 2.3 51.78 0.38 2.58 11.3 10.04 0.72 1.17 22.01 20 4.9 50.3 0.29 1.04 16.58 8.54 23.25
Sample 2
endmiddlebeginning
It is also remarkable the presence of inclusions of silicates within the spring steel heat and MnS within the microalloy heats, as it is expected according to both steel grade composition. Around 35% of the measured inclusions from the spring heat and 34% of the ones measured from the microalloy samples have K in theirs composition, which means that the tundish cover powder would have contaminated the steel. The composition of the inclusions in the final product is practically the same as the one in the tundish inclusions, that is to say, the main components are Al-Mg-Ca. But the amount of inclusions that contents K is reduced to the 20%, so it could be said approximately that half of the inclusions coming from the tundish cover contamination were absorbed by the tundish slag during the casting process, or they were entrapped by the nozzle or mould powder. Once all the analyses were finished, a comparison among the different analysis methods used for checking the evolution of inclusions can be done:
- PDA-OES: it takes less time to analyse the samples with this method, because the preparation of the samples is not complicated and the results can be obtained easily, but the data obtained with this method is only guiding when talking about the chemical composition of the inclusions.
- Image Analysis: the preparation of the samples is complicated, because the surface has to be perfectly polished and the results need a complex verification in order to eliminate the cracks that could have been counted, but the data are very reliable and the information is quite complete. As the cooling process is important for avoiding samples cracking it was decided to use slow cooling for the samples using the thermal blanket.
- Electronic Microscopy, SEM-SFEG: the surface of the sample has to be perfectly polished, but once the sample is prepared the result are easy to obtain. The information obtained with the SEM is completely reliable in terms of composition and inclusion size, but it is not suitable for inclusion population assessment.
The difference in the behavior of the two standard tundish cover powders (AM and AR) when talking about inclusion removal is discussed in Task 3.5. Tata Steel Scunthorpe works use currently monolithic high alumina castable tundish permanent linings with a sacrificial working face which is magnesia based with up to 80% MgO content. A range of alternative supplier products are used for the sacrificial coating which may be applied in sprayed,
22
trowelled or dry vibratable (heat cured) form. Samples of all the materials have been tested and the results are show in Table 13. In addition to variations in CaO/SiO2 ratio there are also mineralogical differences in the form of the MgO (magnesite or olivine) which can affect the sintering properties. Three tundish cover powders (A, B and C) are used currently and are all of an ‘acidic’ alumino silicate type with virtually no free lime but with a carbon content of up to 10% which helps to promote fluxing at the surface and to control the atmosphere and rate of reoxidation through the sintered and unreacted surface layers. Mineralogically these materials are derived form clays. The tundish cover powder is added at the start of casting (~20 x 5kg bags) around the ladle shroud and towards each end of the tundish. A second addition is made midway through the first ladle cast (after approximately 30 minutes). Further powder additions are made at the start of each subsequent ladle in the sequence. The aim is for ‘black’ powder practice with a total thickness of ~50mm which includes a slag layer of 5mm to 25mm supporting a sintered layer and un-fused powder. A number of layers can be found within the powder represented schematically as: Gas atmosphere Unreacted tundish powder Sintered tundish powder (not always evident) Liquid slag + sintered tundish powder Liquid slag Liquid slag / steel interface Liquid steel
Based on past experience described in Task 1.1 plant opinion is that although more basic powders may have a theoretically better capacity for inclusion absorption, this can be out-weighed by negative aspects associated with higher viscosity. Also, phenomena controlling transport of inclusions to the surface may be equally or perhaps more important than the slag itself. In the case of the Scunthorpe bloom tundishes, apart from the turbulence reducing impact pad under the ladle shroud bloom tundishes there is no internal furniture such as dams and weirs to encourage inclusion floatation and this is one further area of interest to study for this plant. A data gathering exercise was undertaken involving plant data and some pilot scale work. This was to attempt to determine the compositional changes within the slag over time and to relate these to inclusion assimilation. Initial results based on bulk chemical analysis from plant samples appeared very confused with no clear patterns emerging. There was evidence of increasing levels of manganese, silicon, aluminium and calcium oxides in the slag bulk which increase by between 10 and 20% over a three ladle sequence. Further sampling regimes were conducted throughout the project and their results are shown in Appendix 20. Although in the past there was an Amepa slag detection system in use, this was not being used when the data collection took place. So slag detection from ladle to tundish is done by eye, and this can lead to significant amounts of slag carryover. This can lead to large variation in the chemistry of the tundish slag. There are plans to re-instate the Amepa system in a limited trial in 2012. As data gathering from the plant was slow and very varied, small scale tests were run to examine changes in the slag. On the pilot plant scale tests were carried out using a 300kg induction furnace with a high carbon silicon killed steel of nominal composition:
C 0.9%, Si 0.5%, Mn 0.6% Liquidus 1461ºC
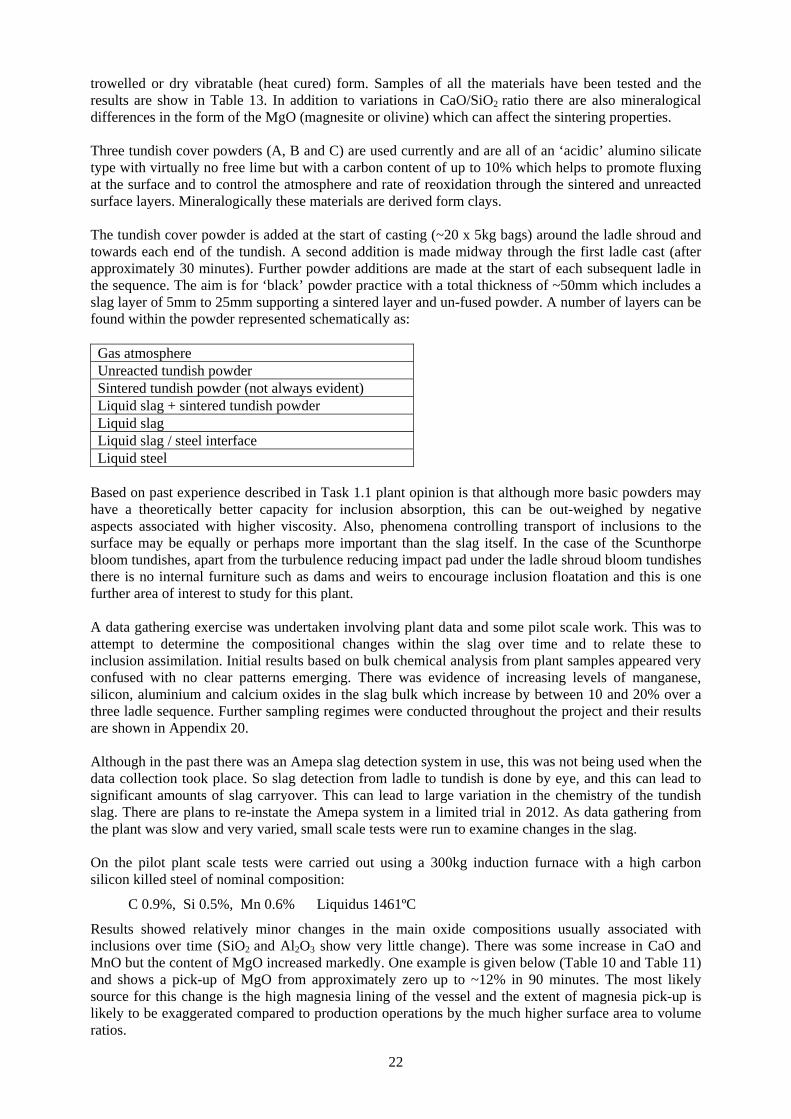
Results showed relatively minor changes in the main oxide compositions usually associated with inclusions over time (SiO2 and Al2O3 show very little change). There was some increase in CaO and MnO but the content of MgO increased markedly. One example is given below (Table 10 and Table 11) and shows a pick-up of MgO from approximately zero up to ~12% in 90 minutes. The most likely source for this change is the high magnesia lining of the vessel and the extent of magnesia pick-up is likely to be exaggerated compared to production operations by the much higher surface area to volume ratios.
23
Table 10. Sample after powder addition.
Fe2O3 CaO SiO2 MgO Al2O3 P2O5 MnO S K2O V2O5 TiO2 Na2O Cr2O3 ZrO2 C 1.70 0.12 42.92 0.16 31.40 0.19 0.01 0.18 0.71 0.00 0.7 0.11 0.01 0.03 8.84
Loss on ignition: 21.07 % Table 11. Sample after 90 minutes.
Fe2O3 CaO SiO2 MgO Al2O3 P2O5 MnO S K2O V2O5 TiO2 Na2O Cr2O3 ZrO2 C 3.20 4.11 41.15 12.00 32.70 0.135 4.26 0.07 0.65 0.00 0.68 0.15 0.01 0.01 0.027
Loss on ignition: 0.08 % Larger scale trials on two principal steel chemistries were also carried out (Table 12). Table 12. Aim chemistries used in Tata Steel pilot tundish trials.
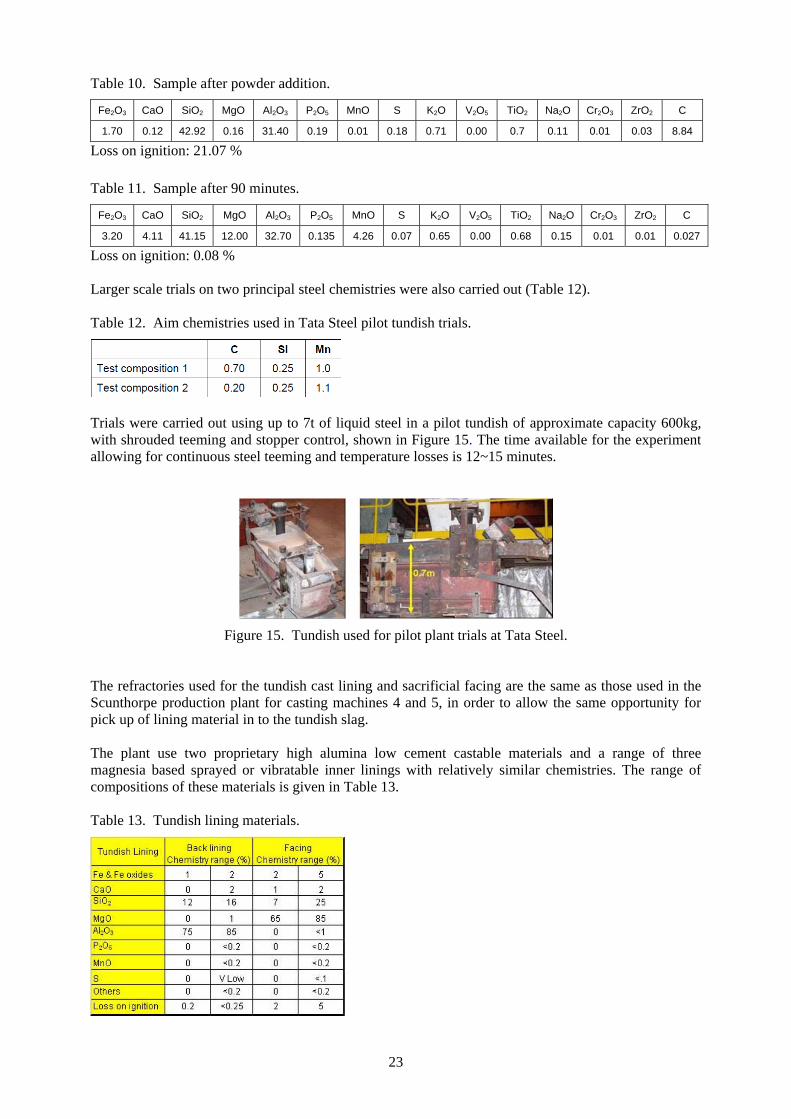
Trials were carried out using up to 7t of liquid steel in a pilot tundish of approximate capacity 600kg, with shrouded teeming and stopper control, shown in Figure 15. The time available for the experiment allowing for continuous steel teeming and temperature losses is 12~15 minutes.
Figure 15. Tundish used for pilot plant trials at Tata Steel.
The refractories used for the tundish cast lining and sacrificial facing are the same as those used in the Scunthorpe production plant for casting machines 4 and 5, in order to allow the same opportunity for pick up of lining material in to the tundish slag. The plant use two proprietary high alumina low cement castable materials and a range of three magnesia based sprayed or vibratable inner linings with relatively similar chemistries. The range of compositions of these materials is given in Table 13. Table 13. Tundish lining materials.
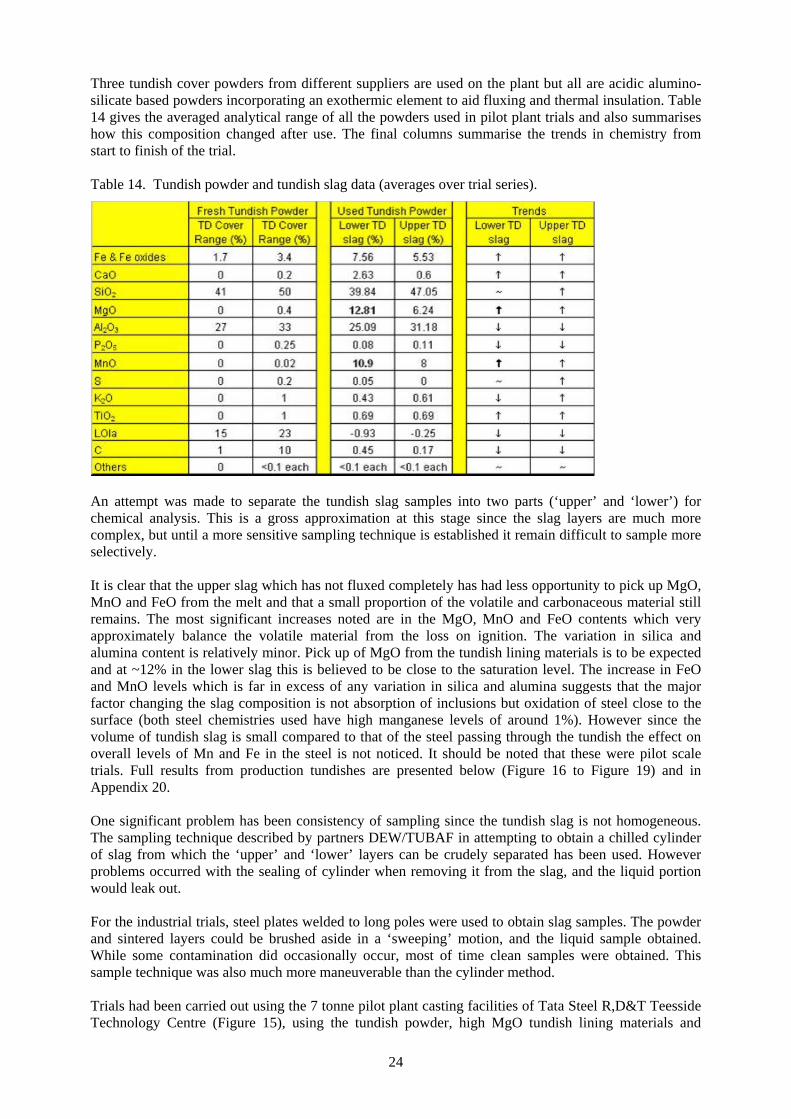
24
Three tundish cover powders from different suppliers are used on the plant but all are acidic alumino-silicate based powders incorporating an exothermic element to aid fluxing and thermal insulation. Table 14 gives the averaged analytical range of all the powders used in pilot plant trials and also summarises how this composition changed after use. The final columns summarise the trends in chemistry from start to finish of the trial. Table 14. Tundish powder and tundish slag data (averages over trial series).
An attempt was made to separate the tundish slag samples into two parts (‘upper’ and ‘lower’) for chemical analysis. This is a gross approximation at this stage since the slag layers are much more complex, but until a more sensitive sampling technique is established it remain difficult to sample more selectively. It is clear that the upper slag which has not fluxed completely has had less opportunity to pick up MgO, MnO and FeO from the melt and that a small proportion of the volatile and carbonaceous material still remains. The most significant increases noted are in the MgO, MnO and FeO contents which very approximately balance the volatile material from the loss on ignition. The variation in silica and alumina content is relatively minor. Pick up of MgO from the tundish lining materials is to be expected and at ~12% in the lower slag this is believed to be close to the saturation level. The increase in FeO and MnO levels which is far in excess of any variation in silica and alumina suggests that the major factor changing the slag composition is not absorption of inclusions but oxidation of steel close to the surface (both steel chemistries used have high manganese levels of around 1%). However since the volume of tundish slag is small compared to that of the steel passing through the tundish the effect on overall levels of Mn and Fe in the steel is not noticed. It should be noted that these were pilot scale trials. Full results from production tundishes are presented below (Figure 16 to Figure 19) and in Appendix 20. One significant problem has been consistency of sampling since the tundish slag is not homogeneous. The sampling technique described by partners DEW/TUBAF in attempting to obtain a chilled cylinder of slag from which the ‘upper’ and ‘lower’ layers can be crudely separated has been used. However problems occurred with the sealing of cylinder when removing it from the slag, and the liquid portion would leak out. For the industrial trials, steel plates welded to long poles were used to obtain slag samples. The powder and sintered layers could be brushed aside in a ‘sweeping’ motion, and the liquid sample obtained. While some contamination did occasionally occur, most of time clean samples were obtained. This sample technique was also much more maneuverable than the cylinder method. Trials had been carried out using the 7 tonne pilot plant casting facilities of Tata Steel R,D&T Teesside Technology Centre (Figure 15), using the tundish powder, high MgO tundish lining materials and
25
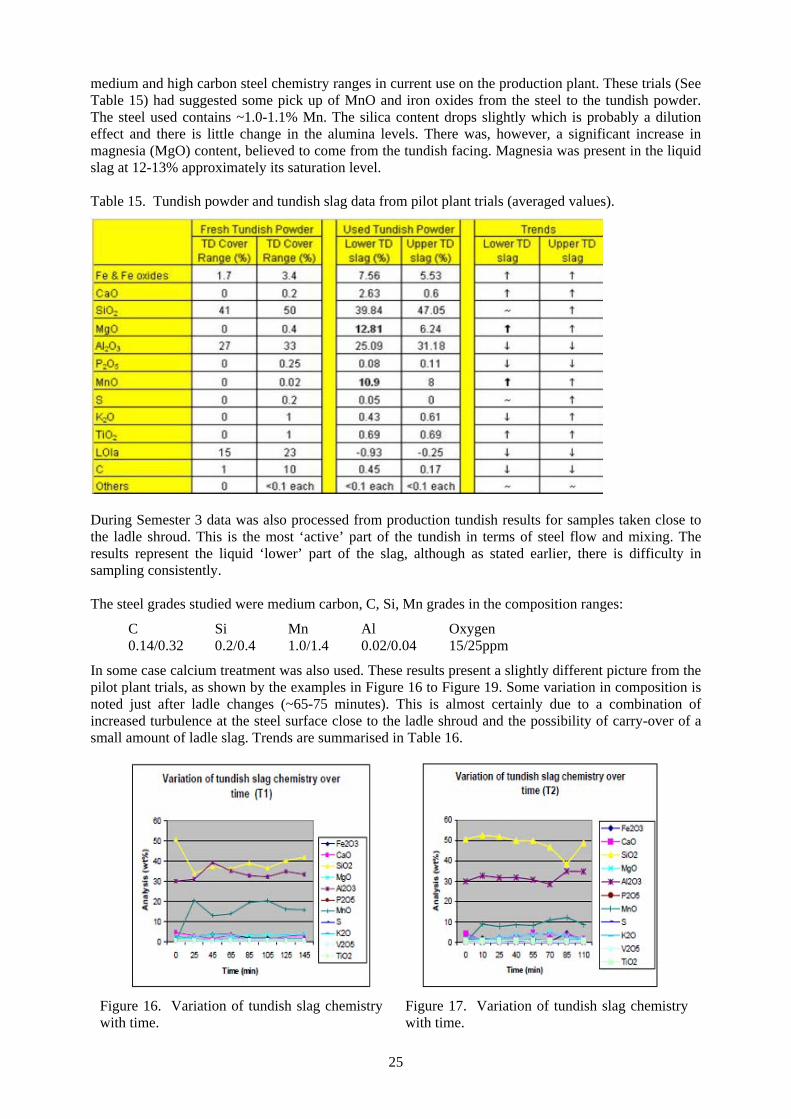
medium and high carbon steel chemistry ranges in current use on the production plant. These trials (See Table 15) had suggested some pick up of MnO and iron oxides from the steel to the tundish powder. The steel used contains ~1.0-1.1% Mn. The silica content drops slightly which is probably a dilution effect and there is little change in the alumina levels. There was, however, a significant increase in magnesia (MgO) content, believed to come from the tundish facing. Magnesia was present in the liquid slag at 12-13% approximately its saturation level. Table 15. Tundish powder and tundish slag data from pilot plant trials (averaged values).
During Semester 3 data was also processed from production tundish results for samples taken close to the ladle shroud. This is the most ‘active’ part of the tundish in terms of steel flow and mixing. The results represent the liquid ‘lower’ part of the slag, although as stated earlier, there is difficulty in sampling consistently. The steel grades studied were medium carbon, C, Si, Mn grades in the composition ranges:
C Si Mn Al Oxygen 0.14/0.32 0.2/0.4 1.0/1.4 0.02/0.04 15/25ppm
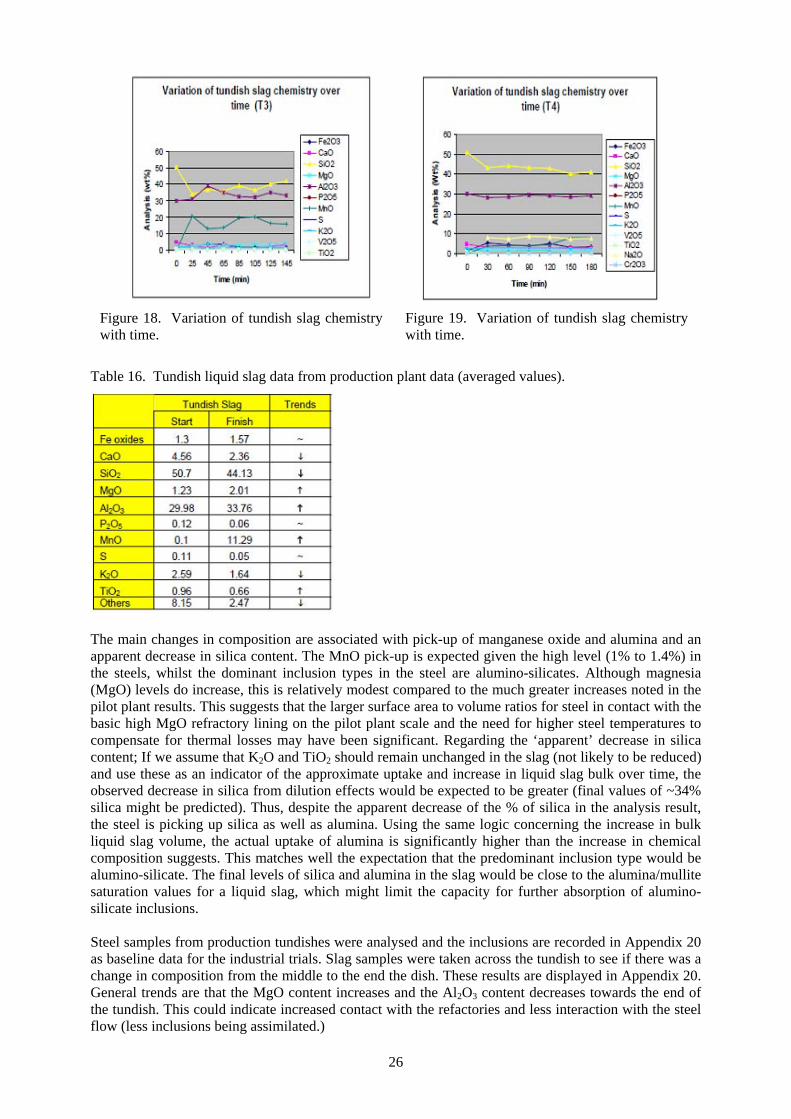
In some case calcium treatment was also used. These results present a slightly different picture from the pilot plant trials, as shown by the examples in Figure 16 to Figure 19. Some variation in composition is noted just after ladle changes (~65-75 minutes). This is almost certainly due to a combination of increased turbulence at the steel surface close to the ladle shroud and the possibility of carry-over of a small amount of ladle slag. Trends are summarised in Table 16.
Figure 16. Variation of tundish slag chemistry with time.
Figure 17. Variation of tundish slag chemistry with time.
26
Figure 18. Variation of tundish slag chemistry with time.
Figure 19. Variation of tundish slag chemistry with time.
Table 16. Tundish liquid slag data from production plant data (averaged values).
The main changes in composition are associated with pick-up of manganese oxide and alumina and an apparent decrease in silica content. The MnO pick-up is expected given the high level (1% to 1.4%) in the steels, whilst the dominant inclusion types in the steel are alumino-silicates. Although magnesia (MgO) levels do increase, this is relatively modest compared to the much greater increases noted in the pilot plant results. This suggests that the larger surface area to volume ratios for steel in contact with the basic high MgO refractory lining on the pilot plant scale and the need for higher steel temperatures to compensate for thermal losses may have been significant. Regarding the ‘apparent’ decrease in silica content; If we assume that K2O and TiO2 should remain unchanged in the slag (not likely to be reduced) and use these as an indicator of the approximate uptake and increase in liquid slag bulk over time, the observed decrease in silica from dilution effects would be expected to be greater (final values of ~34% silica might be predicted). Thus, despite the apparent decrease of the % of silica in the analysis result, the steel is picking up silica as well as alumina. Using the same logic concerning the increase in bulk liquid slag volume, the actual uptake of alumina is significantly higher than the increase in chemical composition suggests. This matches well the expectation that the predominant inclusion type would be alumino-silicate. The final levels of silica and alumina in the slag would be close to the alumina/mullite saturation values for a liquid slag, which might limit the capacity for further absorption of alumino-silicate inclusions. Steel samples from production tundishes were analysed and the inclusions are recorded in Appendix 20 as baseline data for the industrial trials. Slag samples were taken across the tundish to see if there was a change in composition from the middle to the end the dish. These results are displayed in Appendix 20. General trends are that the MgO content increases and the Al2O3 content decreases towards the end of the tundish. This could indicate increased contact with the refactories and less interaction with the steel flow (less inclusions being assimilated.)
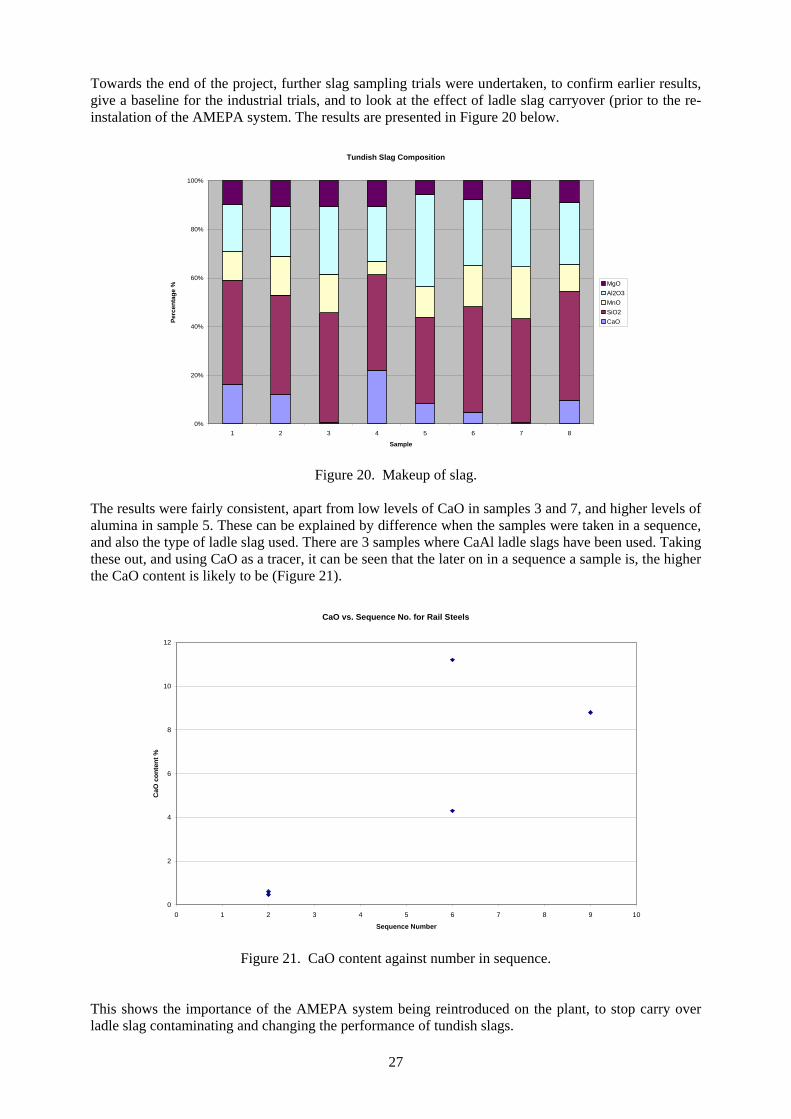
27
Towards the end of the project, further slag sampling trials were undertaken, to confirm earlier results, give a baseline for the industrial trials, and to look at the effect of ladle slag carryover (prior to the re-instalation of the AMEPA system. The results are presented in Figure 20 below.
Tundish Slag Composition
0%
20%
40%
60%
80%
100%
1 2 3 4 5 6 7 8
Sample
Perc
enta
ge % MgO
Al2O3MnOSiO2CaO
Figure 20. Makeup of slag.
The results were fairly consistent, apart from low levels of CaO in samples 3 and 7, and higher levels of alumina in sample 5. These can be explained by difference when the samples were taken in a sequence, and also the type of ladle slag used. There are 3 samples where CaAl ladle slags have been used. Taking these out, and using CaO as a tracer, it can be seen that the later on in a sequence a sample is, the higher the CaO content is likely to be (Figure 21).
CaO vs. Sequence No. for Rail Steels
0
2
4
6
8
10
12
0 1 2 3 4 5 6 7 8 9 10
Sequence Number
CaO
con
tent
%
Figure 21. CaO content against number in sequence.
This shows the importance of the AMEPA system being reintroduced on the plant, to stop carry over ladle slag contaminating and changing the performance of tundish slags.
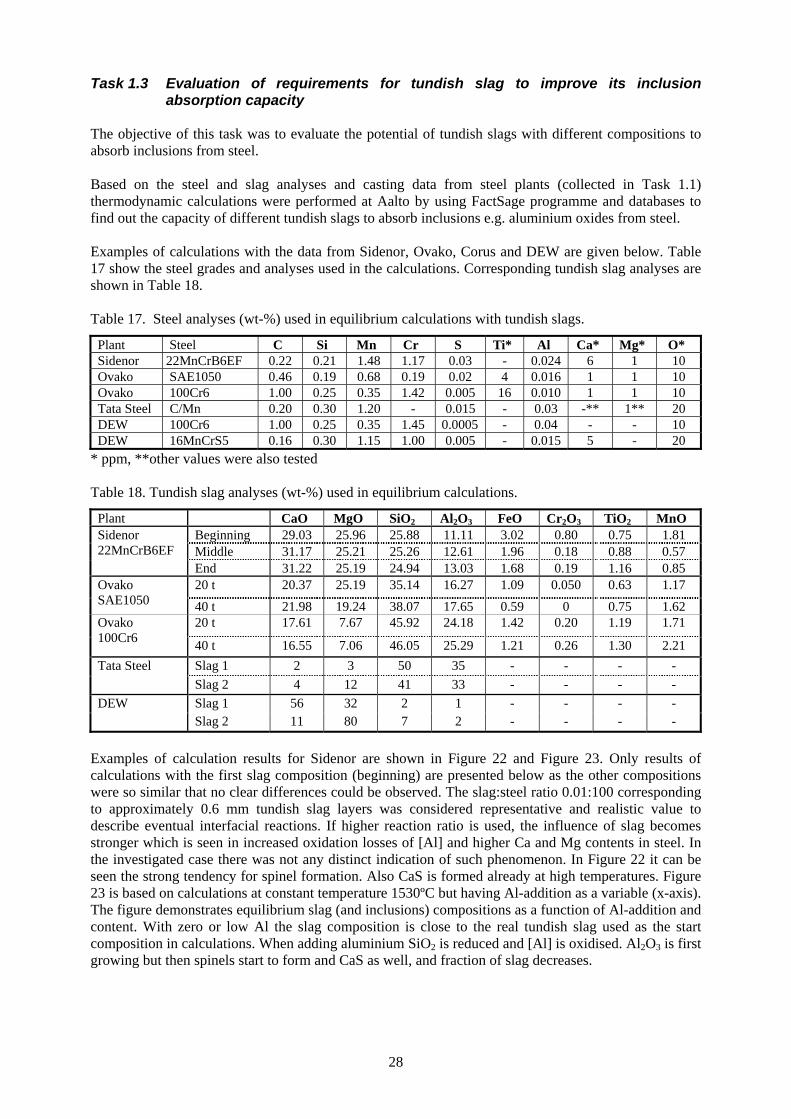
28
Task 1.3 Evaluation of requirements for tundish slag to improve its inclusion absorption capacity
The objective of this task was to evaluate the potential of tundish slags with different compositions to absorb inclusions from steel. Based on the steel and slag analyses and casting data from steel plants (collected in Task 1.1) thermodynamic calculations were performed at Aalto by using FactSage programme and databases to find out the capacity of different tundish slags to absorb inclusions e.g. aluminium oxides from steel. Examples of calculations with the data from Sidenor, Ovako, Corus and DEW are given below. Table 17 show the steel grades and analyses used in the calculations. Corresponding tundish slag analyses are shown in Table 18. Table 17. Steel analyses (wt-%) used in equilibrium calculations with tundish slags.
Plant Steel C Si Mn Cr S Ti* Al Ca* Mg* O* Sidenor 22MnCrB6EF 0.22 0.21 1.48 1.17 0.03 - 0.024 6 1 10 Ovako SAE1050 0.46 0.19 0.68 0.19 0.02 4 0.016 1 1 10 Ovako 100Cr6 1.00 0.25 0.35 1.42 0.005 16 0.010 1 1 10 Tata Steel C/Mn 0.20 0.30 1.20 - 0.015 - 0.03 -** 1** 20 DEW 100Cr6 1.00 0.25 0.35 1.45 0.0005 - 0.04 - - 10 DEW 16MnCrS5 0.16 0.30 1.15 1.00 0.005 - 0.015 5 - 20
* ppm, **other values were also tested Table 18. Tundish slag analyses (wt-%) used in equilibrium calculations.
Plant CaO MgO SiO2 Al2O3 FeO Cr2O3 TiO2 MnO Beginning 29.03 25.96 25.88 11.11 3.02 0.80 0.75 1.81 Middle 31.17 25.21 25.26 12.61 1.96 0.18 0.88 0.57
Sidenor 22MnCrB6EF
End 31.22 25.19 24.94 13.03 1.68 0.19 1.16 0.85 20 t 20.37 25.19 35.14 16.27 1.09 0.050 0.63 1.17 Ovako
SAE1050 40 t 21.98 19.24 38.07 17.65 0.59 0 0.75 1.62 20 t 17.61 7.67 45.92 24.18 1.42 0.20 1.19 1.71 Ovako
100Cr6 40 t 16.55 7.06 46.05 25.29 1.21 0.26 1.30 2.21 Slag 1 2 3 50 35 - - - - Tata Steel Slag 2 4 12 41 33 - - - - Slag 1 56 32 2 1 - - - - DEW Slag 2 11 80 7 2 - - - -
Examples of calculation results for Sidenor are shown in Figure 22 and Figure 23. Only results of calculations with the first slag composition (beginning) are presented below as the other compositions were so similar that no clear differences could be observed. The slag:steel ratio 0.01:100 corresponding to approximately 0.6 mm tundish slag layers was considered representative and realistic value to describe eventual interfacial reactions. If higher reaction ratio is used, the influence of slag becomes stronger which is seen in increased oxidation losses of [Al] and higher Ca and Mg contents in steel. In the investigated case there was not any distinct indication of such phenomenon. In Figure 22 it can be seen the strong tendency for spinel formation. Also CaS is formed already at high temperatures. Figure 23 is based on calculations at constant temperature 1530ºC but having Al-addition as a variable (x-axis). The figure demonstrates equilibrium slag (and inclusions) compositions as a function of Al-addition and content. With zero or low Al the slag composition is close to the real tundish slag used as the start composition in calculations. When adding aluminium SiO2 is reduced and [Al] is oxidised. Al2O3 is first growing but then spinels start to form and CaS as well, and fraction of slag decreases.
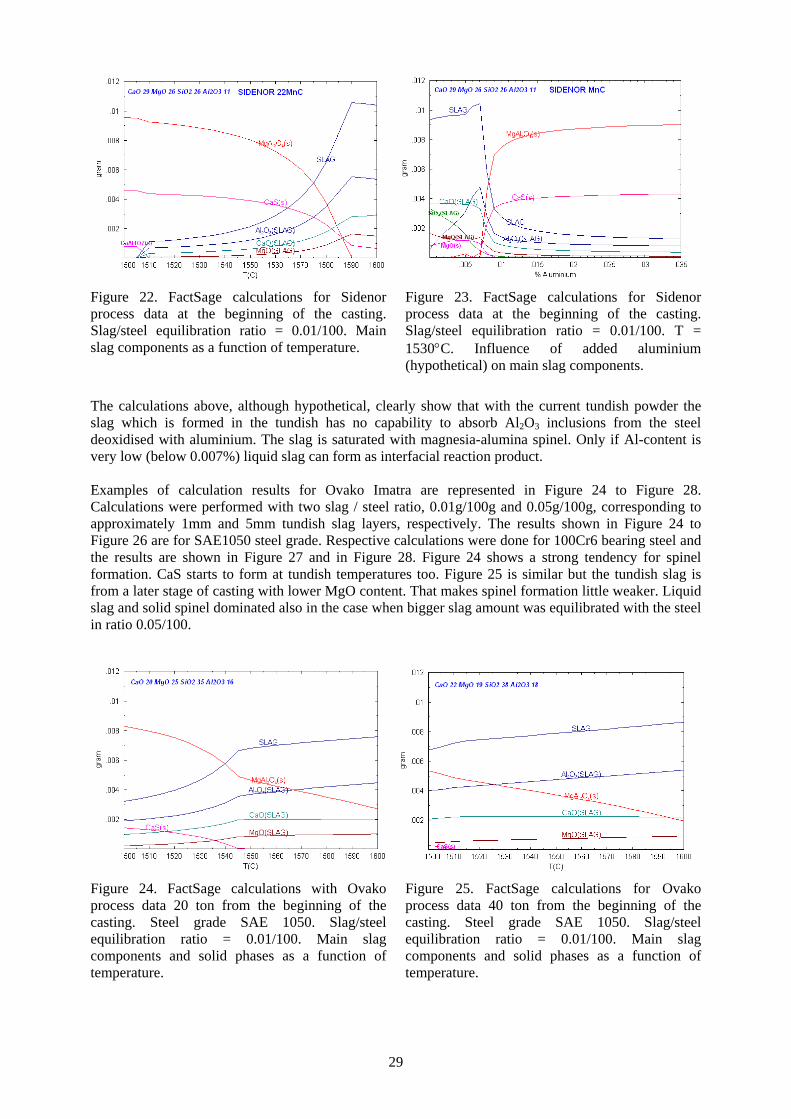
29
Figure 22. FactSage calculations for Sidenor process data at the beginning of the casting. Slag/steel equilibration ratio = 0.01/100. Main slag components as a function of temperature.
Figure 23. FactSage calculations for Sidenor process data at the beginning of the casting. Slag/steel equilibration ratio = 0.01/100. T = 1530°C. Influence of added aluminium (hypothetical) on main slag components.
The calculations above, although hypothetical, clearly show that with the current tundish powder the slag which is formed in the tundish has no capability to absorb Al2O3 inclusions from the steel deoxidised with aluminium. The slag is saturated with magnesia-alumina spinel. Only if Al-content is very low (below 0.007%) liquid slag can form as interfacial reaction product. Examples of calculation results for Ovako Imatra are represented in Figure 24 to Figure 28. Calculations were performed with two slag / steel ratio, 0.01g/100g and 0.05g/100g, corresponding to approximately 1mm and 5mm tundish slag layers, respectively. The results shown in Figure 24 to Figure 26 are for SAE1050 steel grade. Respective calculations were done for 100Cr6 bearing steel and the results are shown in Figure 27 and in Figure 28. Figure 24 shows a strong tendency for spinel formation. CaS starts to form at tundish temperatures too. Figure 25 is similar but the tundish slag is from a later stage of casting with lower MgO content. That makes spinel formation little weaker. Liquid slag and solid spinel dominated also in the case when bigger slag amount was equilibrated with the steel in ratio 0.05/100.
Figure 24. FactSage calculations with Ovako process data 20 ton from the beginning of the casting. Steel grade SAE 1050. Slag/steel equilibration ratio = 0.01/100. Main slag components and solid phases as a function of temperature.
Figure 25. FactSage calculations for Ovako process data 40 ton from the beginning of the casting. Steel grade SAE 1050. Slag/steel equilibration ratio = 0.01/100. Main slag components and solid phases as a function of temperature.
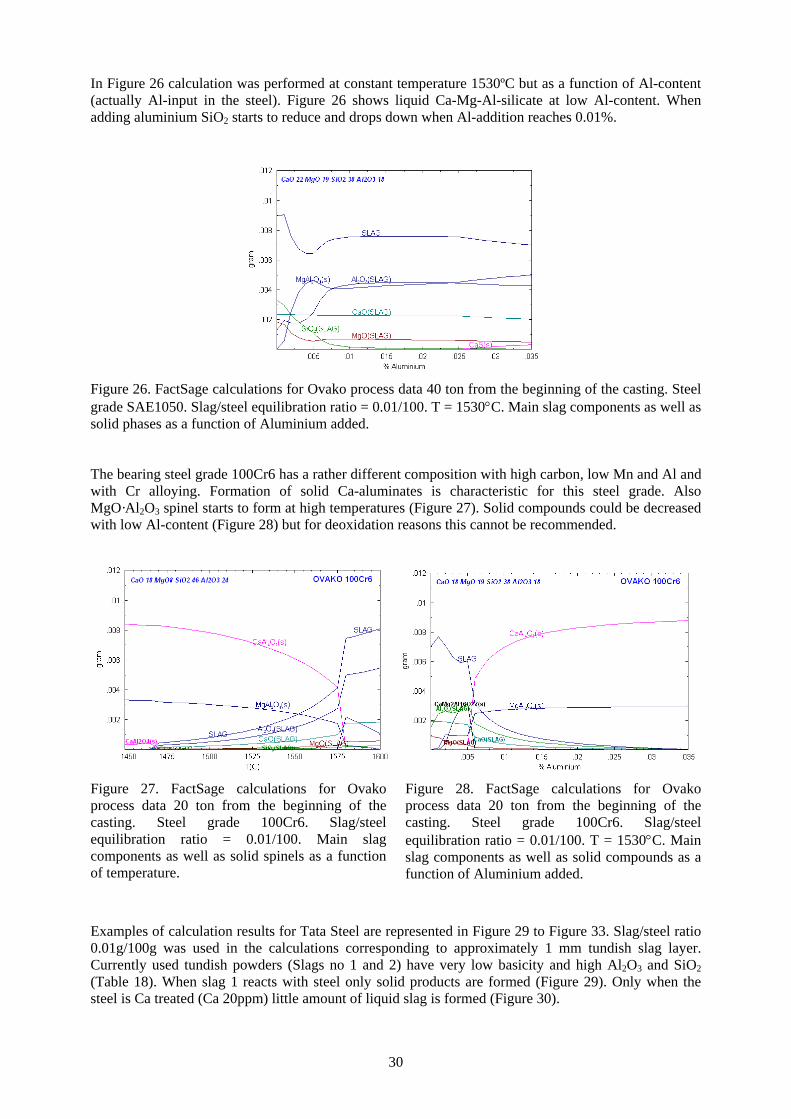
30
In Figure 26 calculation was performed at constant temperature 1530ºC but as a function of Al-content (actually Al-input in the steel). Figure 26 shows liquid Ca-Mg-Al-silicate at low Al-content. When adding aluminium SiO2 starts to reduce and drops down when Al-addition reaches 0.01%.
Figure 26. FactSage calculations for Ovako process data 40 ton from the beginning of the casting. Steel grade SAE1050. Slag/steel equilibration ratio = 0.01/100. T = 1530°C. Main slag components as well as solid phases as a function of Aluminium added. The bearing steel grade 100Cr6 has a rather different composition with high carbon, low Mn and Al and with Cr alloying. Formation of solid Ca-aluminates is characteristic for this steel grade. Also MgO·Al2O3 spinel starts to form at high temperatures (Figure 27). Solid compounds could be decreased with low Al-content (Figure 28) but for deoxidation reasons this cannot be recommended.
Figure 27. FactSage calculations for Ovako process data 20 ton from the beginning of the casting. Steel grade 100Cr6. Slag/steel equilibration ratio = 0.01/100. Main slag components as well as solid spinels as a function of temperature.
Figure 28. FactSage calculations for Ovako process data 20 ton from the beginning of the casting. Steel grade 100Cr6. Slag/steel equilibration ratio = 0.01/100. T = 1530°C. Main slag components as well as solid compounds as a function of Aluminium added.
Examples of calculation results for Tata Steel are represented in Figure 29 to Figure 33. Slag/steel ratio 0.01g/100g was used in the calculations corresponding to approximately 1 mm tundish slag layer. Currently used tundish powders (Slags no 1 and 2) have very low basicity and high Al2O3 and SiO2 (Table 18). When slag 1 reacts with steel only solid products are formed (Figure 29). Only when the steel is Ca treated (Ca 20ppm) little amount of liquid slag is formed (Figure 30).
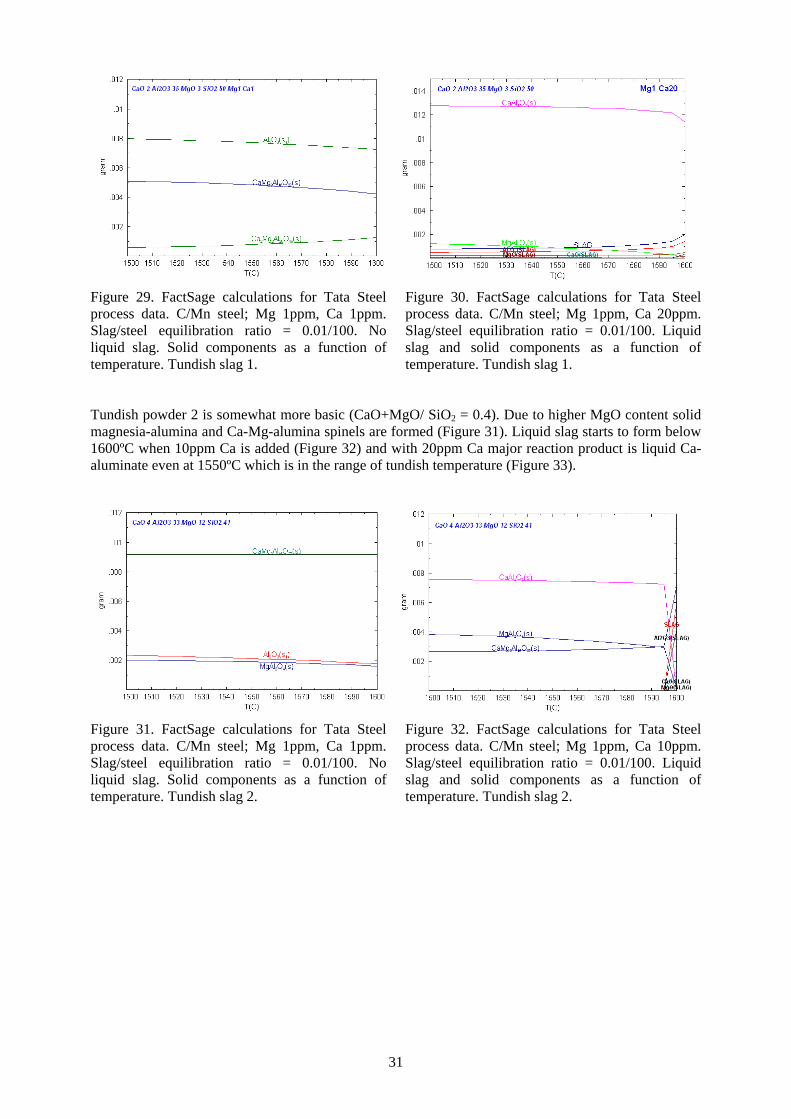
31
Figure 29. FactSage calculations for Tata Steel process data. C/Mn steel; Mg 1ppm, Ca 1ppm. Slag/steel equilibration ratio = 0.01/100. No liquid slag. Solid components as a function of temperature. Tundish slag 1.
Figure 30. FactSage calculations for Tata Steel process data. C/Mn steel; Mg 1ppm, Ca 20ppm. Slag/steel equilibration ratio = 0.01/100. Liquid slag and solid components as a function of temperature. Tundish slag 1.
Tundish powder 2 is somewhat more basic (CaO+MgO/ SiO2 = 0.4). Due to higher MgO content solid magnesia-alumina and Ca-Mg-alumina spinels are formed (Figure 31). Liquid slag starts to form below 1600ºC when 10ppm Ca is added (Figure 32) and with 20ppm Ca major reaction product is liquid Ca-aluminate even at 1550ºC which is in the range of tundish temperature (Figure 33).
Figure 31. FactSage calculations for Tata Steel process data. C/Mn steel; Mg 1ppm, Ca 1ppm. Slag/steel equilibration ratio = 0.01/100. No liquid slag. Solid components as a function of temperature. Tundish slag 2.
Figure 32. FactSage calculations for Tata Steel process data. C/Mn steel; Mg 1ppm, Ca 10ppm. Slag/steel equilibration ratio = 0.01/100. Liquid slag and solid components as a function of temperature. Tundish slag 2.
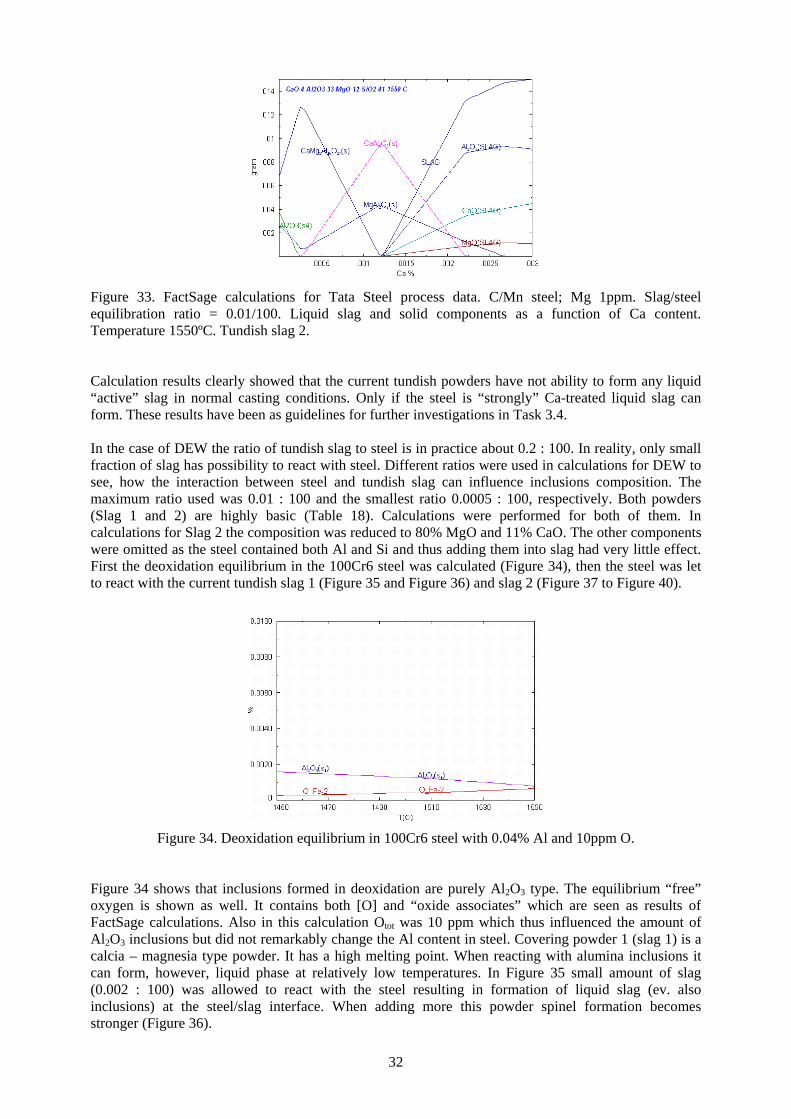
32
Figure 33. FactSage calculations for Tata Steel process data. C/Mn steel; Mg 1ppm. Slag/steel equilibration ratio = 0.01/100. Liquid slag and solid components as a function of Ca content. Temperature 1550ºC. Tundish slag 2. Calculation results clearly showed that the current tundish powders have not ability to form any liquid “active” slag in normal casting conditions. Only if the steel is “strongly” Ca-treated liquid slag can form. These results have been as guidelines for further investigations in Task 3.4. In the case of DEW the ratio of tundish slag to steel is in practice about 0.2 : 100. In reality, only small fraction of slag has possibility to react with steel. Different ratios were used in calculations for DEW to see, how the interaction between steel and tundish slag can influence inclusions composition. The maximum ratio used was 0.01 : 100 and the smallest ratio 0.0005 : 100, respectively. Both powders (Slag 1 and 2) are highly basic (Table 18). Calculations were performed for both of them. In calculations for Slag 2 the composition was reduced to 80% MgO and 11% CaO. The other components were omitted as the steel contained both Al and Si and thus adding them into slag had very little effect. First the deoxidation equilibrium in the 100Cr6 steel was calculated (Figure 34), then the steel was let to react with the current tundish slag 1 (Figure 35 and Figure 36) and slag 2 (Figure 37 to Figure 40).
Figure 34. Deoxidation equilibrium in 100Cr6 steel with 0.04% Al and 10ppm O.
Figure 34 shows that inclusions formed in deoxidation are purely Al2O3 type. The equilibrium “free” oxygen is shown as well. It contains both [O] and “oxide associates” which are seen as results of FactSage calculations. Also in this calculation Otot was 10 ppm which thus influenced the amount of Al2O3 inclusions but did not remarkably change the Al content in steel. Covering powder 1 (slag 1) is a calcia – magnesia type powder. It has a high melting point. When reacting with alumina inclusions it can form, however, liquid phase at relatively low temperatures. In Figure 35 small amount of slag (0.002 : 100) was allowed to react with the steel resulting in formation of liquid slag (ev. also inclusions) at the steel/slag interface. When adding more this powder spinel formation becomes stronger (Figure 36).
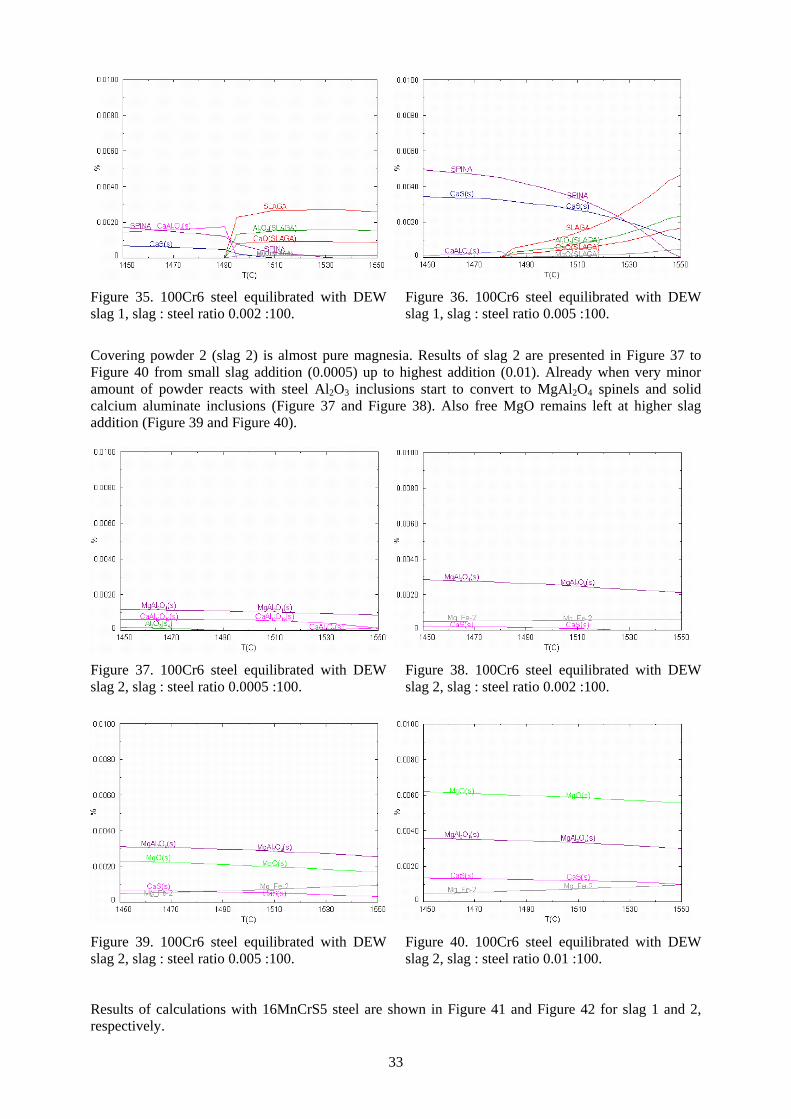
33
Figure 35. 100Cr6 steel equilibrated with DEW slag 1, slag : steel ratio 0.002 :100.
Figure 36. 100Cr6 steel equilibrated with DEW slag 1, slag : steel ratio 0.005 :100.
Covering powder 2 (slag 2) is almost pure magnesia. Results of slag 2 are presented in Figure 37 to Figure 40 from small slag addition (0.0005) up to highest addition (0.01). Already when very minor amount of powder reacts with steel Al2O3 inclusions start to convert to MgAl2O4 spinels and solid calcium aluminate inclusions (Figure 37 and Figure 38). Also free MgO remains left at higher slag addition (Figure 39 and Figure 40).
Figure 37. 100Cr6 steel equilibrated with DEW slag 2, slag : steel ratio 0.0005 :100.
Figure 38. 100Cr6 steel equilibrated with DEW slag 2, slag : steel ratio 0.002 :100.
Figure 39. 100Cr6 steel equilibrated with DEW slag 2, slag : steel ratio 0.005 :100.
Figure 40. 100Cr6 steel equilibrated with DEW slag 2, slag : steel ratio 0.01 :100.
Results of calculations with 16MnCrS5 steel are shown in Figure 41 and Figure 42 for slag 1 and 2, respectively.
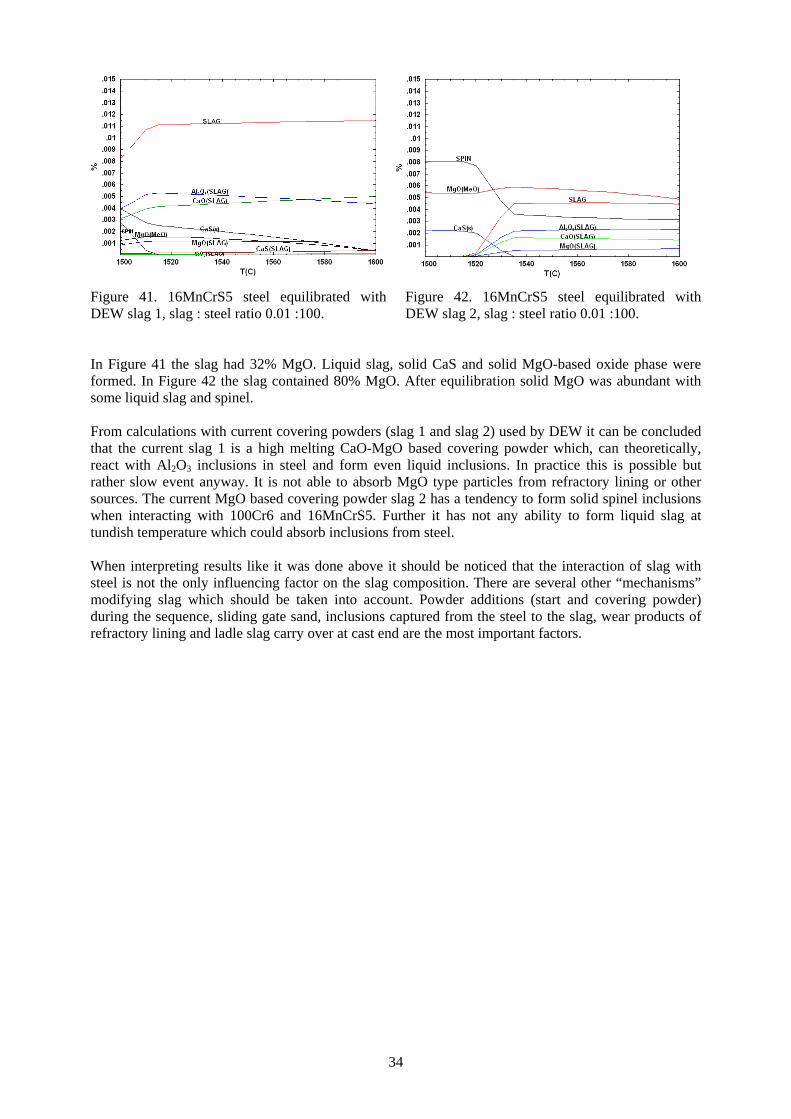
34
Figure 41. 16MnCrS5 steel equilibrated with DEW slag 1, slag : steel ratio 0.01 :100.
Figure 42. 16MnCrS5 steel equilibrated with DEW slag 2, slag : steel ratio 0.01 :100.
In Figure 41 the slag had 32% MgO. Liquid slag, solid CaS and solid MgO-based oxide phase were formed. In Figure 42 the slag contained 80% MgO. After equilibration solid MgO was abundant with some liquid slag and spinel. From calculations with current covering powders (slag 1 and slag 2) used by DEW it can be concluded that the current slag 1 is a high melting CaO-MgO based covering powder which, can theoretically, react with Al2O3 inclusions in steel and form even liquid inclusions. In practice this is possible but rather slow event anyway. It is not able to absorb MgO type particles from refractory lining or other sources. The current MgO based covering powder slag 2 has a tendency to form solid spinel inclusions when interacting with 100Cr6 and 16MnCrS5. Further it has not any ability to form liquid slag at tundish temperature which could absorb inclusions from steel. When interpreting results like it was done above it should be noticed that the interaction of slag with steel is not the only influencing factor on the slag composition. There are several other “mechanisms” modifying slag which should be taken into account. Powder additions (start and covering powder) during the sequence, sliding gate sand, inclusions captured from the steel to the slag, wear products of refractory lining and ladle slag carry over at cast end are the most important factors.
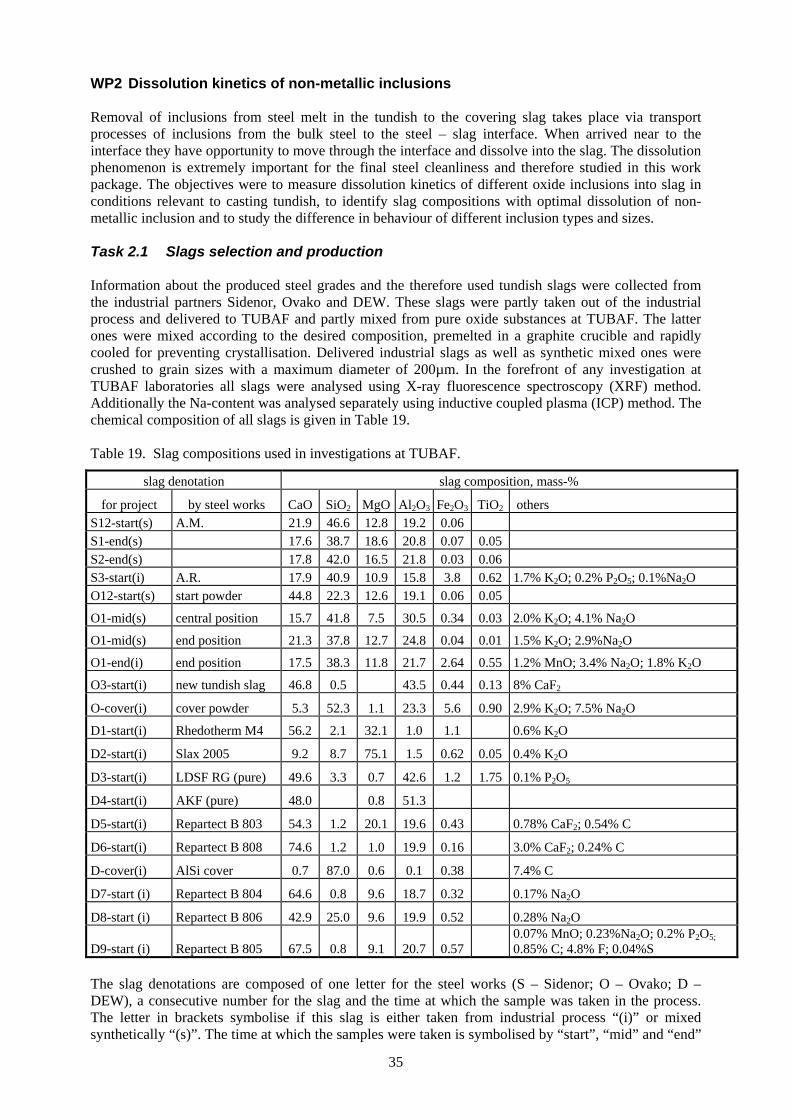
35
WP2 Dissolution kinetics of non-metallic inclusions Removal of inclusions from steel melt in the tundish to the covering slag takes place via transport processes of inclusions from the bulk steel to the steel – slag interface. When arrived near to the interface they have opportunity to move through the interface and dissolve into the slag. The dissolution phenomenon is extremely important for the final steel cleanliness and therefore studied in this work package. The objectives were to measure dissolution kinetics of different oxide inclusions into slag in conditions relevant to casting tundish, to identify slag compositions with optimal dissolution of non-metallic inclusion and to study the difference in behaviour of different inclusion types and sizes. Task 2.1 Slags selection and production Information about the produced steel grades and the therefore used tundish slags were collected from the industrial partners Sidenor, Ovako and DEW. These slags were partly taken out of the industrial process and delivered to TUBAF and partly mixed from pure oxide substances at TUBAF. The latter ones were mixed according to the desired composition, premelted in a graphite crucible and rapidly cooled for preventing crystallisation. Delivered industrial slags as well as synthetic mixed ones were crushed to grain sizes with a maximum diameter of 200µm. In the forefront of any investigation at TUBAF laboratories all slags were analysed using X-ray fluorescence spectroscopy (XRF) method. Additionally the Na-content was analysed separately using inductive coupled plasma (ICP) method. The chemical composition of all slags is given in Table 19. Table 19. Slag compositions used in investigations at TUBAF.
slag denotation slag composition, mass-%
for project by steel works CaO SiO2 MgO Al2O3 Fe2O3 TiO2 others S12-start(s) A.M. 21.9 46.6 12.8 19.2 0.06 S1-end(s) 17.6 38.7 18.6 20.8 0.07 0.05 S2-end(s) 17.8 42.0 16.5 21.8 0.03 0.06 S3-start(i) A.R. 17.9 40.9 10.9 15.8 3.8 0.62 1.7% K2O; 0.2% P2O5; 0.1%Na2O O12-start(s) start powder 44.8 22.3 12.6 19.1 0.06 0.05
O1-mid(s) central position 15.7 41.8 7.5 30.5 0.34 0.03 2.0% K2O; 4.1% Na2O
O1-mid(s) end position 21.3 37.8 12.7 24.8 0.04 0.01 1.5% K2O; 2.9%Na2O
O1-end(i) end position 17.5 38.3 11.8 21.7 2.64 0.55 1.2% MnO; 3.4% Na2O; 1.8% K2O
O3-start(i) new tundish slag 46.8 0.5 43.5 0.44 0.13 8% CaF2
O-cover(i) cover powder 5.3 52.3 1.1 23.3 5.6 0.90 2.9% K2O; 7.5% Na2O
D1-start(i) Rhedotherm M4 56.2 2.1 32.1 1.0 1.1 0.6% K2O
D2-start(i) Slax 2005 9.2 8.7 75.1 1.5 0.62 0.05 0.4% K2O
D3-start(i) LDSF RG (pure) 49.6 3.3 0.7 42.6 1.2 1.75 0.1% P2O5
D4-start(i) AKF (pure) 48.0 0.8 51.3
D5-start(i) Repartect B 803 54.3 1.2 20.1 19.6 0.43 0.78% CaF2; 0.54% C
D6-start(i) Repartect B 808 74.6 1.2 1.0 19.9 0.16 3.0% CaF2; 0.24% C
D-cover(i) AlSi cover 0.7 87.0 0.6 0.1 0.38 7.4% C
D7-start (i) Repartect B 804 64.6 0.8 9.6 18.7 0.32 0.17% Na2O
D8-start (i) Repartect B 806 42.9 25.0 9.6 19.9 0.52 0.28% Na2O
D9-start (i) Repartect B 805 67.5 0.8 9.1 20.7 0.57 0.07% MnO; 0.23%Na2O; 0.2% P2O5; 0.85% C; 4.8% F; 0.04%S
The slag denotations are composed of one letter for the steel works (S – Sidenor; O – Ovako; D – DEW), a consecutive number for the slag and the time at which the sample was taken in the process. The letter in brackets symbolise if this slag is either taken from industrial process “(i)” or mixed synthetically “(s)”. The time at which the samples were taken is symbolised by “start”, “mid” and “end”
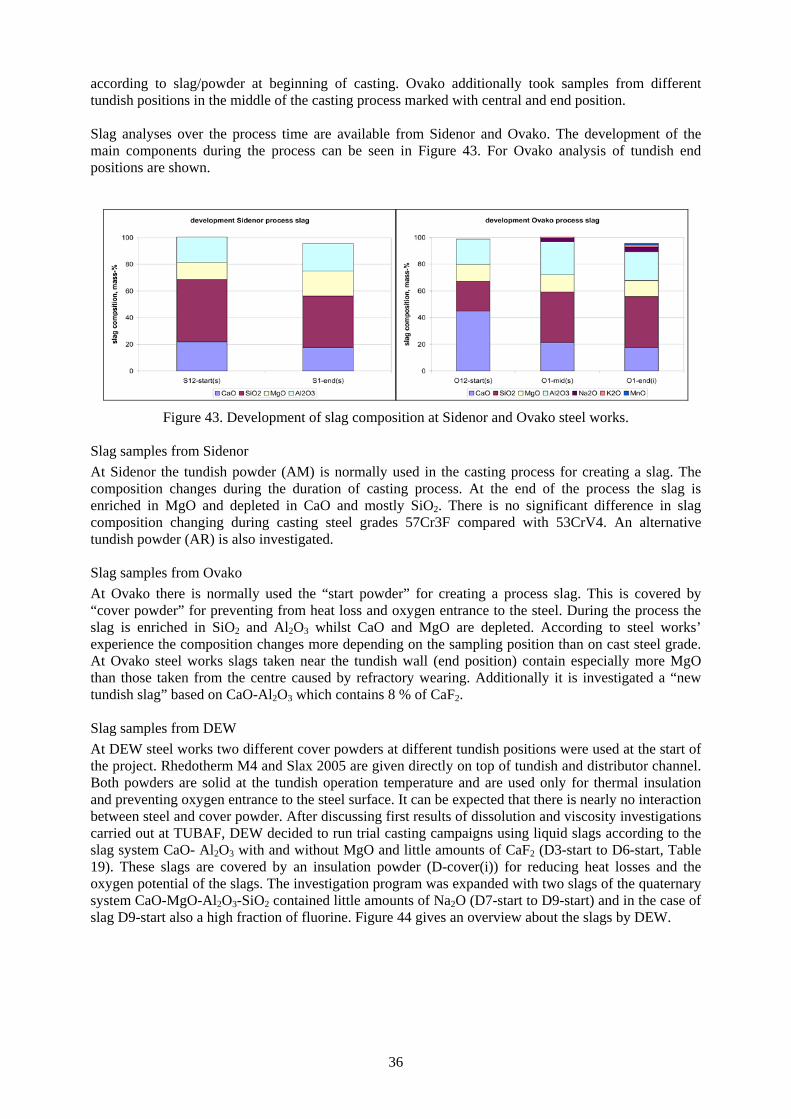
36
according to slag/powder at beginning of casting. Ovako additionally took samples from different tundish positions in the middle of the casting process marked with central and end position. Slag analyses over the process time are available from Sidenor and Ovako. The development of the main components during the process can be seen in Figure 43. For Ovako analysis of tundish end positions are shown.
Figure 43. Development of slag composition at Sidenor and Ovako steel works.
Slag samples from Sidenor At Sidenor the tundish powder (AM) is normally used in the casting process for creating a slag. The composition changes during the duration of casting process. At the end of the process the slag is enriched in MgO and depleted in CaO and mostly SiO2. There is no significant difference in slag composition changing during casting steel grades 57Cr3F compared with 53CrV4. An alternative tundish powder (AR) is also investigated. Slag samples from Ovako At Ovako there is normally used the “start powder” for creating a process slag. This is covered by “cover powder” for preventing from heat loss and oxygen entrance to the steel. During the process the slag is enriched in SiO2 and Al2O3 whilst CaO and MgO are depleted. According to steel works’ experience the composition changes more depending on the sampling position than on cast steel grade. At Ovako steel works slags taken near the tundish wall (end position) contain especially more MgO than those taken from the centre caused by refractory wearing. Additionally it is investigated a “new tundish slag” based on CaO-Al2O3 which contains 8 % of CaF2. Slag samples from DEW At DEW steel works two different cover powders at different tundish positions were used at the start of the project. Rhedotherm M4 and Slax 2005 are given directly on top of tundish and distributor channel. Both powders are solid at the tundish operation temperature and are used only for thermal insulation and preventing oxygen entrance to the steel surface. It can be expected that there is nearly no interaction between steel and cover powder. After discussing first results of dissolution and viscosity investigations carried out at TUBAF, DEW decided to run trial casting campaigns using liquid slags according to the slag system CaO- Al2O3 with and without MgO and little amounts of CaF2 (D3-start to D6-start, Table 19). These slags are covered by an insulation powder (D-cover(i)) for reducing heat losses and the oxygen potential of the slags. The investigation program was expanded with two slags of the quaternary system CaO-MgO-Al2O3-SiO2 contained little amounts of Na2O (D7-start to D9-start) and in the case of slag D9-start also a high fraction of fluorine. Figure 44 gives an overview about the slags by DEW.
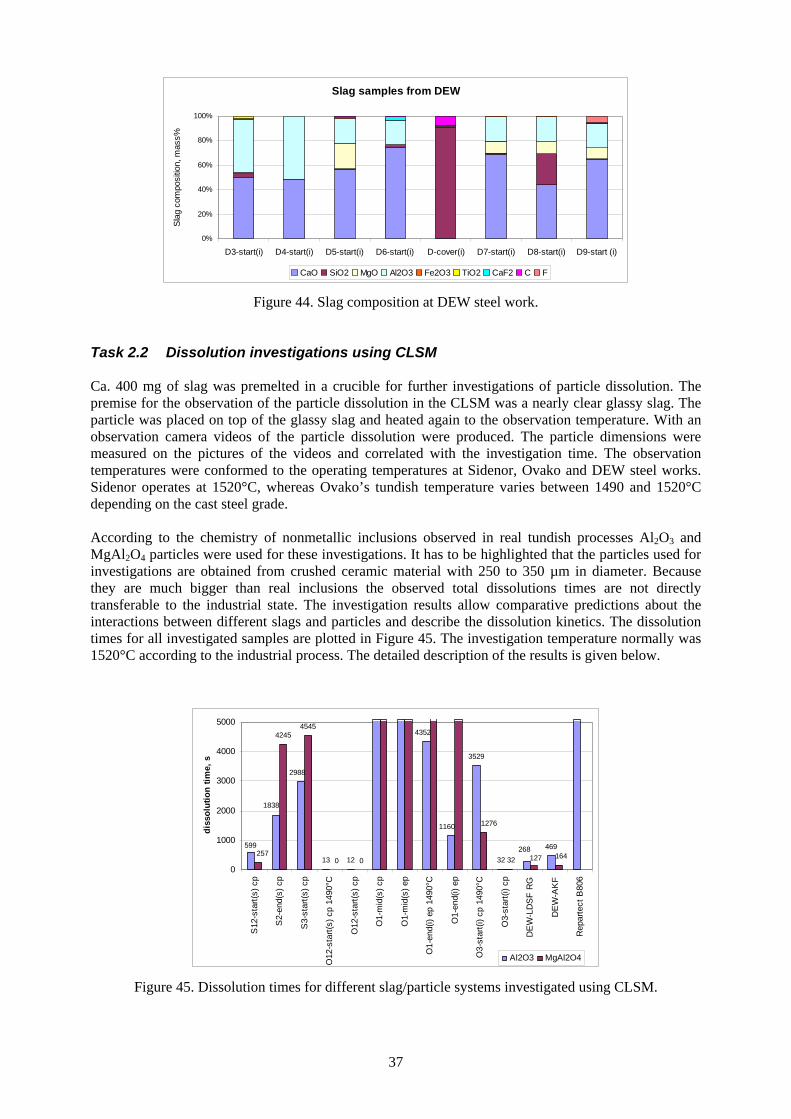
37
Slag samples from DEW
0%
20%
40%
60%
80%
100%
D3-start(i) D4-start(i) D5-start(i) D6-start(i) D-cover(i) D7-start(i) D8-start(i) D9-start (i)
Slag
com
posi
tion,
mas
s%
CaO SiO2 MgO Al2O3 Fe2O3 TiO2 CaF2 C F Figure 44. Slag composition at DEW steel work.
Task 2.2 Dissolution investigations using CLSM Ca. 400 mg of slag was premelted in a crucible for further investigations of particle dissolution. The premise for the observation of the particle dissolution in the CLSM was a nearly clear glassy slag. The particle was placed on top of the glassy slag and heated again to the observation temperature. With an observation camera videos of the particle dissolution were produced. The particle dimensions were measured on the pictures of the videos and correlated with the investigation time. The observation temperatures were conformed to the operating temperatures at Sidenor, Ovako and DEW steel works. Sidenor operates at 1520°C, whereas Ovako’s tundish temperature varies between 1490 and 1520°C depending on the cast steel grade. According to the chemistry of nonmetallic inclusions observed in real tundish processes Al2O3 and MgAl2O4 particles were used for these investigations. It has to be highlighted that the particles used for investigations are obtained from crushed ceramic material with 250 to 350 µm in diameter. Because they are much bigger than real inclusions the observed total dissolutions times are not directly transferable to the industrial state. The investigation results allow comparative predictions about the interactions between different slags and particles and describe the dissolution kinetics. The dissolution times for all investigated samples are plotted in Figure 45. The investigation temperature normally was 1520°C according to the industrial process. The detailed description of the results is given below.
13 12
3529
32
469
42454545
268
1160
4352
2988
1838
59916412732
1276
0257
00
1000
2000
3000
4000
5000
S12
-sta
rt(s)
cp
S2-
end(
s) c
p
S3-
star
t(s) c
p
O12
-sta
rt(s)
cp
1490
°C
O12
-sta
rt(s)
cp
O1-
mid
(s) c
p
O1-
mid
(s) e
p
O1-
end(
i) ep
149
0°C
O1-
end(
i) ep
O3-
star
t(i) c
p 14
90°C
O3-
star
t(i) c
p
DE
W-L
DS
F R
G
DE
W-A
KF
Rep
arte
ct B
806
diss
olut
ion
time,
s
Al2O3 MgAl2O4
Figure 45. Dissolution times for different slag/particle systems investigated using CLSM.
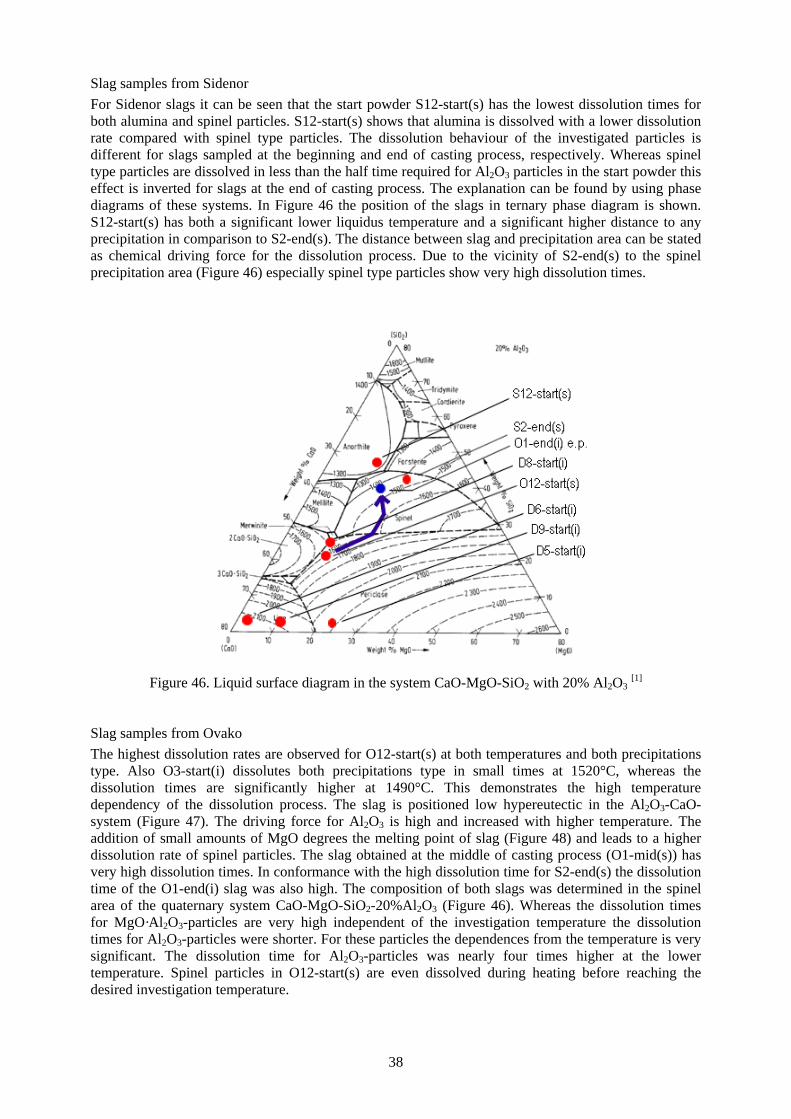
38
Slag samples from Sidenor For Sidenor slags it can be seen that the start powder S12-start(s) has the lowest dissolution times for both alumina and spinel particles. S12-start(s) shows that alumina is dissolved with a lower dissolution rate compared with spinel type particles. The dissolution behaviour of the investigated particles is different for slags sampled at the beginning and end of casting process, respectively. Whereas spinel type particles are dissolved in less than the half time required for Al2O3 particles in the start powder this effect is inverted for slags at the end of casting process. The explanation can be found by using phase diagrams of these systems. In Figure 46 the position of the slags in ternary phase diagram is shown. S12-start(s) has both a significant lower liquidus temperature and a significant higher distance to any precipitation in comparison to S2-end(s). The distance between slag and precipitation area can be stated as chemical driving force for the dissolution process. Due to the vicinity of S2-end(s) to the spinel precipitation area (Figure 46) especially spinel type particles show very high dissolution times.
Figure 46. Liquid surface diagram in the system CaO-MgO-SiO2 with 20% Al2O3 [1]
Slag samples from Ovako The highest dissolution rates are observed for O12-start(s) at both temperatures and both precipitations type. Also O3-start(i) dissolutes both precipitations type in small times at 1520°C, whereas the dissolution times are significantly higher at 1490°C. This demonstrates the high temperature dependency of the dissolution process. The slag is positioned low hypereutectic in the Al2O3-CaO-system (Figure 47). The driving force for Al2O3 is high and increased with higher temperature. The addition of small amounts of MgO degrees the melting point of slag (Figure 48) and leads to a higher dissolution rate of spinel particles. The slag obtained at the middle of casting process (O1-mid(s)) has very high dissolution times. In conformance with the high dissolution time for S2-end(s) the dissolution time of the O1-end(i) slag was also high. The composition of both slags was determined in the spinel area of the quaternary system CaO-MgO-SiO2-20%Al2O3 (Figure 46). Whereas the dissolution times for MgO·Al2O3-particles are very high independent of the investigation temperature the dissolution times for Al2O3-particles were shorter. For these particles the dependences from the temperature is very significant. The dissolution time for Al2O3-particles was nearly four times higher at the lower temperature. Spinel particles in O12-start(s) are even dissolved during heating before reaching the desired investigation temperature.
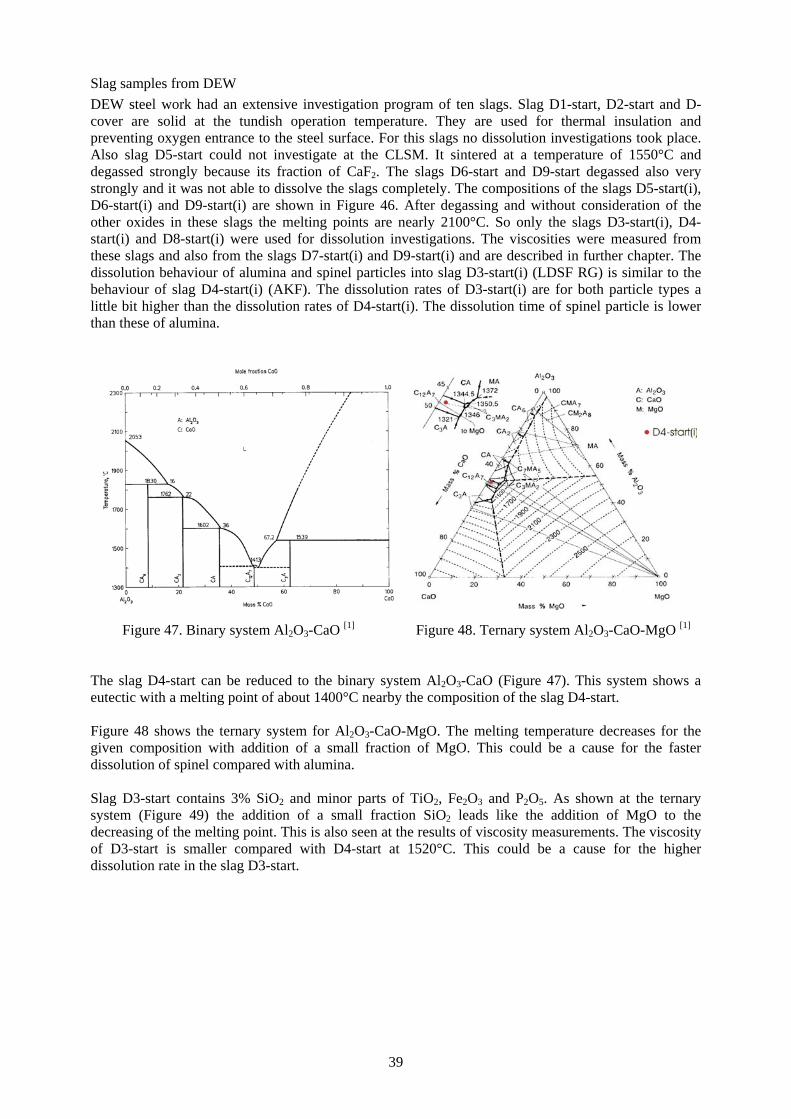
39
Slag samples from DEW DEW steel work had an extensive investigation program of ten slags. Slag D1-start, D2-start and D-cover are solid at the tundish operation temperature. They are used for thermal insulation and preventing oxygen entrance to the steel surface. For this slags no dissolution investigations took place. Also slag D5-start could not investigate at the CLSM. It sintered at a temperature of 1550°C and degassed strongly because its fraction of CaF2. The slags D6-start and D9-start degassed also very strongly and it was not able to dissolve the slags completely. The compositions of the slags D5-start(i), D6-start(i) and D9-start(i) are shown in Figure 46. After degassing and without consideration of the other oxides in these slags the melting points are nearly 2100°C. So only the slags D3-start(i), D4-start(i) and D8-start(i) were used for dissolution investigations. The viscosities were measured from these slags and also from the slags D7-start(i) and D9-start(i) and are described in further chapter. The dissolution behaviour of alumina and spinel particles into slag D3-start(i) (LDSF RG) is similar to the behaviour of slag D4-start(i) (AKF). The dissolution rates of D3-start(i) are for both particle types a little bit higher than the dissolution rates of D4-start(i). The dissolution time of spinel particle is lower than these of alumina.
Figure 47. Binary system Al2O3-CaO [1]
Figure 48. Ternary system Al2O3-CaO-MgO [1]
The slag D4-start can be reduced to the binary system Al2O3-CaO (Figure 47). This system shows a eutectic with a melting point of about 1400°C nearby the composition of the slag D4-start. Figure 48 shows the ternary system for Al2O3-CaO-MgO. The melting temperature decreases for the given composition with addition of a small fraction of MgO. This could be a cause for the faster dissolution of spinel compared with alumina. Slag D3-start contains 3% SiO2 and minor parts of TiO2, Fe2O3 and P2O5. As shown at the ternary system (Figure 49) the addition of a small fraction SiO2 leads like the addition of MgO to the decreasing of the melting point. This is also seen at the results of viscosity measurements. The viscosity of D3-start is smaller compared with D4-start at 1520°C. This could be a cause for the higher dissolution rate in the slag D3-start.
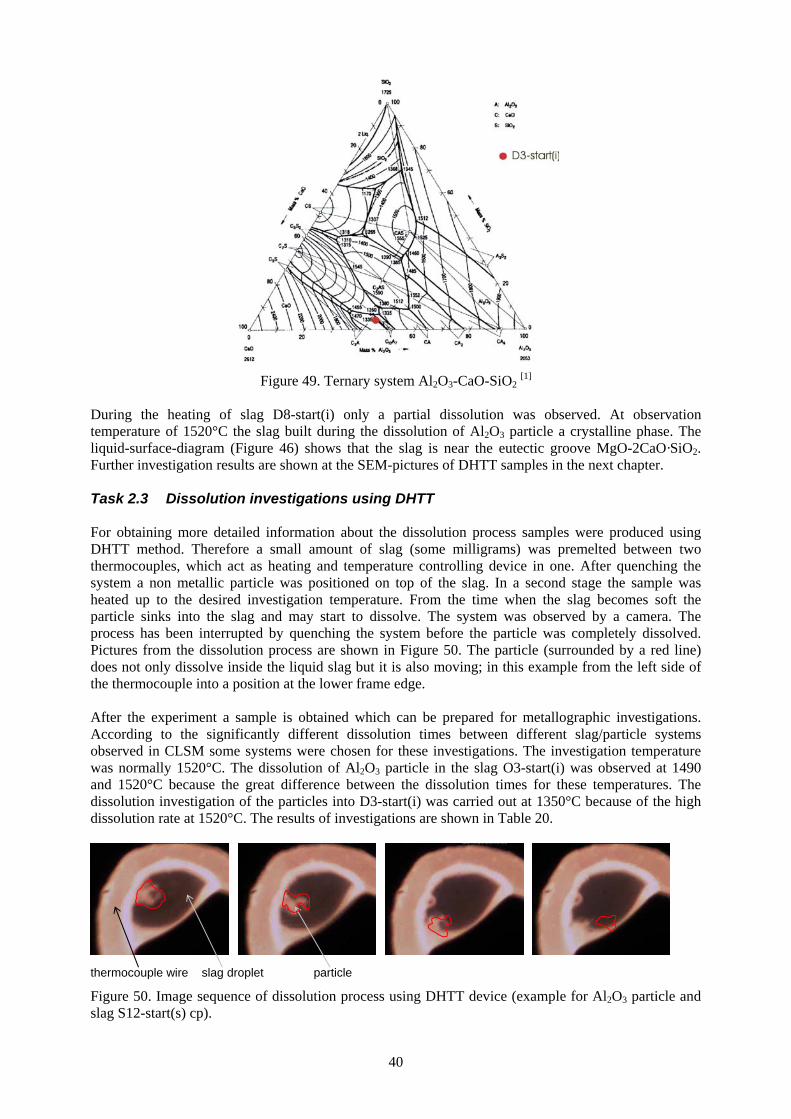
40
Figure 49. Ternary system Al2O3-CaO-SiO2 [1]
During the heating of slag D8-start(i) only a partial dissolution was observed. At observation temperature of 1520°C the slag built during the dissolution of Al2O3 particle a crystalline phase. The liquid-surface-diagram (Figure 46) shows that the slag is near the eutectic groove MgO-2CaO·SiO2. Further investigation results are shown at the SEM-pictures of DHTT samples in the next chapter. Task 2.3 Dissolution investigations using DHTT For obtaining more detailed information about the dissolution process samples were produced using DHTT method. Therefore a small amount of slag (some milligrams) was premelted between two thermocouples, which act as heating and temperature controlling device in one. After quenching the system a non metallic particle was positioned on top of the slag. In a second stage the sample was heated up to the desired investigation temperature. From the time when the slag becomes soft the particle sinks into the slag and may start to dissolve. The system was observed by a camera. The process has been interrupted by quenching the system before the particle was completely dissolved. Pictures from the dissolution process are shown in Figure 50. The particle (surrounded by a red line) does not only dissolve inside the liquid slag but it is also moving; in this example from the left side of the thermocouple into a position at the lower frame edge. After the experiment a sample is obtained which can be prepared for metallographic investigations. According to the significantly different dissolution times between different slag/particle systems observed in CLSM some systems were chosen for these investigations. The investigation temperature was normally 1520°C. The dissolution of Al2O3 particle in the slag O3-start(i) was observed at 1490 and 1520°C because the great difference between the dissolution times for these temperatures. The dissolution investigation of the particles into D3-start(i) was carried out at 1350°C because of the high dissolution rate at 1520°C. The results of investigations are shown in Table 20.
thermocouple wire slag droplet particle
Figure 50. Image sequence of dissolution process using DHTT device (example for Al2O3 particle and slag S12-start(s) cp).
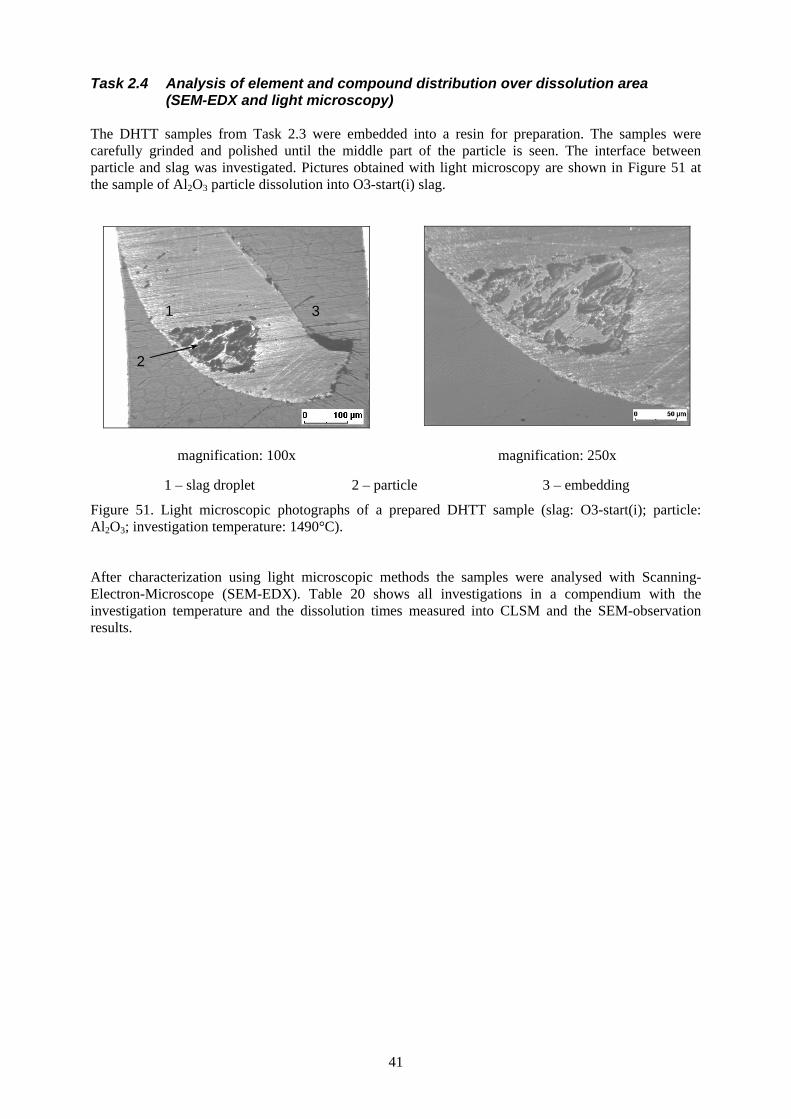
41
Task 2.4 Analysis of element and compound distribution over dissolution area (SEM-EDX and light microscopy)
The DHTT samples from Task 2.3 were embedded into a resin for preparation. The samples were carefully grinded and polished until the middle part of the particle is seen. The interface between particle and slag was investigated. Pictures obtained with light microscopy are shown in Figure 51 at the sample of Al2O3 particle dissolution into O3-start(i) slag.
magnification: 100x magnification: 250x
1 – slag droplet 2 – particle 3 – embedding
Figure 51. Light microscopic photographs of a prepared DHTT sample (slag: O3-start(i); particle: Al2O3; investigation temperature: 1490°C). After characterization using light microscopic methods the samples were analysed with Scanning-Electron-Microscope (SEM-EDX). Table 20 shows all investigations in a compendium with the investigation temperature and the dissolution times measured into CLSM and the SEM-observation results.
1 3 2
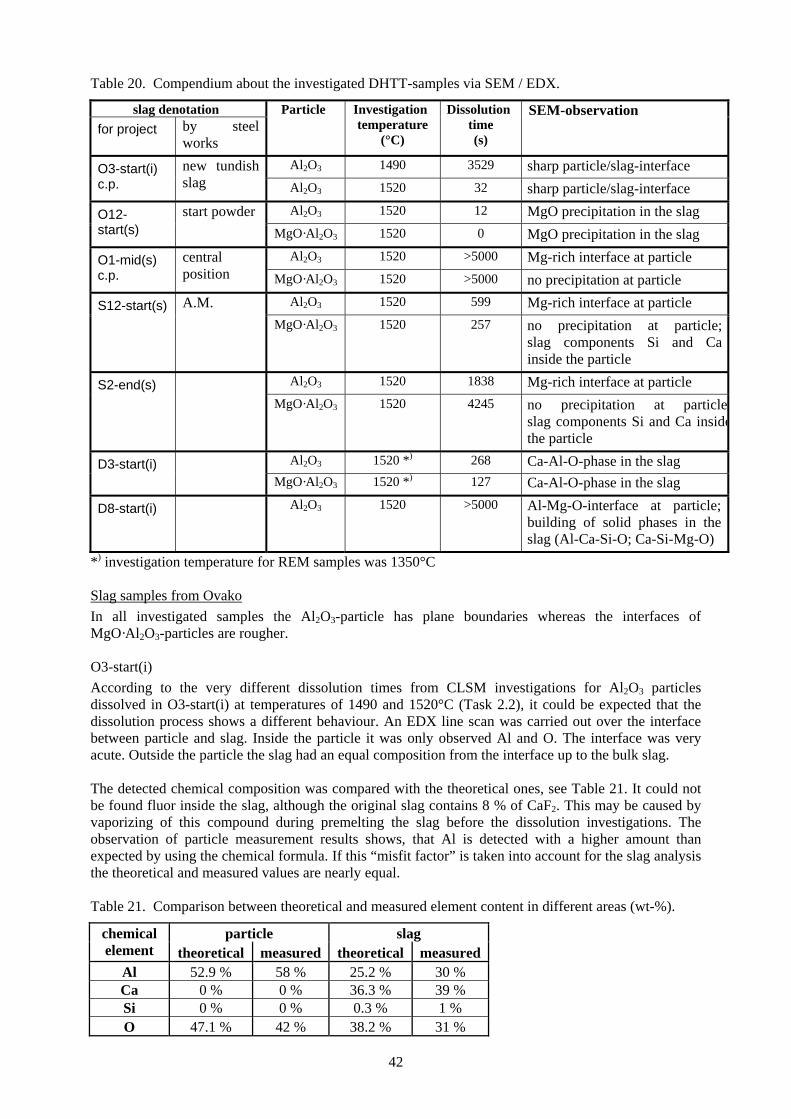
42
Table 20. Compendium about the investigated DHTT-samples via SEM / EDX.
slag denotation for project by steel
works
Particle Investigation temperature
(°C)
Dissolution time (s)
SEM-observation
Al2O3 1490 3529 sharp particle/slag-interface O3-start(i) c.p.
new tundish slag Al2O3 1520 32 sharp particle/slag-interface
Al2O3 1520 12 MgO precipitation in the slag O12-start(s)
start powder MgO·Al2O3 1520 0 MgO precipitation in the slag
Al2O3 1520 >5000 Mg-rich interface at particle O1-mid(s) c.p.
central position MgO·Al2O3 1520 >5000 no precipitation at particle
Al2O3 1520 599 Mg-rich interface at particle S12-start(s) A.M. MgO·Al2O3 1520 257 no precipitation at particle;
slag components Si and Ca inside the particle
Al2O3 1520 1838 Mg-rich interface at particle S2-end(s) MgO·Al2O3 1520 4245 no precipitation at particle
slag components Si and Ca insidethe particle
Al2O3 1520 *) 268 Ca-Al-O-phase in the slag D3-start(i) MgO·Al2O3 1520 *) 127 Ca-Al-O-phase in the slag
D8-start(i) Al2O3 1520 >5000 Al-Mg-O-interface at particle; building of solid phases in the slag (Al-Ca-Si-O; Ca-Si-Mg-O)
*) investigation temperature for REM samples was 1350°C Slag samples from Ovako In all investigated samples the Al2O3-particle has plane boundaries whereas the interfaces of MgO·Al2O3-particles are rougher. O3-start(i) According to the very different dissolution times from CLSM investigations for Al2O3 particles dissolved in O3-start(i) at temperatures of 1490 and 1520°C (Task 2.2), it could be expected that the dissolution process shows a different behaviour. An EDX line scan was carried out over the interface between particle and slag. Inside the particle it was only observed Al and O. The interface was very acute. Outside the particle the slag had an equal composition from the interface up to the bulk slag. The detected chemical composition was compared with the theoretical ones, see Table 21. It could not be found fluor inside the slag, although the original slag contains 8 % of CaF2. This may be caused by vaporizing of this compound during premelting the slag before the dissolution investigations. The observation of particle measurement results shows, that Al is detected with a higher amount than expected by using the chemical formula. If this “misfit factor” is taken into account for the slag analysis the theoretical and measured values are nearly equal. Table 21. Comparison between theoretical and measured element content in different areas (wt-%).
particle slag chemical element theoretical measured theoretical measured
Al 52.9 % 58 % 25.2 % 30 % Ca 0 % 0 % 36.3 % 39 % Si 0 % 0 % 0.3 % 1 % O 47.1 % 42 % 38.2 % 31 %
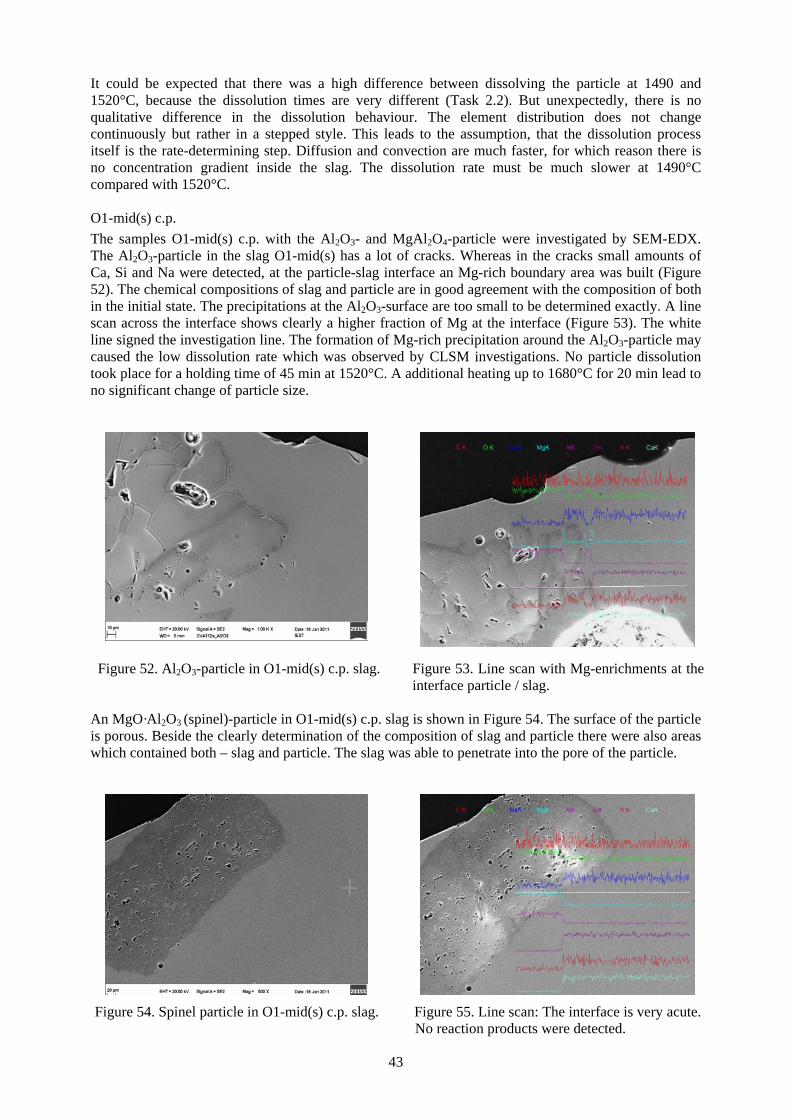
43
It could be expected that there was a high difference between dissolving the particle at 1490 and 1520°C, because the dissolution times are very different (Task 2.2). But unexpectedly, there is no qualitative difference in the dissolution behaviour. The element distribution does not change continuously but rather in a stepped style. This leads to the assumption, that the dissolution process itself is the rate-determining step. Diffusion and convection are much faster, for which reason there is no concentration gradient inside the slag. The dissolution rate must be much slower at 1490°C compared with 1520°C. O1-mid(s) c.p. The samples O1-mid(s) c.p. with the Al2O3- and MgAl2O4-particle were investigated by SEM-EDX. The Al2O3-particle in the slag O1-mid(s) has a lot of cracks. Whereas in the cracks small amounts of Ca, Si and Na were detected, at the particle-slag interface an Mg-rich boundary area was built (Figure 52). The chemical compositions of slag and particle are in good agreement with the composition of both in the initial state. The precipitations at the Al2O3-surface are too small to be determined exactly. A line scan across the interface shows clearly a higher fraction of Mg at the interface (Figure 53). The white line signed the investigation line. The formation of Mg-rich precipitation around the Al2O3-particle may caused the low dissolution rate which was observed by CLSM investigations. No particle dissolution took place for a holding time of 45 min at 1520°C. A additional heating up to 1680°C for 20 min lead to no significant change of particle size.
Figure 52. Al2O3-particle in O1-mid(s) c.p. slag. Figure 53. Line scan with Mg-enrichments at the interface particle / slag.
An MgO·Al2O3 (spinel)-particle in O1-mid(s) c.p. slag is shown in Figure 54. The surface of the particle is porous. Beside the clearly determination of the composition of slag and particle there were also areas which contained both – slag and particle. The slag was able to penetrate into the pore of the particle.
Figure 54. Spinel particle in O1-mid(s) c.p. slag. Figure 55. Line scan: The interface is very acute. No reaction products were detected.
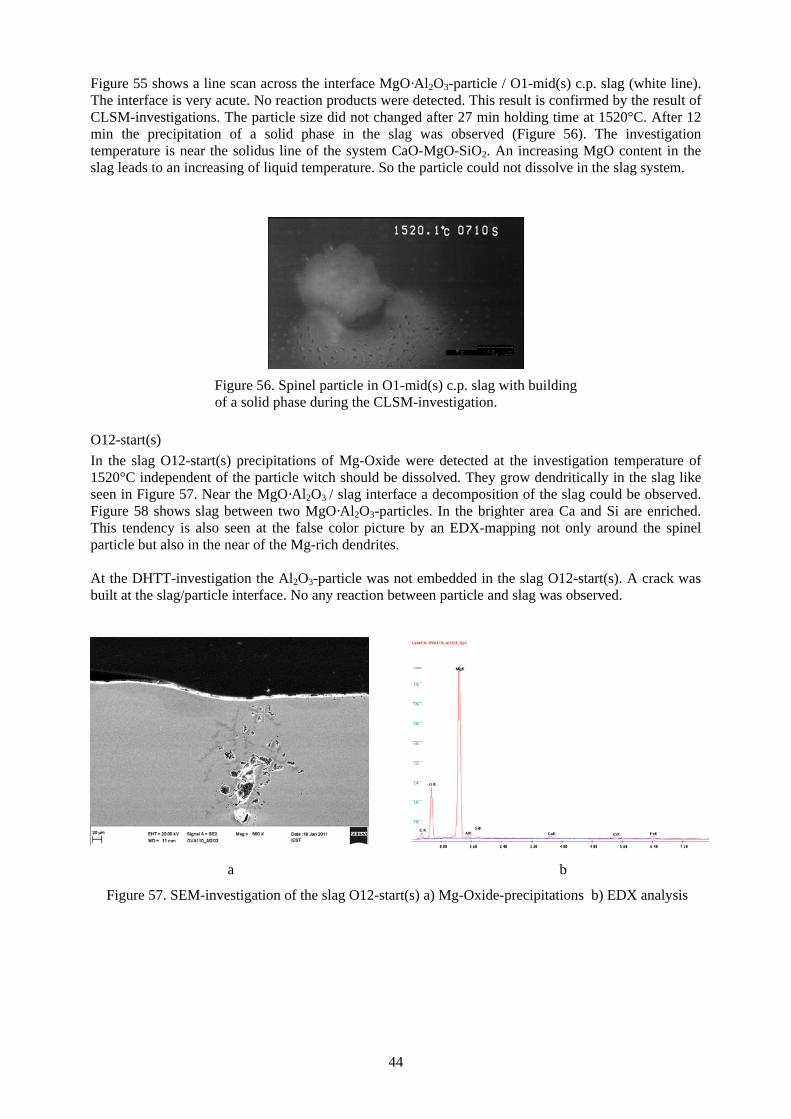
44
Figure 55 shows a line scan across the interface MgO·Al2O3-particle / O1-mid(s) c.p. slag (white line). The interface is very acute. No reaction products were detected. This result is confirmed by the result of CLSM-investigations. The particle size did not changed after 27 min holding time at 1520°C. After 12 min the precipitation of a solid phase in the slag was observed (Figure 56). The investigation temperature is near the solidus line of the system CaO-MgO-SiO2. An increasing MgO content in the slag leads to an increasing of liquid temperature. So the particle could not dissolve in the slag system.
Figure 56. Spinel particle in O1-mid(s) c.p. slag with building
of a solid phase during the CLSM-investigation. O12-start(s) In the slag O12-start(s) precipitations of Mg-Oxide were detected at the investigation temperature of 1520°C independent of the particle witch should be dissolved. They grow dendritically in the slag like seen in Figure 57. Near the MgO·Al2O3 / slag interface a decomposition of the slag could be observed. Figure 58 shows slag between two MgO·Al2O3-particles. In the brighter area Ca and Si are enriched. This tendency is also seen at the false color picture by an EDX-mapping not only around the spinel particle but also in the near of the Mg-rich dendrites. At the DHTT-investigation the Al2O3-particle was not embedded in the slag O12-start(s). A crack was built at the slag/particle interface. No any reaction between particle and slag was observed.
a b
Figure 57. SEM-investigation of the slag O12-start(s) a) Mg-Oxide-precipitations b) EDX analysis
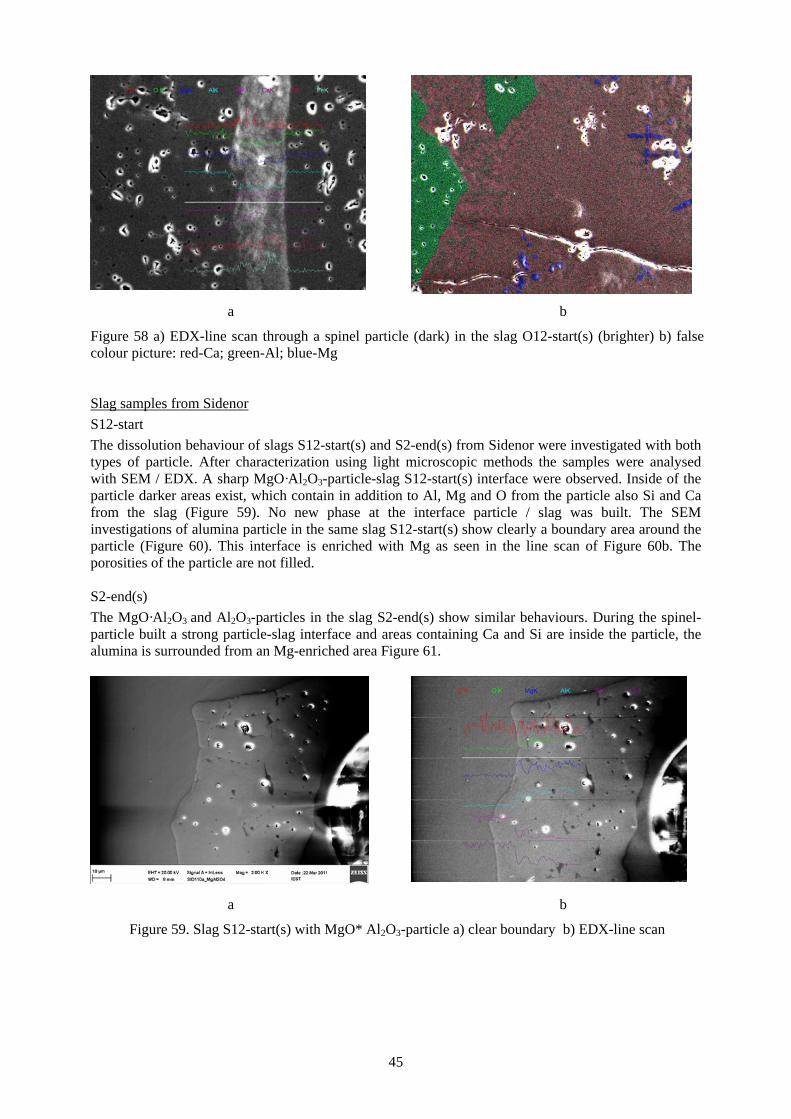
45
a b
Figure 58 a) EDX-line scan through a spinel particle (dark) in the slag O12-start(s) (brighter) b) false colour picture: red-Ca; green-Al; blue-Mg Slag samples from Sidenor S12-start The dissolution behaviour of slags S12-start(s) and S2-end(s) from Sidenor were investigated with both types of particle. After characterization using light microscopic methods the samples were analysed with SEM / EDX. A sharp MgO·Al2O3-particle-slag S12-start(s) interface were observed. Inside of the particle darker areas exist, which contain in addition to Al, Mg and O from the particle also Si and Ca from the slag (Figure 59). No new phase at the interface particle / slag was built. The SEM investigations of alumina particle in the same slag S12-start(s) show clearly a boundary area around the particle (Figure 60). This interface is enriched with Mg as seen in the line scan of Figure 60b. The porosities of the particle are not filled. S2-end(s) The MgO·Al2O3 and Al2O3-particles in the slag S2-end(s) show similar behaviours. During the spinel-particle built a strong particle-slag interface and areas containing Ca and Si are inside the particle, the alumina is surrounded from an Mg-enriched area Figure 61.
a b
Figure 59. Slag S12-start(s) with MgO* Al2O3-particle a) clear boundary b) EDX-line scan
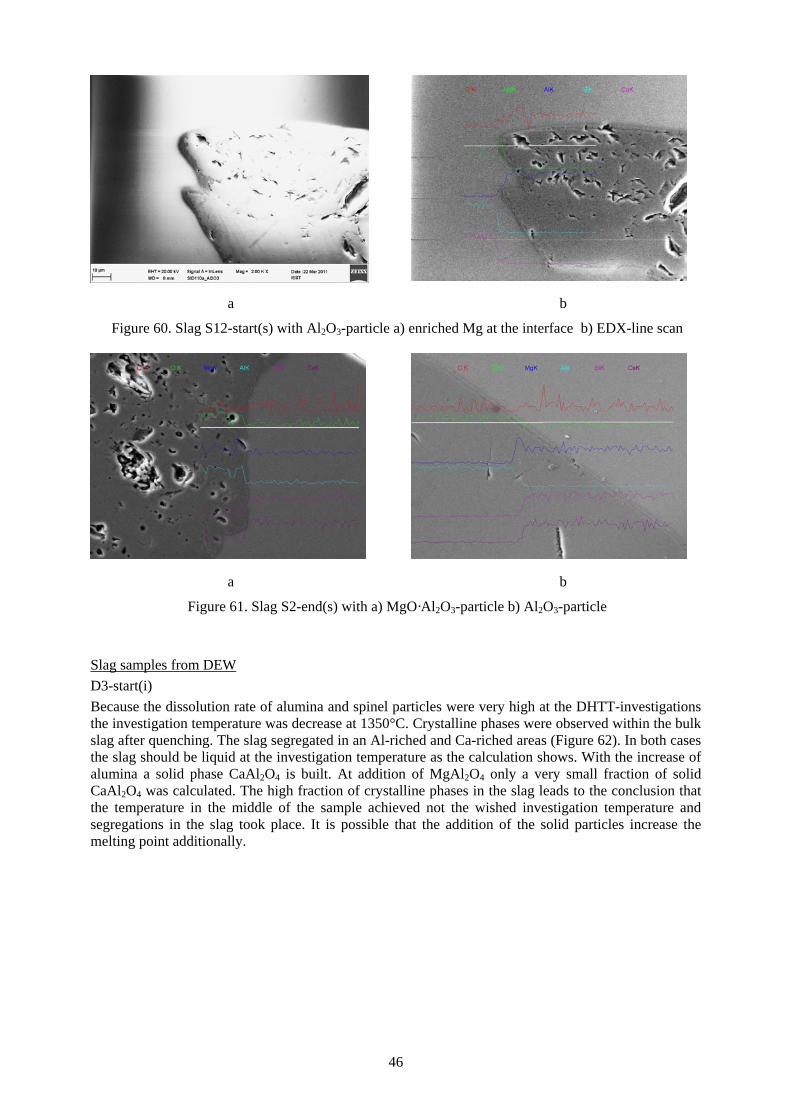
46
a b
Figure 60. Slag S12-start(s) with Al2O3-particle a) enriched Mg at the interface b) EDX-line scan
a b
Figure 61. Slag S2-end(s) with a) MgO·Al2O3-particle b) Al2O3-particle Slag samples from DEW D3-start(i) Because the dissolution rate of alumina and spinel particles were very high at the DHTT-investigations the investigation temperature was decrease at 1350°C. Crystalline phases were observed within the bulk slag after quenching. The slag segregated in an Al-riched and Ca-riched areas (Figure 62). In both cases the slag should be liquid at the investigation temperature as the calculation shows. With the increase of alumina a solid phase CaAl2O4 is built. At addition of MgAl2O4 only a very small fraction of solid CaAl2O4 was calculated. The high fraction of crystalline phases in the slag leads to the conclusion that the temperature in the middle of the sample achieved not the wished investigation temperature and segregations in the slag took place. It is possible that the addition of the solid particles increase the melting point additionally.
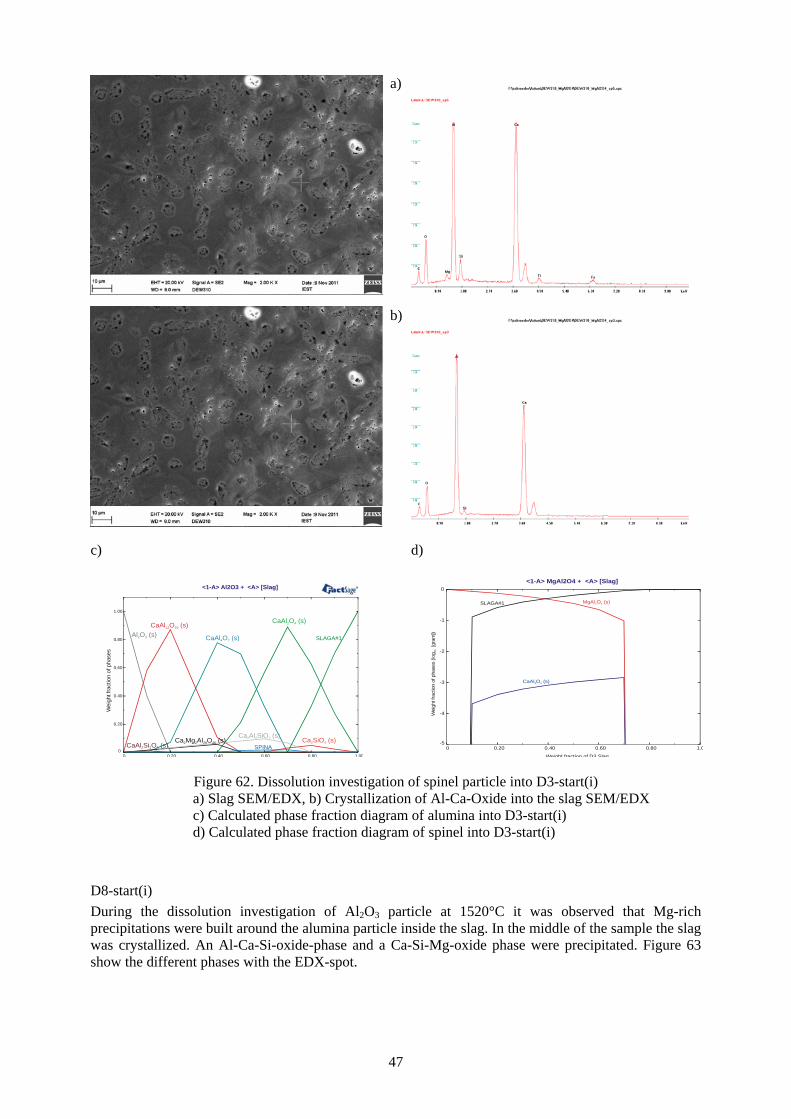
47
a)
b)
c)
SLAGA#1
SPINA
<1-A> Al2O3 + <A> [Slag]
0 0 20 0 40 0 60 0 80 1 000
0.20
0.40
0.60
0.80
1.00
CaAl O (s)12 19
Wei
ght f
ract
ion
of p
hase
s
CaAl O (s)4 7Al O (s)2 3
CaAl O (s)2 4
Ca SiO (s)2 4
Ca Al SiO (s)2 2 7Ca Mg Al O (s)2 2 28 46CaAl Si O (s)2 2 8
d)
MgAl O (s)2 4SLAGA#1
<1-A> MgAl2O4 + <A> [Slag]
Weight fraction of D3 Slag
0 0.20 0.40 0.60 0.80 1.0-5
-4
-3
-2
-1
0
Wei
ght f
ract
ion
of p
hase
s (lo
g [
gram
])10
CaAl O (s)2 4
Figure 62. Dissolution investigation of spinel particle into D3-start(i) a) Slag SEM/EDX, b) Crystallization of Al-Ca-Oxide into the slag SEM/EDX c) Calculated phase fraction diagram of alumina into D3-start(i) d) Calculated phase fraction diagram of spinel into D3-start(i) D8-start(i) During the dissolution investigation of Al2O3 particle at 1520°C it was observed that Mg-rich precipitations were built around the alumina particle inside the slag. In the middle of the sample the slag was crystallized. An Al-Ca-Si-oxide-phase and a Ca-Si-Mg-oxide phase were precipitated. Figure 63 show the different phases with the EDX-spot.
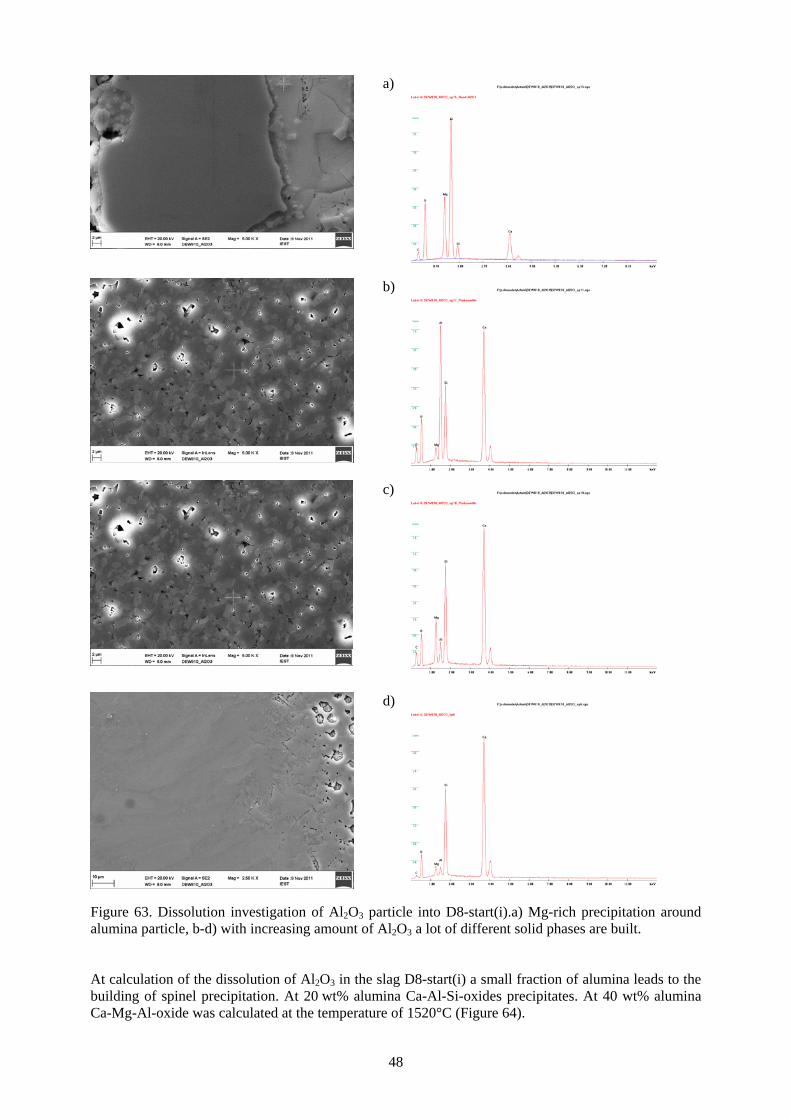
48
a)
b)
c)
d)
Figure 63. Dissolution investigation of Al2O3 particle into D8-start(i).a) Mg-rich precipitation around alumina particle, b-d) with increasing amount of Al2O3 a lot of different solid phases are built. At calculation of the dissolution of Al2O3 in the slag D8-start(i) a small fraction of alumina leads to the building of spinel precipitation. At 20 wt% alumina Ca-Al-Si-oxides precipitates. At 40 wt% alumina Ca-Mg-Al-oxide was calculated at the temperature of 1520°C (Figure 64).
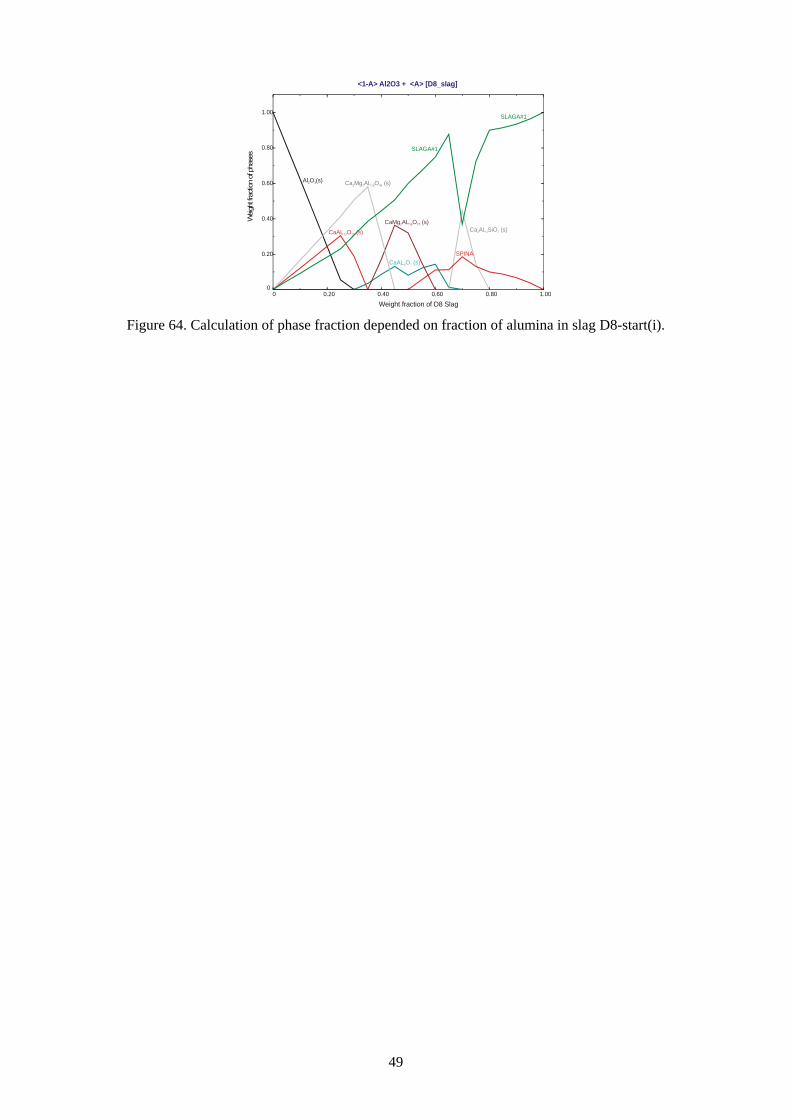
49
SLAGA#1
SLAGA#1
SPINA
<1-A> Al2O3 + <A> [D8_slag]
Weight fraction of D8 Slag0 0.20 0.40 0.60 0.80 1.00
0
0.20
0.40
0.60
0.80
1.00
Al O (s)2 3 Ca Mg AL O (s)2 2 18 46
CaAL O (s)12 19
CaMg AL O (s)2 16 27
CaAL O (s)4 7
Ca AL SiO (s)2 2 7
Figure 64. Calculation of phase fraction depended on fraction of alumina in slag D8-start(i).

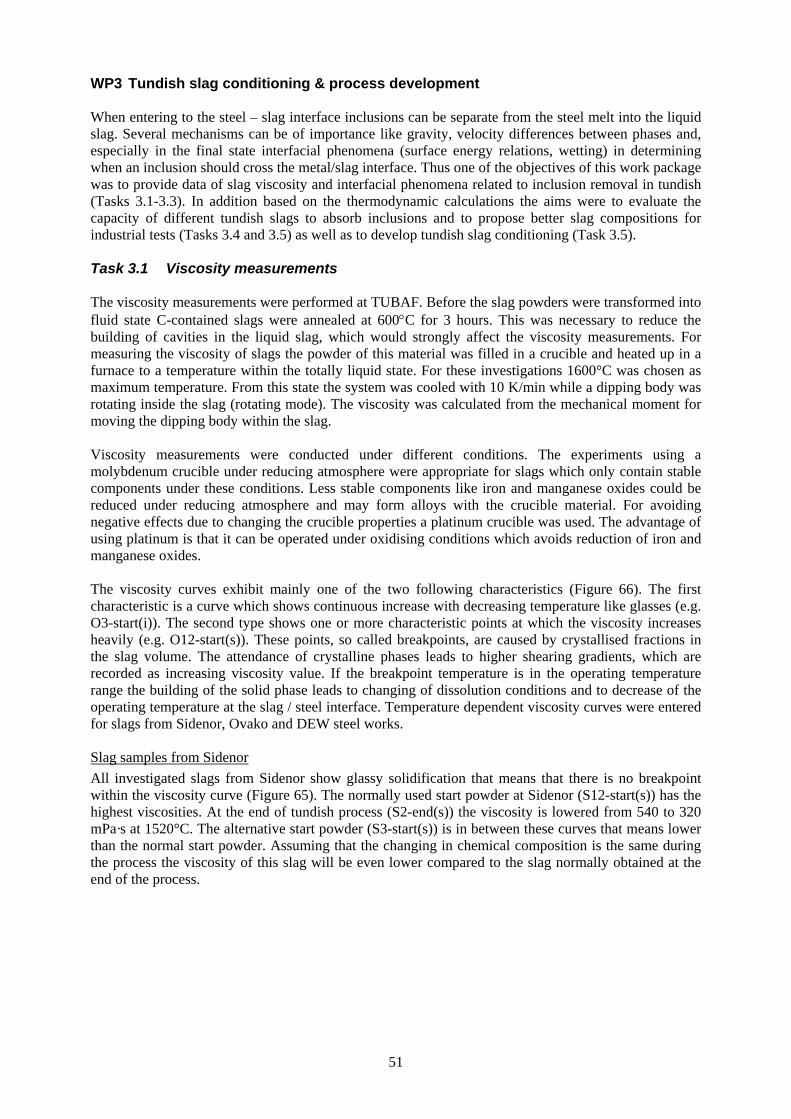
51
WP3 Tundish slag conditioning & process development When entering to the steel – slag interface inclusions can be separate from the steel melt into the liquid slag. Several mechanisms can be of importance like gravity, velocity differences between phases and, especially in the final state interfacial phenomena (surface energy relations, wetting) in determining when an inclusion should cross the metal/slag interface. Thus one of the objectives of this work package was to provide data of slag viscosity and interfacial phenomena related to inclusion removal in tundish (Tasks 3.1-3.3). In addition based on the thermodynamic calculations the aims were to evaluate the capacity of different tundish slags to absorb inclusions and to propose better slag compositions for industrial tests (Tasks 3.4 and 3.5) as well as to develop tundish slag conditioning (Task 3.5). Task 3.1 Viscosity measurements The viscosity measurements were performed at TUBAF. Before the slag powders were transformed into fluid state C-contained slags were annealed at 600°C for 3 hours. This was necessary to reduce the building of cavities in the liquid slag, which would strongly affect the viscosity measurements. For measuring the viscosity of slags the powder of this material was filled in a crucible and heated up in a furnace to a temperature within the totally liquid state. For these investigations 1600°C was chosen as maximum temperature. From this state the system was cooled with 10 K/min while a dipping body was rotating inside the slag (rotating mode). The viscosity was calculated from the mechanical moment for moving the dipping body within the slag. Viscosity measurements were conducted under different conditions. The experiments using a molybdenum crucible under reducing atmosphere were appropriate for slags which only contain stable components under these conditions. Less stable components like iron and manganese oxides could be reduced under reducing atmosphere and may form alloys with the crucible material. For avoiding negative effects due to changing the crucible properties a platinum crucible was used. The advantage of using platinum is that it can be operated under oxidising conditions which avoids reduction of iron and manganese oxides. The viscosity curves exhibit mainly one of the two following characteristics (Figure 66). The first characteristic is a curve which shows continuous increase with decreasing temperature like glasses (e.g. O3-start(i)). The second type shows one or more characteristic points at which the viscosity increases heavily (e.g. O12-start(s)). These points, so called breakpoints, are caused by crystallised fractions in the slag volume. The attendance of crystalline phases leads to higher shearing gradients, which are recorded as increasing viscosity value. If the breakpoint temperature is in the operating temperature range the building of the solid phase leads to changing of dissolution conditions and to decrease of the operating temperature at the slag / steel interface. Temperature dependent viscosity curves were entered for slags from Sidenor, Ovako and DEW steel works. Slag samples from Sidenor All investigated slags from Sidenor show glassy solidification that means that there is no breakpoint within the viscosity curve (Figure 65). The normally used start powder at Sidenor (S12-start(s)) has the highest viscosities. At the end of tundish process (S2-end(s)) the viscosity is lowered from 540 to 320 mPa·s at 1520°C. The alternative start powder (S3-start(s)) is in between these curves that means lower than the normal start powder. Assuming that the changing in chemical composition is the same during the process the viscosity of this slag will be even lower compared to the slag normally obtained at the end of the process.
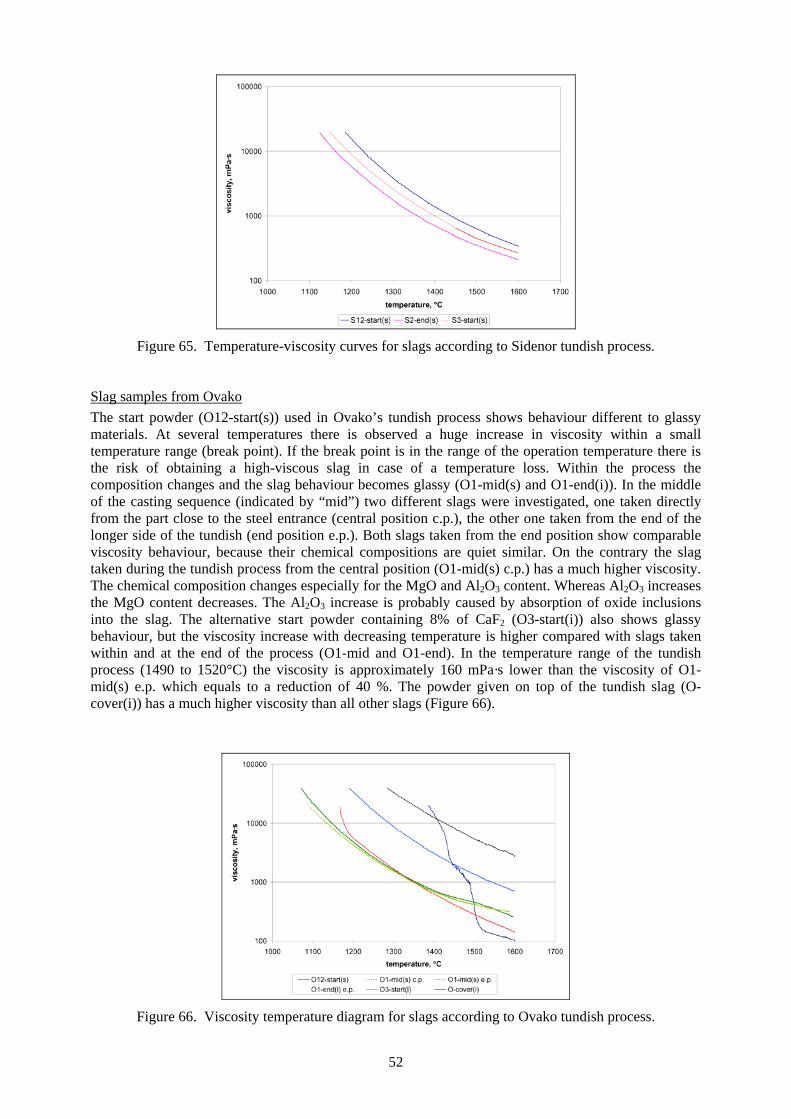
52
Figure 65. Temperature-viscosity curves for slags according to Sidenor tundish process.
Slag samples from Ovako The start powder (O12-start(s)) used in Ovako’s tundish process shows behaviour different to glassy materials. At several temperatures there is observed a huge increase in viscosity within a small temperature range (break point). If the break point is in the range of the operation temperature there is the risk of obtaining a high-viscous slag in case of a temperature loss. Within the process the composition changes and the slag behaviour becomes glassy (O1-mid(s) and O1-end(i)). In the middle of the casting sequence (indicated by “mid”) two different slags were investigated, one taken directly from the part close to the steel entrance (central position c.p.), the other one taken from the end of the longer side of the tundish (end position e.p.). Both slags taken from the end position show comparable viscosity behaviour, because their chemical compositions are quiet similar. On the contrary the slag taken during the tundish process from the central position (O1-mid(s) c.p.) has a much higher viscosity. The chemical composition changes especially for the MgO and Al2O3 content. Whereas Al2O3 increases the MgO content decreases. The Al2O3 increase is probably caused by absorption of oxide inclusions into the slag. The alternative start powder containing 8% of CaF2 (O3-start(i)) also shows glassy behaviour, but the viscosity increase with decreasing temperature is higher compared with slags taken within and at the end of the process (O1-mid and O1-end). In the temperature range of the tundish process (1490 to 1520°C) the viscosity is approximately 160 mPa·s lower than the viscosity of O1-mid(s) e.p. which equals to a reduction of 40 %. The powder given on top of the tundish slag (O-cover(i)) has a much higher viscosity than all other slags (Figure 66).
Figure 66. Viscosity temperature diagram for slags according to Ovako tundish process.
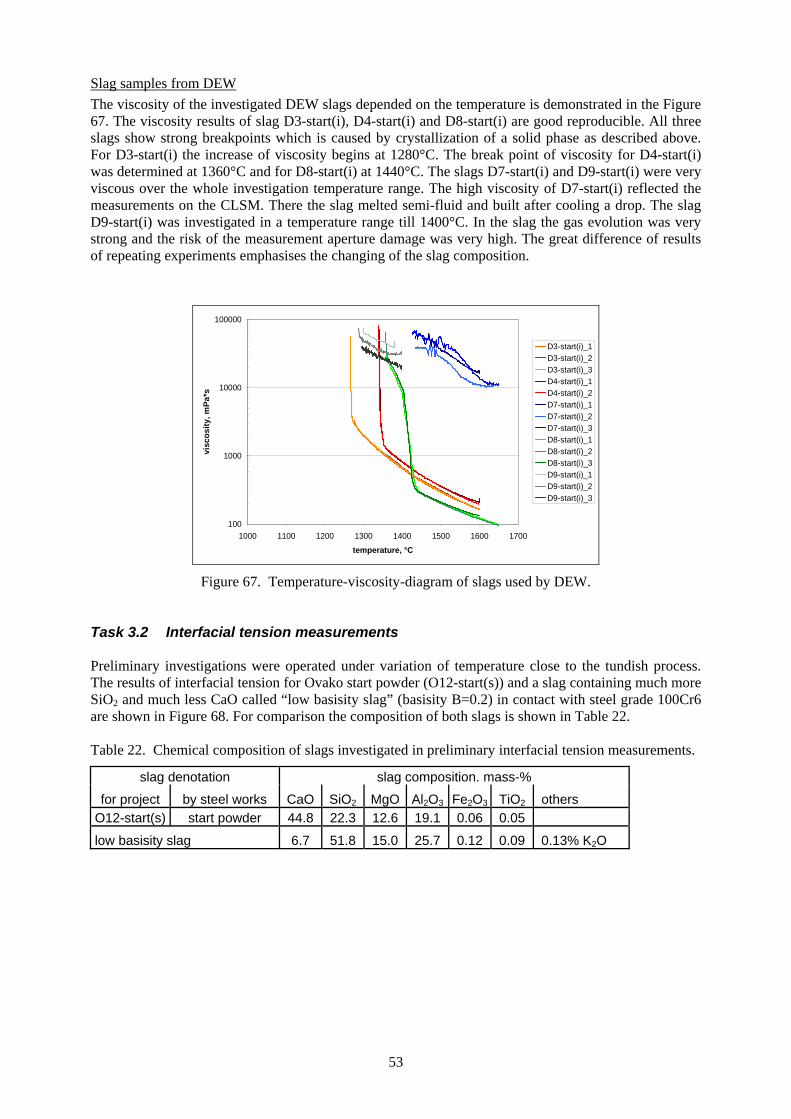
53
Slag samples from DEW The viscosity of the investigated DEW slags depended on the temperature is demonstrated in the Figure 67. The viscosity results of slag D3-start(i), D4-start(i) and D8-start(i) are good reproducible. All three slags show strong breakpoints which is caused by crystallization of a solid phase as described above. For D3-start(i) the increase of viscosity begins at 1280°C. The break point of viscosity for D4-start(i) was determined at 1360°C and for D8-start(i) at 1440°C. The slags D7-start(i) and D9-start(i) were very viscous over the whole investigation temperature range. The high viscosity of D7-start(i) reflected the measurements on the CLSM. There the slag melted semi-fluid and built after cooling a drop. The slag D9-start(i) was investigated in a temperature range till 1400°C. In the slag the gas evolution was very strong and the risk of the measurement aperture damage was very high. The great difference of results of repeating experiments emphasises the changing of the slag composition.
100
1000
10000
100000
1000 1100 1200 1300 1400 1500 1600 1700
temperature, °C
visc
osity
, mPa
*s
D3-start(i)_1D3-start(i)_2D3-start(i)_3D4-start(i)_1D4-start(i)_2D7-start(i)_1D7-start(i)_2D7-start(i)_3D8-start(i)_1D8-start(i)_2D8-start(i)_3D9-start(i)_1D9-start(i)_2D9-start(i)_3
Figure 67. Temperature-viscosity-diagram of slags used by DEW.
Task 3.2 Interfacial tension measurements Preliminary investigations were operated under variation of temperature close to the tundish process. The results of interfacial tension for Ovako start powder (O12-start(s)) and a slag containing much more SiO2 and much less CaO called “low basisity slag” (basisity B=0.2) in contact with steel grade 100Cr6 are shown in Figure 68. For comparison the composition of both slags is shown in Table 22. Table 22. Chemical composition of slags investigated in preliminary interfacial tension measurements.
slag denotation slag composition. mass-%
for project by steel works CaO SiO2 MgO Al2O3 Fe2O3 TiO2 others O12-start(s) start powder 44.8 22.3 12.6 19.1 0.06 0.05
low basisity slag 6.7 51.8 15.0 25.7 0.12 0.09 0.13% K2O
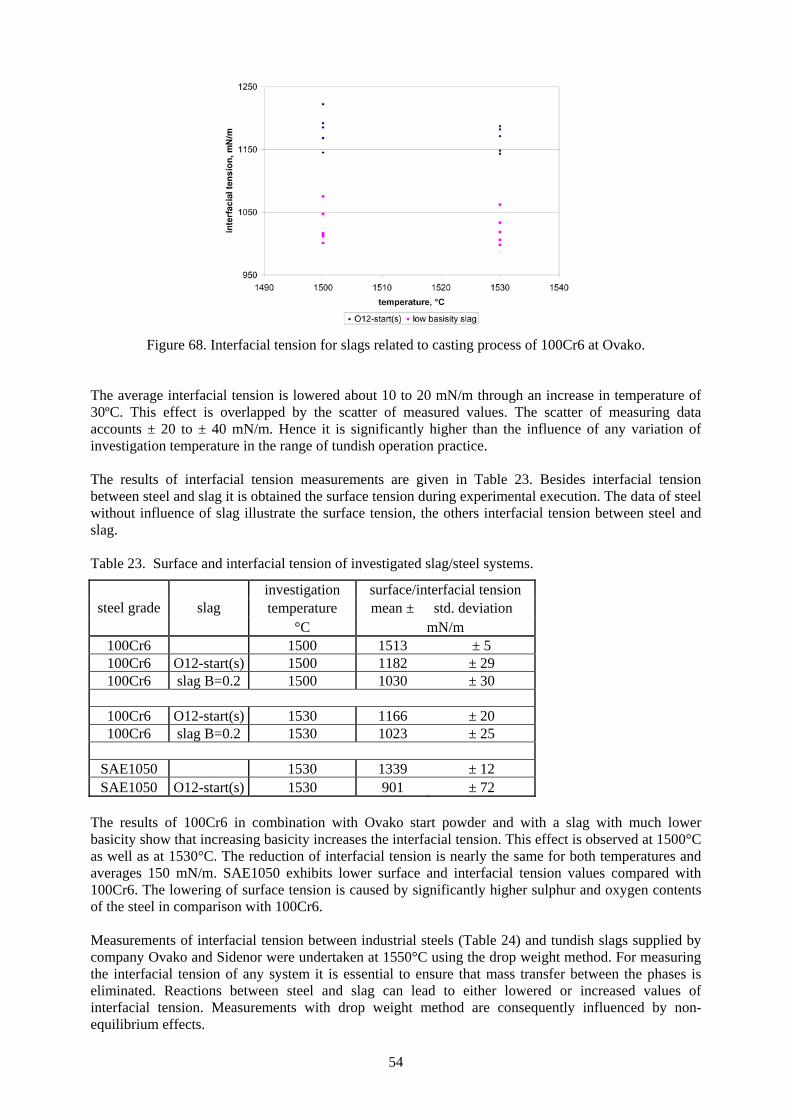
54
Figure 68. Interfacial tension for slags related to casting process of 100Cr6 at Ovako.
The average interfacial tension is lowered about 10 to 20 mN/m through an increase in temperature of 30ºC. This effect is overlapped by the scatter of measured values. The scatter of measuring data accounts ± 20 to ± 40 mN/m. Hence it is significantly higher than the influence of any variation of investigation temperature in the range of tundish operation practice. The results of interfacial tension measurements are given in Table 23. Besides interfacial tension between steel and slag it is obtained the surface tension during experimental execution. The data of steel without influence of slag illustrate the surface tension, the others interfacial tension between steel and slag. Table 23. Surface and interfacial tension of investigated slag/steel systems.
investigation surface/interfacial tension temperature mean ± std. deviation steel grade slag
°C mN/m 100Cr6 1500 1513 ± 5 100Cr6 O12-start(s) 1500 1182 ± 29 100Cr6 slag B=0.2 1500 1030 ± 30
100Cr6 O12-start(s) 1530 1166 ± 20 100Cr6 slag B=0.2 1530 1023 ± 25
SAE1050 1530 1339 ± 12 SAE1050 O12-start(s) 1530 901 ± 72
The results of 100Cr6 in combination with Ovako start powder and with a slag with much lower basicity show that increasing basicity increases the interfacial tension. This effect is observed at 1500°C as well as at 1530°C. The reduction of interfacial tension is nearly the same for both temperatures and averages 150 mN/m. SAE1050 exhibits lower surface and interfacial tension values compared with 100Cr6. The lowering of surface tension is caused by significantly higher sulphur and oxygen contents of the steel in comparison with 100Cr6. Measurements of interfacial tension between industrial steels (Table 24) and tundish slags supplied by company Ovako and Sidenor were undertaken at 1550°C using the drop weight method. For measuring the interfacial tension of any system it is essential to ensure that mass transfer between the phases is eliminated. Reactions between steel and slag can lead to either lowered or increased values of interfacial tension. Measurements with drop weight method are consequently influenced by non-equilibrium effects.
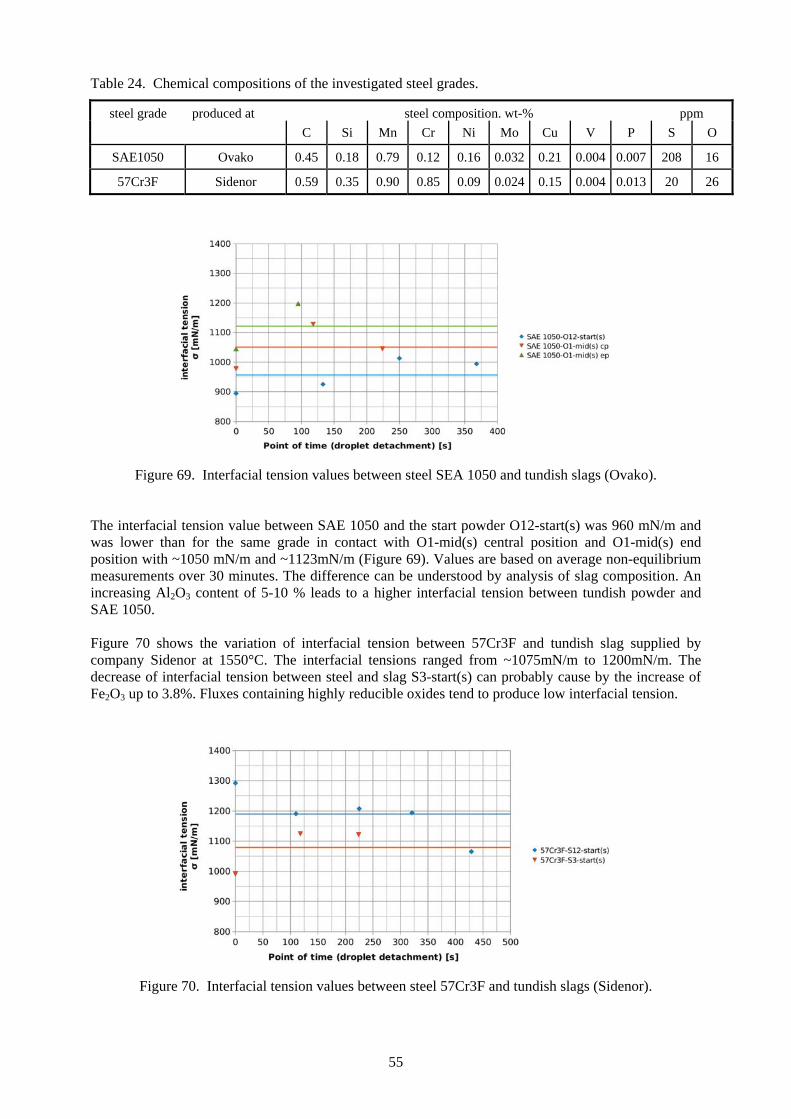
55
Table 24. Chemical compositions of the investigated steel grades.
steel grade produced at steel composition. wt-% ppm C Si Mn Cr Ni Mo Cu V P S O
SAE1050 Ovako 0.45 0.18 0.79 0.12 0.16 0.032 0.21 0.004 0.007 208 16
57Cr3F Sidenor 0.59 0.35 0.90 0.85 0.09 0.024 0.15 0.004 0.013 20 26
Figure 69. Interfacial tension values between steel SEA 1050 and tundish slags (Ovako).
The interfacial tension value between SAE 1050 and the start powder O12-start(s) was 960 mN/m and was lower than for the same grade in contact with O1-mid(s) central position and O1-mid(s) end position with ~1050 mN/m and ~1123mN/m (Figure 69). Values are based on average non-equilibrium measurements over 30 minutes. The difference can be understood by analysis of slag composition. An increasing Al2O3 content of 5-10 % leads to a higher interfacial tension between tundish powder and SAE 1050. Figure 70 shows the variation of interfacial tension between 57Cr3F and tundish slag supplied by company Sidenor at 1550°C. The interfacial tensions ranged from ~1075mN/m to 1200mN/m. The decrease of interfacial tension between steel and slag S3-start(s) can probably cause by the increase of Fe2O3 up to 3.8%. Fluxes containing highly reducible oxides tend to produce low interfacial tension.
Figure 70. Interfacial tension values between steel 57Cr3F and tundish slags (Sidenor).
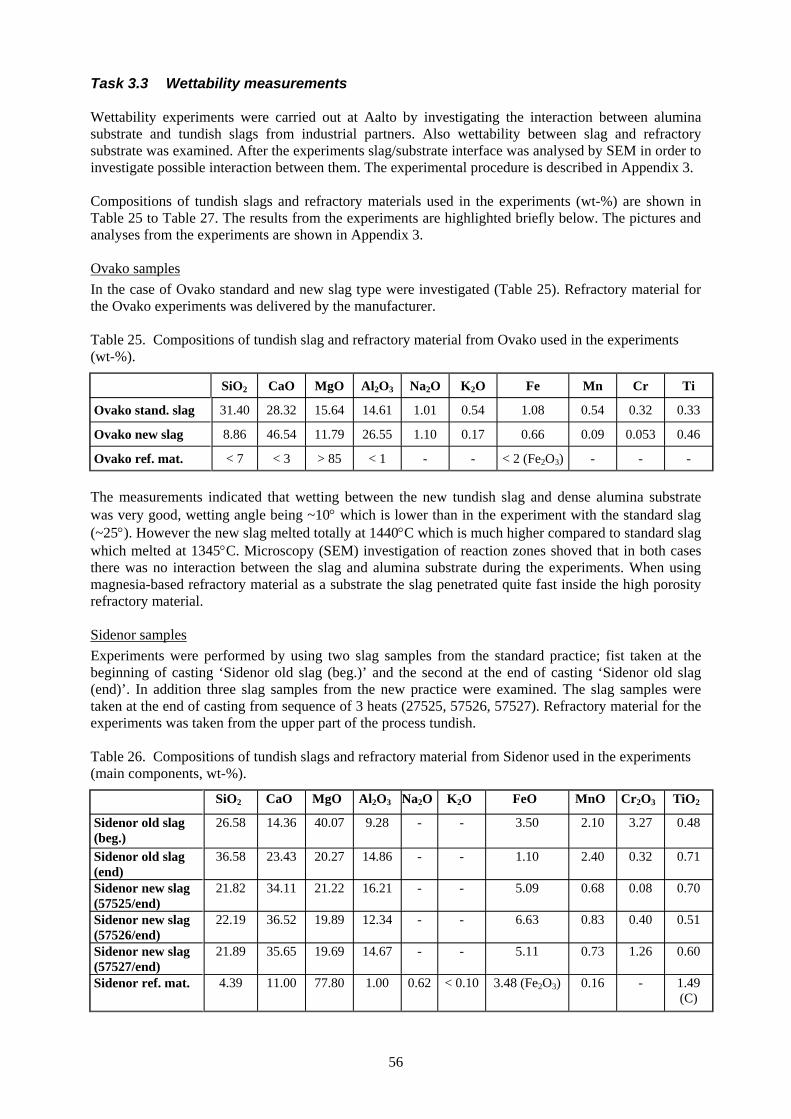
56
Task 3.3 Wettability measurements Wettability experiments were carried out at Aalto by investigating the interaction between alumina substrate and tundish slags from industrial partners. Also wettability between slag and refractory substrate was examined. After the experiments slag/substrate interface was analysed by SEM in order to investigate possible interaction between them. The experimental procedure is described in Appendix 3. Compositions of tundish slags and refractory materials used in the experiments (wt-%) are shown in Table 25 to Table 27. The results from the experiments are highlighted briefly below. The pictures and analyses from the experiments are shown in Appendix 3. Ovako samples In the case of Ovako standard and new slag type were investigated (Table 25). Refractory material for the Ovako experiments was delivered by the manufacturer. Table 25. Compositions of tundish slag and refractory material from Ovako used in the experiments (wt-%).
SiO2 CaO MgO Al2O3 Na2O K2O Fe Mn Cr Ti
Ovako stand. slag 31.40 28.32 15.64 14.61 1.01 0.54 1.08 0.54 0.32 0.33
Ovako new slag 8.86 46.54 11.79 26.55 1.10 0.17 0.66 0.09 0.053 0.46
Ovako ref. mat. < 7 < 3 > 85 < 1 - - < 2 (Fe2O3) - - -
The measurements indicated that wetting between the new tundish slag and dense alumina substrate was very good, wetting angle being ~10° which is lower than in the experiment with the standard slag (~25°). However the new slag melted totally at 1440°C which is much higher compared to standard slag which melted at 1345°C. Microscopy (SEM) investigation of reaction zones shoved that in both cases there was no interaction between the slag and alumina substrate during the experiments. When using magnesia-based refractory material as a substrate the slag penetrated quite fast inside the high porosity refractory material. Sidenor samples Experiments were performed by using two slag samples from the standard practice; fist taken at the beginning of casting ‘Sidenor old slag (beg.)’ and the second at the end of casting ‘Sidenor old slag (end)’. In addition three slag samples from the new practice were examined. The slag samples were taken at the end of casting from sequence of 3 heats (27525, 57526, 57527). Refractory material for the experiments was taken from the upper part of the process tundish. Table 26. Compositions of tundish slags and refractory material from Sidenor used in the experiments (main components, wt-%).
SiO2 CaO MgO Al2O3 Na2O K2O FeO MnO Cr2O3 TiO2
Sidenor old slag (beg.)
26.58 14.36 40.07 9.28 - - 3.50 2.10 3.27 0.48
Sidenor old slag (end)
36.58 23.43 20.27 14.86 - - 1.10 2.40 0.32 0.71
Sidenor new slag (57525/end)
21.82 34.11 21.22 16.21 - - 5.09 0.68 0.08 0.70
Sidenor new slag (57526/end)
22.19 36.52 19.89 12.34 - - 6.63 0.83 0.40 0.51
Sidenor new slag (57527/end)
21.89 35.65 19.69 14.67 - - 5.11 0.73 1.26 0.60
Sidenor ref. mat. 4.39 11.00 77.80 1.00 0.62 < 0.10 3.48 (Fe2O3) 0.16 - 1.49 (C)
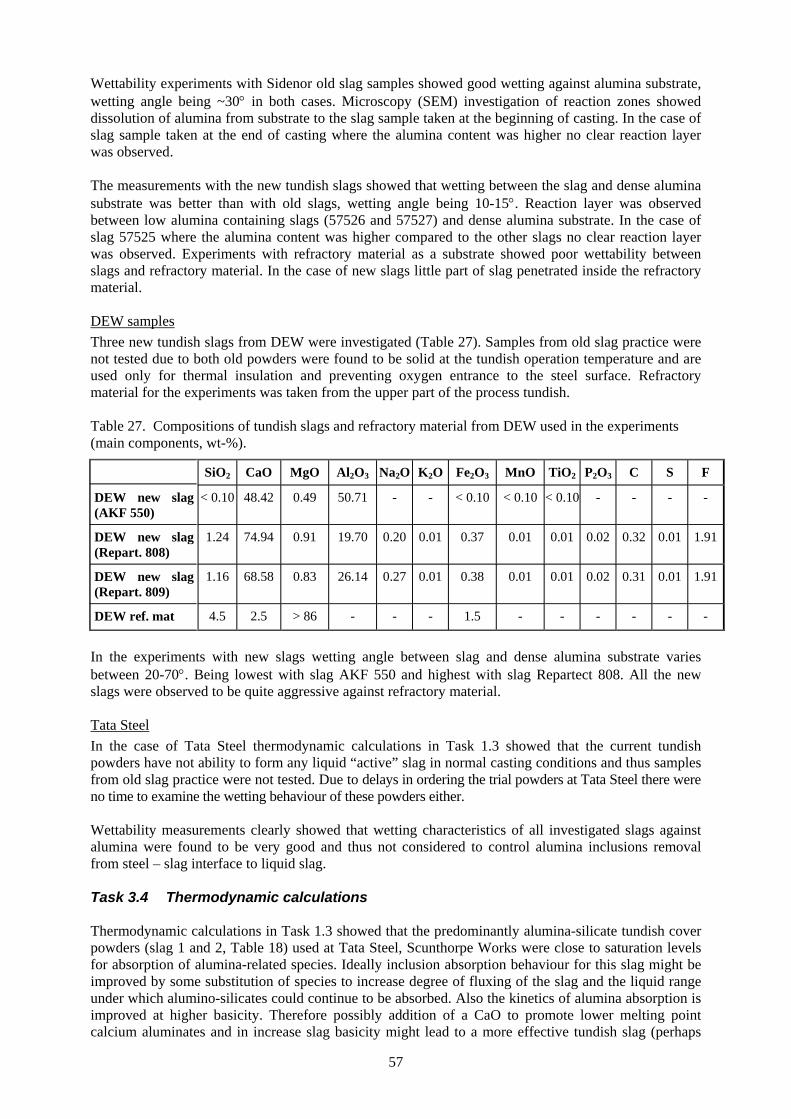
57
Wettability experiments with Sidenor old slag samples showed good wetting against alumina substrate, wetting angle being ~30° in both cases. Microscopy (SEM) investigation of reaction zones showed dissolution of alumina from substrate to the slag sample taken at the beginning of casting. In the case of slag sample taken at the end of casting where the alumina content was higher no clear reaction layer was observed. The measurements with the new tundish slags showed that wetting between the slag and dense alumina substrate was better than with old slags, wetting angle being 10-15°. Reaction layer was observed between low alumina containing slags (57526 and 57527) and dense alumina substrate. In the case of slag 57525 where the alumina content was higher compared to the other slags no clear reaction layer was observed. Experiments with refractory material as a substrate showed poor wettability between slags and refractory material. In the case of new slags little part of slag penetrated inside the refractory material. DEW samples Three new tundish slags from DEW were investigated (Table 27). Samples from old slag practice were not tested due to both old powders were found to be solid at the tundish operation temperature and are used only for thermal insulation and preventing oxygen entrance to the steel surface. Refractory material for the experiments was taken from the upper part of the process tundish. Table 27. Compositions of tundish slags and refractory material from DEW used in the experiments (main components, wt-%).
SiO2 CaO MgO Al2O3 Na2O K2O Fe2O3 MnO TiO2 P2O3 C S F
DEW new slag (AKF 550)
< 0.10 48.42 0.49 50.71 - - < 0.10 < 0.10 < 0.10 - - - -
DEW new slag (Repart. 808)
1.24 74.94 0.91 19.70 0.20 0.01 0.37 0.01 0.01 0.02 0.32 0.01 1.91
DEW new slag (Repart. 809)
1.16 68.58 0.83 26.14 0.27 0.01 0.38 0.01 0.01 0.02 0.31 0.01 1.91
DEW ref. mat 4.5 2.5 > 86 - - - 1.5 - - - - - -
In the experiments with new slags wetting angle between slag and dense alumina substrate varies between 20-70°. Being lowest with slag AKF 550 and highest with slag Repartect 808. All the new slags were observed to be quite aggressive against refractory material. Tata Steel In the case of Tata Steel thermodynamic calculations in Task 1.3 showed that the current tundish powders have not ability to form any liquid “active” slag in normal casting conditions and thus samples from old slag practice were not tested. Due to delays in ordering the trial powders at Tata Steel there were no time to examine the wetting behaviour of these powders either. Wettability measurements clearly showed that wetting characteristics of all investigated slags against alumina were found to be very good and thus not considered to control alumina inclusions removal from steel – slag interface to liquid slag. Task 3.4 Thermodynamic calculations Thermodynamic calculations in Task 1.3 showed that the predominantly alumina-silicate tundish cover powders (slag 1 and 2, Table 18) used at Tata Steel, Scunthorpe Works were close to saturation levels for absorption of alumina-related species. Ideally inclusion absorption behaviour for this slag might be improved by some substitution of species to increase degree of fluxing of the slag and the liquid range under which alumino-silicates could continue to be absorbed. Also the kinetics of alumina absorption is improved at higher basicity. Therefore possibly addition of a CaO to promote lower melting point calcium aluminates and in increase slag basicity might lead to a more effective tundish slag (perhaps
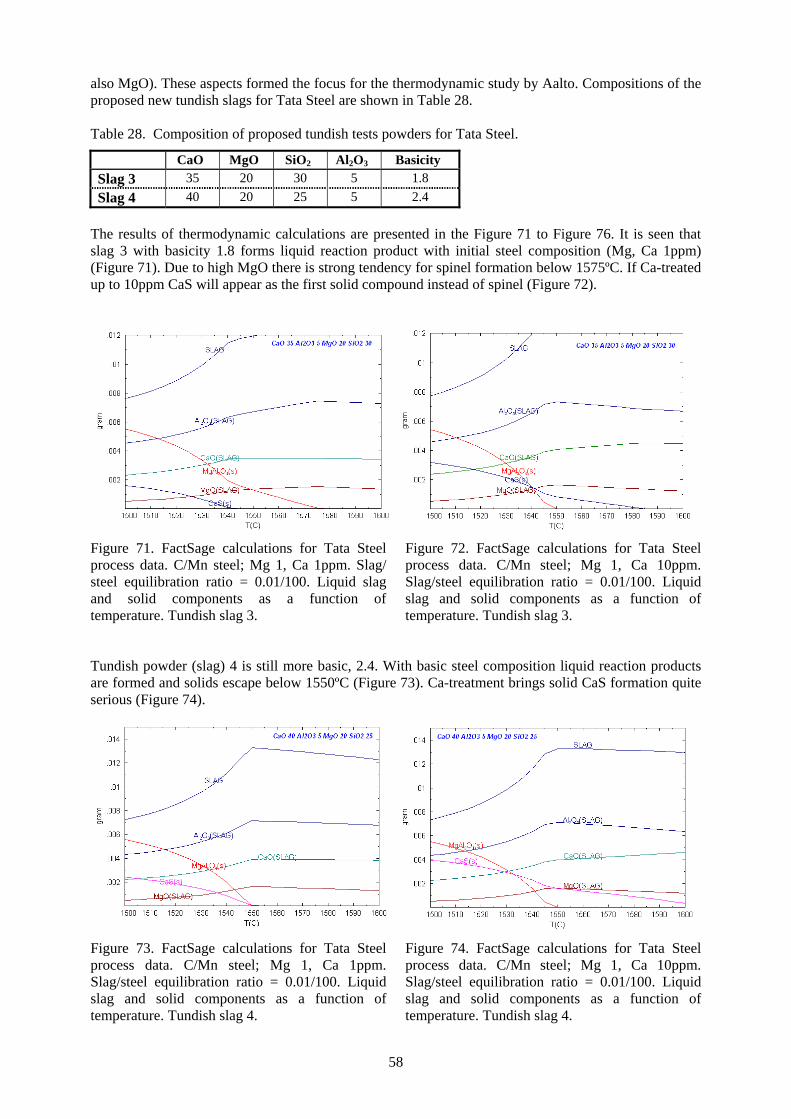
58
also MgO). These aspects formed the focus for the thermodynamic study by Aalto. Compositions of the proposed new tundish slags for Tata Steel are shown in Table 28. Table 28. Composition of proposed tundish tests powders for Tata Steel.
CaO MgO SiO2 Al2O3 Basicity Slag 3 35 20 30 5 1.8 Slag 4 40 20 25 5 2.4
The results of thermodynamic calculations are presented in the Figure 71 to Figure 76. It is seen that slag 3 with basicity 1.8 forms liquid reaction product with initial steel composition (Mg, Ca 1ppm) (Figure 71). Due to high MgO there is strong tendency for spinel formation below 1575ºC. If Ca-treated up to 10ppm CaS will appear as the first solid compound instead of spinel (Figure 72).
Figure 71. FactSage calculations for Tata Steel process data. C/Mn steel; Mg 1, Ca 1ppm. Slag/ steel equilibration ratio = 0.01/100. Liquid slag and solid components as a function of temperature. Tundish slag 3.
Figure 72. FactSage calculations for Tata Steel process data. C/Mn steel; Mg 1, Ca 10ppm. Slag/steel equilibration ratio = 0.01/100. Liquid slag and solid components as a function of temperature. Tundish slag 3.
Tundish powder (slag) 4 is still more basic, 2.4. With basic steel composition liquid reaction products are formed and solids escape below 1550ºC (Figure 73). Ca-treatment brings solid CaS formation quite serious (Figure 74).
Figure 73. FactSage calculations for Tata Steel process data. C/Mn steel; Mg 1, Ca 1ppm. Slag/steel equilibration ratio = 0.01/100. Liquid slag and solid components as a function of temperature. Tundish slag 4.
Figure 74. FactSage calculations for Tata Steel process data. C/Mn steel; Mg 1, Ca 10ppm. Slag/steel equilibration ratio = 0.01/100. Liquid slag and solid components as a function of temperature. Tundish slag 4.
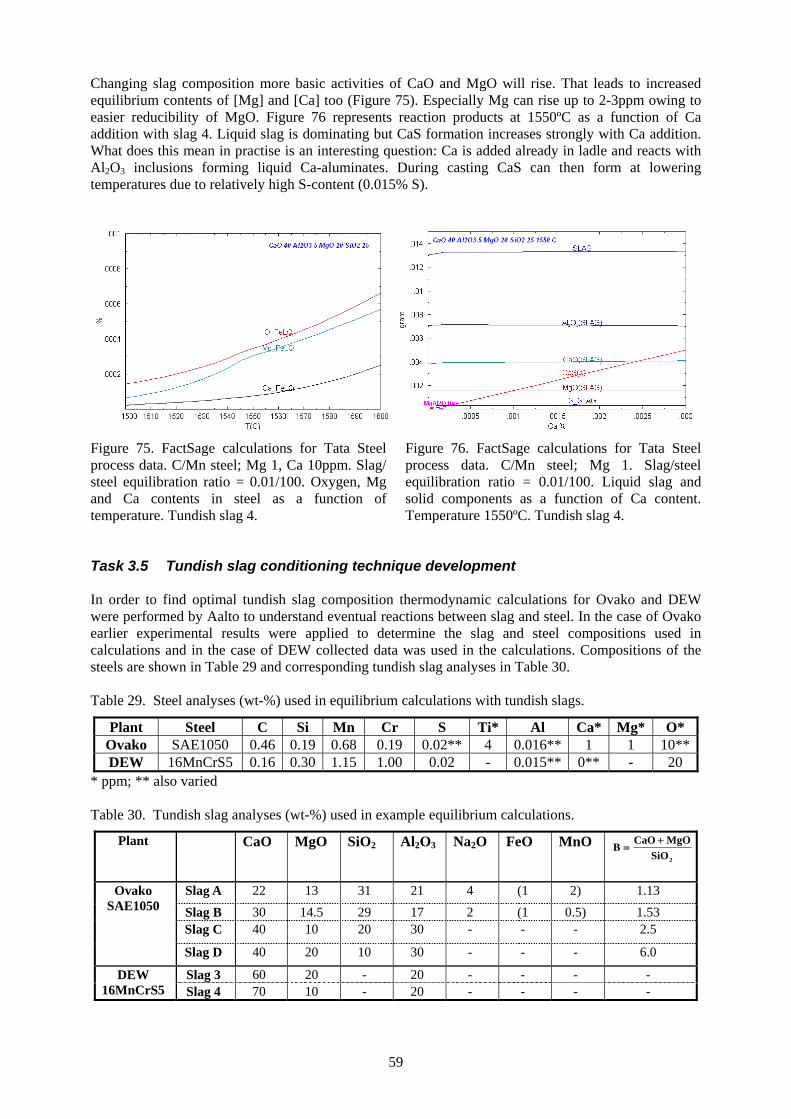
59
Changing slag composition more basic activities of CaO and MgO will rise. That leads to increased equilibrium contents of [Mg] and [Ca] too (Figure 75). Especially Mg can rise up to 2-3ppm owing to easier reducibility of MgO. Figure 76 represents reaction products at 1550ºC as a function of Ca addition with slag 4. Liquid slag is dominating but CaS formation increases strongly with Ca addition. What does this mean in practise is an interesting question: Ca is added already in ladle and reacts with Al2O3 inclusions forming liquid Ca-aluminates. During casting CaS can then form at lowering temperatures due to relatively high S-content (0.015% S).
Figure 75. FactSage calculations for Tata Steel process data. C/Mn steel; Mg 1, Ca 10ppm. Slag/ steel equilibration ratio = 0.01/100. Oxygen, Mg and Ca contents in steel as a function of temperature. Tundish slag 4.
Figure 76. FactSage calculations for Tata Steel process data. C/Mn steel; Mg 1. Slag/steel equilibration ratio = 0.01/100. Liquid slag and solid components as a function of Ca content. Temperature 1550ºC. Tundish slag 4.
Task 3.5 Tundish slag conditioning technique development In order to find optimal tundish slag composition thermodynamic calculations for Ovako and DEW were performed by Aalto to understand eventual reactions between slag and steel. In the case of Ovako earlier experimental results were applied to determine the slag and steel compositions used in calculations and in the case of DEW collected data was used in the calculations. Compositions of the steels are shown in Table 29 and corresponding tundish slag analyses in Table 30. Table 29. Steel analyses (wt-%) used in equilibrium calculations with tundish slags.
Plant Steel C Si Mn Cr S Ti* Al Ca* Mg* O* Ovako SAE1050 0.46 0.19 0.68 0.19 0.02** 4 0.016** 1 1 10**DEW 16MnCrS5 0.16 0.30 1.15 1.00 0.02 - 0.015** 0** - 20
* ppm; ** also varied Table 30. Tundish slag analyses (wt-%) used in example equilibrium calculations.
Plant CaO MgO SiO2 Al2O3 Na2O FeO MnO 2SiO
MgOCaOB
+=
Slag A 22 13 31 21 4 (1 2) 1.13
Slag B 30 14.5 29 17 2 (1 0.5) 1.53 Slag C 40 10 20 30 - - - 2.5
Ovako SAE1050
Slag D 40 20 10 30 - - - 6.0
Slag 3 60 20 - 20 - - - - DEW 16MnCrS5 Slag 4 70 10 - 20 - - - -
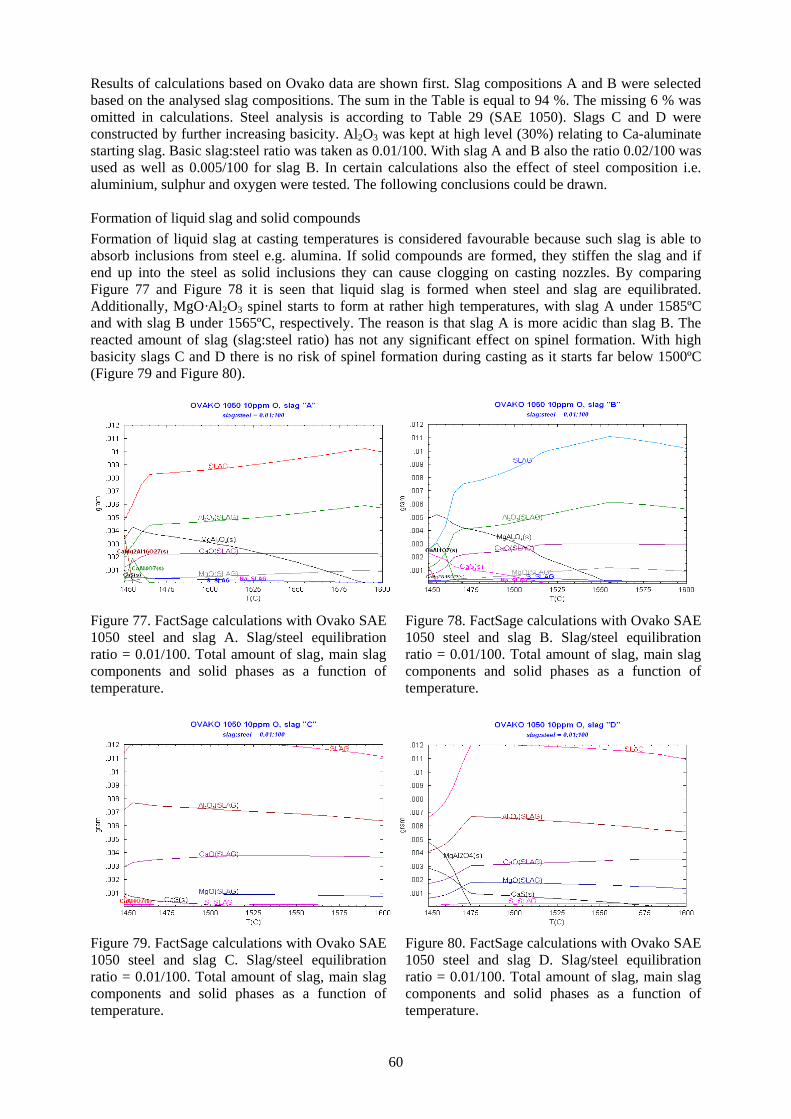
60
Results of calculations based on Ovako data are shown first. Slag compositions A and B were selected based on the analysed slag compositions. The sum in the Table is equal to 94 %. The missing 6 % was omitted in calculations. Steel analysis is according to Table 29 (SAE 1050). Slags C and D were constructed by further increasing basicity. Al2O3 was kept at high level (30%) relating to Ca-aluminate starting slag. Basic slag:steel ratio was taken as 0.01/100. With slag A and B also the ratio 0.02/100 was used as well as 0.005/100 for slag B. In certain calculations also the effect of steel composition i.e. aluminium, sulphur and oxygen were tested. The following conclusions could be drawn. Formation of liquid slag and solid compounds Formation of liquid slag at casting temperatures is considered favourable because such slag is able to absorb inclusions from steel e.g. alumina. If solid compounds are formed, they stiffen the slag and if end up into the steel as solid inclusions they can cause clogging on casting nozzles. By comparing Figure 77 and Figure 78 it is seen that liquid slag is formed when steel and slag are equilibrated. Additionally, MgO·Al2O3 spinel starts to form at rather high temperatures, with slag A under 1585ºC and with slag B under 1565ºC, respectively. The reason is that slag A is more acidic than slag B. The reacted amount of slag (slag:steel ratio) has not any significant effect on spinel formation. With high basicity slags C and D there is no risk of spinel formation during casting as it starts far below 1500ºC (Figure 79 and Figure 80).
Figure 77. FactSage calculations with Ovako SAE 1050 steel and slag A. Slag/steel equilibration ratio = 0.01/100. Total amount of slag, main slag components and solid phases as a function of temperature.
Figure 78. FactSage calculations with Ovako SAE 1050 steel and slag B. Slag/steel equilibration ratio = 0.01/100. Total amount of slag, main slag components and solid phases as a function of temperature.
Figure 79. FactSage calculations with Ovako SAE 1050 steel and slag C. Slag/steel equilibration ratio = 0.01/100. Total amount of slag, main slag components and solid phases as a function of temperature.
Figure 80. FactSage calculations with Ovako SAE 1050 steel and slag D. Slag/steel equilibration ratio = 0.01/100. Total amount of slag, main slag components and solid phases as a function of temperature.
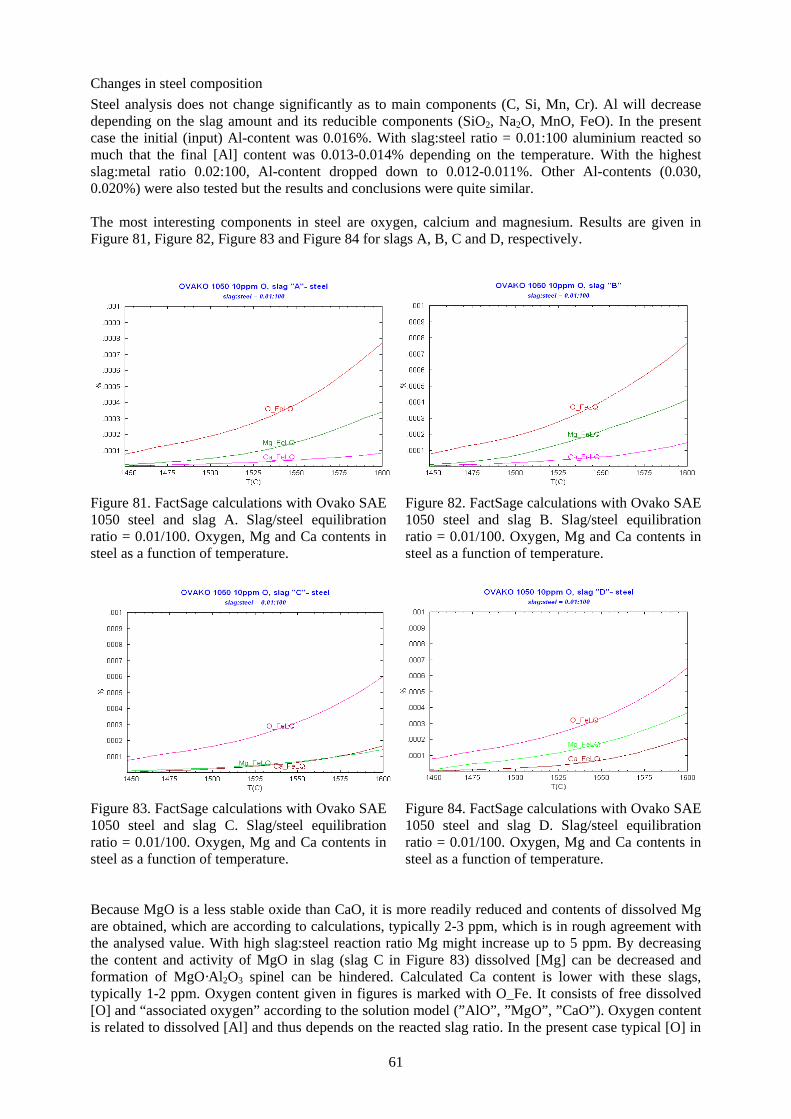
61
Changes in steel composition Steel analysis does not change significantly as to main components (C, Si, Mn, Cr). Al will decrease depending on the slag amount and its reducible components (SiO2, Na2O, MnO, FeO). In the present case the initial (input) Al-content was 0.016%. With slag:steel ratio = 0.01:100 aluminium reacted so much that the final [Al] content was 0.013-0.014% depending on the temperature. With the highest slag:metal ratio 0.02:100, Al-content dropped down to 0.012-0.011%. Other Al-contents (0.030, 0.020%) were also tested but the results and conclusions were quite similar. The most interesting components in steel are oxygen, calcium and magnesium. Results are given in Figure 81, Figure 82, Figure 83 and Figure 84 for slags A, B, C and D, respectively.
Figure 81. FactSage calculations with Ovako SAE 1050 steel and slag A. Slag/steel equilibration ratio = 0.01/100. Oxygen, Mg and Ca contents in steel as a function of temperature.
Figure 82. FactSage calculations with Ovako SAE 1050 steel and slag B. Slag/steel equilibration ratio = 0.01/100. Oxygen, Mg and Ca contents in steel as a function of temperature.
Figure 83. FactSage calculations with Ovako SAE 1050 steel and slag C. Slag/steel equilibration ratio = 0.01/100. Oxygen, Mg and Ca contents in steel as a function of temperature.
Figure 84. FactSage calculations with Ovako SAE 1050 steel and slag D. Slag/steel equilibration ratio = 0.01/100. Oxygen, Mg and Ca contents in steel as a function of temperature.
Because MgO is a less stable oxide than CaO, it is more readily reduced and contents of dissolved Mg are obtained, which are according to calculations, typically 2-3 ppm, which is in rough agreement with the analysed value. With high slag:steel reaction ratio Mg might increase up to 5 ppm. By decreasing the content and activity of MgO in slag (slag C in Figure 83) dissolved [Mg] can be decreased and formation of MgO·Al2O3 spinel can be hindered. Calculated Ca content is lower with these slags, typically 1-2 ppm. Oxygen content given in figures is marked with O_Fe. It consists of free dissolved [O] and “associated oxygen” according to the solution model (”AlO”, ”MgO”, ”CaO”). Oxygen content is related to dissolved [Al] and thus depends on the reacted slag ratio. In the present case typical [O] in
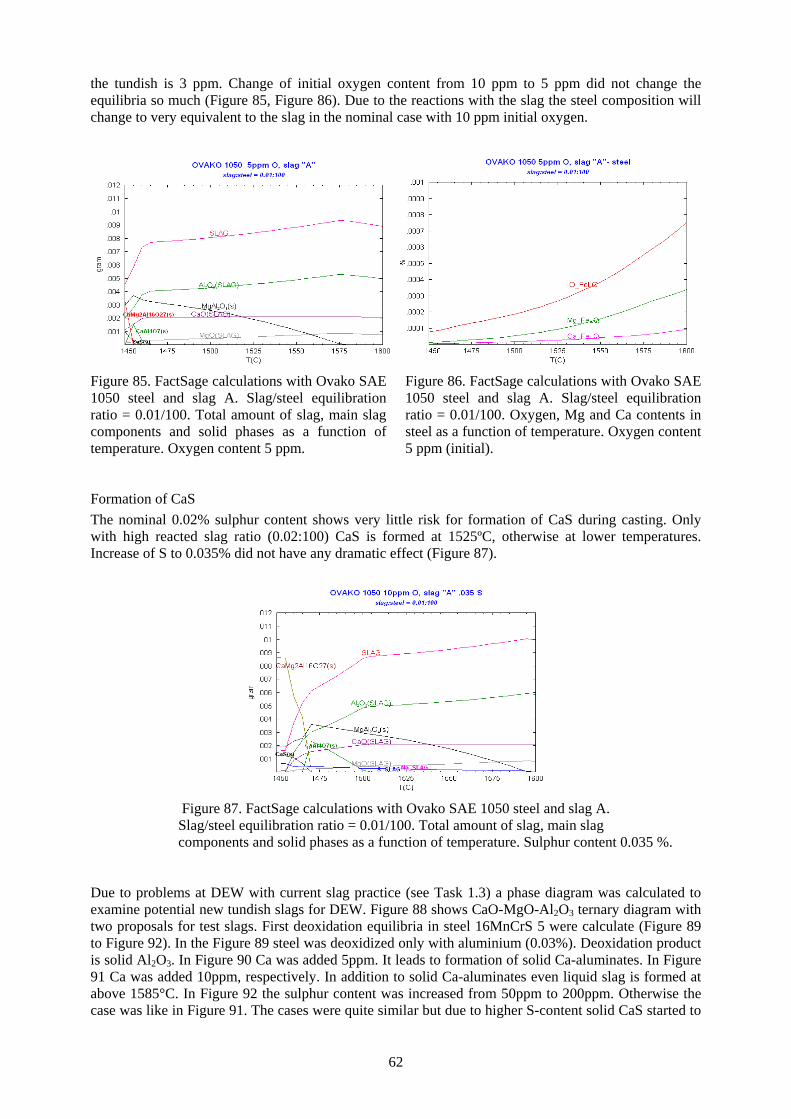
62
the tundish is 3 ppm. Change of initial oxygen content from 10 ppm to 5 ppm did not change the equilibria so much (Figure 85, Figure 86). Due to the reactions with the slag the steel composition will change to very equivalent to the slag in the nominal case with 10 ppm initial oxygen.
Figure 85. FactSage calculations with Ovako SAE 1050 steel and slag A. Slag/steel equilibration ratio = 0.01/100. Total amount of slag, main slag components and solid phases as a function of temperature. Oxygen content 5 ppm.
Figure 86. FactSage calculations with Ovako SAE 1050 steel and slag A. Slag/steel equilibration ratio = 0.01/100. Oxygen, Mg and Ca contents in steel as a function of temperature. Oxygen content 5 ppm (initial).
Formation of CaS The nominal 0.02% sulphur content shows very little risk for formation of CaS during casting. Only with high reacted slag ratio (0.02:100) CaS is formed at 1525ºC, otherwise at lower temperatures. Increase of S to 0.035% did not have any dramatic effect (Figure 87).
Figure 87. FactSage calculations with Ovako SAE 1050 steel and slag A.
Slag/steel equilibration ratio = 0.01/100. Total amount of slag, main slag components and solid phases as a function of temperature. Sulphur content 0.035 %. Due to problems at DEW with current slag practice (see Task 1.3) a phase diagram was calculated to examine potential new tundish slags for DEW. Figure 88 shows CaO-MgO-Al2O3 ternary diagram with two proposals for test slags. First deoxidation equilibria in steel 16MnCrS 5 were calculate (Figure 89 to Figure 92). In the Figure 89 steel was deoxidized only with aluminium (0.03%). Deoxidation product is solid Al2O3. In Figure 90 Ca was added 5ppm. It leads to formation of solid Ca-aluminates. In Figure 91 Ca was added 10ppm, respectively. In addition to solid Ca-aluminates even liquid slag is formed at above 1585°C. In Figure 92 the sulphur content was increased from 50ppm to 200ppm. Otherwise the case was like in Figure 91. The cases were quite similar but due to higher S-content solid CaS started to
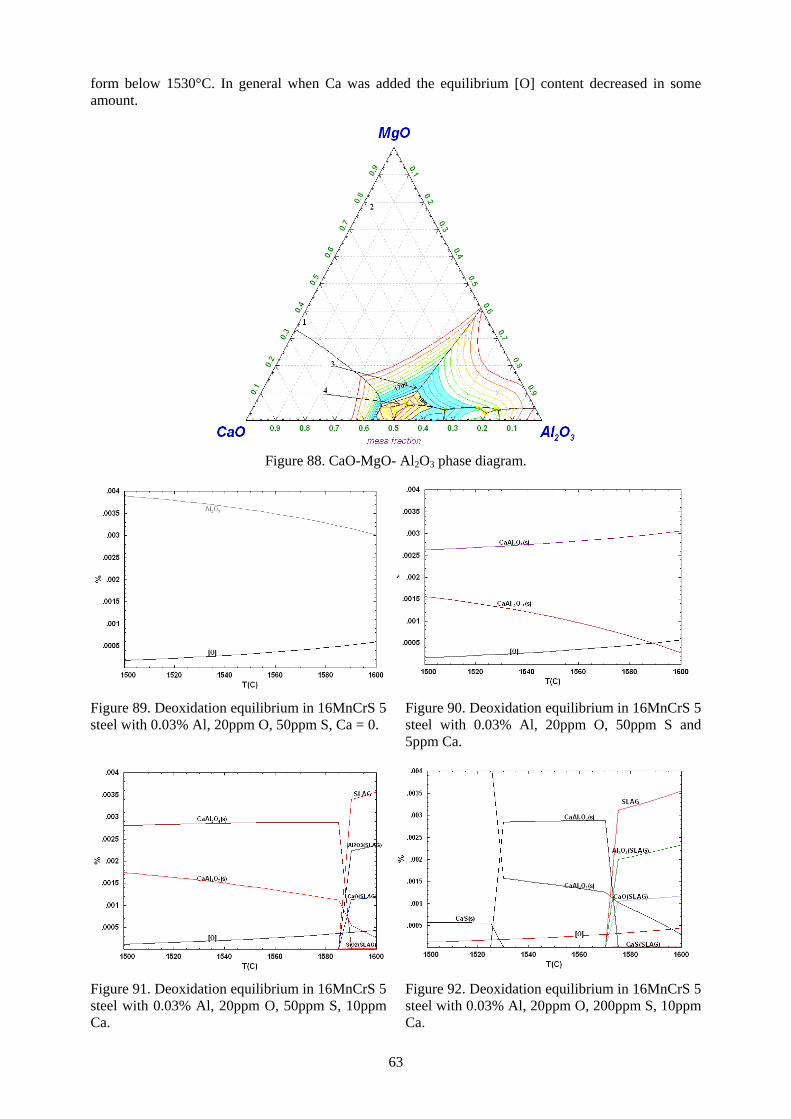
63
form below 1530°C. In general when Ca was added the equilibrium [O] content decreased in some amount.
Figure 88. CaO-MgO- Al2O3 phase diagram.
Figure 89. Deoxidation equilibrium in 16MnCrS 5 steel with 0.03% Al, 20ppm O, 50ppm S, Ca = 0.
Figure 90. Deoxidation equilibrium in 16MnCrS 5 steel with 0.03% Al, 20ppm O, 50ppm S and 5ppm Ca.
Figure 91. Deoxidation equilibrium in 16MnCrS 5 steel with 0.03% Al, 20ppm O, 50ppm S, 10ppm Ca.
Figure 92. Deoxidation equilibrium in 16MnCrS 5 steel with 0.03% Al, 20ppm O, 200ppm S, 10ppm Ca.
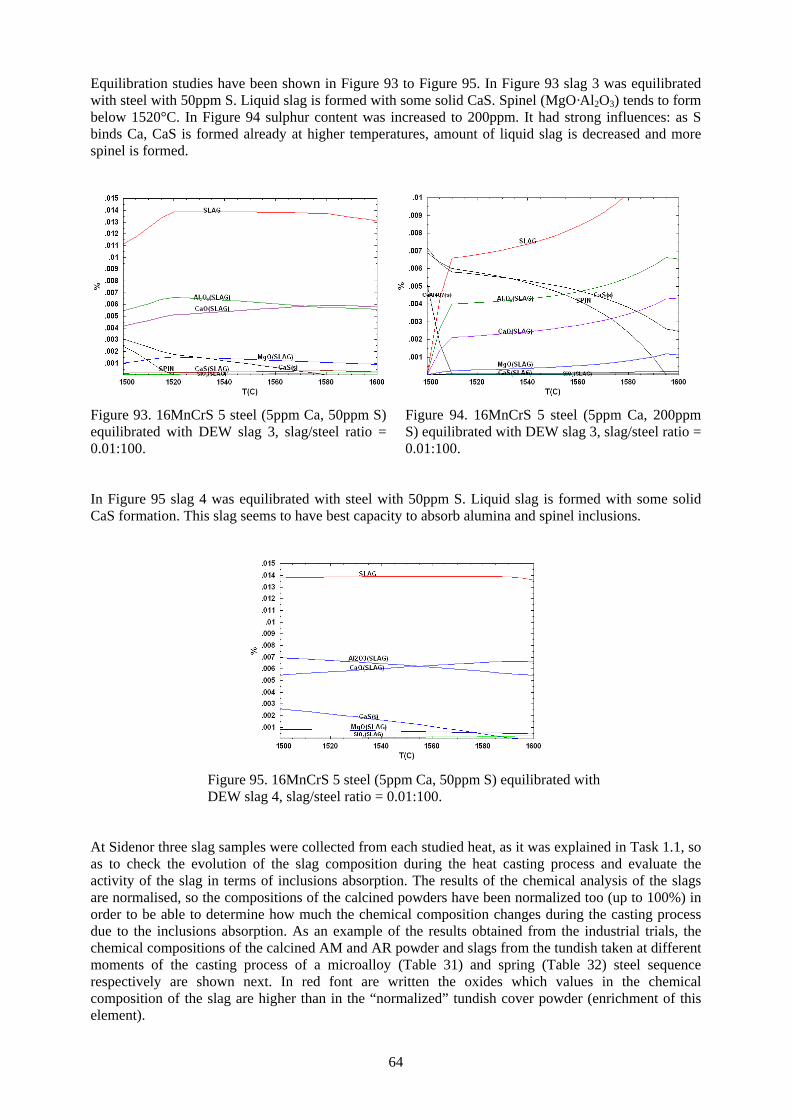
64
Equilibration studies have been shown in Figure 93 to Figure 95. In Figure 93 slag 3 was equilibrated with steel with 50ppm S. Liquid slag is formed with some solid CaS. Spinel (MgO·Al2O3) tends to form below 1520°C. In Figure 94 sulphur content was increased to 200ppm. It had strong influences: as S binds Ca, CaS is formed already at higher temperatures, amount of liquid slag is decreased and more spinel is formed.
Figure 93. 16MnCrS 5 steel (5ppm Ca, 50ppm S) equilibrated with DEW slag 3, slag/steel ratio = 0.01:100.
Figure 94. 16MnCrS 5 steel (5ppm Ca, 200ppm S) equilibrated with DEW slag 3, slag/steel ratio = 0.01:100.
In Figure 95 slag 4 was equilibrated with steel with 50ppm S. Liquid slag is formed with some solid CaS formation. This slag seems to have best capacity to absorb alumina and spinel inclusions.
Figure 95. 16MnCrS 5 steel (5ppm Ca, 50ppm S) equilibrated with DEW slag 4, slag/steel ratio = 0.01:100. At Sidenor three slag samples were collected from each studied heat, as it was explained in Task 1.1, so as to check the evolution of the slag composition during the heat casting process and evaluate the activity of the slag in terms of inclusions absorption. The results of the chemical analysis of the slags are normalised, so the compositions of the calcined powders have been normalized too (up to 100%) in order to be able to determine how much the chemical composition changes during the casting process due to the inclusions absorption. As an example of the results obtained from the industrial trials, the chemical compositions of the calcined AM and AR powder and slags from the tundish taken at different moments of the casting process of a microalloy (Table 31) and spring (Table 32) steel sequence respectively are shown next. In red font are written the oxides which values in the chemical composition of the slag are higher than in the “normalized” tundish cover powder (enrichment of this element).
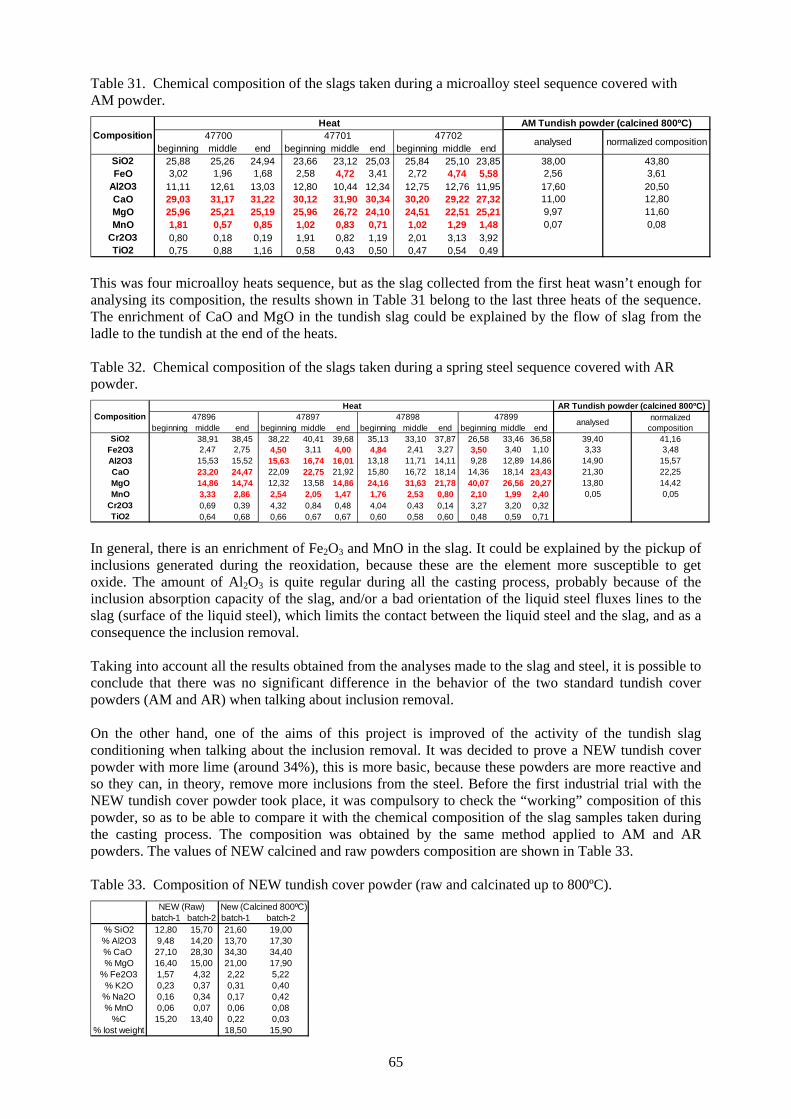
65
Table 31. Chemical composition of the slags taken during a microalloy steel sequence covered with AM powder.
beginning middle end beginning middle end beginning middle endSiO2 25,88 25,26 24,94 23,66 23,12 25,03 25,84 25,10 23,85 38,00 43,80FeO 3,02 1,96 1,68 2,58 4,72 3,41 2,72 4,74 5,58 2,56 3,61
Al2O3 11,11 12,61 13,03 12,80 10,44 12,34 12,75 12,76 11,95 17,60 20,50CaO 29,03 31,17 31,22 30,12 31,90 30,34 30,20 29,22 27,32 11,00 12,80MgO 25,96 25,21 25,19 25,96 26,72 24,10 24,51 22,51 25,21 9,97 11,60MnO 1,81 0,57 0,85 1,02 0,83 0,71 1,02 1,29 1,48 0,07 0,08
Cr2O3 0,80 0,18 0,19 1,91 0,82 1,19 2,01 3,13 3,92TiO2 0,75 0,88 1,16 0,58 0,43 0,50 0,47 0,54 0,49
Composition 47700 47701 47702AM Tundish powder (calcined 800ºC)
normalized composition
Heat
analysed
This was four microalloy heats sequence, but as the slag collected from the first heat wasn’t enough for analysing its composition, the results shown in Table 31 belong to the last three heats of the sequence. The enrichment of CaO and MgO in the tundish slag could be explained by the flow of slag from the ladle to the tundish at the end of the heats. Table 32. Chemical composition of the slags taken during a spring steel sequence covered with AR powder.
beginning middle end beginning middle end beginning middle end beginning middle endSiO2 38,91 38,45 38,22 40,41 39,68 35,13 33,10 37,87 26,58 33,46 36,58 39,40 41,16
Fe2O3 2,47 2,75 4,50 3,11 4,00 4,84 2,41 3,27 3,50 3,40 1,10 3,33 3,48Al2O3 15,53 15,52 15,63 16,74 16,01 13,18 11,71 14,11 9,28 12,89 14,86 14,90 15,57CaO 23,20 24,47 22,09 22,75 21,92 15,80 16,72 18,14 14,36 18,14 23,43 21,30 22,25MgO 14,86 14,74 12,32 13,58 14,86 24,16 31,63 21,78 40,07 26,56 20,27 13,80 14,42MnO 3,33 2,86 2,54 2,05 1,47 1,76 2,53 0,80 2,10 1,99 2,40 0,05 0,05
Cr2O3 0,69 0,39 4,32 0,84 0,48 4,04 0,43 0,14 3,27 3,20 0,32TiO2 0,64 0,68 0,66 0,67 0,67 0,60 0,58 0,60 0,48 0,59 0,71
analysed
AR Tundish powder (calcined 800ºC)normalized
composition47899
HeatComposition 47896 47897 47898
In general, there is an enrichment of Fe2O3 and MnO in the slag. It could be explained by the pickup of inclusions generated during the reoxidation, because these are the element more susceptible to get oxide. The amount of Al2O3 is quite regular during all the casting process, probably because of the inclusion absorption capacity of the slag, and/or a bad orientation of the liquid steel fluxes lines to the slag (surface of the liquid steel), which limits the contact between the liquid steel and the slag, and as a consequence the inclusion removal. Taking into account all the results obtained from the analyses made to the slag and steel, it is possible to conclude that there was no significant difference in the behavior of the two standard tundish cover powders (AM and AR) when talking about inclusion removal. On the other hand, one of the aims of this project is improved of the activity of the tundish slag conditioning when talking about the inclusion removal. It was decided to prove a NEW tundish cover powder with more lime (around 34%), this is more basic, because these powders are more reactive and so they can, in theory, remove more inclusions from the steel. Before the first industrial trial with the NEW tundish cover powder took place, it was compulsory to check the “working” composition of this powder, so as to be able to compare it with the chemical composition of the slag samples taken during the casting process. The composition was obtained by the same method applied to AM and AR powders. The values of NEW calcined and raw powders composition are shown in Table 33. Table 33. Composition of NEW tundish cover powder (raw and calcinated up to 800ºC).
batch-1 batch-2 batch-1 batch-2% SiO2 12,80 15,70 21,60 19,00% Al2O3 9,48 14,20 13,70 17,30% CaO 27,10 28,30 34,30 34,40% MgO 16,40 15,00 21,00 17,90
% Fe2O3 1,57 4,32 2,22 5,22% K2O 0,23 0,37 0,31 0,40
% Na2O 0,16 0,34 0,17 0,42% MnO 0,06 0,07 0,06 0,08
%C 15,20 13,40 0,22 0,03% lost weight 18,50 15,90
NEW (Raw) New (Calcined 800ºC)
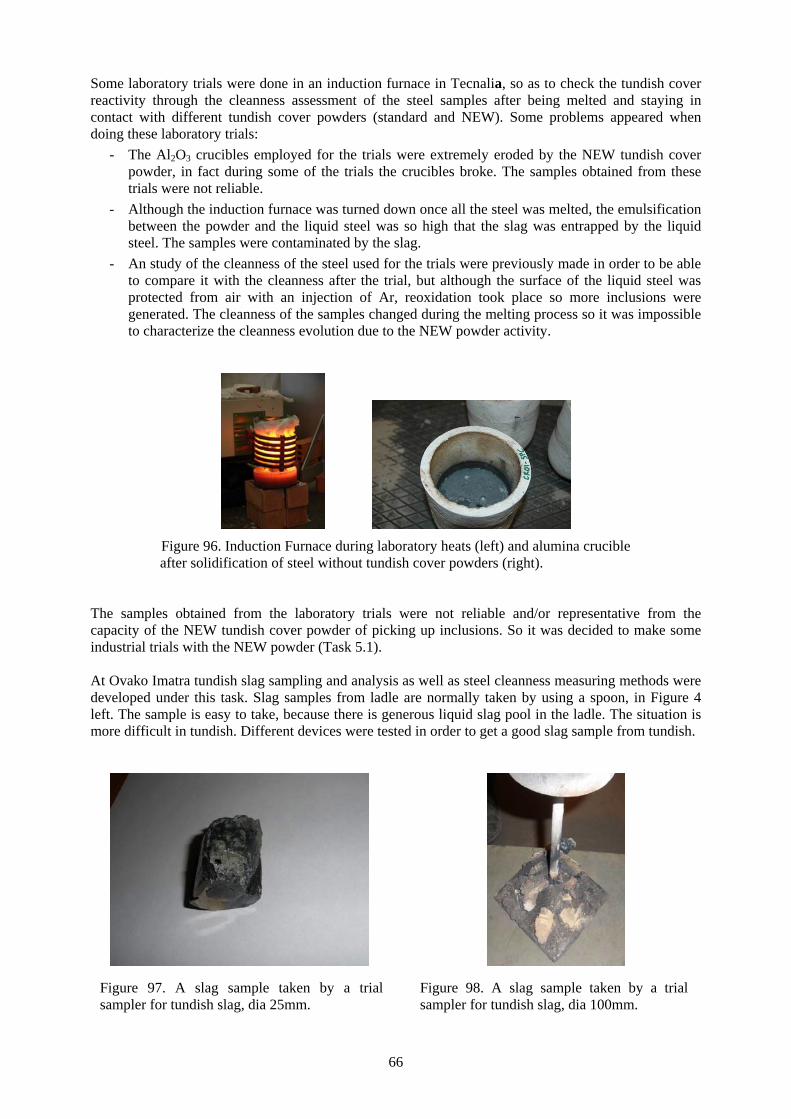
66
Some laboratory trials were done in an induction furnace in Tecnalia, so as to check the tundish cover reactivity through the cleanness assessment of the steel samples after being melted and staying in contact with different tundish cover powders (standard and NEW). Some problems appeared when doing these laboratory trials: - The Al2O3 crucibles employed for the trials were extremely eroded by the NEW tundish cover
powder, in fact during some of the trials the crucibles broke. The samples obtained from these trials were not reliable.
- Although the induction furnace was turned down once all the steel was melted, the emulsification between the powder and the liquid steel was so high that the slag was entrapped by the liquid steel. The samples were contaminated by the slag.
- An study of the cleanness of the steel used for the trials were previously made in order to be able to compare it with the cleanness after the trial, but although the surface of the liquid steel was protected from air with an injection of Ar, reoxidation took place so more inclusions were generated. The cleanness of the samples changed during the melting process so it was impossible to characterize the cleanness evolution due to the NEW powder activity.
Figure 96. Induction Furnace during laboratory heats (left) and alumina crucible
after solidification of steel without tundish cover powders (right). The samples obtained from the laboratory trials were not reliable and/or representative from the capacity of the NEW tundish cover powder of picking up inclusions. So it was decided to make some industrial trials with the NEW powder (Task 5.1). At Ovako Imatra tundish slag sampling and analysis as well as steel cleanness measuring methods were developed under this task. Slag samples from ladle are normally taken by using a spoon, in Figure 4 left. The sample is easy to take, because there is generous liquid slag pool in the ladle. The situation is more difficult in tundish. Different devices were tested in order to get a good slag sample from tundish.
Figure 97. A slag sample taken by a trial sampler for tundish slag, dia 25mm.
Figure 98. A slag sample taken by a trial sampler for tundish slag, dia 100mm.
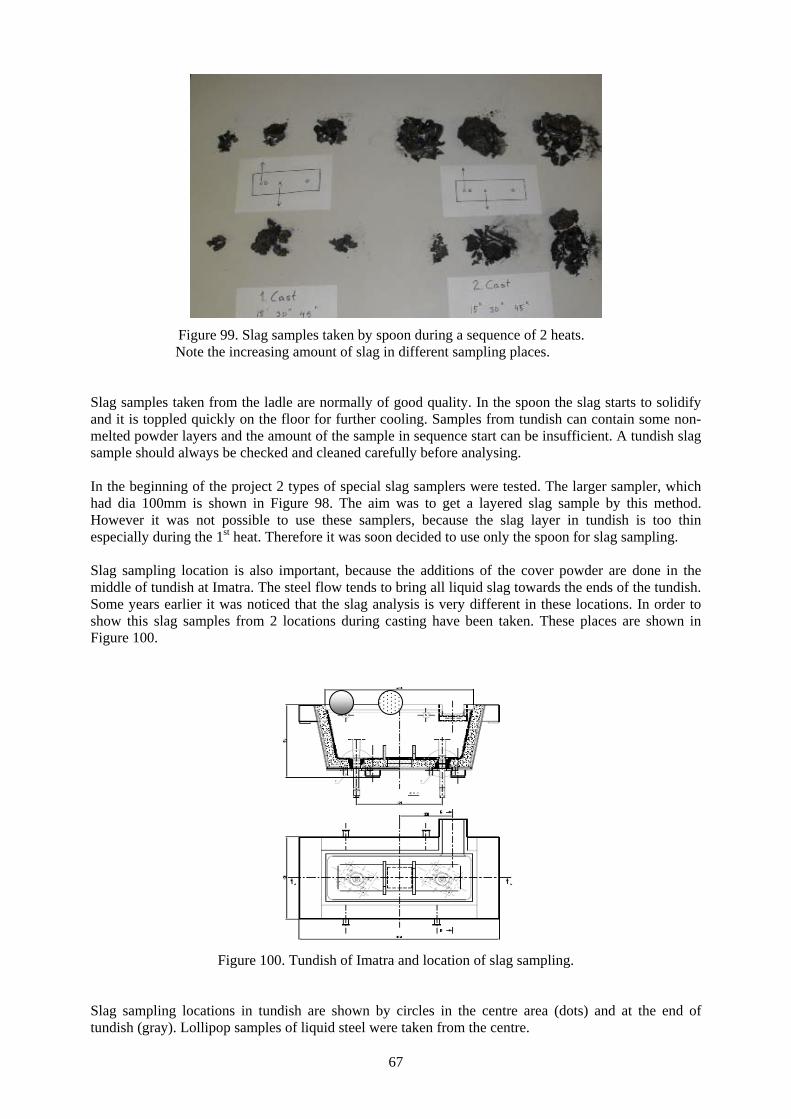
67
Figure 99. Slag samples taken by spoon during a sequence of 2 heats.
Note the increasing amount of slag in different sampling places. Slag samples taken from the ladle are normally of good quality. In the spoon the slag starts to solidify and it is toppled quickly on the floor for further cooling. Samples from tundish can contain some non-melted powder layers and the amount of the sample in sequence start can be insufficient. A tundish slag sample should always be checked and cleaned carefully before analysing. In the beginning of the project 2 types of special slag samplers were tested. The larger sampler, which had dia 100mm is shown in Figure 98. The aim was to get a layered slag sample by this method. However it was not possible to use these samplers, because the slag layer in tundish is too thin especially during the 1st heat. Therefore it was soon decided to use only the spoon for slag sampling. Slag sampling location is also important, because the additions of the cover powder are done in the middle of tundish at Imatra. The steel flow tends to bring all liquid slag towards the ends of the tundish. Some years earlier it was noticed that the slag analysis is very different in these locations. In order to show this slag samples from 2 locations during casting have been taken. These places are shown in Figure 100.
Figure 100. Tundish of Imatra and location of slag sampling.
Slag sampling locations in tundish are shown by circles in the centre area (dots) and at the end of tundish (gray). Lollipop samples of liquid steel were taken from the centre.
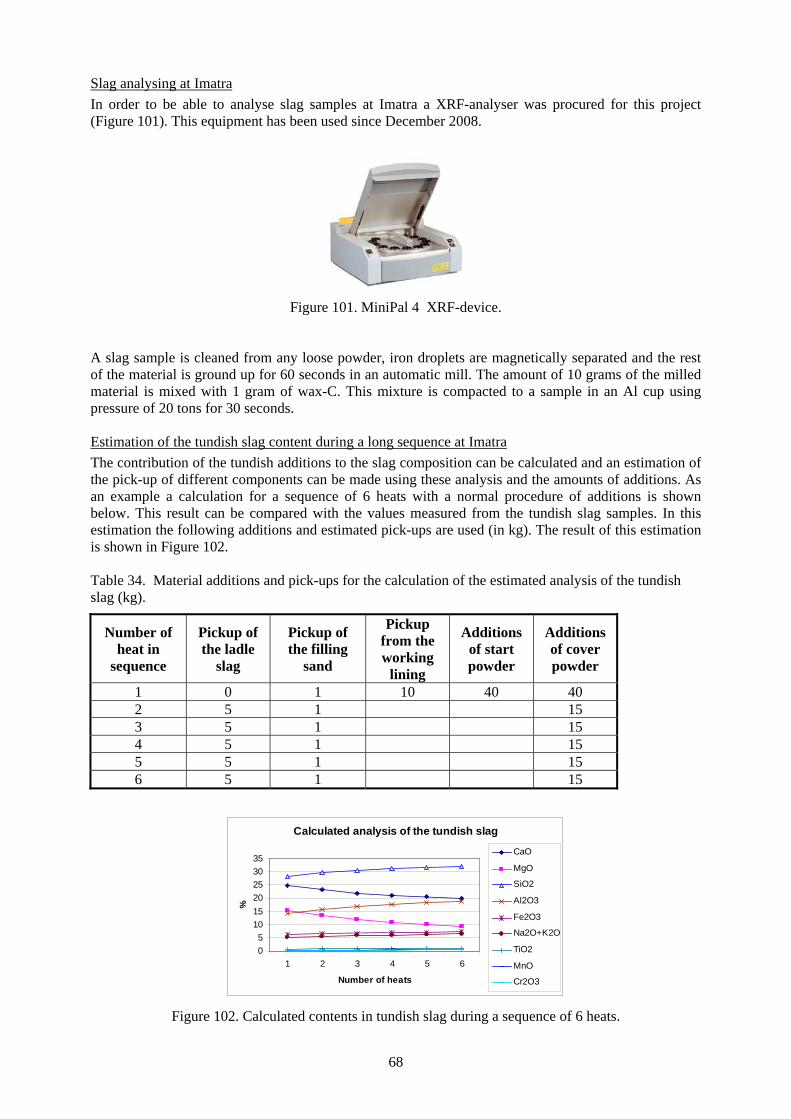
68
Slag analysing at Imatra In order to be able to analyse slag samples at Imatra a XRF-analyser was procured for this project (Figure 101). This equipment has been used since December 2008.
Figure 101. MiniPal 4 XRF-device.
A slag sample is cleaned from any loose powder, iron droplets are magnetically separated and the rest of the material is ground up for 60 seconds in an automatic mill. The amount of 10 grams of the milled material is mixed with 1 gram of wax-C. This mixture is compacted to a sample in an Al cup using pressure of 20 tons for 30 seconds. Estimation of the tundish slag content during a long sequence at Imatra The contribution of the tundish additions to the slag composition can be calculated and an estimation of the pick-up of different components can be made using these analysis and the amounts of additions. As an example a calculation for a sequence of 6 heats with a normal procedure of additions is shown below. This result can be compared with the values measured from the tundish slag samples. In this estimation the following additions and estimated pick-ups are used (in kg). The result of this estimation is shown in Figure 102. Table 34. Material additions and pick-ups for the calculation of the estimated analysis of the tundish slag (kg).
Number of heat in
sequence
Pickup of the ladle
slag
Pickup of the filling
sand
Pickup from the working
lining
Additions of start powder
Additions of cover powder
1 0 1 10 40 40 2 5 1 15 3 5 1 15 4 5 1 15 5 5 1 15 6 5 1 15
Calculated analysis of the tundish slag
05
101520253035
1 2 3 4 5 6
Number of heats
%
CaO
MgO
SiO2
Al2O3
Fe2O3
Na2O+K2O
TiO2
MnO
Cr2O3
Figure 102. Calculated contents in tundish slag during a sequence of 6 heats.
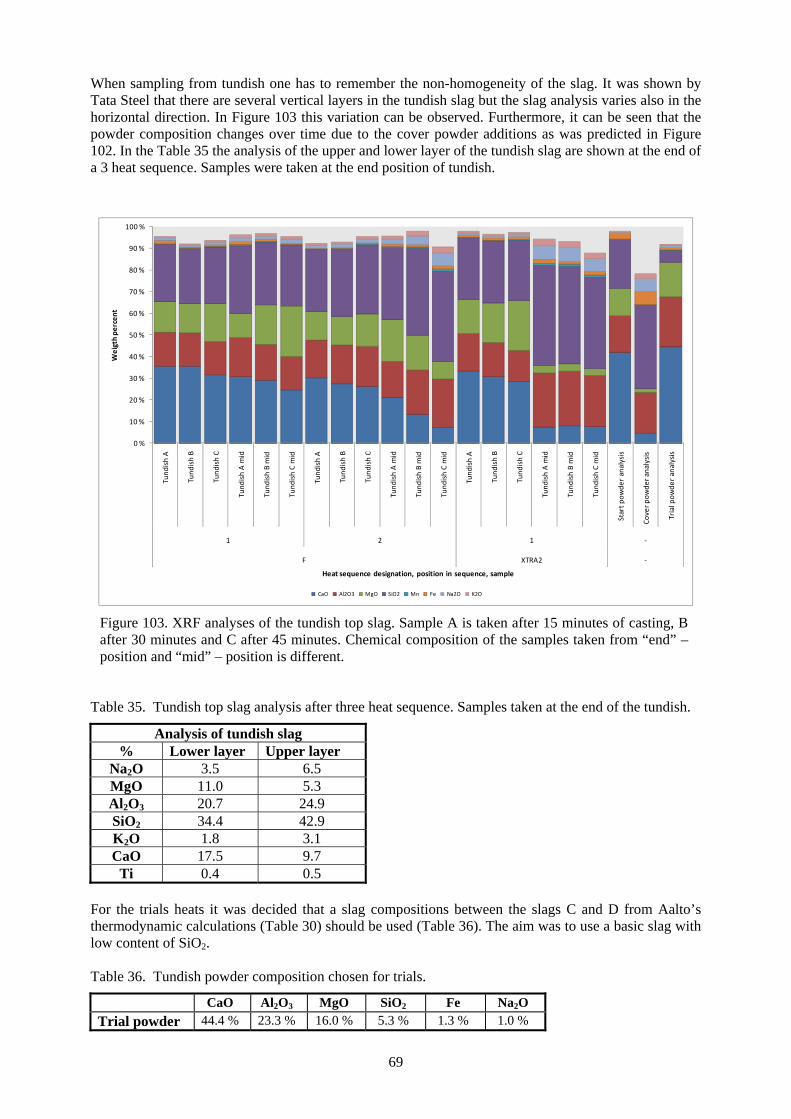
69
When sampling from tundish one has to remember the non-homogeneity of the slag. It was shown by Tata Steel that there are several vertical layers in the tundish slag but the slag analysis varies also in the horizontal direction. In Figure 103 this variation can be observed. Furthermore, it can be seen that the powder composition changes over time due to the cover powder additions as was predicted in Figure 102. In the Table 35 the analysis of the upper and lower layer of the tundish slag are shown at the end of a 3 heat sequence. Samples were taken at the end position of tundish.
0 %
10 %
20 %
30 %
40 %
50 %
60 %
70 %
80 %
90 %
100 %
Tund
ish A
Tund
ish B
Tund
ish C
Tund
ish A mid
Tund
ish B mid
Tund
ish C mid
Tund
ish A
Tund
ish B
Tund
ish C
Tund
ish A mid
Tund
ish B mid
Tund
ish C mid
Tund
ish A
Tund
ish B
Tund
ish C
Tund
ish A mid
Tund
ish B mid
Tund
ish C mid
Start p
owde
r analysis
Cover p
owde
r analysis
Trial pow
der analysis
1 2 1 ‐
F XTRA2 ‐
Weigth pe
rcen
t
Heat sequence designation, position in sequence, sample
CaO Al2O3 MgO SiO2 Mn Fe Na2O K2O
Figure 103. XRF analyses of the tundish top slag. Sample A is taken after 15 minutes of casting, B after 30 minutes and C after 45 minutes. Chemical composition of the samples taken from “end” –position and “mid” – position is different.
Table 35. Tundish top slag analysis after three heat sequence. Samples taken at the end of the tundish.
Analysis of tundish slag % Lower layer Upper layer
Na2O 3.5 6.5 MgO 11.0 5.3 Al2O3 20.7 24.9 SiO2 34.4 42.9 K2O 1.8 3.1 CaO 17.5 9.7
Ti 0.4 0.5 For the trials heats it was decided that a slag compositions between the slags C and D from Aalto’s thermodynamic calculations (Table 30) should be used (Table 36). The aim was to use a basic slag with low content of SiO2. Table 36. Tundish powder composition chosen for trials.
CaO Al2O3 MgO SiO2 Fe Na2O Trial powder 44.4 % 23.3 % 16.0 % 5.3 % 1.3 % 1.0 %
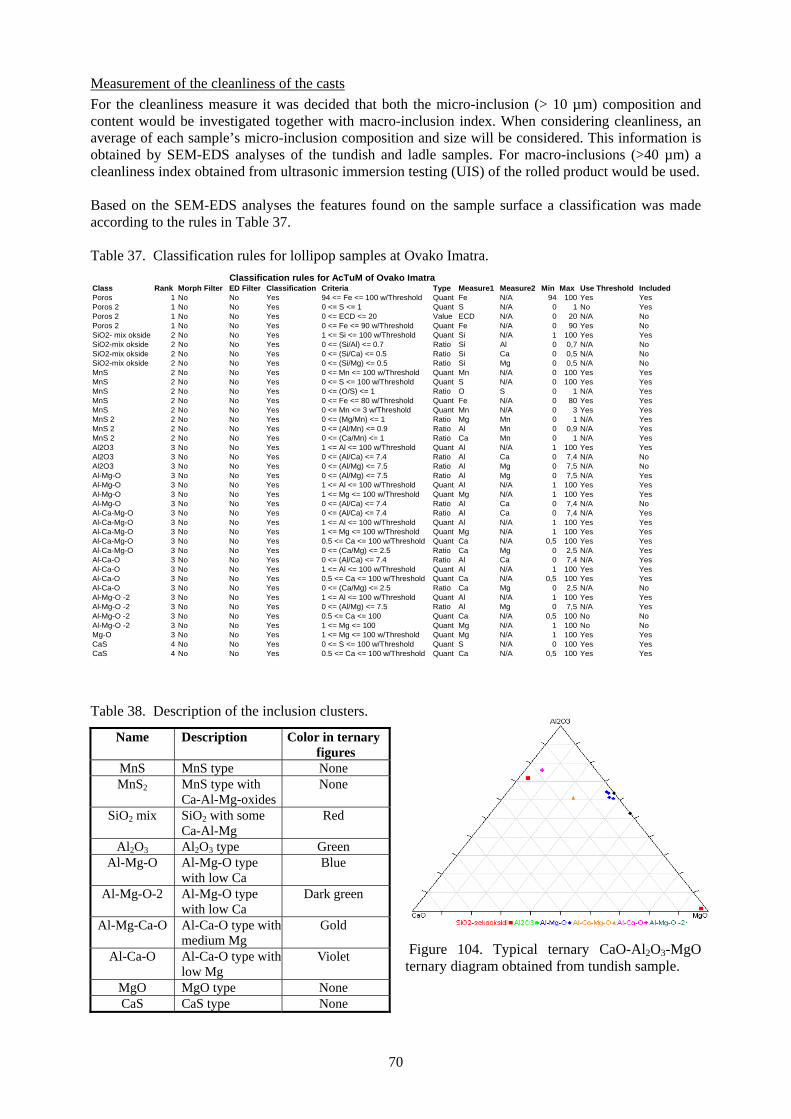
70
Measurement of the cleanliness of the casts For the cleanliness measure it was decided that both the micro-inclusion (> 10 µm) composition and content would be investigated together with macro-inclusion index. When considering cleanliness, an average of each sample’s micro-inclusion composition and size will be considered. This information is obtained by SEM-EDS analyses of the tundish and ladle samples. For macro-inclusions (>40 µm) a cleanliness index obtained from ultrasonic immersion testing (UIS) of the rolled product would be used. Based on the SEM-EDS analyses the features found on the sample surface a classification was made according to the rules in Table 37. Table 37. Classification rules for lollipop samples at Ovako Imatra.
Classification rules for AcTuM of Ovako ImatraClass Rank Morph Filter ED Filter Classification Criteria Type Measure1 Measure2 Min Max Use Threshold IncludedPoros 1 No No Yes 94 <= Fe <= 100 w/Threshold Quant Fe N/A 94 100 Yes YesPoros 2 1 No No Yes 0 <= S <= 1 Quant S N/A 0 1 No YesPoros 2 1 No No Yes 0 <= ECD <= 20 Value ECD N/A 0 20 N/A NoPoros 2 1 No No Yes 0 <= Fe <= 90 w/Threshold Quant Fe N/A 0 90 Yes NoSiO2- mix okside 2 No No Yes 1 <= Si <= 100 w/Threshold Quant Si N/A 1 100 Yes YesSiO2-mix okside 2 No No Yes 0 <= (Si/Al) <= 0.7 Ratio Si Al 0 0,7 N/A NoSiO2-mix okside 2 No No Yes 0 <= (Si/Ca) <= 0.5 Ratio Si Ca 0 0,5 N/A NoSiO2-mix okside 2 No No Yes 0 <= (Si/Mg) <= 0.5 Ratio Si Mg 0 0,5 N/A NoMnS 2 No No Yes 0 <= Mn <= 100 w/Threshold Quant Mn N/A 0 100 Yes YesMnS 2 No No Yes 0 <= S <= 100 w/Threshold Quant S N/A 0 100 Yes YesMnS 2 No No Yes 0 <= (O/S) <= 1 Ratio O S 0 1 N/A YesMnS 2 No No Yes 0 <= Fe <= 80 w/Threshold Quant Fe N/A 0 80 Yes YesMnS 2 No No Yes 0 <= Mn <= 3 w/Threshold Quant Mn N/A 0 3 Yes YesMnS 2 2 No No Yes 0 <= (Mg/Mn) <= 1 Ratio Mg Mn 0 1 N/A YesMnS 2 2 No No Yes 0 <= (Al/Mn) <= 0.9 Ratio Al Mn 0 0,9 N/A YesMnS 2 2 No No Yes 0 <= (Ca/Mn) <= 1 Ratio Ca Mn 0 1 N/A YesAl2O3 3 No No Yes 1 <= Al <= 100 w/Threshold Quant Al N/A 1 100 Yes YesAl2O3 3 No No Yes 0 <= (Al/Ca) <= 7.4 Ratio Al Ca 0 7,4 N/A NoAl2O3 3 No No Yes 0 <= (Al/Mg) <= 7.5 Ratio Al Mg 0 7,5 N/A NoAl-Mg-O 3 No No Yes 0 <= (Al/Mg) <= 7.5 Ratio Al Mg 0 7,5 N/A YesAl-Mg-O 3 No No Yes 1 <= Al <= 100 w/Threshold Quant Al N/A 1 100 Yes YesAl-Mg-O 3 No No Yes 1 <= Mg <= 100 w/Threshold Quant Mg N/A 1 100 Yes YesAl-Mg-O 3 No No Yes 0 <= (Al/Ca) <= 7.4 Ratio Al Ca 0 7,4 N/A NoAl-Ca-Mg-O 3 No No Yes 0 <= (Al/Ca) <= 7.4 Ratio Al Ca 0 7,4 N/A YesAl-Ca-Mg-O 3 No No Yes 1 <= Al <= 100 w/Threshold Quant Al N/A 1 100 Yes YesAl-Ca-Mg-O 3 No No Yes 1 <= Mg <= 100 w/Threshold Quant Mg N/A 1 100 Yes YesAl-Ca-Mg-O 3 No No Yes 0.5 <= Ca <= 100 w/Threshold Quant Ca N/A 0,5 100 Yes YesAl-Ca-Mg-O 3 No No Yes 0 <= (Ca/Mg) <= 2.5 Ratio Ca Mg 0 2,5 N/A YesAl-Ca-O 3 No No Yes 0 <= (Al/Ca) <= 7.4 Ratio Al Ca 0 7,4 N/A YesAl-Ca-O 3 No No Yes 1 <= Al <= 100 w/Threshold Quant Al N/A 1 100 Yes YesAl-Ca-O 3 No No Yes 0.5 <= Ca <= 100 w/Threshold Quant Ca N/A 0,5 100 Yes YesAl-Ca-O 3 No No Yes 0 <= (Ca/Mg) <= 2.5 Ratio Ca Mg 0 2,5 N/A NoAl-Mg-O -2 3 No No Yes 1 <= Al <= 100 w/Threshold Quant Al N/A 1 100 Yes YesAl-Mg-O -2 3 No No Yes 0 <= (Al/Mg) <= 7.5 Ratio Al Mg 0 7,5 N/A YesAl-Mg-O -2 3 No No Yes 0.5 <= Ca <= 100 Quant Ca N/A 0,5 100 No NoAl-Mg-O -2 3 No No Yes 1 <= Mg <= 100 Quant Mg N/A 1 100 No NoMg-O 3 No No Yes 1 <= Mg <= 100 w/Threshold Quant Mg N/A 1 100 Yes YesCaS 4 No No Yes 0 <= S <= 100 w/Threshold Quant S N/A 0 100 Yes YesCaS 4 No No Yes 0.5 <= Ca <= 100 w/Threshold Quant Ca N/A 0,5 100 Yes Yes
Table 38. Description of the inclusion clusters.
Name Description Color in ternary figures
MnS MnS type None MnS2 MnS type with
Ca-Al-Mg-oxides None
SiO2 mix SiO2 with some Ca-Al-Mg
Red
Al2O3 Al2O3 type Green Al-Mg-O Al-Mg-O type
with low Ca Blue
Al-Mg-O-2 Al-Mg-O type with low Ca
Dark green
Al-Mg-Ca-O Al-Ca-O type with medium Mg
Gold
Al-Ca-O Al-Ca-O type with low Mg
Violet
MgO MgO type None CaS CaS type None
Figure 104. Typical ternary CaO-Al2O3-MgO ternary diagram obtained from tundish sample.
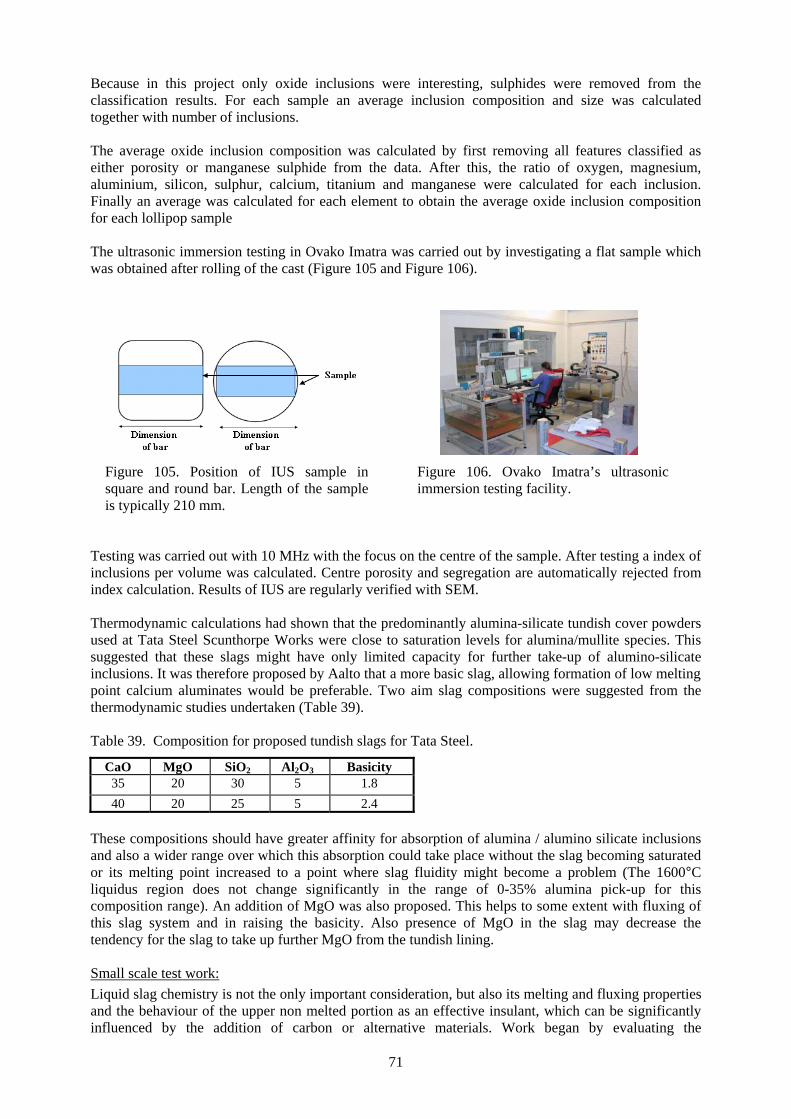
71
Because in this project only oxide inclusions were interesting, sulphides were removed from the classification results. For each sample an average inclusion composition and size was calculated together with number of inclusions. The average oxide inclusion composition was calculated by first removing all features classified as either porosity or manganese sulphide from the data. After this, the ratio of oxygen, magnesium, aluminium, silicon, sulphur, calcium, titanium and manganese were calculated for each inclusion. Finally an average was calculated for each element to obtain the average oxide inclusion composition for each lollipop sample The ultrasonic immersion testing in Ovako Imatra was carried out by investigating a flat sample which was obtained after rolling of the cast (Figure 105 and Figure 106).
Figure 105. Position of IUS sample in square and round bar. Length of the sample is typically 210 mm.
Figure 106. Ovako Imatra’s ultrasonic immersion testing facility.
Testing was carried out with 10 MHz with the focus on the centre of the sample. After testing a index of inclusions per volume was calculated. Centre porosity and segregation are automatically rejected from index calculation. Results of IUS are regularly verified with SEM. Thermodynamic calculations had shown that the predominantly alumina-silicate tundish cover powders used at Tata Steel Scunthorpe Works were close to saturation levels for alumina/mullite species. This suggested that these slags might have only limited capacity for further take-up of alumino-silicate inclusions. It was therefore proposed by Aalto that a more basic slag, allowing formation of low melting point calcium aluminates would be preferable. Two aim slag compositions were suggested from the thermodynamic studies undertaken (Table 39). Table 39. Composition for proposed tundish slags for Tata Steel.
CaO MgO SiO2 Al2O3 Basicity 35 20 30 5 1.8 40 20 25 5 2.4
These compositions should have greater affinity for absorption of alumina / alumino silicate inclusions and also a wider range over which this absorption could take place without the slag becoming saturated or its melting point increased to a point where slag fluidity might become a problem (The 1600°C liquidus region does not change significantly in the range of 0-35% alumina pick-up for this composition range). An addition of MgO was also proposed. This helps to some extent with fluxing of this slag system and in raising the basicity. Also presence of MgO in the slag may decrease the tendency for the slag to take up further MgO from the tundish lining. Small scale test work: Liquid slag chemistry is not the only important consideration, but also its melting and fluxing properties and the behaviour of the upper non melted portion as an effective insulant, which can be significantly influenced by the addition of carbon or alternative materials. Work began by evaluating the
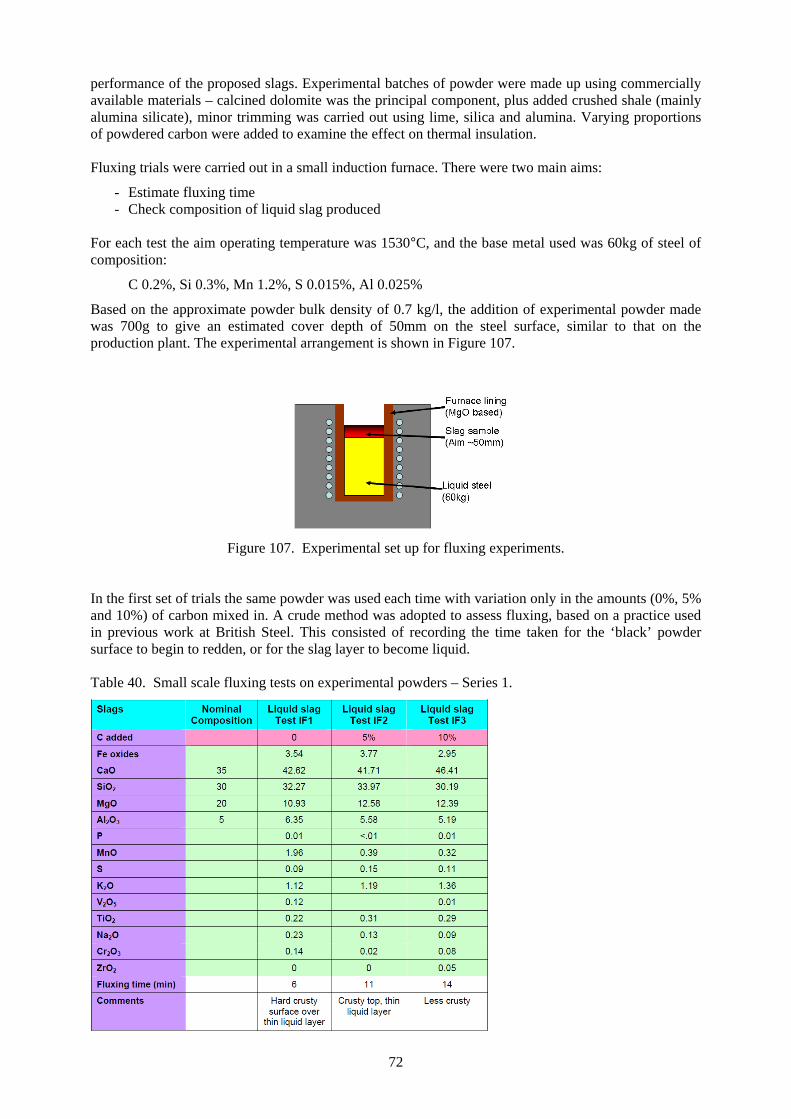
72
performance of the proposed slags. Experimental batches of powder were made up using commercially available materials – calcined dolomite was the principal component, plus added crushed shale (mainly alumina silicate), minor trimming was carried out using lime, silica and alumina. Varying proportions of powdered carbon were added to examine the effect on thermal insulation. Fluxing trials were carried out in a small induction furnace. There were two main aims:
- Estimate fluxing time - Check composition of liquid slag produced
For each test the aim operating temperature was 1530°C, and the base metal used was 60kg of steel of composition:
C 0.2%, Si 0.3%, Mn 1.2%, S 0.015%, Al 0.025%
Based on the approximate powder bulk density of 0.7 kg/l, the addition of experimental powder made was 700g to give an estimated cover depth of 50mm on the steel surface, similar to that on the production plant. The experimental arrangement is shown in Figure 107.
Figure 107. Experimental set up for fluxing experiments.
In the first set of trials the same powder was used each time with variation only in the amounts (0%, 5% and 10%) of carbon mixed in. A crude method was adopted to assess fluxing, based on a practice used in previous work at British Steel. This consisted of recording the time taken for the ‘black’ powder surface to begin to redden, or for the slag layer to become liquid. Table 40. Small scale fluxing tests on experimental powders – Series 1.
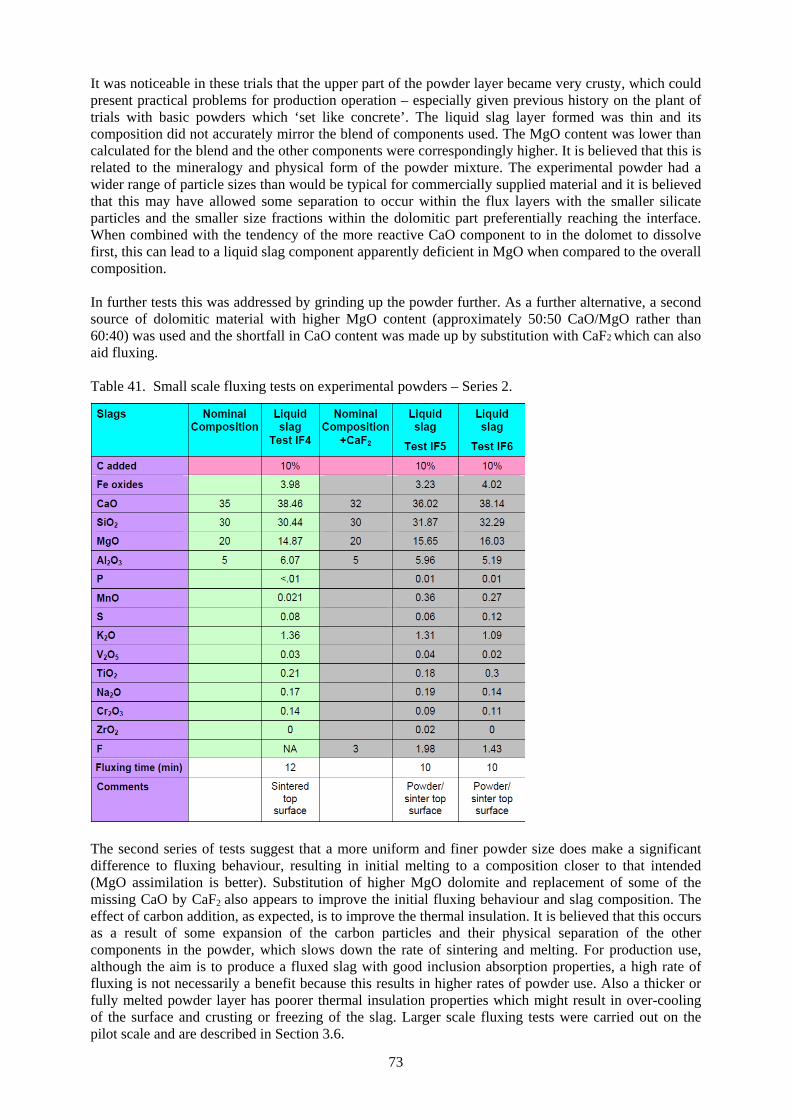
73
It was noticeable in these trials that the upper part of the powder layer became very crusty, which could present practical problems for production operation – especially given previous history on the plant of trials with basic powders which ‘set like concrete’. The liquid slag layer formed was thin and its composition did not accurately mirror the blend of components used. The MgO content was lower than calculated for the blend and the other components were correspondingly higher. It is believed that this is related to the mineralogy and physical form of the powder mixture. The experimental powder had a wider range of particle sizes than would be typical for commercially supplied material and it is believed that this may have allowed some separation to occur within the flux layers with the smaller silicate particles and the smaller size fractions within the dolomitic part preferentially reaching the interface. When combined with the tendency of the more reactive CaO component to in the dolomet to dissolve first, this can lead to a liquid slag component apparently deficient in MgO when compared to the overall composition. In further tests this was addressed by grinding up the powder further. As a further alternative, a second source of dolomitic material with higher MgO content (approximately 50:50 CaO/MgO rather than 60:40) was used and the shortfall in CaO content was made up by substitution with CaF2 which can also aid fluxing. Table 41. Small scale fluxing tests on experimental powders – Series 2.
The second series of tests suggest that a more uniform and finer powder size does make a significant difference to fluxing behaviour, resulting in initial melting to a composition closer to that intended (MgO assimilation is better). Substitution of higher MgO dolomite and replacement of some of the missing CaO by CaF2 also appears to improve the initial fluxing behaviour and slag composition. The effect of carbon addition, as expected, is to improve the thermal insulation. It is believed that this occurs as a result of some expansion of the carbon particles and their physical separation of the other components in the powder, which slows down the rate of sintering and melting. For production use, although the aim is to produce a fluxed slag with good inclusion absorption properties, a high rate of fluxing is not necessarily a benefit because this results in higher rates of powder use. Also a thicker or fully melted powder layer has poorer thermal insulation properties which might result in over-cooling of the surface and crusting or freezing of the slag. Larger scale fluxing tests were carried out on the pilot scale and are described in Section 3.6.
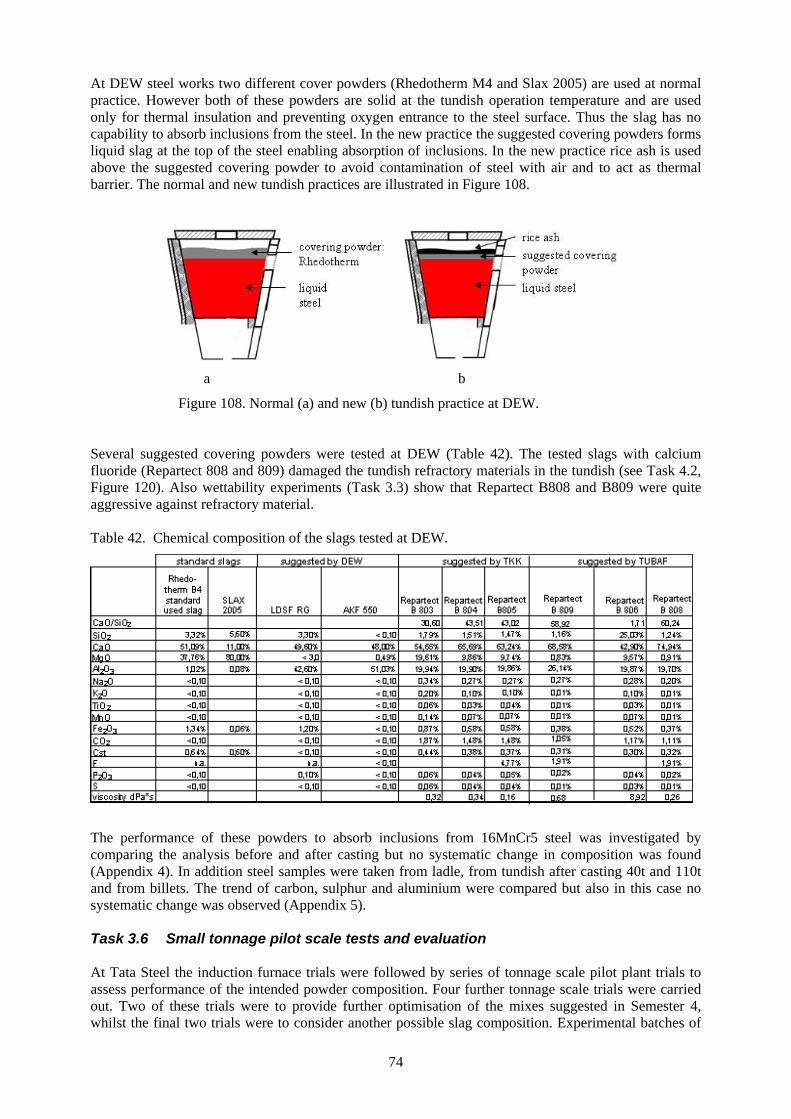
74
At DEW steel works two different cover powders (Rhedotherm M4 and Slax 2005) are used at normal practice. However both of these powders are solid at the tundish operation temperature and are used only for thermal insulation and preventing oxygen entrance to the steel surface. Thus the slag has no capability to absorb inclusions from the steel. In the new practice the suggested covering powders forms liquid slag at the top of the steel enabling absorption of inclusions. In the new practice rice ash is used above the suggested covering powder to avoid contamination of steel with air and to act as thermal barrier. The normal and new tundish practices are illustrated in Figure 108.
a b
Figure 108. Normal (a) and new (b) tundish practice at DEW. Several suggested covering powders were tested at DEW (Table 42). The tested slags with calcium fluoride (Repartect 808 and 809) damaged the tundish refractory materials in the tundish (see Task 4.2, Figure 120). Also wettability experiments (Task 3.3) show that Repartect B808 and B809 were quite aggressive against refractory material. Table 42. Chemical composition of the slags tested at DEW.
The performance of these powders to absorb inclusions from 16MnCr5 steel was investigated by comparing the analysis before and after casting but no systematic change in composition was found (Appendix 4). In addition steel samples were taken from ladle, from tundish after casting 40t and 110t and from billets. The trend of carbon, sulphur and aluminium were compared but also in this case no systematic change was observed (Appendix 5). Task 3.6 Small tonnage pilot scale tests and evaluation At Tata Steel the induction furnace trials were followed by series of tonnage scale pilot plant trials to assess performance of the intended powder composition. Four further tonnage scale trials were carried out. Two of these trials were to provide further optimisation of the mixes suggested in Semester 4, whilst the final two trials were to consider another possible slag composition. Experimental batches of
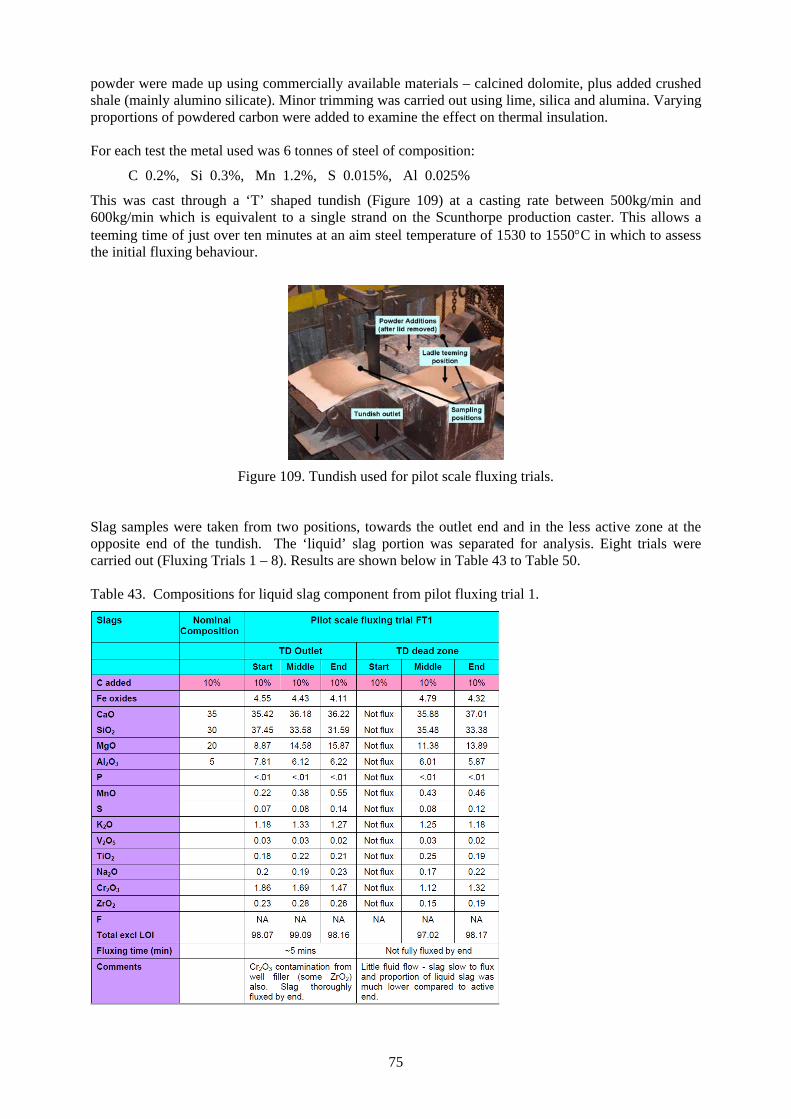
75
powder were made up using commercially available materials – calcined dolomite, plus added crushed shale (mainly alumino silicate). Minor trimming was carried out using lime, silica and alumina. Varying proportions of powdered carbon were added to examine the effect on thermal insulation. For each test the metal used was 6 tonnes of steel of composition:
C 0.2%, Si 0.3%, Mn 1.2%, S 0.015%, Al 0.025%
This was cast through a ‘T’ shaped tundish (Figure 109) at a casting rate between 500kg/min and 600kg/min which is equivalent to a single strand on the Scunthorpe production caster. This allows a teeming time of just over ten minutes at an aim steel temperature of 1530 to 1550°C in which to assess the initial fluxing behaviour.
Figure 109. Tundish used for pilot scale fluxing trials.
Slag samples were taken from two positions, towards the outlet end and in the less active zone at the opposite end of the tundish. The ‘liquid’ slag portion was separated for analysis. Eight trials were carried out (Fluxing Trials 1 – 8). Results are shown below in Table 43 to Table 50. Table 43. Compositions for liquid slag component from pilot fluxing trial 1.
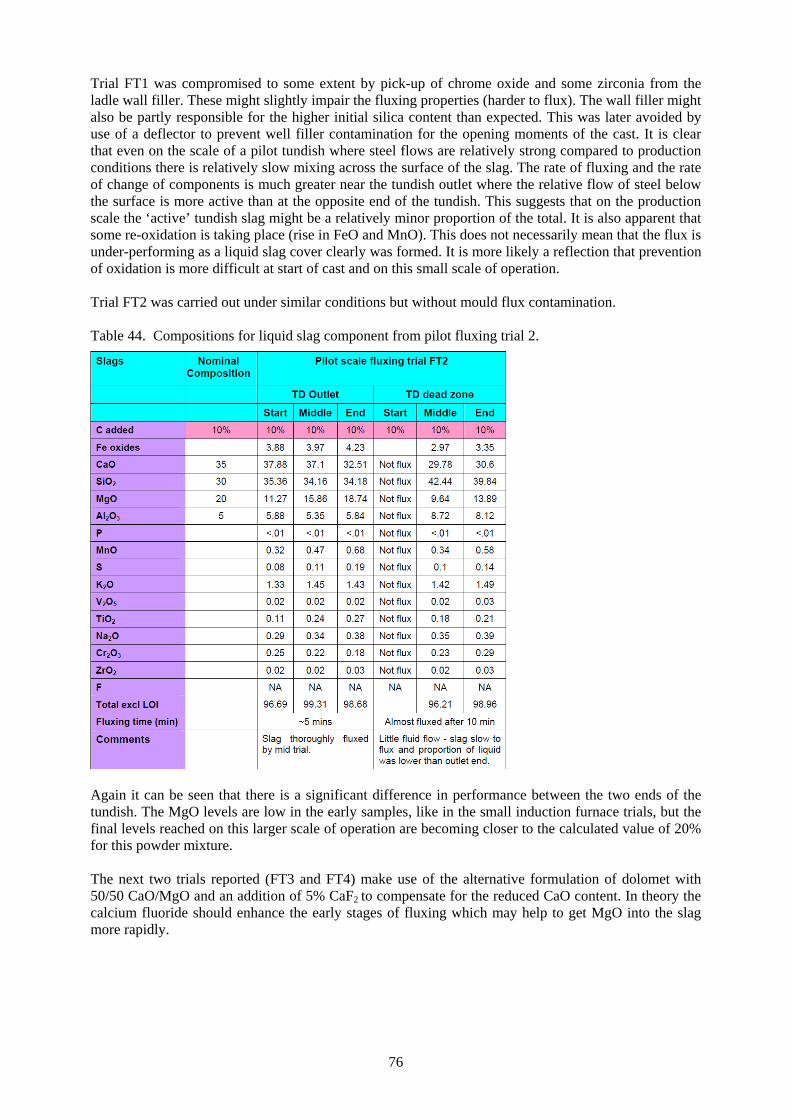
76
Trial FT1 was compromised to some extent by pick-up of chrome oxide and some zirconia from the ladle wall filler. These might slightly impair the fluxing properties (harder to flux). The wall filler might also be partly responsible for the higher initial silica content than expected. This was later avoided by use of a deflector to prevent well filler contamination for the opening moments of the cast. It is clear that even on the scale of a pilot tundish where steel flows are relatively strong compared to production conditions there is relatively slow mixing across the surface of the slag. The rate of fluxing and the rate of change of components is much greater near the tundish outlet where the relative flow of steel below the surface is more active than at the opposite end of the tundish. This suggests that on the production scale the ‘active’ tundish slag might be a relatively minor proportion of the total. It is also apparent that some re-oxidation is taking place (rise in FeO and MnO). This does not necessarily mean that the flux is under-performing as a liquid slag cover clearly was formed. It is more likely a reflection that prevention of oxidation is more difficult at start of cast and on this small scale of operation. Trial FT2 was carried out under similar conditions but without mould flux contamination. Table 44. Compositions for liquid slag component from pilot fluxing trial 2.
Again it can be seen that there is a significant difference in performance between the two ends of the tundish. The MgO levels are low in the early samples, like in the small induction furnace trials, but the final levels reached on this larger scale of operation are becoming closer to the calculated value of 20% for this powder mixture. The next two trials reported (FT3 and FT4) make use of the alternative formulation of dolomet with 50/50 CaO/MgO and an addition of 5% CaF2 to compensate for the reduced CaO content. In theory the calcium fluoride should enhance the early stages of fluxing which may help to get MgO into the slag more rapidly.
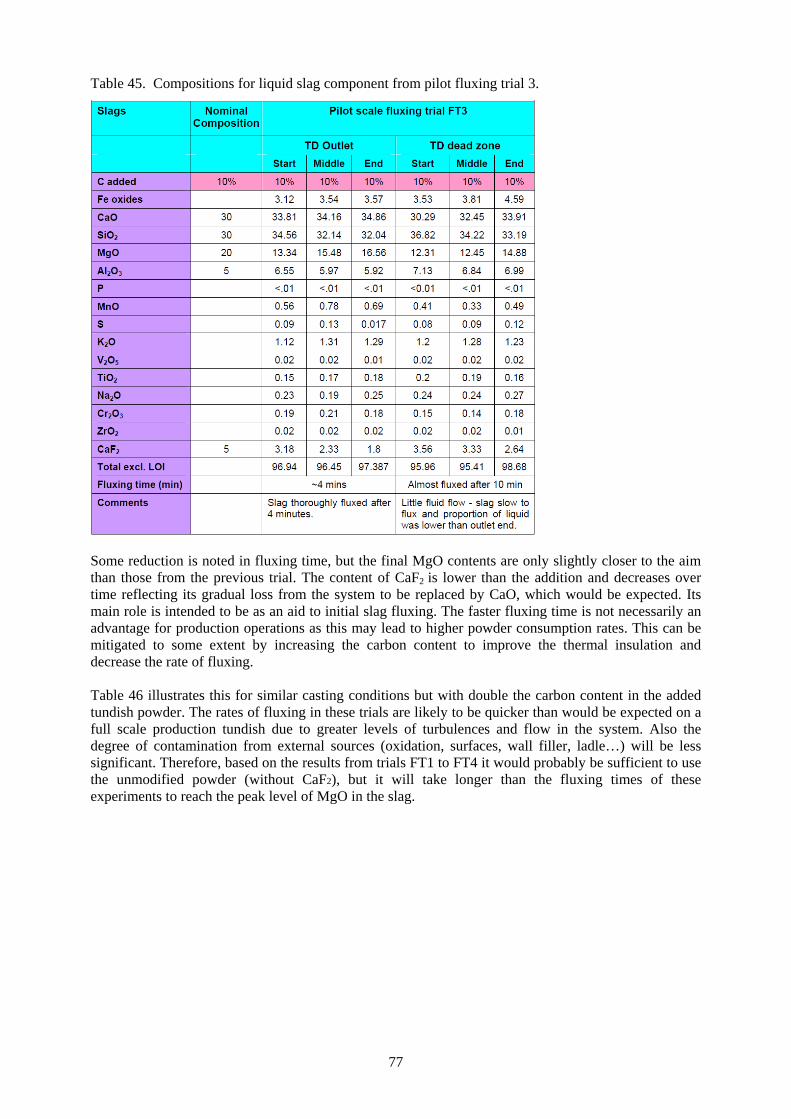
77
Table 45. Compositions for liquid slag component from pilot fluxing trial 3.
Some reduction is noted in fluxing time, but the final MgO contents are only slightly closer to the aim than those from the previous trial. The content of CaF2 is lower than the addition and decreases over time reflecting its gradual loss from the system to be replaced by CaO, which would be expected. Its main role is intended to be as an aid to initial slag fluxing. The faster fluxing time is not necessarily an advantage for production operations as this may lead to higher powder consumption rates. This can be mitigated to some extent by increasing the carbon content to improve the thermal insulation and decrease the rate of fluxing. Table 46 illustrates this for similar casting conditions but with double the carbon content in the added tundish powder. The rates of fluxing in these trials are likely to be quicker than would be expected on a full scale production tundish due to greater levels of turbulences and flow in the system. Also the degree of contamination from external sources (oxidation, surfaces, wall filler, ladle…) will be less significant. Therefore, based on the results from trials FT1 to FT4 it would probably be sufficient to use the unmodified powder (without CaF2), but it will take longer than the fluxing times of these experiments to reach the peak level of MgO in the slag.
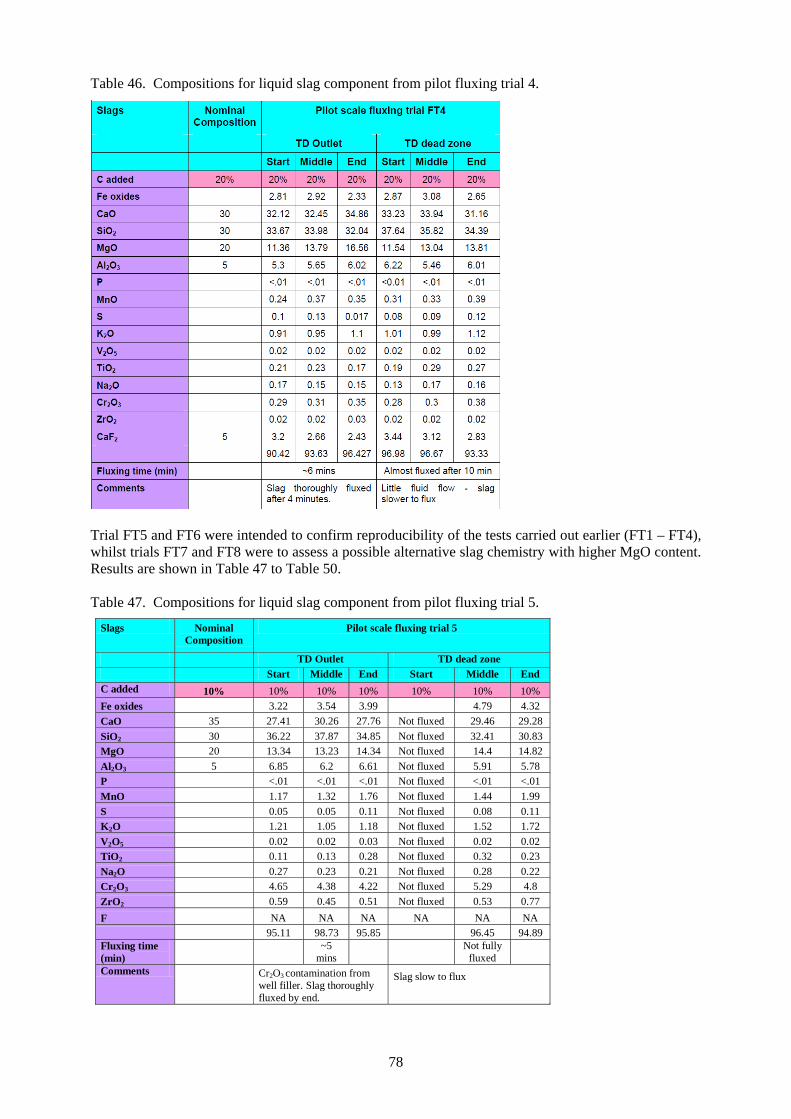
78
Table 46. Compositions for liquid slag component from pilot fluxing trial 4.
Trial FT5 and FT6 were intended to confirm reproducibility of the tests carried out earlier (FT1 – FT4), whilst trials FT7 and FT8 were to assess a possible alternative slag chemistry with higher MgO content. Results are shown in Table 47 to Table 50. Table 47. Compositions for liquid slag component from pilot fluxing trial 5.
Slags Nominal Composition
Pilot scale fluxing trial 5
TD Outlet TD dead zone Start Middle End Start Middle EndC added 10% 10% 10% 10% 10% 10% 10% Fe oxides 3.22 3.54 3.99 4.79 4.32 CaO 35 27.41 30.26 27.76 Not fluxed 29.46 29.28 SiO2 30 36.22 37.87 34.85 Not fluxed 32.41 30.83 MgO 20 13.34 13.23 14.34 Not fluxed 14.4 14.82 Al2O3 5 6.85 6.2 6.61 Not fluxed 5.91 5.78 P <.01 <.01 <.01 Not fluxed <.01 <.01 MnO 1.17 1.32 1.76 Not fluxed 1.44 1.99 S 0.05 0.05 0.11 Not fluxed 0.08 0.11 K2O 1.21 1.05 1.18 Not fluxed 1.52 1.72 V2O5 0.02 0.02 0.03 Not fluxed 0.02 0.02 TiO2 0.11 0.13 0.28 Not fluxed 0.32 0.23 Na2O 0.27 0.23 0.21 Not fluxed 0.28 0.22 Cr2O3 4.65 4.38 4.22 Not fluxed 5.29 4.8 ZrO2 0.59 0.45 0.51 Not fluxed 0.53 0.77 F NA NA NA NA NA NA 95.11 98.73 95.85 96.45 94.89 Fluxing time (min)
~5 mins
Not fully fluxed
Comments Cr2O3 contamination from well filler. Slag thoroughly fluxed by end.
Slag slow to flux
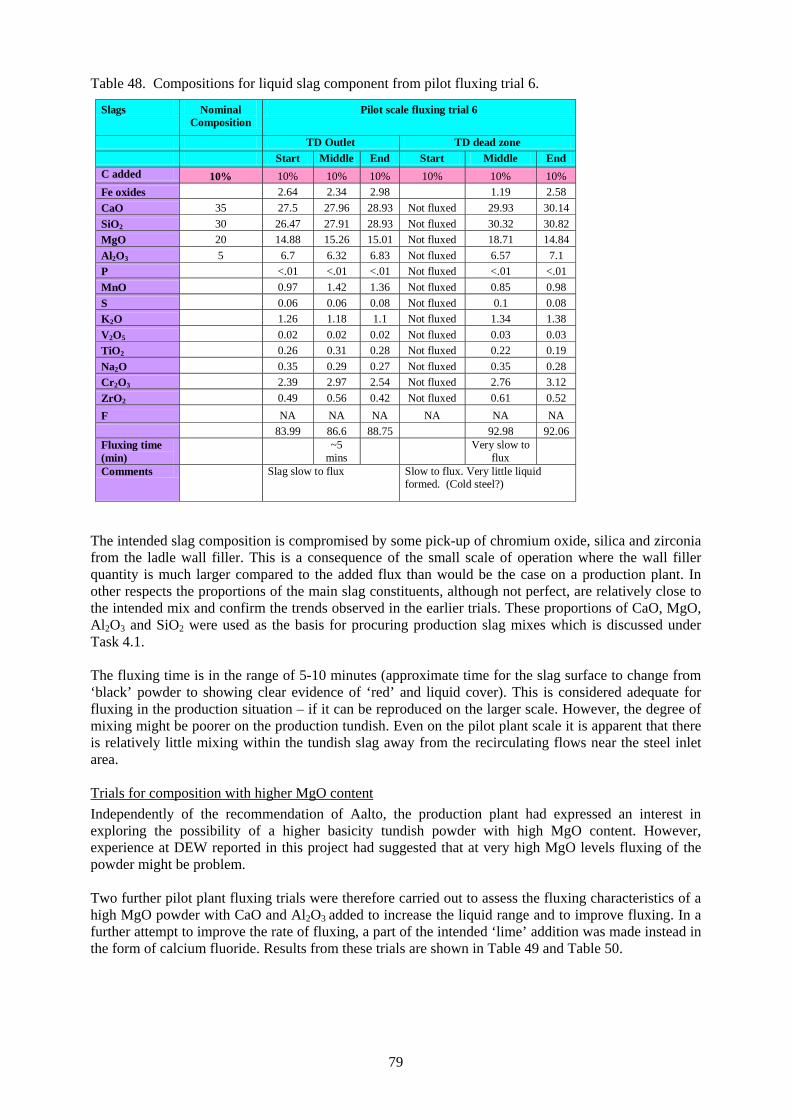
79
Table 48. Compositions for liquid slag component from pilot fluxing trial 6.
Slags Nominal Composition
Pilot scale fluxing trial 6
TD Outlet TD dead zone Start Middle End Start Middle End C added 10% 10% 10% 10% 10% 10% 10% Fe oxides 2.64 2.34 2.98 1.19 2.58 CaO 35 27.5 27.96 28.93 Not fluxed 29.93 30.14 SiO2 30 26.47 27.91 28.93 Not fluxed 30.32 30.82 MgO 20 14.88 15.26 15.01 Not fluxed 18.71 14.84 Al2O3 5 6.7 6.32 6.83 Not fluxed 6.57 7.1 P <.01 <.01 <.01 Not fluxed <.01 <.01 MnO 0.97 1.42 1.36 Not fluxed 0.85 0.98 S 0.06 0.06 0.08 Not fluxed 0.1 0.08 K2O 1.26 1.18 1.1 Not fluxed 1.34 1.38 V2O5 0.02 0.02 0.02 Not fluxed 0.03 0.03 TiO2 0.26 0.31 0.28 Not fluxed 0.22 0.19 Na2O 0.35 0.29 0.27 Not fluxed 0.35 0.28 Cr2O3 2.39 2.97 2.54 Not fluxed 2.76 3.12 ZrO2 0.49 0.56 0.42 Not fluxed 0.61 0.52 F NA NA NA NA NA NA 83.99 86.6 88.75 92.98 92.06 Fluxing time (min)
~5 mins
Very slow to flux
Comments Slag slow to flux Slow to flux. Very little liquid formed. (Cold steel?)
The intended slag composition is compromised by some pick-up of chromium oxide, silica and zirconia from the ladle wall filler. This is a consequence of the small scale of operation where the wall filler quantity is much larger compared to the added flux than would be the case on a production plant. In other respects the proportions of the main slag constituents, although not perfect, are relatively close to the intended mix and confirm the trends observed in the earlier trials. These proportions of CaO, MgO, Al2O3 and SiO2 were used as the basis for procuring production slag mixes which is discussed under Task 4.1. The fluxing time is in the range of 5-10 minutes (approximate time for the slag surface to change from ‘black’ powder to showing clear evidence of ‘red’ and liquid cover). This is considered adequate for fluxing in the production situation – if it can be reproduced on the larger scale. However, the degree of mixing might be poorer on the production tundish. Even on the pilot plant scale it is apparent that there is relatively little mixing within the tundish slag away from the recirculating flows near the steel inlet area. Trials for composition with higher MgO content Independently of the recommendation of Aalto, the production plant had expressed an interest in exploring the possibility of a higher basicity tundish powder with high MgO content. However, experience at DEW reported in this project had suggested that at very high MgO levels fluxing of the powder might be problem. Two further pilot plant fluxing trials were therefore carried out to assess the fluxing characteristics of a high MgO powder with CaO and Al2O3 added to increase the liquid range and to improve fluxing. In a further attempt to improve the rate of fluxing, a part of the intended ‘lime’ addition was made instead in the form of calcium fluoride. Results from these trials are shown in Table 49 and Table 50.
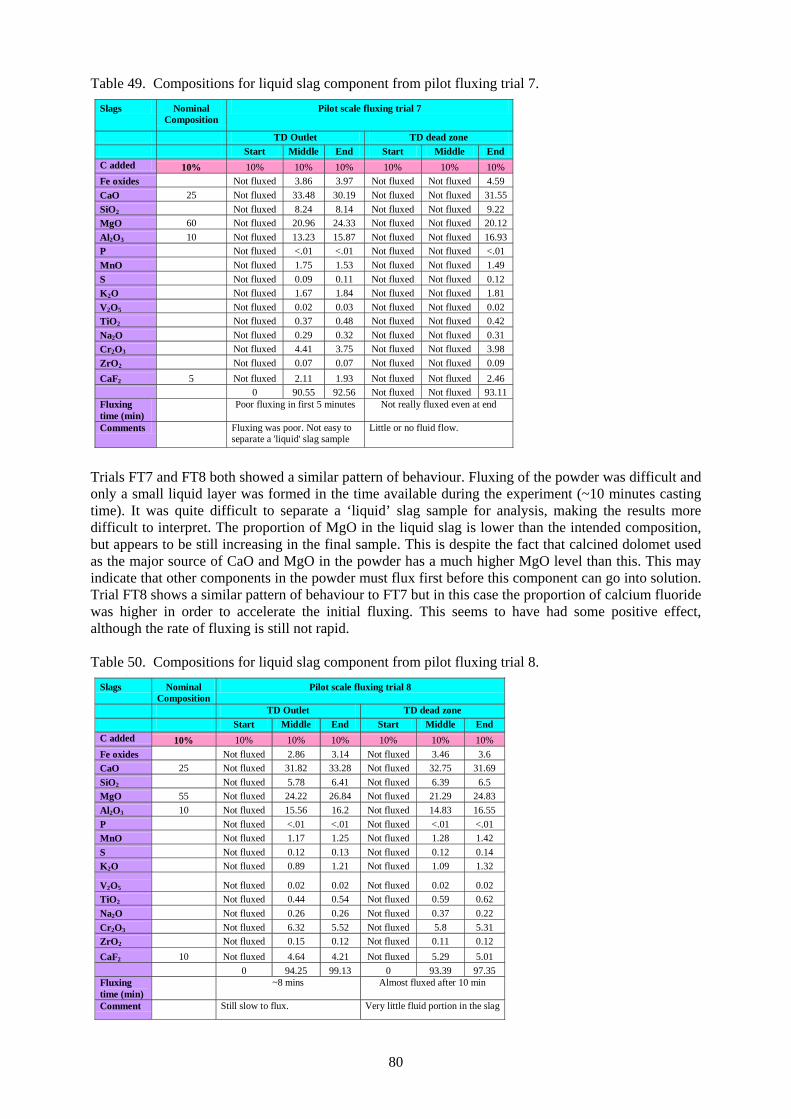
80
Table 49. Compositions for liquid slag component from pilot fluxing trial 7. Slags Nominal
Composition Pilot scale fluxing trial 7
TD Outlet TD dead zone Start Middle End Start Middle End C added 10% 10% 10% 10% 10% 10% 10% Fe oxides Not fluxed 3.86 3.97 Not fluxed Not fluxed 4.59 CaO 25 Not fluxed 33.48 30.19 Not fluxed Not fluxed 31.55 SiO2 Not fluxed 8.24 8.14 Not fluxed Not fluxed 9.22MgO 60 Not fluxed 20.96 24.33 Not fluxed Not fluxed 20.12 Al2O3 10 Not fluxed 13.23 15.87 Not fluxed Not fluxed 16.93 P Not fluxed <.01 <.01 Not fluxed Not fluxed <.01 MnO Not fluxed 1.75 1.53 Not fluxed Not fluxed 1.49 S Not fluxed 0.09 0.11 Not fluxed Not fluxed 0.12 K2O Not fluxed 1.67 1.84 Not fluxed Not fluxed 1.81 V2O5 Not fluxed 0.02 0.03 Not fluxed Not fluxed 0.02 TiO2 Not fluxed 0.37 0.48 Not fluxed Not fluxed 0.42 Na2O Not fluxed 0.29 0.32 Not fluxed Not fluxed 0.31 Cr2O3 Not fluxed 4.41 3.75 Not fluxed Not fluxed 3.98 ZrO2 Not fluxed 0.07 0.07 Not fluxed Not fluxed 0.09 CaF2 5 Not fluxed 2.11 1.93 Not fluxed Not fluxed 2.46 0 90.55 92.56 Not fluxed Not fluxed 93.11 Fluxing time (min)
Poor fluxing in first 5 minutes
Not really fluxed even at end
Comments Fluxing was poor. Not easy to separate a 'liquid' slag sample
Little or no fluid flow.
Trials FT7 and FT8 both showed a similar pattern of behaviour. Fluxing of the powder was difficult and only a small liquid layer was formed in the time available during the experiment (~10 minutes casting time). It was quite difficult to separate a ‘liquid’ slag sample for analysis, making the results more difficult to interpret. The proportion of MgO in the liquid slag is lower than the intended composition, but appears to be still increasing in the final sample. This is despite the fact that calcined dolomet used as the major source of CaO and MgO in the powder has a much higher MgO level than this. This may indicate that other components in the powder must flux first before this component can go into solution. Trial FT8 shows a similar pattern of behaviour to FT7 but in this case the proportion of calcium fluoride was higher in order to accelerate the initial fluxing. This seems to have had some positive effect, although the rate of fluxing is still not rapid. Table 50. Compositions for liquid slag component from pilot fluxing trial 8.
Slags Nominal Composition
Pilot scale fluxing trial 8
TD Outlet TD dead zone Start Middle End Start Middle End C added 10% 10% 10% 10% 10% 10% 10% Fe oxides Not fluxed 2.86 3.14 Not fluxed 3.46 3.6CaO 25 Not fluxed 31.82 33.28 Not fluxed 32.75 31.69 SiO2 Not fluxed 5.78 6.41 Not fluxed 6.39 6.5 MgO 55 Not fluxed 24.22 26.84 Not fluxed 21.29 24.83 Al2O3 10 Not fluxed 15.56 16.2 Not fluxed 14.83 16.55 P Not fluxed <.01 <.01 Not fluxed <.01 <.01 MnO Not fluxed 1.17 1.25 Not fluxed 1.28 1.42 S Not fluxed 0.12 0.13 Not fluxed 0.12 0.14 K2O Not fluxed 0.89 1.21 Not fluxed 1.09 1.32
V2O5 Not fluxed 0.02 0.02 Not fluxed 0.02 0.02 TiO2 Not fluxed 0.44 0.54 Not fluxed 0.59 0.62 Na2O Not fluxed 0.26 0.26 Not fluxed 0.37 0.22 Cr2O3 Not fluxed 6.32 5.52 Not fluxed 5.8 5.31 ZrO2 Not fluxed 0.15 0.12 Not fluxed 0.11 0.12 CaF2 10 Not fluxed 4.64 4.21 Not fluxed 5.29 5.01 0 94.25 99.13 0 93.39 97.35 Fluxing time (min)
~8 mins
Almost fluxed after 10 min
Comment Still slow to flux. Very little fluid portion in the slag

81
At Tata Steel suitability of pumice material (Table 51) for use as a tundish powder was tested on its own or as part of a blend. Table 51. Analysis of the pumice material.
Component Fe CaO SiO2 MnO Al2O3 MgO P2O5 K2O TiO2 Na2O Cr2O3
LOI @ 1000°C
Pumice 8.3 12.8 47.8 0.18 15 9 0.18 0.27 1.7 1.9 0.05 0.33 Both the STA tests and small scale melting on an induction furnace showed that the material has a relatively low melting point, fluxed easily and had a high consumption rate. The results were mixed, with the first induction furnace tests the pumice melted quickly forming a fully liquid cover, but in further tests a liquid layer underneath and a sintered and powder layer was more satisfactory. Following this work discussions were held with the production plant to plan for plant trials (see WP4).

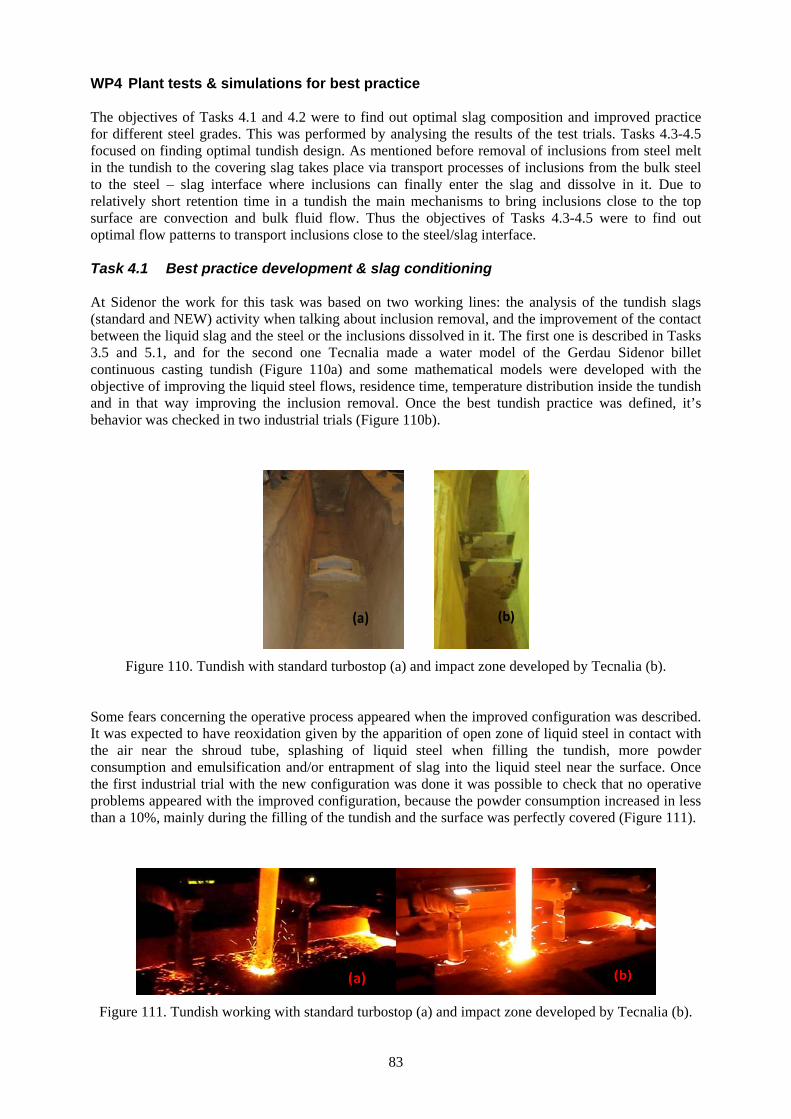
83
WP4 Plant tests & simulations for best practice The objectives of Tasks 4.1 and 4.2 were to find out optimal slag composition and improved practice for different steel grades. This was performed by analysing the results of the test trials. Tasks 4.3-4.5 focused on finding optimal tundish design. As mentioned before removal of inclusions from steel melt in the tundish to the covering slag takes place via transport processes of inclusions from the bulk steel to the steel – slag interface where inclusions can finally enter the slag and dissolve in it. Due to relatively short retention time in a tundish the main mechanisms to bring inclusions close to the top surface are convection and bulk fluid flow. Thus the objectives of Tasks 4.3-4.5 were to find out optimal flow patterns to transport inclusions close to the steel/slag interface. Task 4.1 Best practice development & slag conditioning At Sidenor the work for this task was based on two working lines: the analysis of the tundish slags (standard and NEW) activity when talking about inclusion removal, and the improvement of the contact between the liquid slag and the steel or the inclusions dissolved in it. The first one is described in Tasks 3.5 and 5.1, and for the second one Tecnalia made a water model of the Gerdau Sidenor billet continuous casting tundish (Figure 110a) and some mathematical models were developed with the objective of improving the liquid steel flows, residence time, temperature distribution inside the tundish and in that way improving the inclusion removal. Once the best tundish practice was defined, it’s behavior was checked in two industrial trials (Figure 110b).
(a)
(b)
Figure 110. Tundish with standard turbostop (a) and impact zone developed by Tecnalia (b).
Some fears concerning the operative process appeared when the improved configuration was described. It was expected to have reoxidation given by the apparition of open zone of liquid steel in contact with the air near the shroud tube, splashing of liquid steel when filling the tundish, more powder consumption and emulsification and/or entrapment of slag into the liquid steel near the surface. Once the first industrial trial with the new configuration was done it was possible to check that no operative problems appeared with the improved configuration, because the powder consumption increased in less than a 10%, mainly during the filling of the tundish and the surface was perfectly covered (Figure 111).
(a) (b)
Figure 111. Tundish working with standard turbostop (a) and impact zone developed by Tecnalia (b).
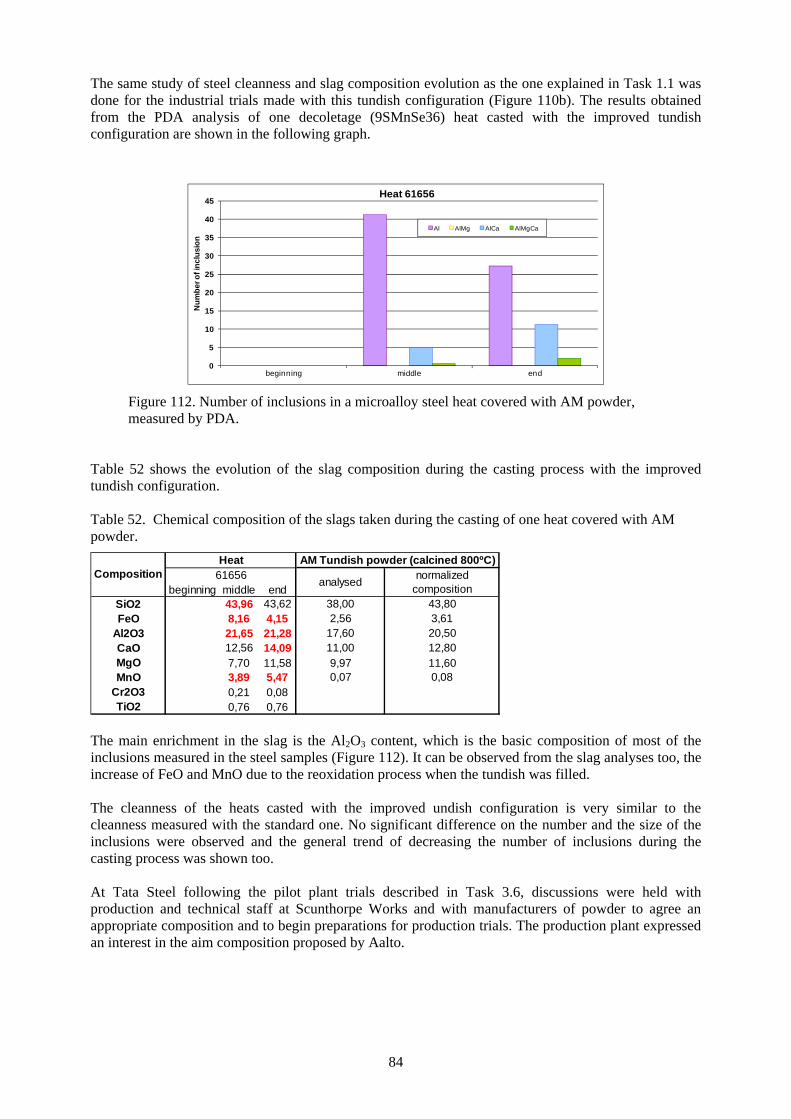
84
The same study of steel cleanness and slag composition evolution as the one explained in Task 1.1 was done for the industrial trials made with this tundish configuration (Figure 110b). The results obtained from the PDA analysis of one decoletage (9SMnSe36) heat casted with the improved tundish configuration are shown in the following graph.
0
5
10
15
20
25
30
35
40
45
beginning middle end
Num
ber o
f inc
lusi
onHeat 61656
Al AlMg AlCa AlMgCa
Figure 112. Number of inclusions in a microalloy steel heat covered with AM powder,
measured by PDA. Table 52 shows the evolution of the slag composition during the casting process with the improved tundish configuration. Table 52. Chemical composition of the slags taken during the casting of one heat covered with AM powder.
beginning middle endSiO2 43,96 43,62 38,00 43,80FeO 8,16 4,15 2,56 3,61
Al2O3 21,65 21,28 17,60 20,50CaO 12,56 14,09 11,00 12,80MgO 7,70 11,58 9,97 11,60MnO 3,89 5,47 0,07 0,08
Cr2O3 0,21 0,08TiO2 0,76 0,76
AM Tundish powder (calcined 800ºC)61656 analysed normalized
composition
HeatComposition
The main enrichment in the slag is the Al2O3 content, which is the basic composition of most of the inclusions measured in the steel samples (Figure 112). It can be observed from the slag analyses too, the increase of FeO and MnO due to the reoxidation process when the tundish was filled. The cleanness of the heats casted with the improved undish configuration is very similar to the cleanness measured with the standard one. No significant difference on the number and the size of the inclusions were observed and the general trend of decreasing the number of inclusions during the casting process was shown too. At Tata Steel following the pilot plant trials described in Task 3.6, discussions were held with production and technical staff at Scunthorpe Works and with manufacturers of powder to agree an appropriate composition and to begin preparations for production trials. The production plant expressed an interest in the aim composition proposed by Aalto.
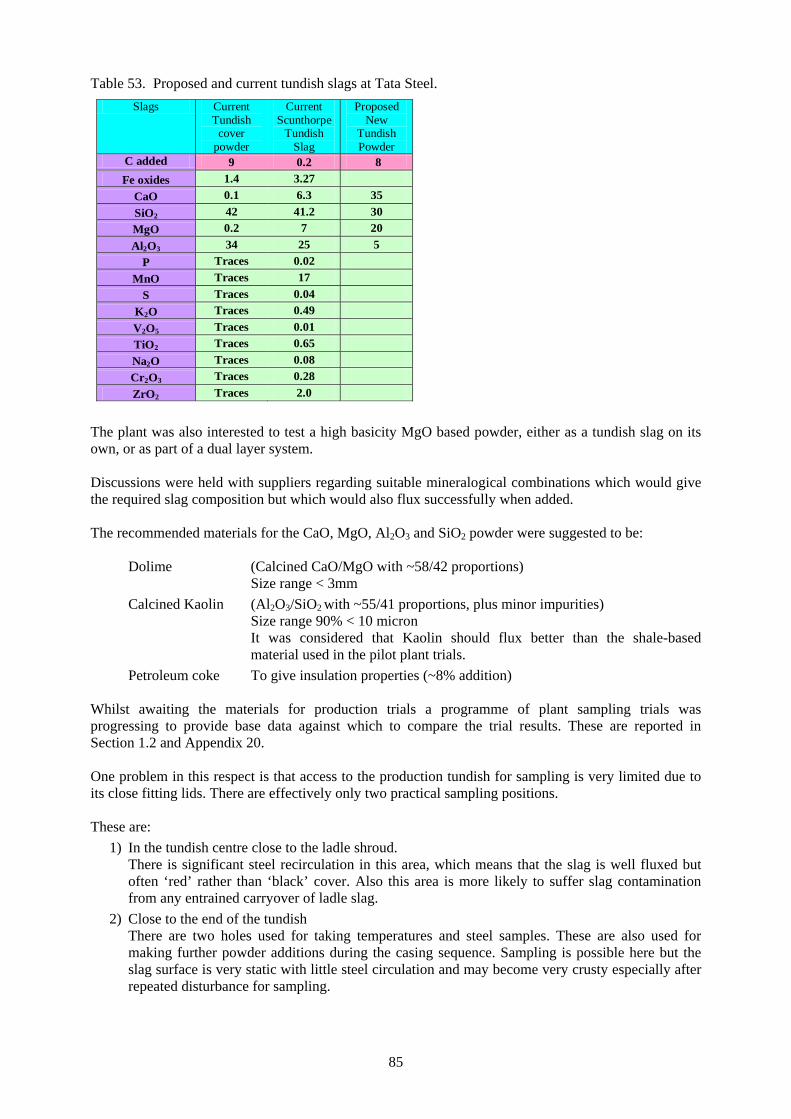
85
Table 53. Proposed and current tundish slags at Tata Steel. Slags Current
Tundish cover
powder
Current Scunthorpe
Tundish Slag
Proposed New
Tundish Powder
C added 9 0.2 8 Fe oxides 1.4 3.27
CaO 0.1 6.3 35 SiO2 42 41.2 30 MgO 0.2 7 20 Al2O3 34 25 5
P Traces 0.02 MnO Traces 17
S Traces 0.04 K2O Traces 0.49 V2O5 Traces 0.01 TiO2 Traces 0.65 Na2O Traces 0.08 Cr2O3 Traces 0.28 ZrO2 Traces 2.0
The plant was also interested to test a high basicity MgO based powder, either as a tundish slag on its own, or as part of a dual layer system. Discussions were held with suppliers regarding suitable mineralogical combinations which would give the required slag composition but which would also flux successfully when added. The recommended materials for the CaO, MgO, Al2O3 and SiO2 powder were suggested to be: Dolime (Calcined CaO/MgO with ~58/42 proportions) Size range < 3mm Calcined Kaolin (Al2O3/SiO2 with ~55/41 proportions, plus minor impurities) Size range 90% < 10 micron
It was considered that Kaolin should flux better than the shale-based material used in the pilot plant trials.
Petroleum coke To give insulation properties (~8% addition) Whilst awaiting the materials for production trials a programme of plant sampling trials was progressing to provide base data against which to compare the trial results. These are reported in Section 1.2 and Appendix 20. One problem in this respect is that access to the production tundish for sampling is very limited due to its close fitting lids. There are effectively only two practical sampling positions. These are: 1) In the tundish centre close to the ladle shroud.
There is significant steel recirculation in this area, which means that the slag is well fluxed but often ‘red’ rather than ‘black’ cover. Also this area is more likely to suffer slag contamination from any entrained carryover of ladle slag.
2) Close to the end of the tundish There are two holes used for taking temperatures and steel samples. These are also used for making further powder additions during the casing sequence. Sampling is possible here but the slag surface is very static with little steel circulation and may become very crusty especially after repeated disturbance for sampling.
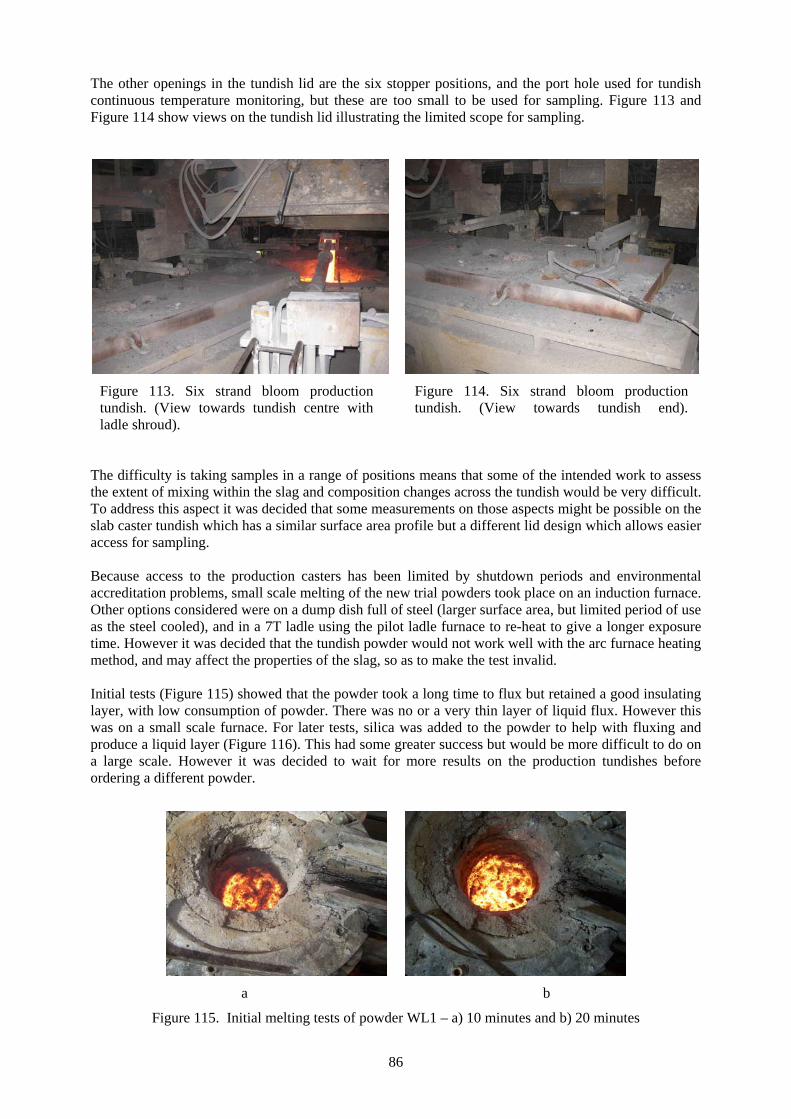
86
The other openings in the tundish lid are the six stopper positions, and the port hole used for tundish continuous temperature monitoring, but these are too small to be used for sampling. Figure 113 and Figure 114 show views on the tundish lid illustrating the limited scope for sampling.
Figure 113. Six strand bloom production tundish. (View towards tundish centre with ladle shroud).
Figure 114. Six strand bloom production tundish. (View towards tundish end).
The difficulty is taking samples in a range of positions means that some of the intended work to assess the extent of mixing within the slag and composition changes across the tundish would be very difficult. To address this aspect it was decided that some measurements on those aspects might be possible on the slab caster tundish which has a similar surface area profile but a different lid design which allows easier access for sampling. Because access to the production casters has been limited by shutdown periods and environmental accreditation problems, small scale melting of the new trial powders took place on an induction furnace. Other options considered were on a dump dish full of steel (larger surface area, but limited period of use as the steel cooled), and in a 7T ladle using the pilot ladle furnace to re-heat to give a longer exposure time. However it was decided that the tundish powder would not work well with the arc furnace heating method, and may affect the properties of the slag, so as to make the test invalid. Initial tests (Figure 115) showed that the powder took a long time to flux but retained a good insulating layer, with low consumption of powder. There was no or a very thin layer of liquid flux. However this was on a small scale furnace. For later tests, silica was added to the powder to help with fluxing and produce a liquid layer (Figure 116). This had some greater success but would be more difficult to do on a large scale. However it was decided to wait for more results on the production tundishes before ordering a different powder.
a b
Figure 115. Initial melting tests of powder WL1 – a) 10 minutes and b) 20 minutes
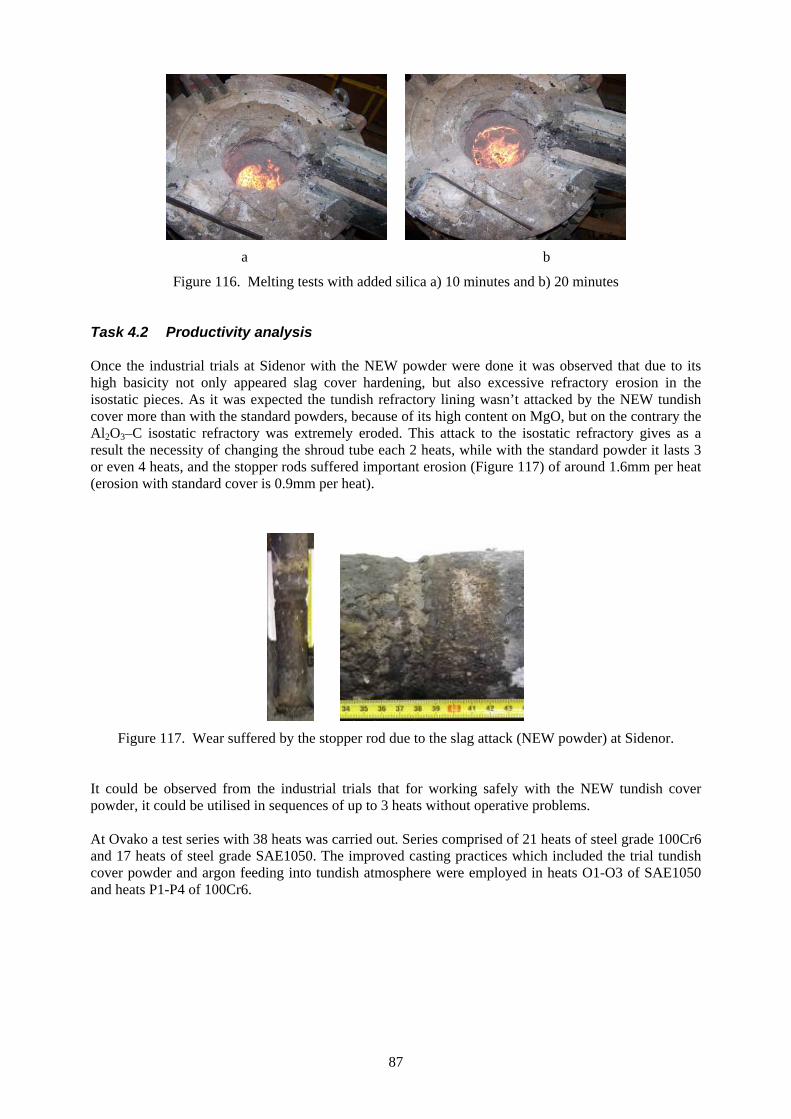
87
a b
Figure 116. Melting tests with added silica a) 10 minutes and b) 20 minutes Task 4.2 Productivity analysis Once the industrial trials at Sidenor with the NEW powder were done it was observed that due to its high basicity not only appeared slag cover hardening, but also excessive refractory erosion in the isostatic pieces. As it was expected the tundish refractory lining wasn’t attacked by the NEW tundish cover more than with the standard powders, because of its high content on MgO, but on the contrary the Al2O3–C isostatic refractory was extremely eroded. This attack to the isostatic refractory gives as a result the necessity of changing the shroud tube each 2 heats, while with the standard powder it lasts 3 or even 4 heats, and the stopper rods suffered important erosion (Figure 117) of around 1.6mm per heat (erosion with standard cover is 0.9mm per heat).
Figure 117. Wear suffered by the stopper rod due to the slag attack (NEW powder) at Sidenor.
It could be observed from the industrial trials that for working safely with the NEW tundish cover powder, it could be utilised in sequences of up to 3 heats without operative problems. At Ovako a test series with 38 heats was carried out. Series comprised of 21 heats of steel grade 100Cr6 and 17 heats of steel grade SAE1050. The improved casting practices which included the trial tundish cover powder and argon feeding into tundish atmosphere were employed in heats O1-O3 of SAE1050 and heats P1-P4 of 100Cr6.
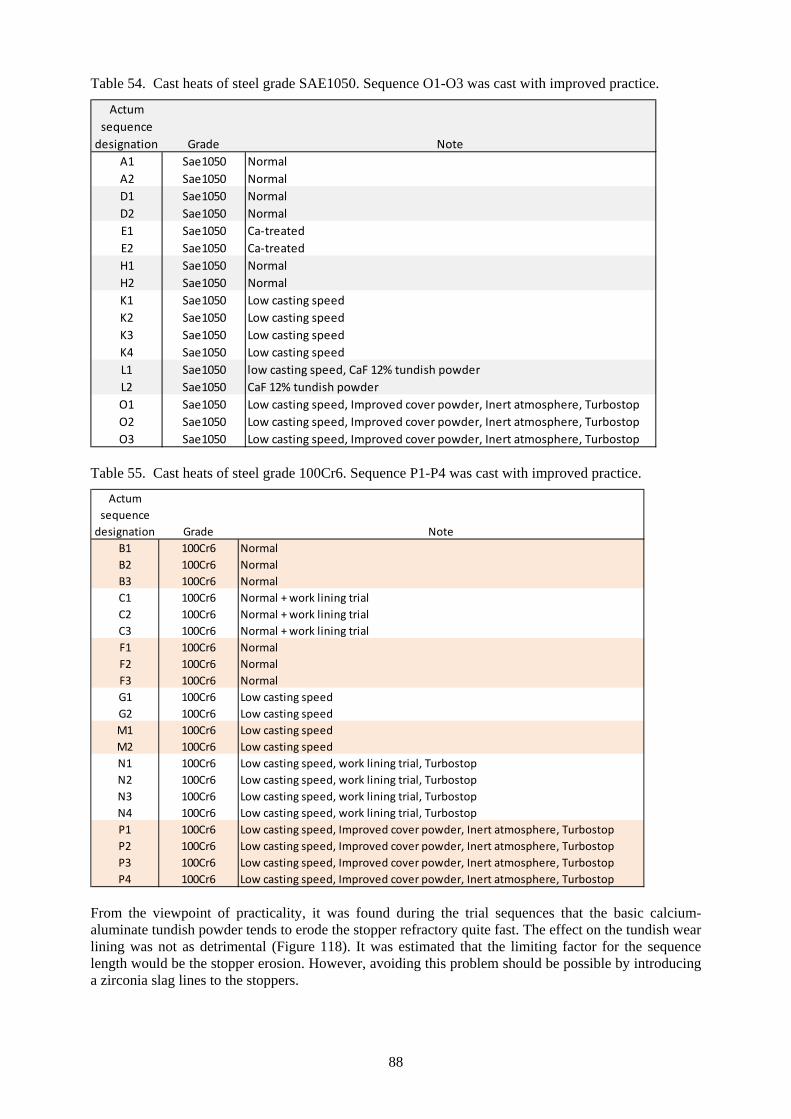
88
Table 54. Cast heats of steel grade SAE1050. Sequence O1-O3 was cast with improved practice.
Actum sequence designation Grade Note
A1 Sae1050 NormalA2 Sae1050 NormalD1 Sae1050 NormalD2 Sae1050 NormalE1 Sae1050 Ca‐treatedE2 Sae1050 Ca‐treatedH1 Sae1050 NormalH2 Sae1050 NormalK1 Sae1050 Low casting speedK2 Sae1050 Low casting speedK3 Sae1050 Low casting speedK4 Sae1050 Low casting speedL1 Sae1050 low casting speed, CaF 12% tundish powderL2 Sae1050 CaF 12% tundish powderO1 Sae1050 Low casting speed, Improved cover powder, Inert atmosphere, TurbostopO2 Sae1050 Low casting speed, Improved cover powder, Inert atmosphere, TurbostopO3 Sae1050 Low casting speed, Improved cover powder, Inert atmosphere, Turbostop
Table 55. Cast heats of steel grade 100Cr6. Sequence P1-P4 was cast with improved practice.
Actum sequence designation Grade Note
B1 100Cr6 NormalB2 100Cr6 NormalB3 100Cr6 NormalC1 100Cr6 Normal + work lining trialC2 100Cr6 Normal + work lining trialC3 100Cr6 Normal + work lining trialF1 100Cr6 NormalF2 100Cr6 NormalF3 100Cr6 NormalG1 100Cr6 Low casting speedG2 100Cr6 Low casting speedM1 100Cr6 Low casting speedM2 100Cr6 Low casting speedN1 100Cr6 Low casting speed, work lining trial, TurbostopN2 100Cr6 Low casting speed, work lining trial, TurbostopN3 100Cr6 Low casting speed, work lining trial, TurbostopN4 100Cr6 Low casting speed, work lining trial, TurbostopP1 100Cr6 Low casting speed, Improved cover powder, Inert atmosphere, TurbostopP2 100Cr6 Low casting speed, Improved cover powder, Inert atmosphere, TurbostopP3 100Cr6 Low casting speed, Improved cover powder, Inert atmosphere, TurbostopP4 100Cr6 Low casting speed, Improved cover powder, Inert atmosphere, Turbostop
From the viewpoint of practicality, it was found during the trial sequences that the basic calcium-aluminate tundish powder tends to erode the stopper refractory quite fast. The effect on the tundish wear lining was not as detrimental (Figure 118). It was estimated that the limiting factor for the sequence length would be the stopper erosion. However, avoiding this problem should be possible by introducing a zirconia slag lines to the stoppers.
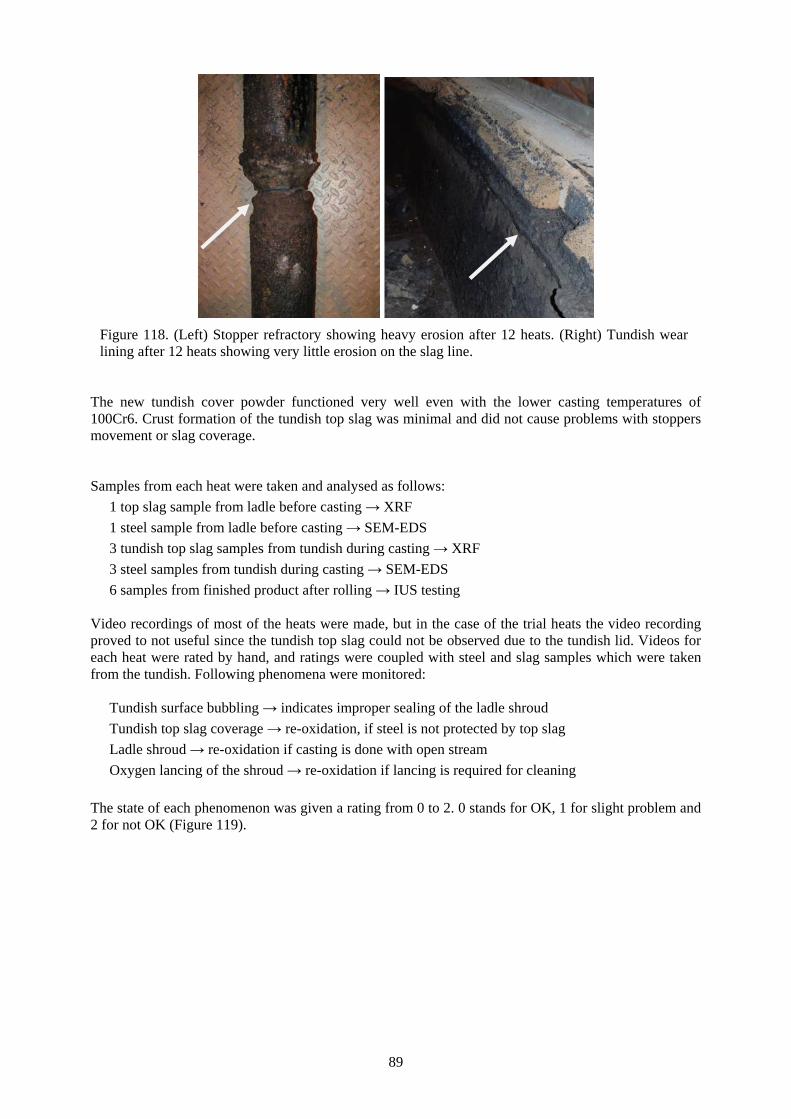
89
Figure 118. (Left) Stopper refractory showing heavy erosion after 12 heats. (Right) Tundish wear lining after 12 heats showing very little erosion on the slag line.
The new tundish cover powder functioned very well even with the lower casting temperatures of 100Cr6. Crust formation of the tundish top slag was minimal and did not cause problems with stoppers movement or slag coverage. Samples from each heat were taken and analysed as follows:
1 top slag sample from ladle before casting → XRF 1 steel sample from ladle before casting → SEM-EDS 3 tundish top slag samples from tundish during casting → XRF 3 steel samples from tundish during casting → SEM-EDS 6 samples from finished product after rolling → IUS testing
Video recordings of most of the heats were made, but in the case of the trial heats the video recording proved to not useful since the tundish top slag could not be observed due to the tundish lid. Videos for each heat were rated by hand, and ratings were coupled with steel and slag samples which were taken from the tundish. Following phenomena were monitored:
Tundish surface bubbling → indicates improper sealing of the ladle shroud Tundish top slag coverage → re-oxidation, if steel is not protected by top slag Ladle shroud → re-oxidation if casting is done with open stream Oxygen lancing of the shroud → re-oxidation if lancing is required for cleaning
The state of each phenomenon was given a rating from 0 to 2. 0 stands for OK, 1 for slight problem and 2 for not OK (Figure 119).
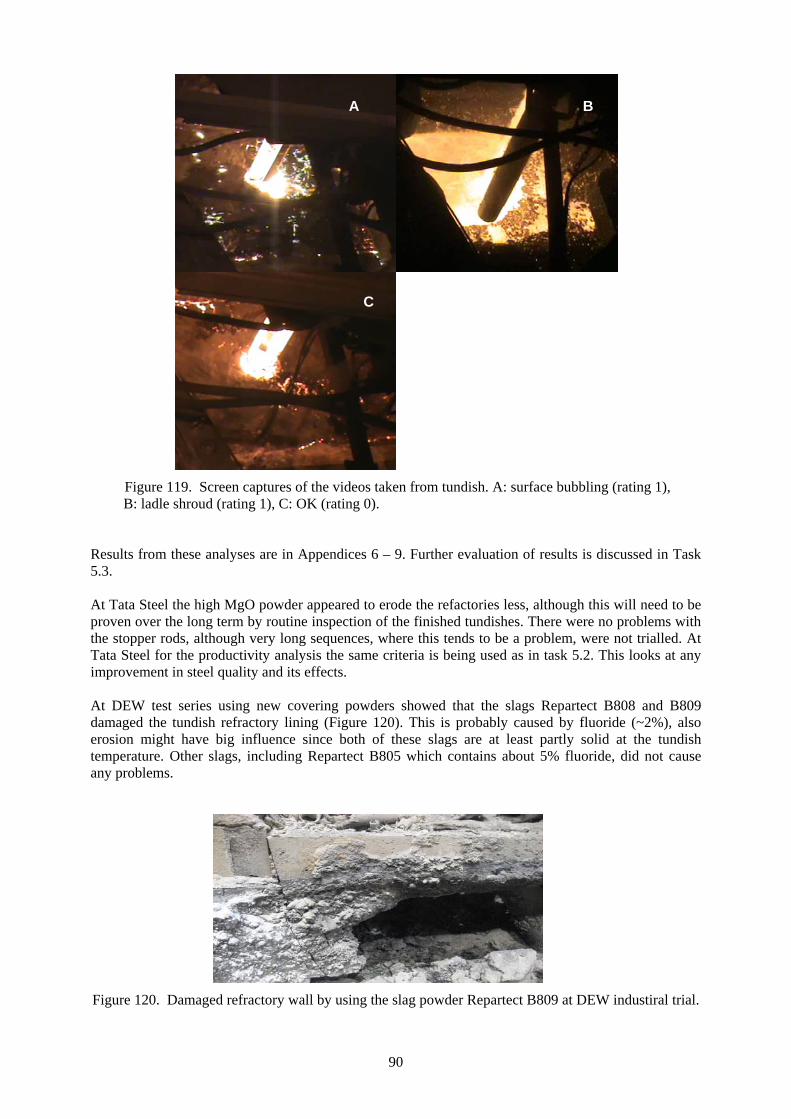
90
Figure 119. Screen captures of the videos taken from tundish. A: surface bubbling (rating 1),
B: ladle shroud (rating 1), C: OK (rating 0). Results from these analyses are in Appendices 6 – 9. Further evaluation of results is discussed in Task 5.3. At Tata Steel the high MgO powder appeared to erode the refactories less, although this will need to be proven over the long term by routine inspection of the finished tundishes. There were no problems with the stopper rods, although very long sequences, where this tends to be a problem, were not trialled. At Tata Steel for the productivity analysis the same criteria is being used as in task 5.2. This looks at any improvement in steel quality and its effects. At DEW test series using new covering powders showed that the slags Repartect B808 and B809 damaged the tundish refractory lining (Figure 120). This is probably caused by fluoride (~2%), also erosion might have big influence since both of these slags are at least partly solid at the tundish temperature. Other slags, including Repartect B805 which contains about 5% fluoride, did not cause any problems.
Figure 120. Damaged refractory wall by using the slag powder Repartect B809 at DEW industiral trial.
A B
C
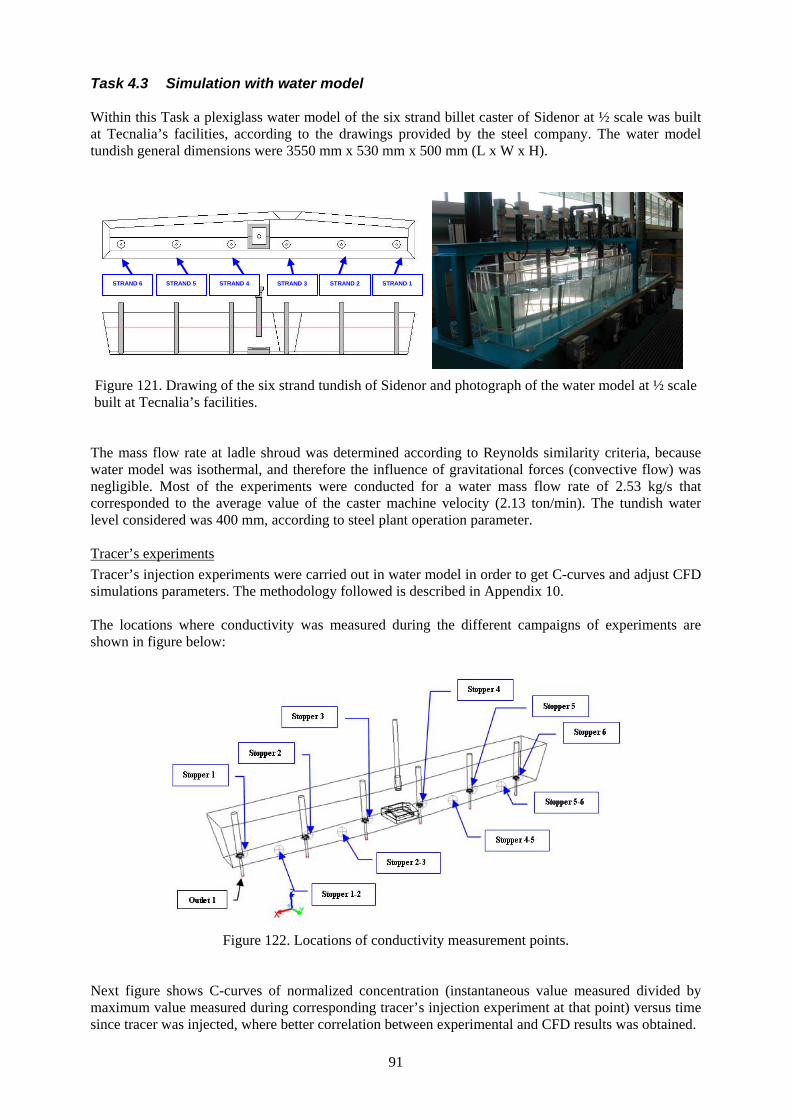
91
Task 4.3 Simulation with water model Within this Task a plexiglass water model of the six strand billet caster of Sidenor at ½ scale was built at Tecnalia’s facilities, according to the drawings provided by the steel company. The water model tundish general dimensions were 3550 mm x 530 mm x 500 mm (L x W x H).
Figure 121. Drawing of the six strand tundish of Sidenor and photograph of the water model at ½ scale
built at Tecnalia’s facilities. The mass flow rate at ladle shroud was determined according to Reynolds similarity criteria, because water model was isothermal, and therefore the influence of gravitational forces (convective flow) was negligible. Most of the experiments were conducted for a water mass flow rate of 2.53 kg/s that corresponded to the average value of the caster machine velocity (2.13 ton/min). The tundish water level considered was 400 mm, according to steel plant operation parameter. Tracer’s experiments Tracer’s injection experiments were carried out in water model in order to get C-curves and adjust CFD simulations parameters. The methodology followed is described in Appendix 10. The locations where conductivity was measured during the different campaigns of experiments are shown in figure below:
Figure 122. Locations of conductivity measurement points.
Next figure shows C-curves of normalized concentration (instantaneous value measured divided by maximum value measured during corresponding tracer’s injection experiment at that point) versus time since tracer was injected, where better correlation between experimental and CFD results was obtained.
STRAND 6 STRAND 5 STRAND 4 STRAND 3 STRAND 2 STRAND 1
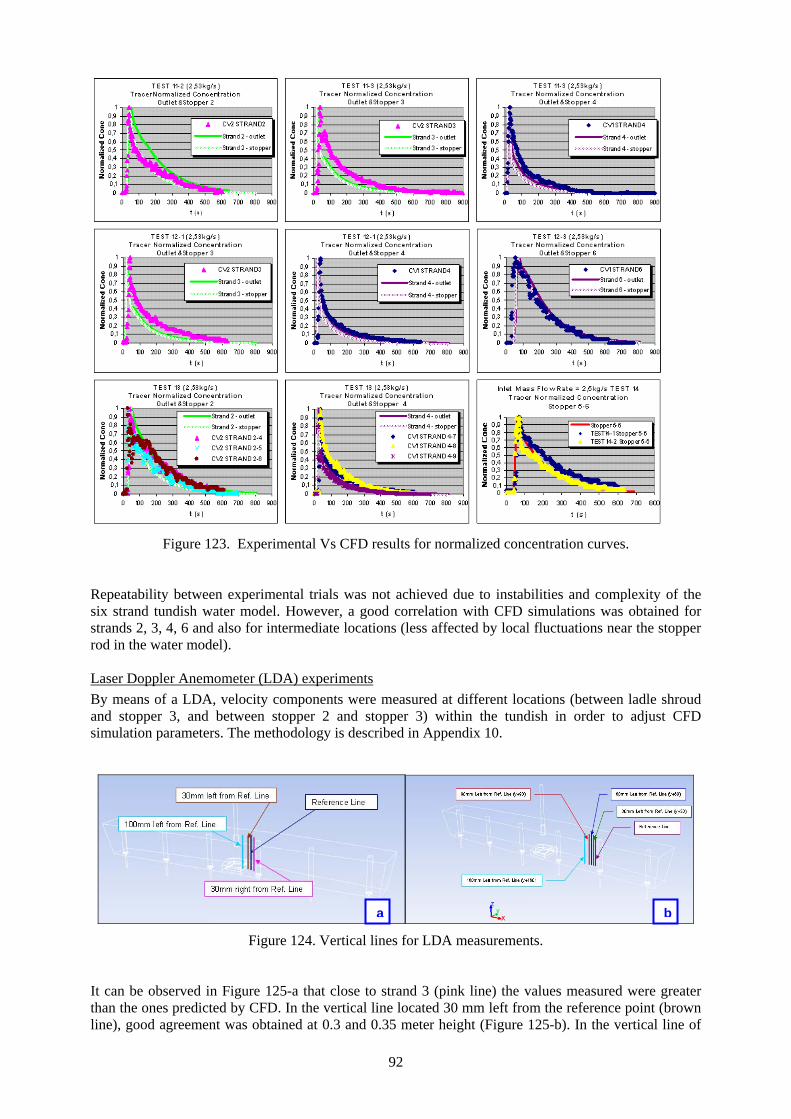
92
Figure 123. Experimental Vs CFD results for normalized concentration curves.
Repeatability between experimental trials was not achieved due to instabilities and complexity of the six strand tundish water model. However, a good correlation with CFD simulations was obtained for strands 2, 3, 4, 6 and also for intermediate locations (less affected by local fluctuations near the stopper rod in the water model). Laser Doppler Anemometer (LDA) experiments By means of a LDA, velocity components were measured at different locations (between ladle shroud and stopper 3, and between stopper 2 and stopper 3) within the tundish in order to adjust CFD simulation parameters. The methodology is described in Appendix 10.
Figure 124. Vertical lines for LDA measurements.
It can be observed in Figure 125-a that close to strand 3 (pink line) the values measured were greater than the ones predicted by CFD. In the vertical line located 30 mm left from the reference point (brown line), good agreement was obtained at 0.3 and 0.35 meter height (Figure 125-b). In the vertical line of
a b
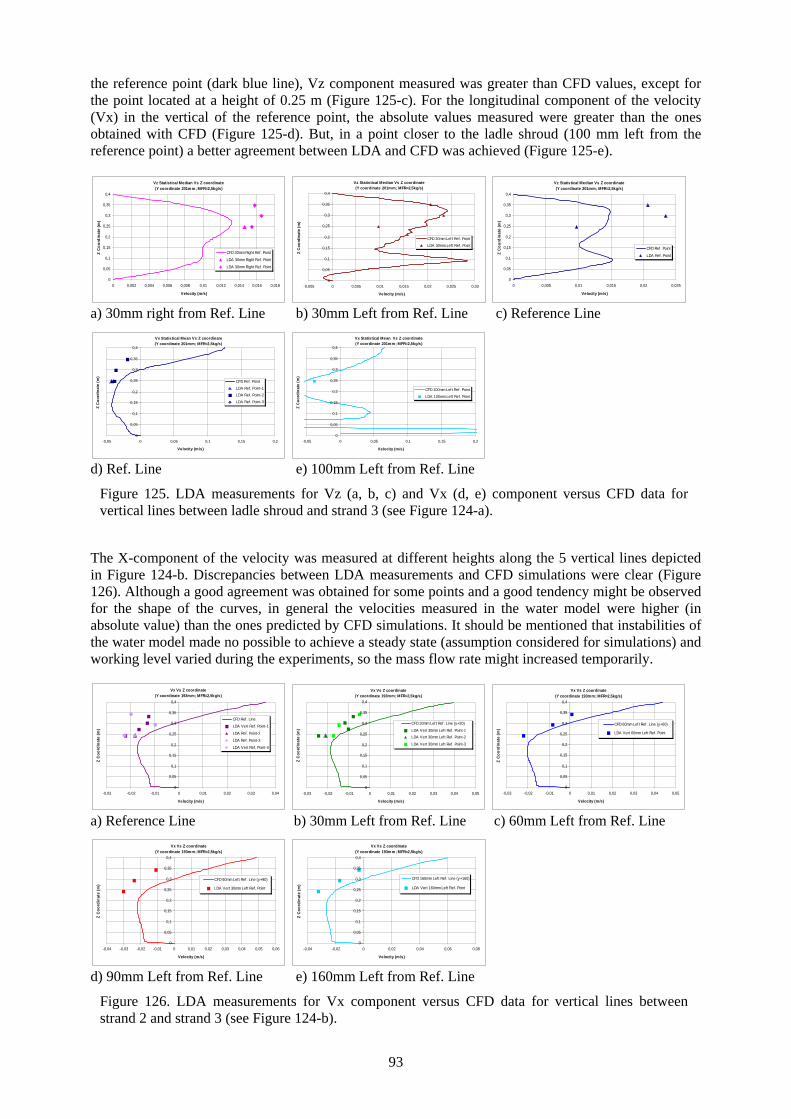
93
the reference point (dark blue line), Vz component measured was greater than CFD values, except for the point located at a height of 0.25 m (Figure 125-c). For the longitudinal component of the velocity (Vx) in the vertical of the reference point, the absolute values measured were greater than the ones obtained with CFD (Figure 125-d). But, in a point closer to the ladle shroud (100 mm left from the reference point) a better agreement between LDA and CFD was achieved (Figure 125-e).
Vz Statistical Median Vs Z coordinate(Y coordinate 201mm; MFR=2,5kg/s)
0
0,05
0,1
0,15
0,2
0,25
0,3
0,35
0,4
0 0,002 0,004 0,006 0,008 0,01 0,012 0,014 0,016 0,018
Velocity (m/s)
Z C
oord
inat
e (m
)
CFD 30mm Right Ref. Point
LDA 30mm Right Ref. Point
LDA 30mm Right Ref. Point
Vz Statistical Median Vs Z coordinate(Y coordinate 201mm; MFR=2,5kg/s)
0
0,05
0,1
0,15
0,2
0,25
0,3
0,35
0,4
-0,005 0 0,005 0,01 0,015 0,02 0,025 0,03
Velocity (m/s)Z
Coo
rdin
ate
(m)
CFD 30mm Left Ref. Point
LDA 30mm Left Ref. Point
Vz Statistical Median Vs Z coordinate(Y coordinate 201mm; MFR=2,5kg/s)
0
0,05
0,1
0,15
0,2
0,25
0,3
0,35
0,4
0 0,005 0,01 0,015 0,02 0,025
Velocity (m/s)
Z C
oord
inat
e (m
)
CFD Ref. Point
LDA Ref. Point
a) 30mm right from Ref. Line b) 30mm Left from Ref. Line c) Reference Line
Vx Statistical Mean Vs Z coordinate(Y coordinate 201mm; MFR=2,5kg/s)
0
0,05
0,1
0,15
0,2
0,25
0,3
0,35
0,4
-0,05 0 0,05 0,1 0,15 0,2
Velocity (m/s)
Z C
oord
inat
e (m
)
CFD Ref. Point
LDA Ref. Point-1
LDA Ref. Point-2
LDA Ref. Point-3
Vx Statistical Mean Vs Z coordinate(Y coordinate 201mm; MFR=2,5kg/s)
0
0,05
0,1
0,15
0,2
0,25
0,3
0,35
0,4
-0,05 0 0,05 0,1 0,15 0,2
Velocity (m/s)
Z C
oord
inat
e (m
)
CFD 100mm Left Ref. Point
LDA 100mm Left Ref. Point
d) Ref. Line e) 100mm Left from Ref. Line
Figure 125. LDA measurements for Vz (a, b, c) and Vx (d, e) component versus CFD data for vertical lines between ladle shroud and strand 3 (see Figure 124-a).
The X-component of the velocity was measured at different heights along the 5 vertical lines depicted in Figure 124-b. Discrepancies between LDA measurements and CFD simulations were clear (Figure 126). Although a good agreement was obtained for some points and a good tendency might be observed for the shape of the curves, in general the velocities measured in the water model were higher (in absolute value) than the ones predicted by CFD simulations. It should be mentioned that instabilities of the water model made no possible to achieve a steady state (assumption considered for simulations) and working level varied during the experiments, so the mass flow rate might increased temporarily.
Vx Vs Z coordinate(Y coordinate 193mm; MFR=2,5kg/s)
0
0,05
0,1
0,15
0,2
0,25
0,3
0,35
0,4
-0,03 -0,02 -0,01 0 0,01 0,02 0,03 0,04
Velocity (m/s)
Z C
oord
inat
e (m
)
CFD Ref. Line
LDA Vert Ref. Point-1
LDA Ref. Point-2
LDA Ref. Point-3
LDA Vert Ref. Point-4
Vx Vs Z coordinate(Y coordinate 193mm; MFR=2,5kg/s)
0
0,05
0,1
0,15
0,2
0,25
0,3
0,35
0,4
-0,03 -0,02 -0,01 0 0,01 0,02 0,03 0,04 0,05
Velocity (m/s)
Z C
oord
inat
e (m
)
CFD 30mm Left Ref. Line (y+30)
LDA Vert 30mm Left Ref. Point-1LDA Vert 30mm Left Ref. Point-2
LDA Vert 30mm Left Ref. Point-3
Vx Vs Z coordinate(Y coordinate 193mm; MFR=2,5kg/s)
0
0,05
0,1
0,15
0,2
0,25
0,3
0,35
0,4
-0,03 -0,02 -0,01 0 0,01 0,02 0,03 0,04 0,05
Velocity (m/s)
Z C
oord
inat
e (m
)
CFD 60mm Left Ref. Line (y+60)
LDA Vert 60mm Left Ref. Point
a) Reference Line b) 30mm Left from Ref. Line c) 60mm Left from Ref. Line
Vx Vs Z coordinate(Y coordinate 193mm; MFR=2,5kg/s)
0
0,05
0,1
0,15
0,2
0,25
0,3
0,35
0,4
-0,04 -0,03 -0,02 -0,01 0 0,01 0,02 0,03 0,04 0,05 0,06
Velocity (m/s)
Z C
oord
inat
e (m
)
CFD 90mm Left Ref. Line (y+90)
LDA Vert 30mm Left Ref. Point
Vx Vs Z coordinate(Y coordinate 193mm; MFR=2,5kg/s)
0
0,05
0,1
0,15
0,2
0,25
0,3
0,35
0,4
-0,04 -0,02 0 0,02 0,04 0,06 0,08
Velocity (m/s)
Z C
oord
inat
e (m
)
CFD 160mm Left Ref. Line (y+160)
LDA Vert 160mm Left Ref. Point
d) 90mm Left from Ref. Line e) 160mm Left from Ref. Line
Figure 126. LDA measurements for Vx component versus CFD data for vertical lines between strand 2 and strand 3 (see Figure 124-b).
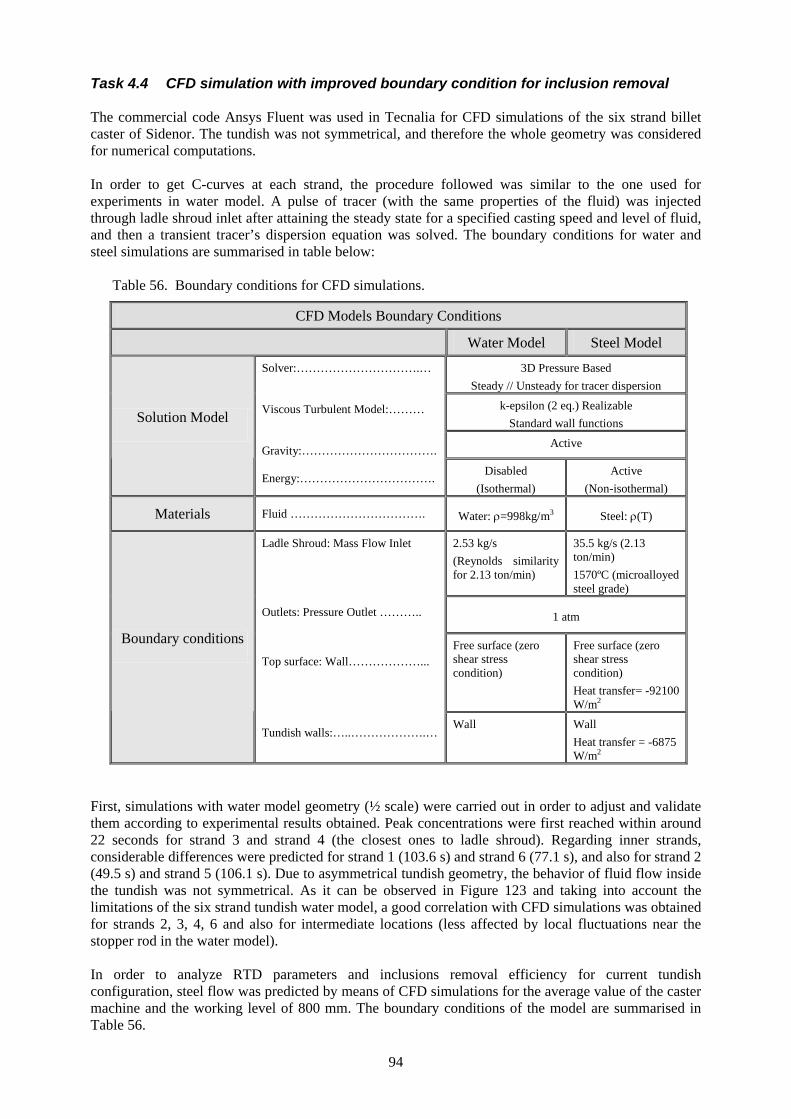
94
Task 4.4 CFD simulation with improved boundary condition for inclusion removal The commercial code Ansys Fluent was used in Tecnalia for CFD simulations of the six strand billet caster of Sidenor. The tundish was not symmetrical, and therefore the whole geometry was considered for numerical computations. In order to get C-curves at each strand, the procedure followed was similar to the one used for experiments in water model. A pulse of tracer (with the same properties of the fluid) was injected through ladle shroud inlet after attaining the steady state for a specified casting speed and level of fluid, and then a transient tracer’s dispersion equation was solved. The boundary conditions for water and steel simulations are summarised in table below:
Table 56. Boundary conditions for CFD simulations.
CFD Models Boundary Conditions
Water Model Steel Model
3D Pressure Based Steady // Unsteady for tracer dispersion
k-epsilon (2 eq.) Realizable Standard wall functions
Active
Solution Model
Solver:………………………….… Viscous Turbulent Model:……… Gravity:……………………………. Energy:……………………………. Disabled
(Isothermal) Active
(Non-isothermal)
Materials Fluid ……………………………. Water: ρ=998kg/m3 Steel: ρ(T)
2.53 kg/s (Reynolds similarity for 2.13 ton/min)
35.5 kg/s (2.13 ton/min) 1570ºC (microalloyed steel grade)
1 atm
Free surface (zero shear stress condition)
Free surface (zero shear stress condition) Heat transfer= -92100 W/m2
Boundary conditions
Ladle Shroud: Mass Flow Inlet Outlets: Pressure Outlet ……….. Top surface: Wall………………... Tundish walls:…..……………….…
Wall Wall Heat transfer = -6875 W/m2
First, simulations with water model geometry (½ scale) were carried out in order to adjust and validate them according to experimental results obtained. Peak concentrations were first reached within around 22 seconds for strand 3 and strand 4 (the closest ones to ladle shroud). Regarding inner strands, considerable differences were predicted for strand 1 (103.6 s) and strand 6 (77.1 s), and also for strand 2 (49.5 s) and strand 5 (106.1 s). Due to asymmetrical tundish geometry, the behavior of fluid flow inside the tundish was not symmetrical. As it can be observed in Figure 123 and taking into account the limitations of the six strand tundish water model, a good correlation with CFD simulations was obtained for strands 2, 3, 4, 6 and also for intermediate locations (less affected by local fluctuations near the stopper rod in the water model). In order to analyze RTD parameters and inclusions removal efficiency for current tundish configuration, steel flow was predicted by means of CFD simulations for the average value of the caster machine and the working level of 800 mm. The boundary conditions of the model are summarised in Table 56.
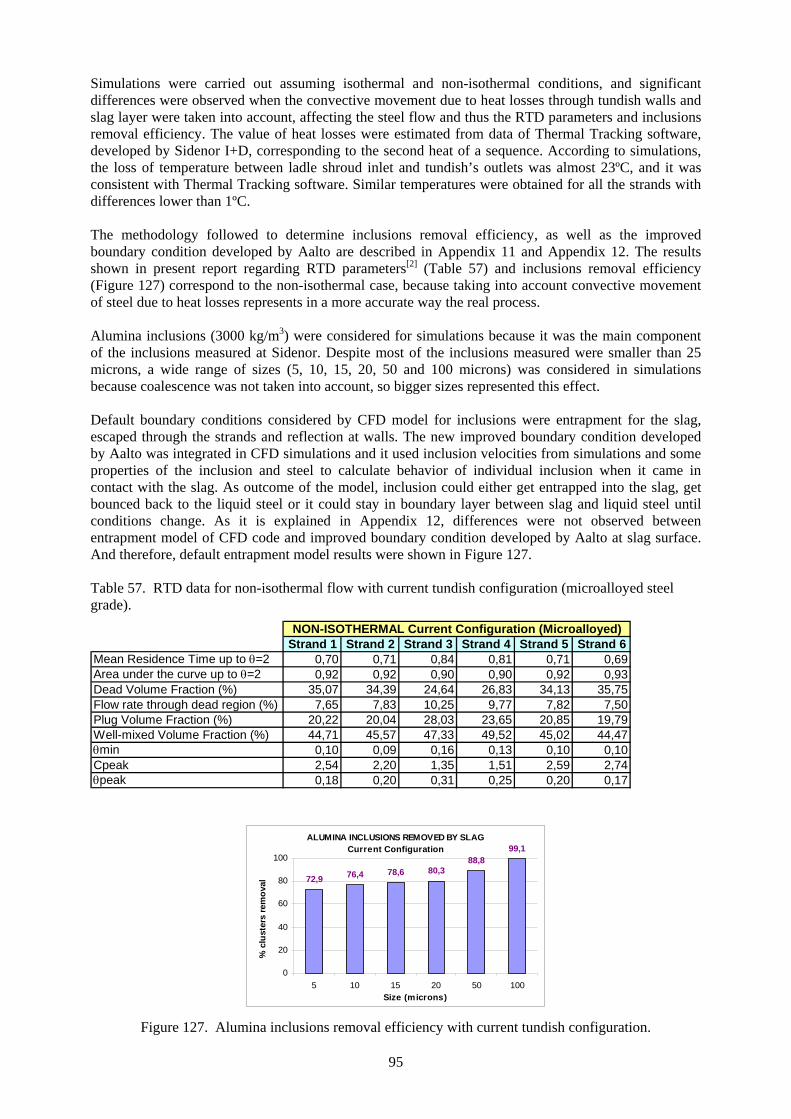
95
Simulations were carried out assuming isothermal and non-isothermal conditions, and significant differences were observed when the convective movement due to heat losses through tundish walls and slag layer were taken into account, affecting the steel flow and thus the RTD parameters and inclusions removal efficiency. The value of heat losses were estimated from data of Thermal Tracking software, developed by Sidenor I+D, corresponding to the second heat of a sequence. According to simulations, the loss of temperature between ladle shroud inlet and tundish’s outlets was almost 23ºC, and it was consistent with Thermal Tracking software. Similar temperatures were obtained for all the strands with differences lower than 1ºC. The methodology followed to determine inclusions removal efficiency, as well as the improved boundary condition developed by Aalto are described in Appendix 11 and Appendix 12. The results shown in present report regarding RTD parameters[2] (Table 57) and inclusions removal efficiency (Figure 127) correspond to the non-isothermal case, because taking into account convective movement of steel due to heat losses represents in a more accurate way the real process. Alumina inclusions (3000 kg/m3) were considered for simulations because it was the main component of the inclusions measured at Sidenor. Despite most of the inclusions measured were smaller than 25 microns, a wide range of sizes (5, 10, 15, 20, 50 and 100 microns) was considered in simulations because coalescence was not taken into account, so bigger sizes represented this effect. Default boundary conditions considered by CFD model for inclusions were entrapment for the slag, escaped through the strands and reflection at walls. The new improved boundary condition developed by Aalto was integrated in CFD simulations and it used inclusion velocities from simulations and some properties of the inclusion and steel to calculate behavior of individual inclusion when it came in contact with the slag. As outcome of the model, inclusion could either get entrapped into the slag, get bounced back to the liquid steel or it could stay in boundary layer between slag and liquid steel until conditions change. As it is explained in Appendix 12, differences were not observed between entrapment model of CFD code and improved boundary condition developed by Aalto at slag surface. And therefore, default entrapment model results were shown in Figure 127. Table 57. RTD data for non-isothermal flow with current tundish configuration (microalloyed steel grade).
Strand 1 Strand 2 Strand 3 Strand 4 Strand 5 Strand 6Mean Residence Time up to θ=2 0,70 0,71 0,84 0,81 0,71 0,69Area under the curve up to θ=2 0,92 0,92 0,90 0,90 0,92 0,93Dead Volume Fraction (%) 35,07 34,39 24,64 26,83 34,13 35,75Flow rate through dead region (%) 7,65 7,83 10,25 9,77 7,82 7,50Plug Volume Fraction (%) 20,22 20,04 28,03 23,65 20,85 19,79Well-mixed Volume Fraction (%) 44,71 45,57 47,33 49,52 45,02 44,47θmin 0,10 0,09 0,16 0,13 0,10 0,10Cpeak 2,54 2,20 1,35 1,51 2,59 2,74θpeak 0,18 0,20 0,31 0,25 0,20 0,17
NON-ISOTHERMAL Current Configuration (Microalloyed)
ALUMINA INCLUSIONS REMOVED BY SLAGCurrent Configuration
72,9 76,4 78,6 80,388,8
99,1
0
20
40
60
80
100
5 10 15 20 50 100Size (microns)
% c
lust
ers
rem
oval
Figure 127. Alumina inclusions removal efficiency with current tundish configuration.
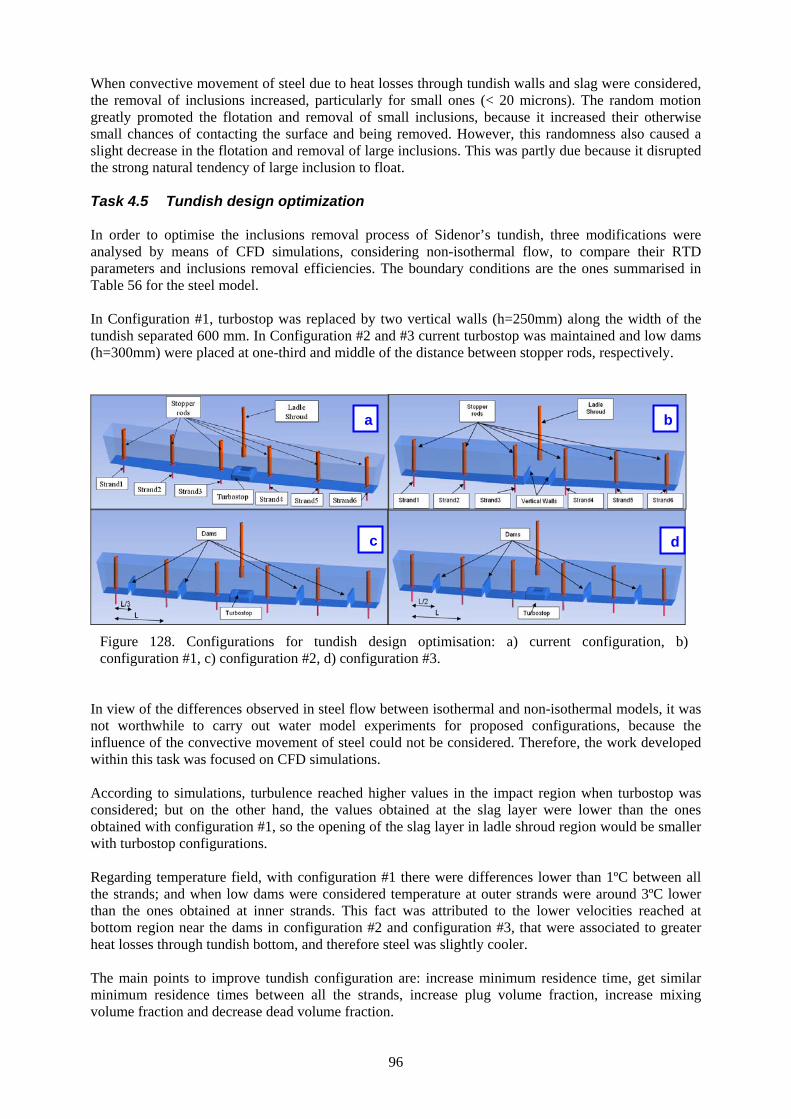
96
When convective movement of steel due to heat losses through tundish walls and slag were considered, the removal of inclusions increased, particularly for small ones (< 20 microns). The random motion greatly promoted the flotation and removal of small inclusions, because it increased their otherwise small chances of contacting the surface and being removed. However, this randomness also caused a slight decrease in the flotation and removal of large inclusions. This was partly due because it disrupted the strong natural tendency of large inclusion to float. Task 4.5 Tundish design optimization In order to optimise the inclusions removal process of Sidenor’s tundish, three modifications were analysed by means of CFD simulations, considering non-isothermal flow, to compare their RTD parameters and inclusions removal efficiencies. The boundary conditions are the ones summarised in Table 56 for the steel model. In Configuration #1, turbostop was replaced by two vertical walls (h=250mm) along the width of the tundish separated 600 mm. In Configuration #2 and #3 current turbostop was maintained and low dams (h=300mm) were placed at one-third and middle of the distance between stopper rods, respectively.
Figure 128. Configurations for tundish design optimisation: a) current configuration, b) configuration #1, c) configuration #2, d) configuration #3.
In view of the differences observed in steel flow between isothermal and non-isothermal models, it was not worthwhile to carry out water model experiments for proposed configurations, because the influence of the convective movement of steel could not be considered. Therefore, the work developed within this task was focused on CFD simulations. According to simulations, turbulence reached higher values in the impact region when turbostop was considered; but on the other hand, the values obtained at the slag layer were lower than the ones obtained with configuration #1, so the opening of the slag layer in ladle shroud region would be smaller with turbostop configurations. Regarding temperature field, with configuration #1 there were differences lower than 1ºC between all the strands; and when low dams were considered temperature at outer strands were around 3ºC lower than the ones obtained at inner strands. This fact was attributed to the lower velocities reached at bottom region near the dams in configuration #2 and configuration #3, that were associated to greater heat losses through tundish bottom, and therefore steel was slightly cooler. The main points to improve tundish configuration are: increase minimum residence time, get similar minimum residence times between all the strands, increase plug volume fraction, increase mixing volume fraction and decrease dead volume fraction.
a b
c d
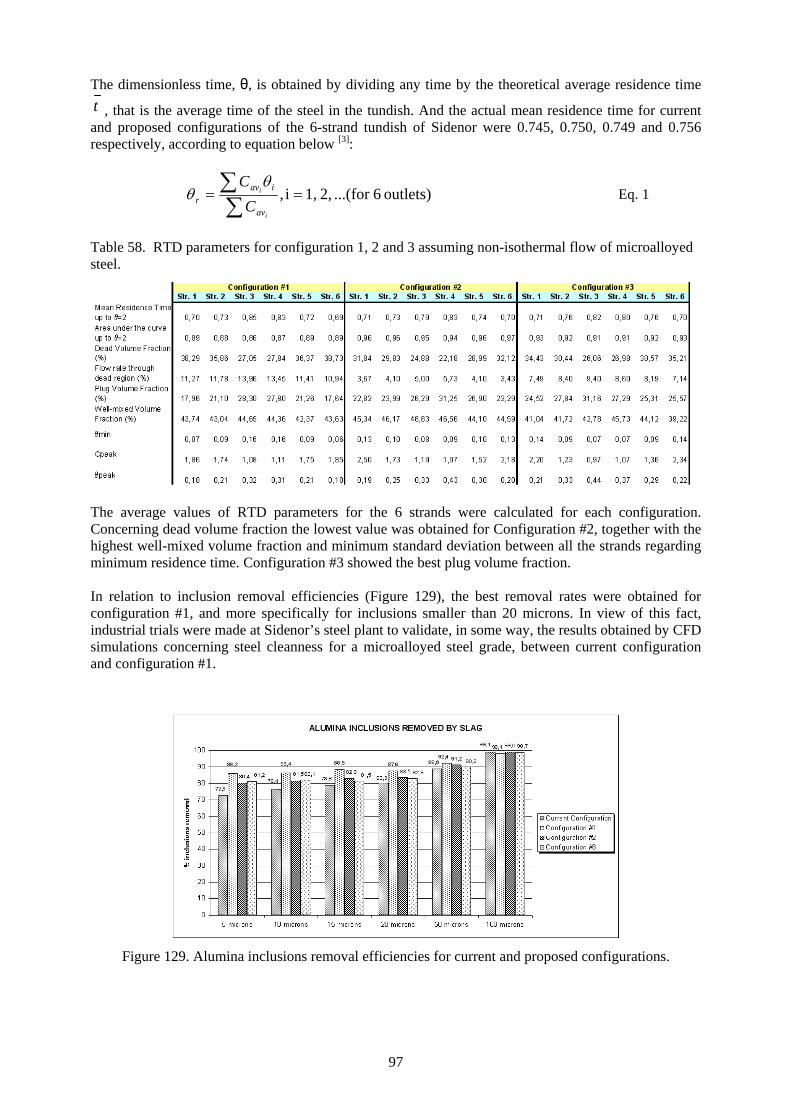
97
The dimensionless time, θ, is obtained by dividing any time by the theoretical average residence time t , that is the average time of the steel in the tundish. And the actual mean residence time for current and proposed configurations of the 6-strand tundish of Sidenor were 0.745, 0.750, 0.749 and 0.756 respectively, according to equation below [3]:
outlets) 6...(for 2, 1,i, ==∑∑
i
i
av
iavr C
C θθ Eq. 1
Table 58. RTD parameters for configuration 1, 2 and 3 assuming non-isothermal flow of microalloyed steel.
The average values of RTD parameters for the 6 strands were calculated for each configuration. Concerning dead volume fraction the lowest value was obtained for Configuration #2, together with the highest well-mixed volume fraction and minimum standard deviation between all the strands regarding minimum residence time. Configuration #3 showed the best plug volume fraction. In relation to inclusion removal efficiencies (Figure 129), the best removal rates were obtained for configuration #1, and more specifically for inclusions smaller than 20 microns. In view of this fact, industrial trials were made at Sidenor’s steel plant to validate, in some way, the results obtained by CFD simulations concerning steel cleanness for a microalloyed steel grade, between current configuration and configuration #1.
Figure 129. Alumina inclusions removal efficiencies for current and proposed configurations.

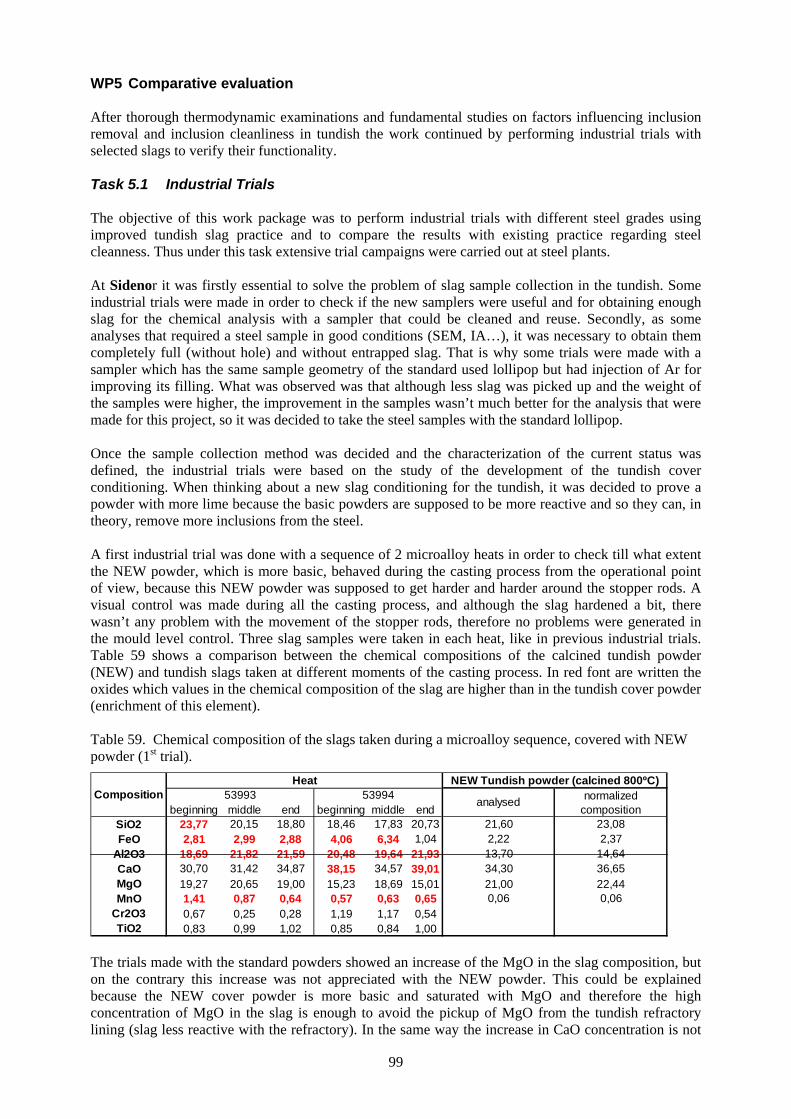
99
WP5 Comparative evaluation After thorough thermodynamic examinations and fundamental studies on factors influencing inclusion removal and inclusion cleanliness in tundish the work continued by performing industrial trials with selected slags to verify their functionality. Task 5.1 Industrial Trials The objective of this work package was to perform industrial trials with different steel grades using improved tundish slag practice and to compare the results with existing practice regarding steel cleanness. Thus under this task extensive trial campaigns were carried out at steel plants. At Sidenor it was firstly essential to solve the problem of slag sample collection in the tundish. Some industrial trials were made in order to check if the new samplers were useful and for obtaining enough slag for the chemical analysis with a sampler that could be cleaned and reuse. Secondly, as some analyses that required a steel sample in good conditions (SEM, IA…), it was necessary to obtain them completely full (without hole) and without entrapped slag. That is why some trials were made with a sampler which has the same sample geometry of the standard used lollipop but had injection of Ar for improving its filling. What was observed was that although less slag was picked up and the weight of the samples were higher, the improvement in the samples wasn’t much better for the analysis that were made for this project, so it was decided to take the steel samples with the standard lollipop. Once the sample collection method was decided and the characterization of the current status was defined, the industrial trials were based on the study of the development of the tundish cover conditioning. When thinking about a new slag conditioning for the tundish, it was decided to prove a powder with more lime because the basic powders are supposed to be more reactive and so they can, in theory, remove more inclusions from the steel. A first industrial trial was done with a sequence of 2 microalloy heats in order to check till what extent the NEW powder, which is more basic, behaved during the casting process from the operational point of view, because this NEW powder was supposed to get harder and harder around the stopper rods. A visual control was made during all the casting process, and although the slag hardened a bit, there wasn’t any problem with the movement of the stopper rods, therefore no problems were generated in the mould level control. Three slag samples were taken in each heat, like in previous industrial trials. Table 59 shows a comparison between the chemical compositions of the calcined tundish powder (NEW) and tundish slags taken at different moments of the casting process. In red font are written the oxides which values in the chemical composition of the slag are higher than in the tundish cover powder (enrichment of this element). Table 59. Chemical composition of the slags taken during a microalloy sequence, covered with NEW powder (1st trial).
beginning middle end beginning middle endSiO2 23,77 20,15 18,80 18,46 17,83 20,73 21,60 23,08FeO 2,81 2,99 2,88 4,06 6,34 1,04 2,22 2,37
Al2O3 18,69 21,82 21,59 20,48 19,64 21,93 13,70 14,64CaO 30,70 31,42 34,87 38,15 34,57 39,01 34,30 36,65MgO 19,27 20,65 19,00 15,23 18,69 15,01 21,00 22,44MnO 1,41 0,87 0,64 0,57 0,63 0,65 0,06 0,06
Cr2O3 0,67 0,25 0,28 1,19 1,17 0,54TiO2 0,83 0,99 1,02 0,85 0,84 1,00
NEW Tundish powder (calcined 800ºC)normalized
compositionanalysedComposition 53993 53994
Heat
The trials made with the standard powders showed an increase of the MgO in the slag composition, but on the contrary this increase was not appreciated with the NEW powder. This could be explained because the NEW cover powder is more basic and saturated with MgO and therefore the high concentration of MgO in the slag is enough to avoid the pickup of MgO from the tundish refractory lining (slag less reactive with the refractory). In the same way the increase in CaO concentration is not
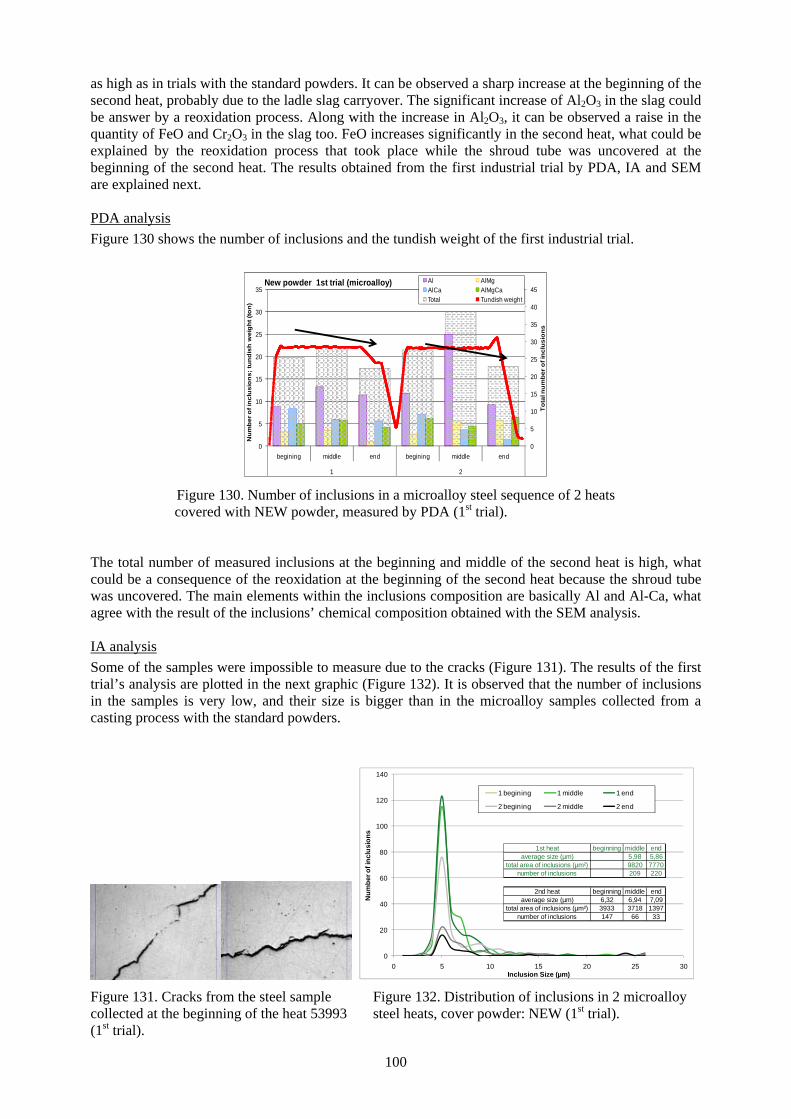
100
as high as in trials with the standard powders. It can be observed a sharp increase at the beginning of the second heat, probably due to the ladle slag carryover. The significant increase of Al2O3 in the slag could be answer by a reoxidation process. Along with the increase in Al2O3, it can be observed a raise in the quantity of FeO and Cr2O3 in the slag too. FeO increases significantly in the second heat, what could be explained by the reoxidation process that took place while the shroud tube was uncovered at the beginning of the second heat. The results obtained from the first industrial trial by PDA, IA and SEM are explained next. PDA analysis Figure 130 shows the number of inclusions and the tundish weight of the first industrial trial.
0
5
10
15
20
25
30
35
40
45
0
5
10
15
20
25
30
35
begining middle end begining middle end
1 2
To
tal n
um
ber
of i
ncl
usi
on
s
Nu
mb
er o
f in
clu
sio
ns;
tu
nd
ish
wei
gh
t (to
n)
New powder 1st trial (microalloy) Al AlMgAlCa AlMgCaTotal Tundish weight
Figure 130. Number of inclusions in a microalloy steel sequence of 2 heats
covered with NEW powder, measured by PDA (1st trial). The total number of measured inclusions at the beginning and middle of the second heat is high, what could be a consequence of the reoxidation at the beginning of the second heat because the shroud tube was uncovered. The main elements within the inclusions composition are basically Al and Al-Ca, what agree with the result of the inclusions’ chemical composition obtained with the SEM analysis. IA analysis Some of the samples were impossible to measure due to the cracks (Figure 131). The results of the first trial’s analysis are plotted in the next graphic (Figure 132). It is observed that the number of inclusions in the samples is very low, and their size is bigger than in the microalloy samples collected from a casting process with the standard powders.
0
20
40
60
80
100
120
140
0 5 10 15 20 25 30
Num
ber o
f inc
lusi
ons
Inclusion Size (µm)
1 begining 1 middle 1 end
2 begining 2 middle 2 end
1st heat beginning middle endaverage size (µm) 5,98 5,86
total area of inclusions (µm²) 9820 7770number of inclusions 209 220
2nd heat beginning middle endaverage size (µm) 6,32 6,94 7,09
total area of inclusions (µm²) 3933 3718 1397number of inclusions 147 66 33
Figure 131. Cracks from the steel sample collected at the beginning of the heat 53993 (1st trial).
Figure 132. Distribution of inclusions in 2 microalloy steel heats, cover powder: NEW (1st trial).
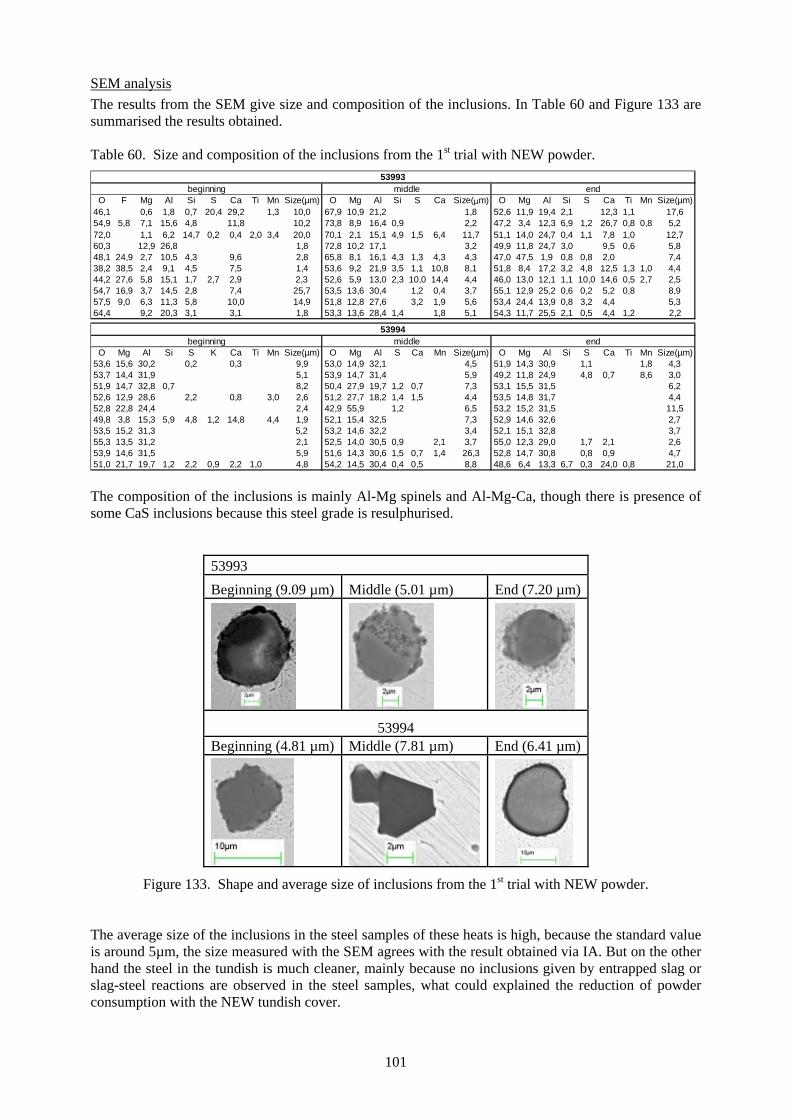
101
SEM analysis The results from the SEM give size and composition of the inclusions. In Table 60 and Figure 133 are summarised the results obtained. Table 60. Size and composition of the inclusions from the 1st trial with NEW powder.
O F Mg Al Si S Ca Ti Mn Size(µm) O Mg Al Si S Ca Size(µm) O Mg Al Si S Ca Ti Mn Size(µm)46,1 0,6 1,8 0,7 20,4 29,2 1,3 10,0 67,9 10,9 21,2 1,8 52,6 11,9 19,4 2,1 12,3 1,1 17,654,9 5,8 7,1 15,6 4,8 11,8 10,2 73,8 8,9 16,4 0,9 2,2 47,2 3,4 12,3 6,9 1,2 26,7 0,8 0,8 5,272,0 1,1 6,2 14,7 0,2 0,4 2,0 3,4 20,0 70,1 2,1 15,1 4,9 1,5 6,4 11,7 51,1 14,0 24,7 0,4 1,1 7,8 1,0 12,760,3 12,9 26,8 1,8 72,8 10,2 17,1 3,2 49,9 11,8 24,7 3,0 9,5 0,6 5,848,1 24,9 2,7 10,5 4,3 9,6 2,8 65,8 8,1 16,1 4,3 1,3 4,3 4,3 47,0 47,5 1,9 0,8 0,8 2,0 7,438,2 38,5 2,4 9,1 4,5 7,5 1,4 53,6 9,2 21,9 3,5 1,1 10,8 8,1 51,8 8,4 17,2 3,2 4,8 12,5 1,3 1,0 4,444,2 27,6 5,8 15,1 1,7 2,7 2,9 2,3 52,6 5,9 13,0 2,3 10,0 14,4 4,4 46,0 13,0 12,1 1,1 10,0 14,6 0,5 2,7 2,554,7 16,9 3,7 14,5 2,8 7,4 25,7 53,5 13,6 30,4 1,2 0,4 3,7 55,1 12,9 25,2 0,6 0,2 5,2 0,8 8,957,5 9,0 6,3 11,3 5,8 10,0 14,9 51,8 12,8 27,6 3,2 1,9 5,6 53,4 24,4 13,9 0,8 3,2 4,4 5,364,4 9,2 20,3 3,1 3,1 1,8 53,3 13,6 28,4 1,4 1,8 5,1 54,3 11,7 25,5 2,1 0,5 4,4 1,2 2,2
O Mg Al Si S K Ca Ti Mn Size(µm) O Mg Al S Ca Mn Size(µm) O Mg Al Si S Ca Ti Mn Size(µm)53,6 15,6 30,2 0,2 0,3 9,9 53,0 14,9 32,1 4,5 51,9 14,3 30,9 1,1 1,8 4,353,7 14,4 31,9 5,1 53,9 14,7 31,4 5,9 49,2 11,8 24,9 4,8 0,7 8,6 3,051,9 14,7 32,8 0,7 8,2 50,4 27,9 19,7 1,2 0,7 7,3 53,1 15,5 31,5 6,252,6 12,9 28,6 2,2 0,8 3,0 2,6 51,2 27,7 18,2 1,4 1,5 4,4 53,5 14,8 31,7 4,452,8 22,8 24,4 2,4 42,9 55,9 1,2 6,5 53,2 15,2 31,5 11,549,8 3,8 15,3 5,9 4,8 1,2 14,8 4,4 1,9 52,1 15,4 32,5 7,3 52,9 14,6 32,6 2,753,5 15,2 31,3 5,2 53,2 14,6 32,2 3,4 52,1 15,1 32,8 3,755,3 13,5 31,2 2,1 52,5 14,0 30,5 0,9 2,1 3,7 55,0 12,3 29,0 1,7 2,1 2,653,9 14,6 31,5 5,9 51,6 14,3 30,6 1,5 0,7 1,4 26,3 52,8 14,7 30,8 0,8 0,9 4,751,0 21,7 19,7 1,2 2,2 0,9 2,2 1,0 4,8 54,2 14,5 30,4 0,4 0,5 8,8 48,6 6,4 13,3 6,7 0,3 24,0 0,8 21,0
53993beginning middle end
53994beginning middle end
The composition of the inclusions is mainly Al-Mg spinels and Al-Mg-Ca, though there is presence of some CaS inclusions because this steel grade is resulphurised.
53993 Beginning (9.09 µm) Middle (5.01 µm) End (7.20 µm)
53994
Beginning (4.81 µm) Middle (7.81 µm) End (6.41 µm)
Figure 133. Shape and average size of inclusions from the 1st trial with NEW powder.
The average size of the inclusions in the steel samples of these heats is high, because the standard value is around 5µm, the size measured with the SEM agrees with the result obtained via IA. But on the other hand the steel in the tundish is much cleaner, mainly because no inclusions given by entrapped slag or slag-steel reactions are observed in the steel samples, what could explained the reduction of powder consumption with the NEW tundish cover.
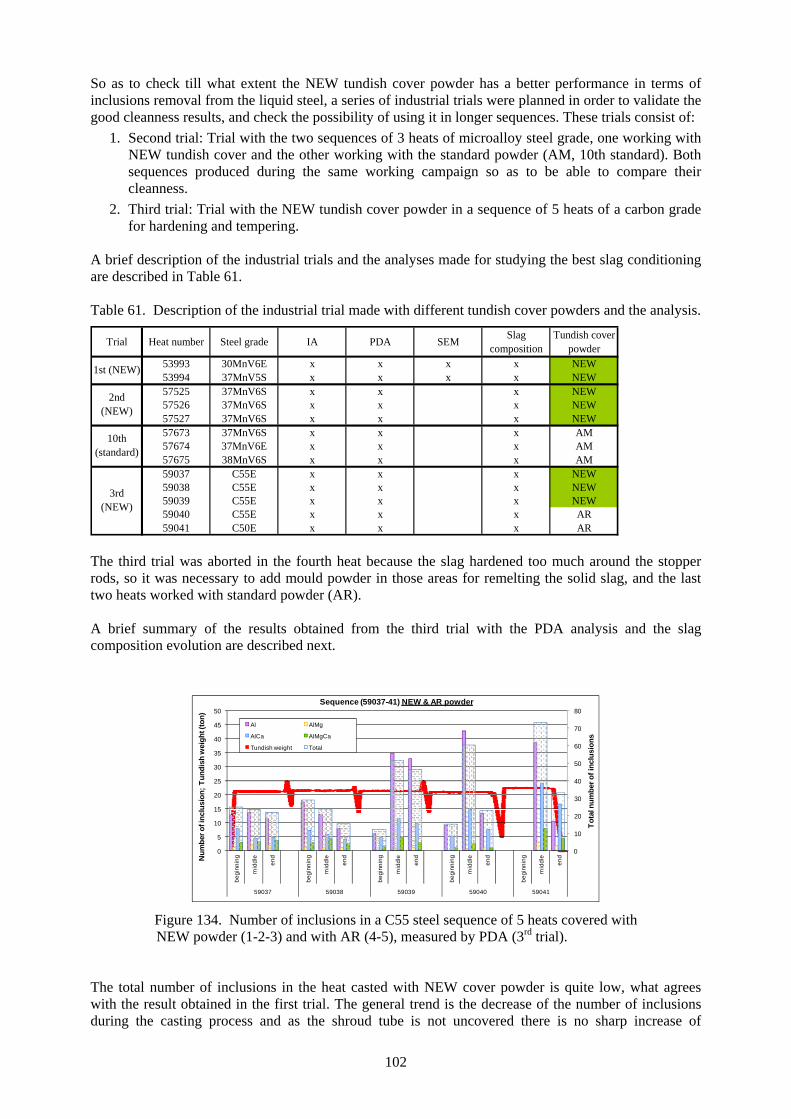
102
So as to check till what extent the NEW tundish cover powder has a better performance in terms of inclusions removal from the liquid steel, a series of industrial trials were planned in order to validate the good cleanness results, and check the possibility of using it in longer sequences. These trials consist of:
1. Second trial: Trial with the two sequences of 3 heats of microalloy steel grade, one working with NEW tundish cover and the other working with the standard powder (AM, 10th standard). Both sequences produced during the same working campaign so as to be able to compare their cleanness.
2. Third trial: Trial with the NEW tundish cover powder in a sequence of 5 heats of a carbon grade for hardening and tempering.
A brief description of the industrial trials and the analyses made for studying the best slag conditioning are described in Table 61. Table 61. Description of the industrial trial made with different tundish cover powders and the analysis.
Trial Heat number Steel grade IA PDA SEM Slag composition
Tundish cover powder
53993 30MnV6E x x x x NEW53994 37MnV5S x x x x NEW57525 37MnV6S x x x NEW57526 37MnV6S x x x NEW57527 37MnV6S x x x NEW57673 37MnV6S x x x AM57674 37MnV6E x x x AM57675 38MnV6S x x x AM59037 C55E x x x NEW59038 C55E x x x NEW59039 C55E x x x NEW59040 C55E x x x AR59041 C50E x x x AR
1st (NEW)
2nd (NEW)
10th (standard)
3rd (NEW)
The third trial was aborted in the fourth heat because the slag hardened too much around the stopper rods, so it was necessary to add mould powder in those areas for remelting the solid slag, and the last two heats worked with standard powder (AR). A brief summary of the results obtained from the third trial with the PDA analysis and the slag composition evolution are described next.
0
10
20
30
40
50
60
70
80
0
5
10
15
20
25
30
35
40
45
50
begi
nnin
g
mid
dle
end
begi
nnin
g
mid
dle
end
begi
nnin
g
mid
dle
end
begi
nnin
g
mid
dle
end
begi
nnin
g
mid
dle
end
59037 59038 59039 59040 59041
Tota
l num
ber o
f inc
lusi
ons
Num
ber o
f inc
lusi
on; T
undi
sh w
eigh
t (to
n)
Sequence (59037-41) NEW & AR powder
Al AlMg
AlCa AlMgCa
Tundish weight Total
Figure 134. Number of inclusions in a C55 steel sequence of 5 heats covered with
NEW powder (1-2-3) and with AR (4-5), measured by PDA (3rd trial). The total number of inclusions in the heat casted with NEW cover powder is quite low, what agrees with the result obtained in the first trial. The general trend is the decrease of the number of inclusions during the casting process and as the shroud tube is not uncovered there is no sharp increase of
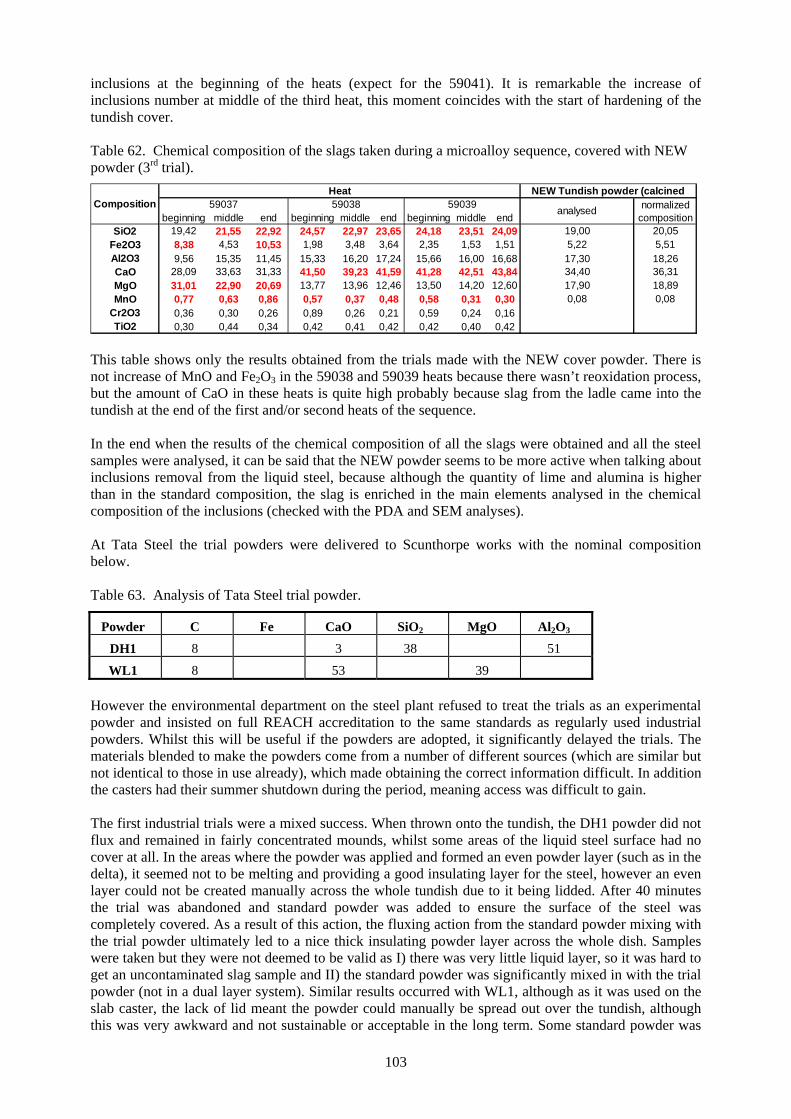
103
inclusions at the beginning of the heats (expect for the 59041). It is remarkable the increase of inclusions number at middle of the third heat, this moment coincides with the start of hardening of the tundish cover. Table 62. Chemical composition of the slags taken during a microalloy sequence, covered with NEW powder (3rd trial).
beginning middle end beginning middle end beginning middle endSiO2 19,42 21,55 22,92 24,57 22,97 23,65 24,18 23,51 24,09 19,00 20,05
Fe2O3 8,38 4,53 10,53 1,98 3,48 3,64 2,35 1,53 1,51 5,22 5,51Al2O3 9,56 15,35 11,45 15,33 16,20 17,24 15,66 16,00 16,68 17,30 18,26CaO 28,09 33,63 31,33 41,50 39,23 41,59 41,28 42,51 43,84 34,40 36,31MgO 31,01 22,90 20,69 13,77 13,96 12,46 13,50 14,20 12,60 17,90 18,89MnO 0,77 0,63 0,86 0,57 0,37 0,48 0,58 0,31 0,30 0,08 0,08
Cr2O3 0,36 0,30 0,26 0,89 0,26 0,21 0,59 0,24 0,16TiO2 0,30 0,44 0,34 0,42 0,41 0,42 0,42 0,40 0,42
CompositionHeat
59037 59038 59039 analysed normalized composition
NEW Tundish powder (calcined
This table shows only the results obtained from the trials made with the NEW cover powder. There is not increase of MnO and Fe2O3 in the 59038 and 59039 heats because there wasn’t reoxidation process, but the amount of CaO in these heats is quite high probably because slag from the ladle came into the tundish at the end of the first and/or second heats of the sequence. In the end when the results of the chemical composition of all the slags were obtained and all the steel samples were analysed, it can be said that the NEW powder seems to be more active when talking about inclusions removal from the liquid steel, because although the quantity of lime and alumina is higher than in the standard composition, the slag is enriched in the main elements analysed in the chemical composition of the inclusions (checked with the PDA and SEM analyses). At Tata Steel the trial powders were delivered to Scunthorpe works with the nominal composition below. Table 63. Analysis of Tata Steel trial powder.
Powder C Fe CaO SiO2 MgO Al2O3
DH1 8 3 38 51
WL1 8 53 39 However the environmental department on the steel plant refused to treat the trials as an experimental powder and insisted on full REACH accreditation to the same standards as regularly used industrial powders. Whilst this will be useful if the powders are adopted, it significantly delayed the trials. The materials blended to make the powders come from a number of different sources (which are similar but not identical to those in use already), which made obtaining the correct information difficult. In addition the casters had their summer shutdown during the period, meaning access was difficult to gain. The first industrial trials were a mixed success. When thrown onto the tundish, the DH1 powder did not flux and remained in fairly concentrated mounds, whilst some areas of the liquid steel surface had no cover at all. In the areas where the powder was applied and formed an even powder layer (such as in the delta), it seemed not to be melting and providing a good insulating layer for the steel, however an even layer could not be created manually across the whole tundish due to it being lidded. After 40 minutes the trial was abandoned and standard powder was added to ensure the surface of the steel was completely covered. As a result of this action, the fluxing action from the standard powder mixing with the trial powder ultimately led to a nice thick insulating powder layer across the whole dish. Samples were taken but they were not deemed to be valid as I) there was very little liquid layer, so it was hard to get an uncontaminated slag sample and II) the standard powder was significantly mixed in with the trial powder (not in a dual layer system). Similar results occurred with WL1, although as it was used on the slab caster, the lack of lid meant the powder could manually be spread out over the tundish, although this was very awkward and not sustainable or acceptable in the long term. Some standard powder was
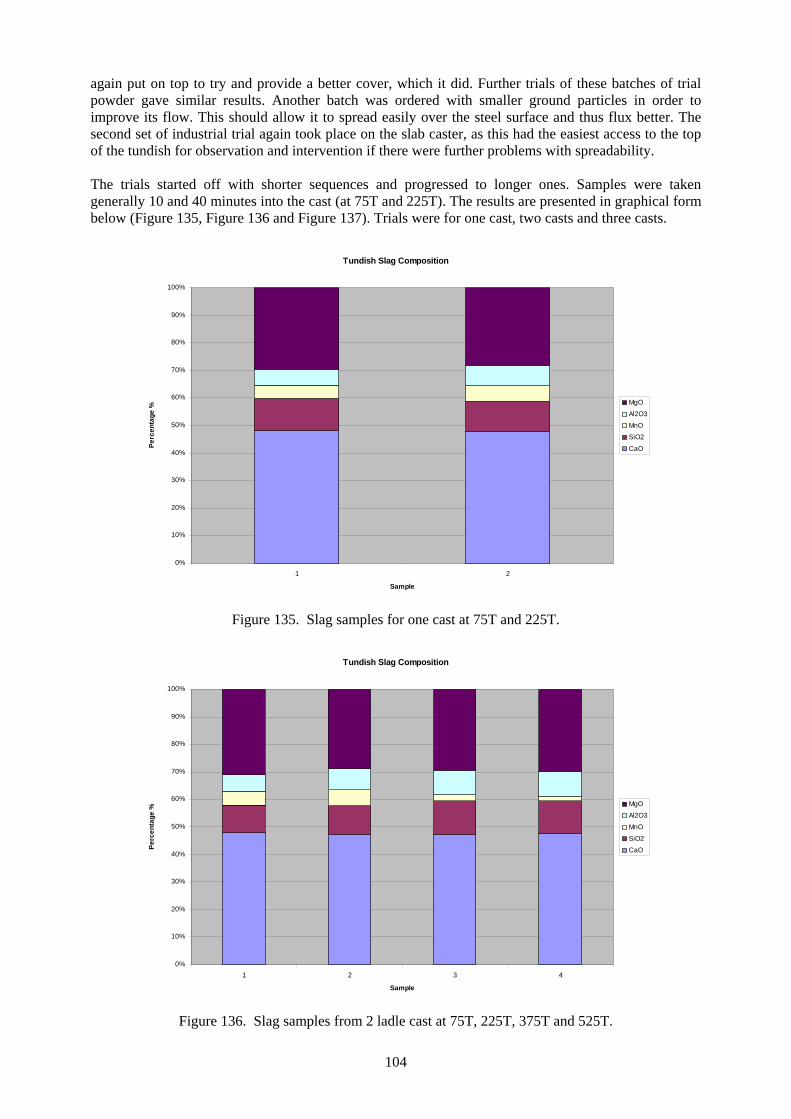
104
again put on top to try and provide a better cover, which it did. Further trials of these batches of trial powder gave similar results. Another batch was ordered with smaller ground particles in order to improve its flow. This should allow it to spread easily over the steel surface and thus flux better. The second set of industrial trial again took place on the slab caster, as this had the easiest access to the top of the tundish for observation and intervention if there were further problems with spreadability. The trials started off with shorter sequences and progressed to longer ones. Samples were taken generally 10 and 40 minutes into the cast (at 75T and 225T). The results are presented in graphical form below (Figure 135, Figure 136 and Figure 137). Trials were for one cast, two casts and three casts.
Tundish Slag Composition
0%
10%
20%
30%
40%
50%
60%
70%
80%
90%
100%
1 2
Sample
Perc
enta
ge %
MgO
Al2O3
MnO
SiO2
CaO
Figure 135. Slag samples for one cast at 75T and 225T.
Tundish Slag Composition
0%
10%
20%
30%
40%
50%
60%
70%
80%
90%
100%
1 2 3 4
Sample
Perc
enta
ge %
MgO
Al2O3
MnO
SiO2
CaO
Figure 136. Slag samples from 2 ladle cast at 75T, 225T, 375T and 525T.
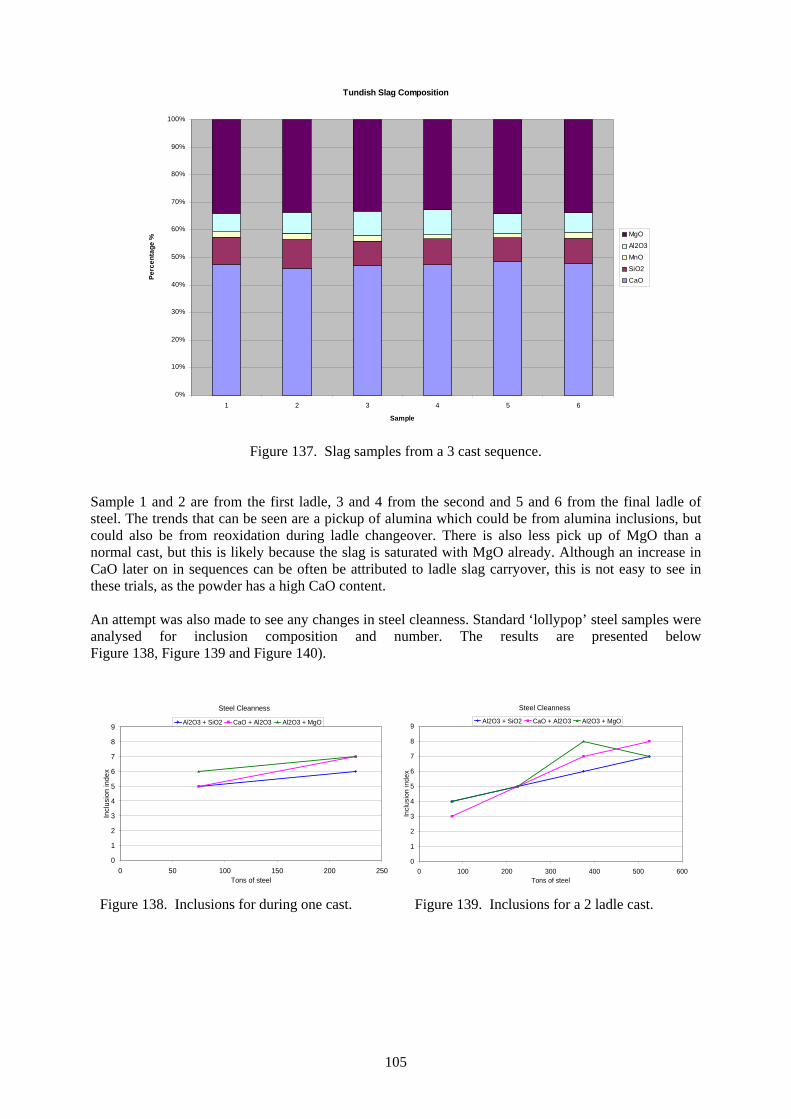
105
Tundish Slag Composition
0%
10%
20%
30%
40%
50%
60%
70%
80%
90%
100%
1 2 3 4 5 6
Sample
Perc
enta
ge %
MgO
Al2O3
MnO
SiO2
CaO
Figure 137. Slag samples from a 3 cast sequence.
Sample 1 and 2 are from the first ladle, 3 and 4 from the second and 5 and 6 from the final ladle of steel. The trends that can be seen are a pickup of alumina which could be from alumina inclusions, but could also be from reoxidation during ladle changeover. There is also less pick up of MgO than a normal cast, but this is likely because the slag is saturated with MgO already. Although an increase in CaO later on in sequences can be often be attributed to ladle slag carryover, this is not easy to see in these trials, as the powder has a high CaO content. An attempt was also made to see any changes in steel cleanness. Standard ‘lollypop’ steel samples were analysed for inclusion composition and number. The results are presented below Figure 138, Figure 139 and Figure 140).
Steel Cleanness
0
1
2
3
4
5
6
7
8
9
0 50 100 150 200 250Tons of steel
Incl
usio
n in
dex
Al2O3 + SiO2 CaO + Al2O3 Al2O3 + MgO
Steel Cleanness
0
1
2
3
4
5
6
7
8
9
0 100 200 300 400 500 600Tons of steel
Incl
usio
n in
dex
Al2O3 + SiO2 CaO + Al2O3 Al2O3 + MgO
Figure 138. Inclusions for during one cast.
Figure 139. Inclusions for a 2 ladle cast.
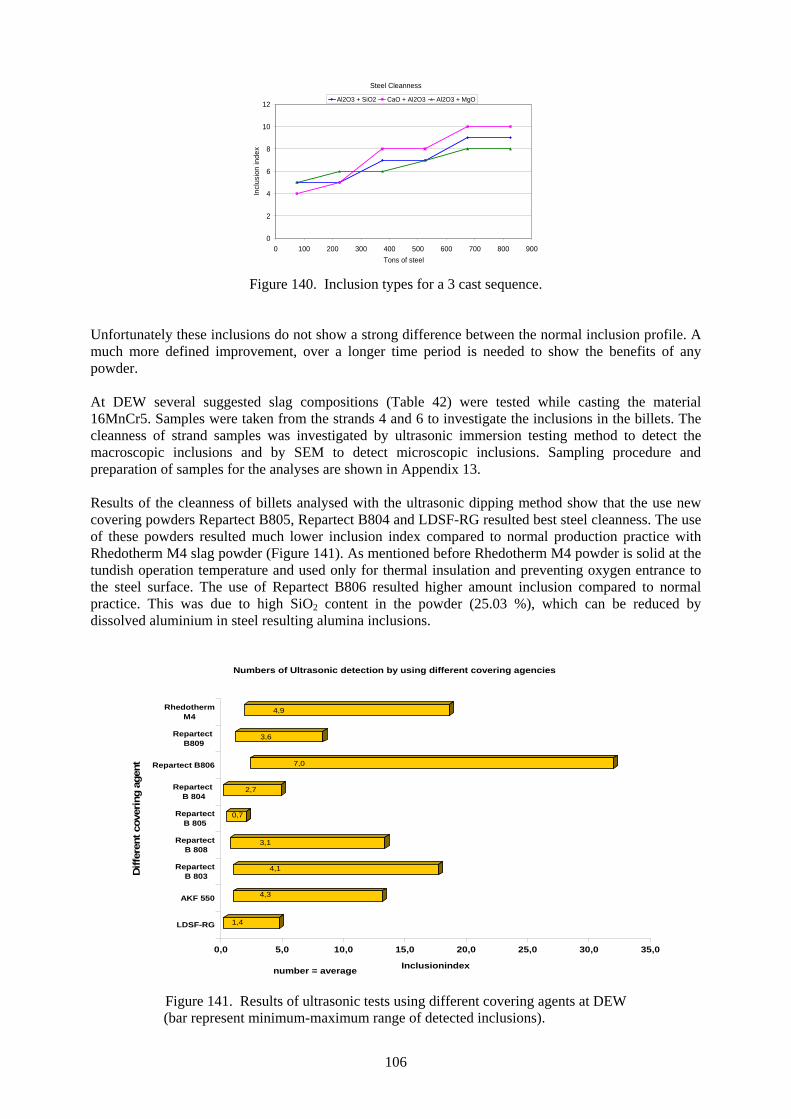
106
Steel Cleanness
0
2
4
6
8
10
12
0 100 200 300 400 500 600 700 800 900Tons of steel
Incl
usio
n in
dex
Al2O3 + SiO2 CaO + Al2O3 Al2O3 + MgO
Figure 140. Inclusion types for a 3 cast sequence.
Unfortunately these inclusions do not show a strong difference between the normal inclusion profile. A much more defined improvement, over a longer time period is needed to show the benefits of any powder. At DEW several suggested slag compositions (Table 42) were tested while casting the material 16MnCr5. Samples were taken from the strands 4 and 6 to investigate the inclusions in the billets. The cleanness of strand samples was investigated by ultrasonic immersion testing method to detect the macroscopic inclusions and by SEM to detect microscopic inclusions. Sampling procedure and preparation of samples for the analyses are shown in Appendix 13. Results of the cleanness of billets analysed with the ultrasonic dipping method show that the use new covering powders Repartect B805, Repartect B804 and LDSF-RG resulted best steel cleanness. The use of these powders resulted much lower inclusion index compared to normal production practice with Rhedotherm M4 slag powder (Figure 141). As mentioned before Rhedotherm M4 powder is solid at the tundish operation temperature and used only for thermal insulation and preventing oxygen entrance to the steel surface. The use of Repartect B806 resulted higher amount inclusion compared to normal practice. This was due to high SiO2 content in the powder (25.03 %), which can be reduced by dissolved aluminium in steel resulting alumina inclusions.
0,0 5,0 10,0 15,0 20,0 25,0 30,0 35,0
Inclusionindex
LDSF-RG
AKF 550
Repartect B 803
Repartect B 808
RepartectB 805
Repartect B 804
Repartect B806
Repartect B809
RhedothermM4
Diff
eren
t cov
erin
g ag
ent
Numbers of Ultrasonic detection by using different covering agencies
number = average
1,4
4,3
4,1
3,1
0,7
2,7
7,0
3,6
4,9
Figure 141. Results of ultrasonic tests using different covering agents at DEW
(bar represent minimum-maximum range of detected inclusions).
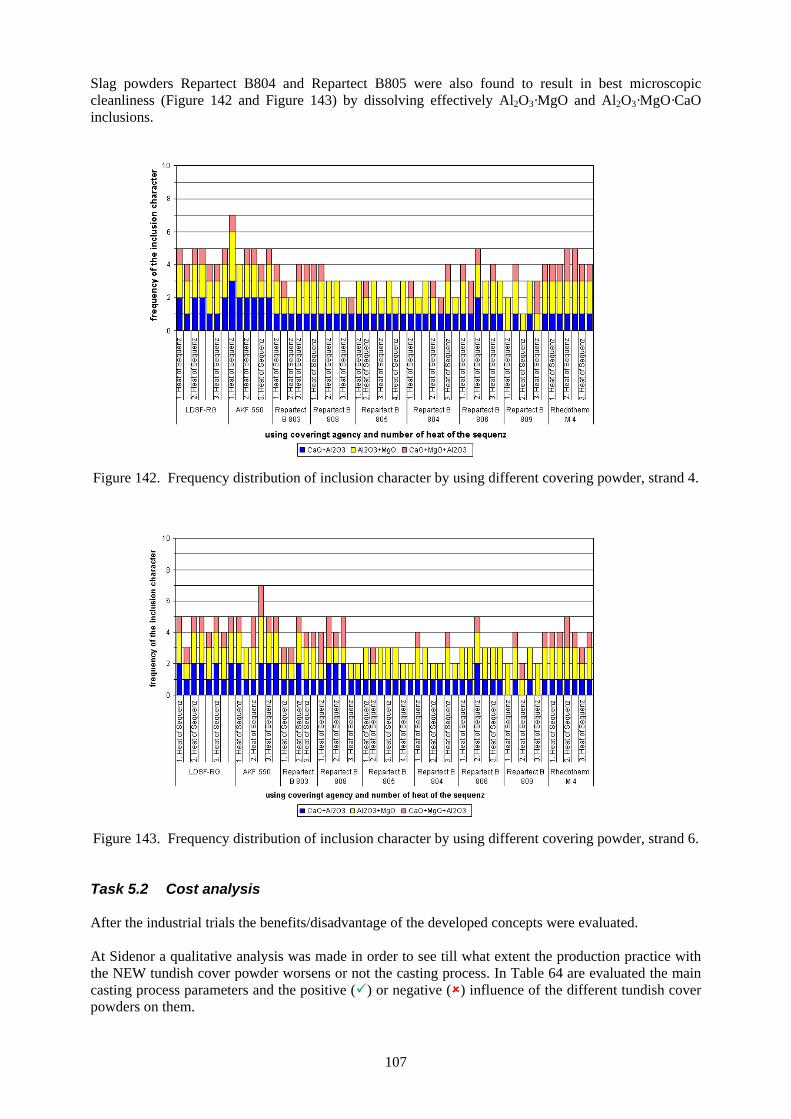
107
Slag powders Repartect B804 and Repartect B805 were also found to result in best microscopic cleanliness (Figure 142 and Figure 143) by dissolving effectively Al2O3·MgO and Al2O3·MgO·CaO inclusions.
Figure 142. Frequency distribution of inclusion character by using different covering powder, strand 4.
Figure 143. Frequency distribution of inclusion character by using different covering powder, strand 6. Task 5.2 Cost analysis After the industrial trials the benefits/disadvantage of the developed concepts were evaluated. At Sidenor a qualitative analysis was made in order to see till what extent the production practice with the NEW tundish cover powder worsens or not the casting process. In Table 64 are evaluated the main casting process parameters and the positive ( ) or negative ( ) influence of the different tundish cover powders on them.
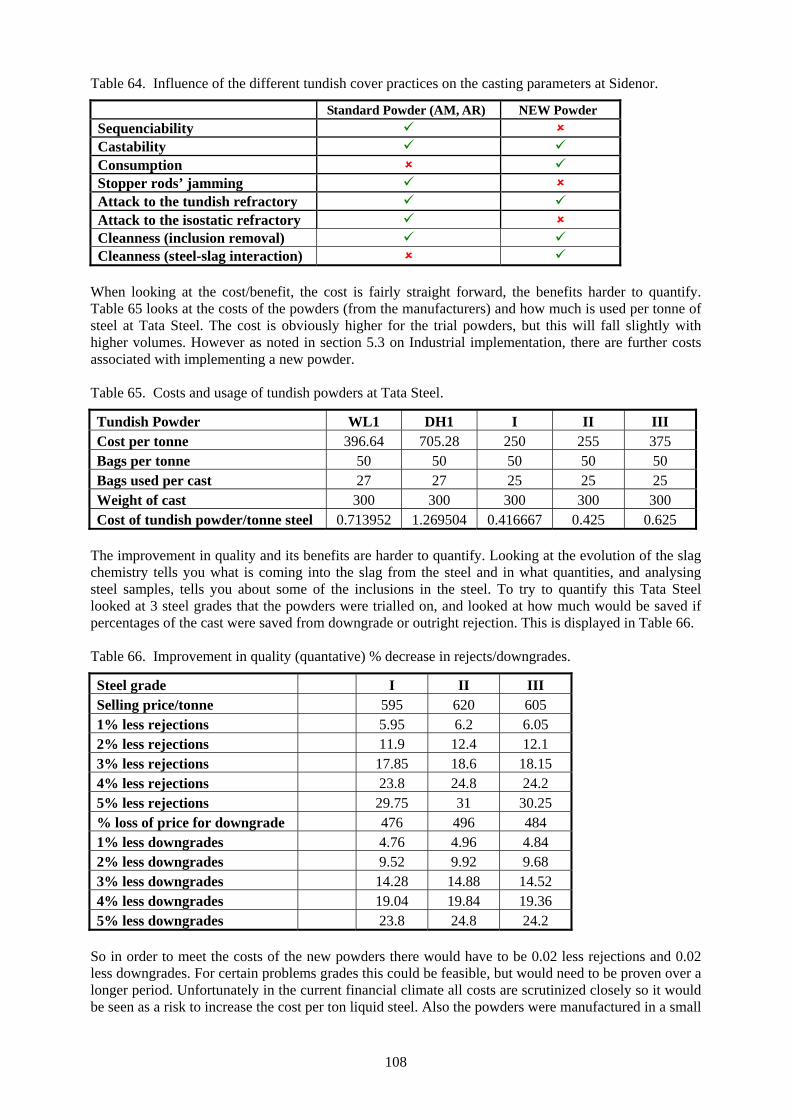
108
Table 64. Influence of the different tundish cover practices on the casting parameters at Sidenor.
Standard Powder (AM, AR) NEW Powder Sequenciability Castability Consumption Stopper rods’ jamming Attack to the tundish refractory Attack to the isostatic refractory Cleanness (inclusion removal) Cleanness (steel-slag interaction)
When looking at the cost/benefit, the cost is fairly straight forward, the benefits harder to quantify. Table 65 looks at the costs of the powders (from the manufacturers) and how much is used per tonne of steel at Tata Steel. The cost is obviously higher for the trial powders, but this will fall slightly with higher volumes. However as noted in section 5.3 on Industrial implementation, there are further costs associated with implementing a new powder. Table 65. Costs and usage of tundish powders at Tata Steel.
Tundish Powder WL1 DH1 I II III Cost per tonne 396.64 705.28 250 255 375 Bags per tonne 50 50 50 50 50 Bags used per cast 27 27 25 25 25 Weight of cast 300 300 300 300 300 Cost of tundish powder/tonne steel 0.713952 1.269504 0.416667 0.425 0.625
The improvement in quality and its benefits are harder to quantify. Looking at the evolution of the slag chemistry tells you what is coming into the slag from the steel and in what quantities, and analysing steel samples, tells you about some of the inclusions in the steel. To try to quantify this Tata Steel looked at 3 steel grades that the powders were trialled on, and looked at how much would be saved if percentages of the cast were saved from downgrade or outright rejection. This is displayed in Table 66. Table 66. Improvement in quality (quantative) % decrease in rejects/downgrades.
Steel grade I II III Selling price/tonne 595 620 605 1% less rejections 5.95 6.2 6.05 2% less rejections 11.9 12.4 12.1 3% less rejections 17.85 18.6 18.15 4% less rejections 23.8 24.8 24.2 5% less rejections 29.75 31 30.25 % loss of price for downgrade 476 496 484 1% less downgrades 4.76 4.96 4.84 2% less downgrades 9.52 9.92 9.68 3% less downgrades 14.28 14.88 14.52 4% less downgrades 19.04 19.84 19.36 5% less downgrades 23.8 24.8 24.2
So in order to meet the costs of the new powders there would have to be 0.02 less rejections and 0.02 less downgrades. For certain problems grades this could be feasible, but would need to be proven over a longer period. Unfortunately in the current financial climate all costs are scrutinized closely so it would be seen as a risk to increase the cost per ton liquid steel. Also the powders were manufactured in a small
109
scale blending plant, and if larger volumes were required it is questionable whether they would be able to supply them. Task 5.3 Concepts for industrial implementation The objective of this was to evaluate the developed concepts for industrial implementation. At Sidenor the steel samples collected from the heats that worked with the NEW tundish cover powder was cleaner than the ones from the standard process, but the size of these inclusions were bigger, so it could be concluded that the NEW and standard tundish covers have similar capacity of removing inclusions. But on the other hand the chemical composition of the inclusions from the NEW working practice has no K nor Na in their composition as it could be observed in the inclusions of the samples colleceted with the standard powders, so the slag does not contaminate the steel. Taking into account the result the NEW tundish cover is now used for heats with special cleanness requirements, but the sequence length would be limited to 3 heats due to the operational problems already mentioned (excessive isostatic erosion and excessive tundish cover hardening). The tundish configuration developed by Tecnalia (Figure 110b) did not give better results of cleanness than the standard turbostop. At Ovako the inclusion cleanliness of the heats was assessed based on micro- and macro-inclusion measurements which are graphed to Appendices 14-17.The trial sequence for 100Cr6 with trial tundish powder and argon feeding to tundish is the sequence P1-P4 and for SAE1050 O1-O3. (Table 54 and Table 55). Following observations was made on the average oxide inclusion composition and size:
- Magnesium content increases towards end of the heat while aluminium content decreases - Number of micro-inclusions tends to decrease towards the end of the heat. - For SAE1050 sequence E1-E2 the Ca -content is higher because Ca-treatment - For SAE1050 sequence D1-D2 the inclusions down to 5 µm were analysed: Magnesium content
appears to be lower in the smaller inclusions - For 100Cr6 trial sequence P1-P4 the number of micro-inclusions is roughly half of that with the
standard practice - For SAE1050 trial sequence O1-O3 the number of micro-inclusions is on the same level with the
standard practice From the immersion ultrasound testing result similar information was observed for the trial heats:
- For 100Cr6 trial sequence P1-P4 the IUS-index is below 10 on average, while on the standard practice it varies between 60 and 360.
- For SAE1050 trial sequence O1-O3 the IUS-index is on the same level as with the standard practice.
The observation that on 100Cr6 there is an improvement both in micro- and macro-inclusion level on trial heats while SAE1050 shows no improvement was suspected to be due to modifications of auxiliary equipment on the caster. These modifications were done on summer 2011, and SAE1050 trial heat was cast prior to the improvement and 100Cr6 after. Modifications included, e.g., ladle slag detector and ladle shroud manipulator, which may contribute to the steel cleanliness by decreasing the amount of exogenous inclusions. Video observations of the cast heats also suggest that a failure to protect the ladle steel stream results in increase of non-metallic inclusion number. For sequence K1-K4 videos show heavy bubbling in tundish, and the IUS indices for these heats are abnormally high. Bubbling in tundish surface indicates that the sealing between ladle shroud and ladle is not tight. Observation of the trial heats by video was not possible because of the closed tundish lid, and due to this it cannot be confirmed whether the effect seen in IUS-indices is truly due to ladle shroud sealing or due to trial tundish powder. In tundish top slag analysis a clear trend can be observed with standard practice: In the beginning of a sequence slag composition is closer to the start powder and the composition changes during casting due

110
to cover powder additions. With trial powder the top slag composition stays constant over the whole sequence (Appendices 18 and 19). Manganese is a component which is not present in any powder which is added into tundish, but in standard practice tundish slag contains 1 to 3 percent of manganese. With trial powder the manganese content of tundish slag was below 1 percent present with both 100Cr6 and SAE1050. The standard tundish practice at Ovako with start powder and cover powder was abandoned after good results with the usability of the trial powder. Now the tundish powder practice is to add a set amount of tundish powder in the beginning of sequence and add a small amount of powder with each ladle change. Even though the improvement in steel cleanliness due to tundish slag was not able to verified in Ovako Imatra’s trials, dissolution investigations of TUBAF and thermodynamic calculations of Aalto have shown that a basic, calcium-aluminate based tundish slag is better at inclusion removal that the standard powder. Since the trial powder functioned also in production, it was decided that the practice will be modified. Industrial implementation is about much more than whether the steel quality improves with the active tundish powder, or if the improvement is worth the extra cost. The powder was manufactured at a small blending plant, with the materials bought in small batches. With larger orders, the unit cost will come down. But the active tundish powder was always intended to be a niche product for specific grades where quality issues made the costs worthwhile, so will be used in much smaller quantities than other powders. At Tata Steel there are 3 standard powders used on the casters currently and adding a new, specialist one would create some problems. Storage, internal plant logistics and codes of practice would all need to be modified. Clear guidance will be needed, as often during unsupervised trials, the wrong materials are added. Caster operators would need to be briefed and trained about the changes, particularly if there are specific changes from the standard practice needed to make the powder practical (dual layers, spreading of powders etc.). Other concepts looked at for industrial implementation include dual layer powders (with wollastonite as the top powder), which is being trialled at another Tata Steel plant, and using silica ‘bombs’ to allow sampling through hardened slags. At DEW industrial trials by using the new suggested cover powders Repartect B804, Repartect B805, and LDSF-RG showed improvement in steel cleanness. Their functionality will be verified next in a large scale production trail of about 75 castings of hardening or special engineering steels. Based on these results their implementation to standard tundish practice will be evaluated.
111
2.4 CONCLUSIONS The overall objective of this project was to develop active tundish process by applying tailored tundish slag with high capacity to efficiently absorb macro- and micro-inclusions from different steels. The project started by evaluating the state-of-the-art of current “functionality” of tundish practice in the participating steel plants. Potentials for improved tundish slag design were evaluated by thermodynamic calculations using collected data from steel plants. Calculations showed that industrial partners slags used in their standard practice were either solid or have only limited capability to dissolve inclusions from steel at tundich temperatures. Thorough fundamental studies on factors influencing inclusion removal and inclusion cleanliness in tundish was performed in participating universities and research institutes. These included investigation of dissolution and interfacial phenomena, slag viscosity measurements as well as search of optimal flow pattern for inclusion removal by water model experiments and CFD modelling. Fundamental studies as well as thermodynamic calculations showed that more basic slag would lead to a more effective tundish slag having higher capacity to absorb inclusions compared to standard practice. Based on these results better slags and practices were proposed for industrial trials. Experimental tests at steel plants with the new proposed tundish powders showed improvement in steel cleanness compared to standard practice. The new tundish practices developed in this project have been successfully implemented at Sidenor and Ovako steel works. At Sidenor the new tundish cover is now used for heats with special cleanness requirements, but the sequence length would be limited to 3 heats due to the excessive erosion of isostatic refractory pieces and slag cover hardening. In Ovako Imatra the tundish practices were altered due to the results obtained in this project. The old tundish powder practice with two tundish powders was abandoned, and a new, single layer, basic powder was adopted into regular use. At DEW industrial trials by using the new suggested cover powders showed improvement in steel cleanness. Their functionality will be still verified in a large scale production trail. Based on these results their implementation to standard tundish practice will be evaluated. At Tata Steel two new powders have been tested with good results, but no long term proof of cleanness improvements has been found and hence economic benefits cannot be proven.

113
2.5 EXPLOITATION AND IMPACT OF THE RESEARCH RESULTS Actual applications
The new tundish practices developed in this project have been successfully implemented at Sidenor and Ovako steel works. At Sidenor the new tundish cover is now used for heats with special cleanness requirements, but the sequence length would be limited to 3 heats due to the excessive erosion of isostatic refractory pieces and slag cover hardening. In Ovako Imatra the tundish practices were altered due to the results obtained in this project. The old tundish powder practice with two tundish powders was abandoned, and a new, single layer, basic powder was adopted into regular use. At DEW industrial trials by using the new suggested cover powders showed improvement in steel cleanness. Their functionality will be verified still in a large scale production trail. Based on these results their implementation to standard tundish practice will be evaluated. At Tata Steel two new powders have been tested with good results, but no long term proof of cleanness improvements has been found and hence economic benefits cannot be proven. Economic potential
Potential benefits can be anticipated in: 1) Better inclusion removal → better steel quality/cleanness → less scrapping → higher steel yield; 2) Production of increasingly demanding steel grades with improved properties; 3) Possible increase in productivity – increase in sequence length if nozzle clogging or stopper
accretions are reduced. Other aspects
Traditionally in the tundish powder industry, the majority of the knowledge, innovation and research are done by the suppliers. The Actum project has increased knowledge both within the steel plants and R & D, giving more power and leverage over suppliers. Publications
R. Hagemann, L. Petzold and P. R. Scheller: Dissolution behaviour of oxides in synthetic and industrial slags. Challanges and Solutions in Mineral Industry. Beiträge zum 4. Freiberger - St. Petersburger Kolloquium junger Wissenschaftler (60.BHT), 2009, pp.251-257. Conference presentations
R. Hagemann, L. Petzold and P. R. Scheller: Dissolution behaviour of oxides in synthetic and industrial slags. Challanges and Solutions in Mineral Industry. Beiträge zum 4. Freiberger - St. Petersburger Kolloquium junger Wissenschaftler (60.BHT), Freiberg, 17.-19.06. 2009. L. Holappa, M. Kekkonen, S. Louhenkilpi, P. Scheller, R. Hagemann and C. Schröder: Active Tundish Slag. Keynote-presentation at the MOLTEN12, Ninth International Conference on Molten Slags, Fluxes and Salts. Beijing, China May 27-30, 2012. M. Kekkonen, D. Leuverink and L. Holappa: Active tundish metallurgy. SCANMET IV, 4th International Conference on Process Development in Iron and Steelmaking, June 10-13, 2012, Luleå, Sweden. Vol. 1, pp. 407-416.

115
LIST OF FIGURES Figure 1. Bloom caster of Imatra. Figure 2. From left: Ladle, tundish and mould sampler for liquid steel. Figure 3. A special slag sampler type, dia 25mm and 100mm were tested. Figure 4. From left: A spoon sampler for ladle and tundish slag and an oxygen sampler for ladle. Figure 5. Samples tested for SEM analysis. A lollipop sample from the ladle (left), a lollipop
tundish sample (middle) and a vacuum pin mould sample (right). Figure 6. Scanning electron microscope of Imatra: Jeol JSM 6490 with EDA and Inca Feature
software. Figure 7. Ternary diagrams of Ca/Al/Mg inclusions, immersion sampler (left) and lollipop (right). Figure 8. Submerged sample (left) and lollipop sample (right) prepared for SEM. Figure 9. Pure alumina artefact on the steel sample. Probable source is the sample preparation. Figure 10. Schematic arrangement of six strand tundish at Tata Steel. Figure 11. Number of inclusions in a spring steel sequence of 4 heats covered with AM powder,
measured by PDA. Figure 12. Number of inclusions in a spring steel sequence of 4 heats covered with AR powder,
measured by PDA. Figure 13. Distribution of inclusions in a spring steel heat cooled with thermal blanket (tundish
cover powder AM). Figure 14. Distribution of inclusions in a spring steel heat cooled with thermal blanket (tundish
cover powder AR). Figure 15. Tundish used for pilot plant trials at Tata Steel. Figure 16. Variation of tundish slag chemistry with time. Figure 17. Variation of tundish slag chemistry with time. Figure 18. Variation of tundish slag chemistry with time. Figure 19. Variation of tundish slag chemistry with time. Figure 20. Makeup of slag. Figure 21. CaO content against number in sequence. Figure 22. FactSage calculations for Sidenor process data at the beginning of the casting. Slag/steel
equilibration ratio = 0.01/100. Main slag components as a function of temperature. Figure 23. FactSage calculations for Sidenor process data at the beginning of the casting. Slag/steel
equilibration ratio = 0.01/100. T = 1530°C. Influence of added aluminium (hypothetical) on main slag components.
Figure 24. FactSage calculations with Ovako process data 20 ton from the beginning of the casting. Steel grade SAE 1050. Slag/steel equilibration ratio = 0.01/100. Main slag components and solid phases as a function of temperature.
Figure 25. FactSage calculations for Ovako process data 40 ton from the beginning of the casting. Steel grade SAE 1050. Slag/steel equilibration ratio = 0.01/100. Main slag components and solid phases as a function of temperature.
Figure 26. FactSage calculations for Ovako process data 40 ton from the beginning of the casting. Steel grade SAE1050. Slag/steel equilibration ratio = 0.01/100. T = 1530°C. Main slag components as well as solid phases as a function of Aluminium added.
Figure 27. FactSage calculations for Ovako process data 20 ton from the beginning of the casting. Steel grade 100Cr6. Slag/steel equilibration ratio = 0.01/100. Main slag components as well as solid spinels as a function of temperature.
Figure 28. FactSage calculations for Ovako process data 20 ton from the beginning of the casting. Steel grade 100Cr6. Slag/steel equilibration ratio = 0.01/100. T = 1530°C. Main slag components as well as solid compounds as a function of Aluminium added.
Figure 29. FactSage calculations for Tata Steel process data. C/Mn steel; Mg 1ppm, Ca 1ppm. Slag/steel equilibration ratio = 0.01/100. No liquid slag. Solid components as a function of temperature. Tundish slag 1.
Figure 30. FactSage calculations for Tata Steel process data. C/Mn steel; Mg 1ppm, Ca 20ppm. Slag/steel equilibration ratio = 0.01/100. Liquid slag and solid components as a function of temperature. Tundish slag 1.
116
Figure 31. FactSage calculations for Tata Steel process data. C/Mn steel; Mg 1ppm, Ca 1ppm. Slag/steel equilibration ratio = 0.01/100. No liquid slag. Solid components as a function of temperature. Tundish slag 2.
Figure 32. FactSage calculations for Tata Steel process data. C/Mn steel; Mg 1ppm, Ca 10ppm. Slag/steel equilibration ratio = 0.01/100. Liquid slag and solid components as a function of temperature. Tundish slag 2.
Figure 33. FactSage calculations for Tata Steel process data. C/Mn steel; Mg 1ppm. Slag/steel equilibration ratio = 0.01/100. Liquid slag and solid components as a function of Ca content. Temperature 1550ºC. Tundish slag 2.
Figure 34. Deoxidation equilibrium in 100Cr6 steel with 0.04% Al and 10ppm O. Figure 35. 100Cr6 steel equilibrated with DEW slag 1, slag : steel ratio 0.002 :100. Figure 36. 100Cr6 steel equilibrated with DEW slag 1, slag : steel ratio 0.005 :100. Figure 37. 100Cr6 steel equilibrated with DEW slag 2, slag : steel ratio 0.0005 :100. Figure 38. 100Cr6 steel equilibrated with DEW slag 2, slag : steel ratio 0.002 :100. Figure 39. 100Cr6 steel equilibrated with DEW slag 2, slag : steel ratio 0.005 :100. Figure 40. 100Cr6 steel equilibrated with DEW slag 2, slag : steel ratio 0.01 :100. Figure 41. 16MnCrS5 steel equilibrated with DEW slag 1, slag : steel ratio 0.01 :100. Figure 42. 16MnCrS5 steel equilibrated with DEW slag 2, slag : steel ratio 0.01 :100. Figure 43. Development of slag composition at Sidenor and Ovako steel works. Figure 44. Slag composition at DEW steel work. Figure 45. Dissolution times for different slag/particle systems investigated using CLSM. Figure 46. Liquid surface diagram in the system CaO-MgO-SiO2 with 20% Al2O3 [1] Figure 47. Binary system Al2O3-CaO [1] Figure 48. Ternary system Al2O3-CaO-MgO [1] Figure 49. Ternary system Al2O3-CaO-SiO2 [1] Figure 50. Image sequence of dissolution process using DHTT device (example for Al2O3 particle
and slag S12-start(s) cp). Figure 51. Light microscopic photographs of a prepared DHTT sample (slag: O3-start(i); particle:
Al2O3; investigation temperature: 1490°C). Figure 52. Al2O3-particle in O1-mid(s) c.p. slag. Figure 53. Line scan with Mg-enrichments at the interface particle / slag. Figure 54. Spinel particle in O1-mid(s) c.p. slag. Figure 55. Line scan: The interface is very acute. No reaction products were detected. Figure 56. Spinel particle in O1-mid(s) c.p. slag with building of a solid phase during the CLSM-
investigation. Figure 57. SEM-investigation of the slag O12-start(s) a) Mg-Oxide-precipitations b) EDX analysis Figure 58 a) EDX-line scan through a spinel particle (dark) in the slag O12-start(s) (brighter) b)
false colour picture: red-Ca; green-Al; blue-Mg Figure 59. Slag S12-start(s) with MgO* Al2O3-particle a) clear boundary b) EDX-line scan Figure 60. Slag S12-start(s) with Al2O3-particle a) enriched Mg at the interface b) EDX-line scan Figure 61. Slag S2-end(s) with a) MgO·Al2O3-particle b) Al2O3-particle Figure 62. Dissolution investigation of spinel particle into D3-start(i). a) Slag SEM/EDX, b)
Crystallization of Al-Ca-Oxide into the slag SEM/EDX, c) Calculated phase fraction diagram of alumina into D3-start(i), d) Calculated phase fraction diagram of spinel into D3-start(i).
Figure 63. Dissolution investigation of Al2O3 particle into D8-start(i).a) Mg-rich precipitation around alumina particle, b-d) with increasing amount of Al2O3 a lot of different solid phases are built.
Figure 64. Calculation of phase fraction depended on fraction of alumina in slag D8-start(i). Figure 65. Temperature-viscosity curves for slags according to Sidenor tundish process. Figure 66. Viscosity temperature diagram for slags according to Ovako tundish process. Figure 67. Temperature-viscosity-diagram of slags used by DEW. Figure 68. Interfacial tension for slags related to casting process of 100Cr6 at Ovako. Figure 69. Interfacial tension values between steel SEA 1050 and tundish slags (Ovako). Figure 70. Interfacial tension values between steel 57Cr3F and tundish slags (Sidenor).
117
Figure 71. FactSage calculations for Tata Steel process data. C/Mn steel; Mg 1, Ca 1ppm. Slag/ steel equilibration ratio = 0.01/100. Liquid slag and solid components as a function of temperature. Tundish slag 3.
Figure 72. FactSage calculations for Tata Steel process data. C/Mn steel; Mg 1, Ca 10ppm. Slag/steel equilibration ratio = 0.01/100. Liquid slag and solid components as a function of temperature. Tundish slag 3.
Figure 73. FactSage calculations for Tata Steel process data. C/Mn steel; Mg 1, Ca 1ppm. Slag/steel equilibration ratio = 0.01/100. Liquid slag and solid components as a function of temperature. Tundish slag 4.
Figure 74. FactSage calculations for Tata Steel process data. C/Mn steel; Mg 1, Ca 10ppm. Slag/steel equilibration ratio = 0.01/100. Liquid slag and solid components as a function of temperature. Tundish slag 4.
Figure 75. FactSage calculations for Tata Steel process data. C/Mn steel; Mg 1, Ca 10ppm. Slag/ steel equilibration ratio = 0.01/100. Oxygen, Mg and Ca contents in steel as a function of temperature. Tundish slag 4.
Figure 76. FactSage calculations for Tata Steel process data. C/Mn steel; Mg 1. Slag/steel equilibration ratio = 0.01/100. Liquid slag and solid components as a function of Ca content. Temperature 1550ºC. Tundish slag 4.
Figure 77. FactSage calculations with Ovako SAE 1050 steel and slag A. Slag/steel equilibration ratio = 0.01/100. Total amount of slag, main slag components and solid phases as a function of temperature.
Figure 78. FactSage calculations with Ovako SAE 1050 steel and slag B. Slag/steel equilibration ratio = 0.01/100. Total amount of slag, main slag components and solid phases as a function of temperature.
Figure 79. FactSage calculations with Ovako SAE 1050 steel and slag C. Slag/steel equilibration ratio = 0.01/100. Total amount of slag, main slag components and solid phases as a function of temperature.
Figure 80. FactSage calculations with Ovako SAE 1050 steel and slag D. Slag/steel equilibration ratio = 0.01/100. Total amount of slag, main slag components and solid phases as a function of temperature.
Figure 81. FactSage calculations with Ovako SAE 1050 steel and slag A. Slag/steel equilibration ratio = 0.01/100. Oxygen, Mg and Ca contents in steel as a function of temperature.
Figure 82. FactSage calculations with Ovako SAE 1050 steel and slag B. Slag/steel equilibration ratio = 0.01/100. Oxygen, Mg and Ca contents in steel as a function of temperature.
Figure 83. FactSage calculations with Ovako SAE 1050 steel and slag C. Slag/steel equilibration ratio = 0.01/100. Oxygen, Mg and Ca contents in steel as a function of temperature.
Figure 84. FactSage calculations with Ovako SAE 1050 steel and slag D. Slag/steel equilibration ratio = 0.01/100. Oxygen, Mg and Ca contents in steel as a function of temperature.
Figure 85. FactSage calculations with Ovako SAE 1050 steel and slag A. Slag/steel equilibration ratio = 0.01/100. Total amount of slag, main slag components and solid phases as a function of temperature. Oxygen content 5 ppm.
Figure 86. FactSage calculations with Ovako SAE 1050 steel and slag A. Slag/steel equilibration ratio = 0.01/100. Oxygen, Mg and Ca contents in steel as a function of temperature. Oxygen content 5 ppm (initial).
Figure 87. FactSage calculations with Ovako SAE 1050 steel and slag A. Slag/steel equilibration ratio = 0.01/100. Total amount of slag, main slag components and solid phases as a function of temperature. Sulphur content 0.0035%.
Figure 88. CaO-MgO- Al2O3 phase diagram. Figure 89. Deoxidation equilibrium in 16MnCrS 5 steel with 0.03% Al, 20ppm O, 50ppm S, Ca =
0. Figure 90. Deoxidation equilibrium in 16MnCrS 5 steel with 0.03% Al, 20ppm O, 50ppm S and
5ppm Ca. Figure 91. Deoxidation equilibrium in 16MnCrS 5 steel with 0.03% Al, 20ppm O, 50ppm S, 10ppm
Ca. Figure 92. Deoxidation equilibrium in 16MnCrS 5 steel with 0.03% Al, 20ppm O, 200ppm S,
10ppm Ca.
118
Figure 93. 16MnCrS 5 steel (5ppm Ca, 50ppm S) equilibrated with DEW slag 3, slag/steel ratio = 0.01:100.
Figure 94. 16MnCrS 5 steel (5ppm Ca, 200ppm S) equilibrated with DEW slag 3, slag/steel ratio = 0.01:100.
Figure 95. 16MnCrS 5 steel (5ppm Ca, 50ppm S) equilibrated with DEW slag 4, slag/steel ratio = 0.01:100.
Figure 96. Induction Furnace during laboratory heats (left) and alumina crucible after solidification of steel without tundish cover powders (right).
Figure 97. A slag sample taken by a trial sampler for tundish slag, dia 25mm. Figure 98. A slag sample taken by a trial sampler for tundish slag, dia 100mm. Figure 99. Slag samples taken by spoon during a sequence of 2 heats. Note the increasing amount
of slag in different sampling places. Figure 100. Tundish of Imatra and location of slag sampling. Figure 101. MiniPal 4 XRF-device. Figure 102. Calculated contents in tundish slag during a sequence of 6 heats. Figure 103. XRF analyses of the tundish top slag. Sample A is taken after 15 minutes of casting, B
after 30 minutes and C after 45 minutes. Chemical composition of the samples taken from “end” –position and “mid” – position is different.
Figure 104. Typical ternary CaO-Al2O3-MgO ternary diagram obtained from tundish sample. Figure 105. Position of IUS sample in square and round bar. Length of the sample is typically 210
mm. Figure 106. Ovako Imatra’s ultrasonic immersion testing facility. Figure 107. Experimental set up for fluxing experiments. Figure 108. Normal (a) and new (b) tundish practice at DEW. Figure 109. Tundish used for pilot scale fluxing trials. Figure 110. Tundish with standard turbostop (a) and impact zone developed by Tecnalia (b). Figure 111. Tundish working with standard turbostop (a) and impact zone developed by Tecnalia (b). Figure 112. Number of inclusions in a microalloy steel heat covered with AM powder, measured by
PDA. Figure 113. Six strand bloom production tundish. (View towards tundish centre with ladle shroud). Figure 114. Six strand bloom production tundish. (View towards tundish end). Figure 115. Initial melting tests of powder WL1 – a) 10 minutes and b) 20 minutes Figure 116. Melting tests with added silica a) 10 minutes and b) 20 minutes Figure 117. Wear suffered by the stopper rod due to the slag attack (NEW powder) at Sidenor. Figure 118. (Left) Stopper refractory showing heavy erosion after 12 heats. (Right) Tundish wear
lining after 12 heats showing very little erosion on the slag line. Figure 119. Screen captures of the videos taken from tundish. A: surface bubbling (rating 1), B: ladle
shroud (rating 1), C: OK (rating 0). Figure 120. Damaged refractory wall by using the slag powder Repartect B809 at DEW industiral
trial. Figure 121. Drawing of the six strand tundish of Sidenor and photograph of the water model at ½
scale built at Tecnalia's facilities. Figure 122. Locations of conductivity measurement points. Figure 123. Experimental Vs CFD results for normalized concentration curves. Figure 124. Vertical lines for LDA measurements. Figure 125. LDA measurements for Vz (a, b, c) and Vx (d, e) component versus CFD data for
vertical lines between ladle shroud and strand 3 (see Figure 124-a). Figure 126. LDA measurements for Vx component versus CFD data for vertical lines between strand
2 and strand 3 (see Figure 124-b). Figure 127. Alumina inclusions removal efficiency with current tundish configuration. Figure 128. Configurations for tundish design optimisation: a) current configuration, b) configuration
#1, c) configuration #2, d) configuration #3. Figure 129. Alumina inclusions removal efficiencies for current and proposed configurations. Figure 130. Number of inclusions in a microalloy steel sequence of 2 heats covered with NEW
powder, measured by PDA (1st trial). Figure 131. Cracks from the steel sample collected at the beginning of the heat 53993 (1st trial). Figure 132. Distribution of inclusions in 2 microalloy steel heats, cover powder: NEW (1st trial).

119
Figure 133. Shape and average size of inclusions from the 1st trial with NEW powder. Figure 134. Number of inclusions in a C55 steel sequence of 5 heats covered with NEW powder (1-
2-3) and with AR (4-5), measured by PDA (3rd) trial. Figure 135. Slag samples for one cast at 75T and 225T. Figure 136. Slag samples from 2 ladle cast at 75T, 225T, 375T and 525T. Figure 137. Slag samples from a 3 cast sequence. Figure 138. Inclusions for during one cast. Figure 139. Inclusions for a 2 ladle cast. Figure 140. Inclusion types for a 3 cast sequence. Figure 141. Results of ultrasonic tests using different covering agents at DEW Figure 142. Frequency distribution of inclusion character by using different covering powder, strand
4. Figure 143. Frequency distribution of inclusion character by using different covering powder, strand
6.
120
LIST OF TABLES Table 1. Composition of AM and AR tundish cover powders. Table 2. Technical data of bloom caster at Imatra. Table 3. Materials present in the tundish during the casting at Ovako Imatra. Table 4. Analyses of the Ovako Imatra steel grades investigated in this project. Table 5. Inclusion counts and sizes using different sampling methods in the ladle. Table 6. Compositions of main components in some tundish powders tested at Tata Steel. Table 7. Tundish slags and refactory materials used at Tata Steel. Table 8. Evolution of the size of inclusions during the casting of a spring steel heat (47467). Table 9. Composition of the inclusions in the spring heat 47467 (tundish cover powder AM). Table 10. Sample after powder addition. Table 11. Sample after 90 minutes. Table 12. Aim chemistries used in Tata Steel pilot tundish trials. Table 13. Tundish lining materials. Table 14. Tundish powder and tundish slag data (averages over trial series). Table 15. Tundish powder and tundish slag data from pilot plant trials (averaged values). Table 16. Tundish liquid slag data from production plant data (averaged values). Table 17. Steel analyses (wt-%) used in equilibrium calculations with tundish slags. Table 18. Tundish slag analyses (wt-%) used in equilibrium calculations. Table 19. Slag compositions used in investigations at TUBAF. Table 20. Compendium about the investigated DHTT-samples via SEM / EDX. Table 21. Comparison between theoretical and measured element content in different areas (wt-%). Table 22. Chemical composition of slags investigated in preliminary interfacial tension
measurements. Table 23. Surface and interfacial tension of investigated slag/steel systems. Table 24. Chemical compositions of the investigated steel grades. Table 25. Compositions of tundish slag and refractory material from Ovako used in the
experiments (wt-%). Table 26. Compositions of tundish slags and refractory material from Sidenor used in the
experiments (main components, wt-%). Table 27. Compositions of tundish slags and refractory material from DEW used in the
experiments (main components, wt-%). Table 28. Composition of proposed tundish tests powders for Tata Steel. Table 29. Steel analyses (wt-%) used in equilibrium calculations with tundish slags. Table 30. Tundish slag analyses (wt-%) used in example equilibrium calculations. Table 31. Chemical composition of the slags taken during a microalloy steel sequence covered
with AM powder. Table 32. Chemical composition of the slags taken during a spring steel sequence covered with AR
powder. Table 33. Composition of NEW tundish cover powder (raw and calcinated up to 800ºC). Table 34. Material additions and pick-ups for the calculation of the estimated analysis of the
tundish slag (kg). Table 35. Tundish top slag analysis after three heat sequence. Samples taken at the end of the
tundish. Table 36. Tundish powder composition chosen for trials. Table 37. Classification rules for lollipop samples at Ovako Imatra. Table 38. Description of the inclusion clusters. Table 39. Composition for proposed tundish slags for Tata Steel. Table 40. Small scale fluxing tests on experimental powders – Series 1. Table 41. Small scale fluxing tests on experimental powders – Series 2. Table 42. Chemical composition of the slags tested at DEW. Table 43. Compositions for liquid slag component from pilot fluxing trial 1. Table 44. Compositions for liquid slag component from pilot fluxing trial 2. Table 45. Compositions for liquid slag component from pilot fluxing trial 3. Table 46. Compositions for liquid slag component from pilot fluxing trial 4. Table 47. Compositions for liquid slag component from pilot fluxing trial 5.
121
Table 48. Compositions for liquid slag component from pilot fluxing trial 6. Table 49. Compositions for liquid slag component from pilot fluxing trial 7. Table 50. Compositions for liquid slag component from pilot fluxing trial 8. Table 51. Analysis of the pumice material. Table 52. Chemical composition of the slags taken during the casting of one heat covered with AM
powder. Table 53. Proposed and current tundish slags at Tata Steel. Table 54. Cast heats of steel grade SAE1050. Sequence O1-O3 was cast with improved practice. Table 55. Cast heats of steel grade 100Cr6. Sequence P1-P3 was cast with improved practice. Table 56. Boundary conditions for CFD simulations. Table 57. RTD data for non-isothermal flow with current tundish configuration (microalloyed steel
grade). Table 58. RTD parameters for configuration 1, 2 and 3 assuming non-isothermal flow of
microalloyed steel. Table 59. Chemical composition of the slags taken during a microalloy sequence, covered with
NEW powder (1st trial). Table 60. Size and composition of the inclusions from the 1st trial with NEW powder. Table 61. Description of the industrial trial made with different tundish cover powders and the
analysis. Table 62. Chemical composition of the slags taken during a microalloy sequence, covered with
NEW powder (3rd trial). Table 63. Analysis of Tata Steel trial powder. Table 64. Influence of the different tundish cover practices on the casting parameters at Sidenor. Table 65. Costs and usage of tundish powders at Tata Steel. Table 66. Improvement in quality (quantative) % decrease in rejects/downgrades.
122
LIST OF ACRONYMS AND ABBREVIATIONS C-curves Concentration curves CFD Computational Fluid Dynamics CLSM Confocal Laser Scanning Microscope DHTT Double Hot Thermocouple Technique IA Image Analysis ICP Inductive Coupled Plasma LDA Laser Doppler Anemometer PDA-OES Pulse Discrimination Analysis - Optical Emission Spectroscopy RTD Residence Time Distribution UIS Ultrasonic Immersion testing XRF X-ray Fluorescence spectrometer SEM-SFEG Scanning Electron Microscope - Scan Field Emission Gun LIST OF REFERENCES 1. VDEh: slag atlas; Verlag Stahleisen GmbH, 1995. 2. Sahai Y. and Emi T. Tundish Technology for Clean Steel Production, World Scientific, 2008. 3. Pradeep K. JHA, Sukanta K. DASH and Sanjay KUMAR. ISIJ International, Vol 41 (2001), No. 2, pp. 1437-1446. 4. Nakajima K. and Okamura K. Proceedings of 4th International Conference on Molten Slags and
Fluxes, ISIJ, Tokyo, (1992), 505 5. Strandh J., Nakajima K., Eriksson R. and Jönsson P. A Mathematical Model to Study Liquid
Inclusion Behavior at the Steel-Slag Interface, ISIJ International, Vol. 45 (2005), No.12 s.1838-1847
6. Bouris D. and Bergeles G. Investigation of Inclusion Re-Entrainment From the Steel-Slag Interface, Metallurgical and Materials Transactions B, Vol. 29B (1998), No.3, s. 641-649.
7. Shannon G.N. and Sridhar S. Modeling Al2O3 Inclusion Separation Across Steel-Slag Interfaces, Scandinavian Journal of Metallurgy, Vol. 34, no. 6 (2005) s. 353-362.
8. Valdez M., Shannon G. S. and Sridhar S. The Ability of Slags to Absorb Solid Oxide Inclusions, ISIJ International, Vol.46 (2006), No.3, s. 450-457.
9. Bird R.B., Steward W.E. and Lightfoot E.N. Transport Phenomena, Wiley, New York, 1960. 780s.
10. Perry R.H. and Green D.W. Perry’s Chemical Engineers’ Handbook, Seventh Edition, The McGraw-Hill Companies, Inc. 1999.
11. Hydrodynamics by Professor A.H. Techet, Referenced 7.2.2011 http://web.mit.edu/2.016/www/handouts/Added_Mass_Derivation_050916.pdf 12. Alonso M. and Finn E.J. Fundamental University Physics, Second Edition, Volume 1 Mechanics
and Thermodynamics, Addison-Wesley Publishing Company 1967, 537 s. 13. Saffman P.G. The Lift Force on a Small Sphere in a Slow Shear Flow, Journal of Fluid
Mechanics, Vol. 22 (1965), No.2, s. 385-400. 14. Lataste J., Huilier D., Burnage H. and Bednar J. On the Shear Lift Force Acting on Heavy
Particles in a Turbulent Boundary Layer, Atmospheric Environment 34 (2000), s. 3963-3971. 15. Clift R., Grace J.R. and Weber M.E. Bubbles, Drops and Particles, Academic Press, New York,
1978. 16. Burdick G.M., Berman N.S. and Beaudoin S.P. Hydrodynamic Particle Removal from Surfaces,
Thin Solid Films 488 (2005), s.116-123.

123
Appendix 1. QUESTIONNAIRE FORM USED FOR THE COLLECTION OF TUNDISH PRACTICE DATA IN STEEL PLANTS.
Date: Producer: Steel grade:
No. of heat in sequence: Bloom/Slab Size:
1. Mass of the molten steel in ladle, total cast time per ladle, casting speed (tonnes/min) 2. Steel analysis in ladle before casting start, possible additions (how much, when) 3. Steel output temperature from ladle; time from measurement to casting start 4. Tundish cover powder(s) amount and analysis; how and when added, including additions during
process 5. Mineralogy of the tundish cover powder 6. Liquid slag thickness and analysis in tundish; time from the beginning of the casting 7. Steel casting level and analysis in tundish; time from the beginning of the casting 8. Steel temperature in tundish; times of measurements 9. Tundish refractory analysis; preheating temperature before the 1st heat 10. Steel analysis from mould; time from the beginning of the casting 11. Other; for example, Ar-blowing in mould stopper etc.
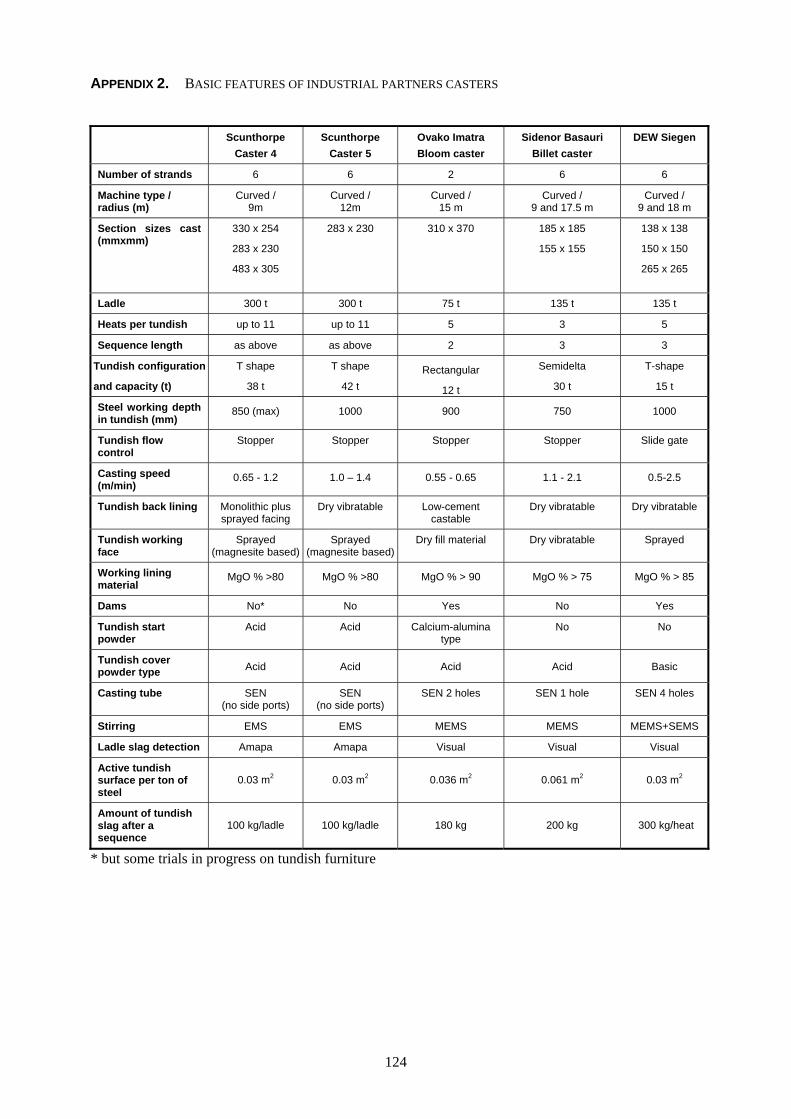
124
APPENDIX 2. BASIC FEATURES OF INDUSTRIAL PARTNERS CASTERS
Scunthorpe Caster 4
Scunthorpe Caster 5
Ovako Imatra Bloom caster
Sidenor Basauri Billet caster
DEW Siegen
Number of strands 6 6 2 6 6
Machine type / radius (m)
Curved / 9m
Curved / 12m
Curved / 15 m
Curved / 9 and 17.5 m
Curved / 9 and 18 m
Section sizes cast (mmxmm)
330 x 254
283 x 230
483 x 305
283 x 230 310 x 370 185 x 185
155 x 155
138 x 138
150 x 150
265 x 265
Ladle 300 t 300 t 75 t 135 t 135 t
Heats per tundish up to 11 up to 11 5 3 5
Sequence length as above as above 2 3 3
Tundish configuration
and capacity (t)
T shape
38 t
T shape
42 t Rectangular
12 t
Semidelta
30 t
T-shape
15 t
Steel working depth in tundish (mm)
850 (max) 1000 900 750 1000
Tundish flow control
Stopper Stopper Stopper Stopper Slide gate
Casting speed (m/min)
0.65 - 1.2 1.0 – 1.4 0.55 - 0.65 1.1 - 2.1 0.5-2.5
Tundish back lining Monolithic plus sprayed facing
Dry vibratable Low-cement castable
Dry vibratable Dry vibratable
Tundish working face
Sprayed (magnesite based)
Sprayed (magnesite based)
Dry fill material Dry vibratable Sprayed
Working lining material
MgO % >80 MgO % >80 MgO % > 90 MgO % > 75 MgO % > 85
Dams No* No Yes No Yes
Tundish start powder
Acid Acid Calcium-alumina type
No No
Tundish cover powder type Acid Acid Acid Acid Basic
Casting tube SEN (no side ports)
SEN (no side ports)
SEN 2 holes SEN 1 hole SEN 4 holes
Stirring EMS EMS MEMS MEMS MEMS+SEMS
Ladle slag detection Amapa Amapa Visual Visual Visual
Active tundish surface per ton of steel
0.03 m2 0.03 m2 0.036 m2 0.061 m2 0.03 m2
Amount of tundish slag after a sequence
100 kg/ladle 100 kg/ladle 180 kg 200 kg 300 kg/heat
* but some trials in progress on tundish furniture
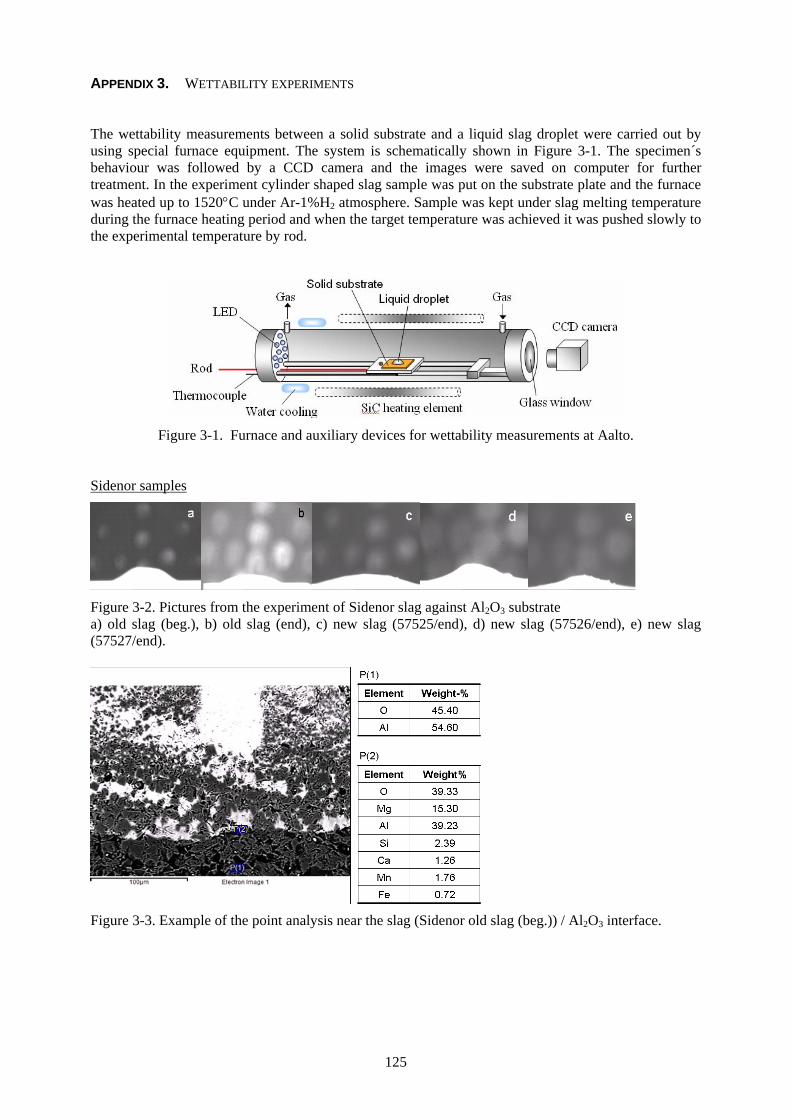
125
APPENDIX 3. WETTABILITY EXPERIMENTS The wettability measurements between a solid substrate and a liquid slag droplet were carried out by using special furnace equipment. The system is schematically shown in Figure 3-1. The specimen´s behaviour was followed by a CCD camera and the images were saved on computer for further treatment. In the experiment cylinder shaped slag sample was put on the substrate plate and the furnace was heated up to 1520°C under Ar-1%H2 atmosphere. Sample was kept under slag melting temperature during the furnace heating period and when the target temperature was achieved it was pushed slowly to the experimental temperature by rod.
Figure 3-1. Furnace and auxiliary devices for wettability measurements at Aalto.
Sidenor samples
Figure 3-2. Pictures from the experiment of Sidenor slag against Al2O3 substrate a) old slag (beg.), b) old slag (end), c) new slag (57525/end), d) new slag (57526/end), e) new slag (57527/end).
Figure 3-3. Example of the point analysis near the slag (Sidenor old slag (beg.)) / Al2O3 interface.
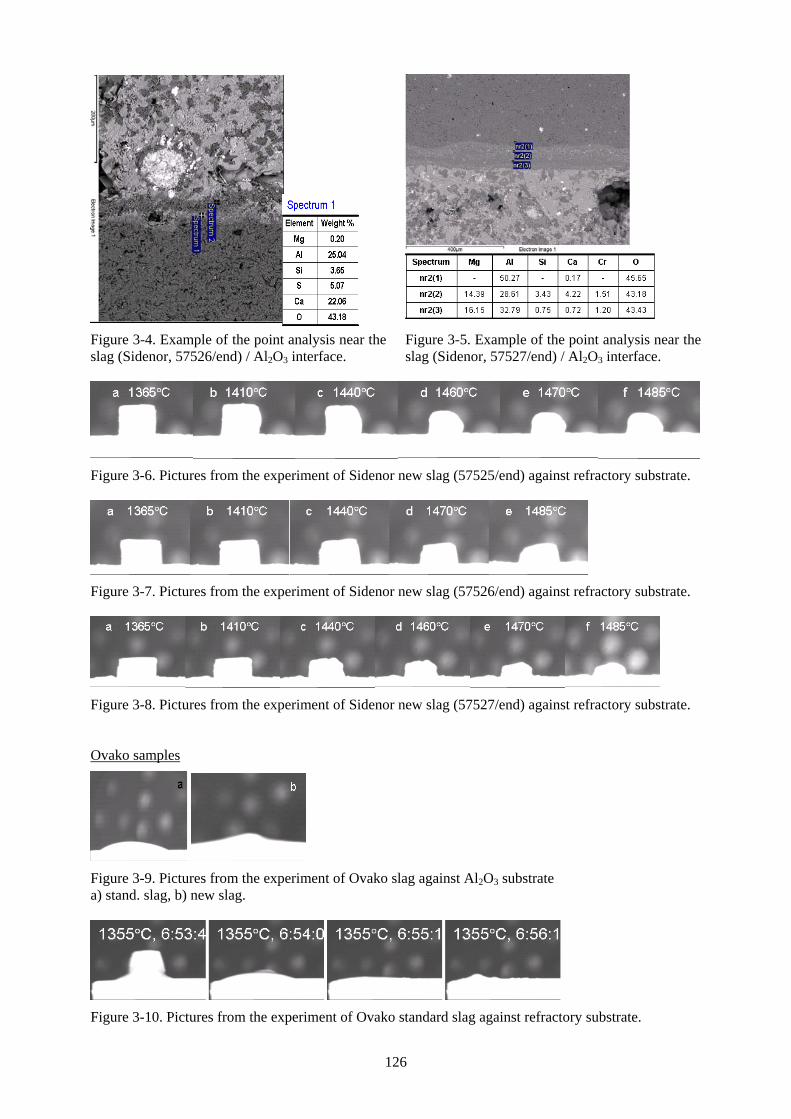
126
Figure 3-4. Example of the point analysis near the slag (Sidenor, 57526/end) / Al2O3 interface.
Figure 3-5. Example of the point analysis near the slag (Sidenor, 57527/end) / Al2O3 interface.
Figure 3-6. Pictures from the experiment of Sidenor new slag (57525/end) against refractory substrate.
Figure 3-7. Pictures from the experiment of Sidenor new slag (57526/end) against refractory substrate.
Figure 3-8. Pictures from the experiment of Sidenor new slag (57527/end) against refractory substrate. Ovako samples
Figure 3-9. Pictures from the experiment of Ovako slag against Al2O3 substrate a) stand. slag, b) new slag.
Figure 3-10. Pictures from the experiment of Ovako standard slag against refractory substrate.
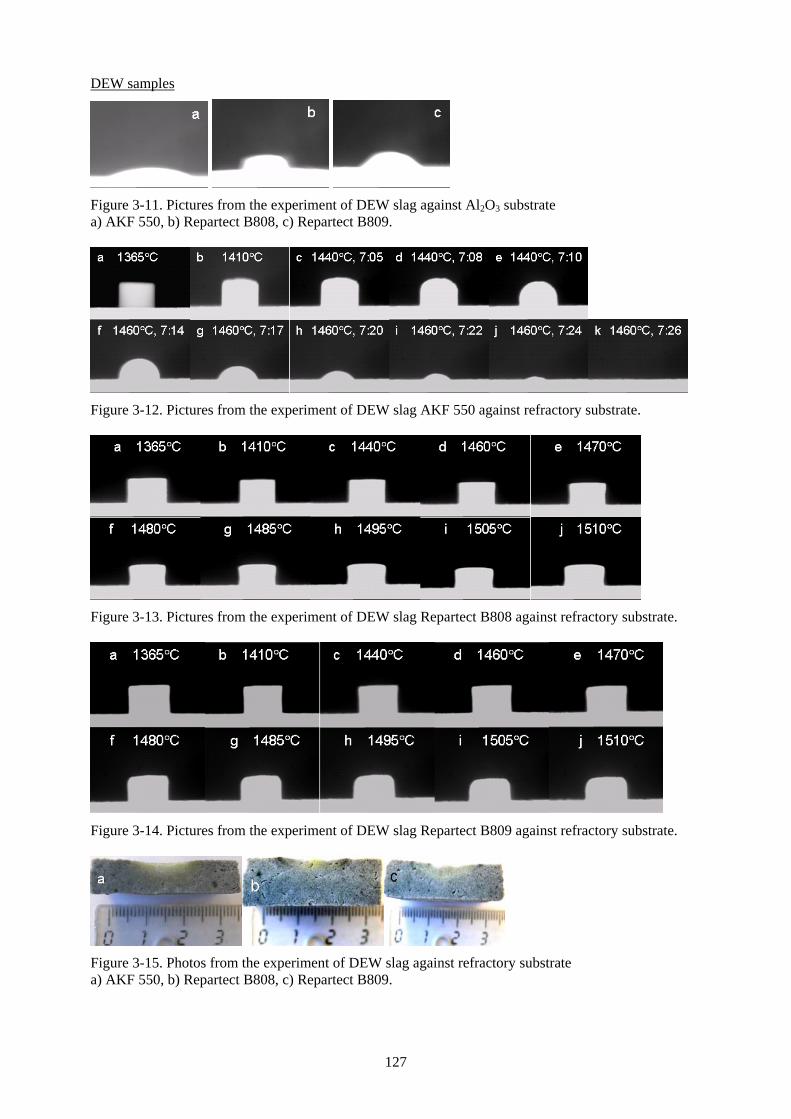
127
DEW samples
Figure 3-11. Pictures from the experiment of DEW slag against Al2O3 substrate a) AKF 550, b) Repartect B808, c) Repartect B809.
Figure 3-12. Pictures from the experiment of DEW slag AKF 550 against refractory substrate.
Figure 3-13. Pictures from the experiment of DEW slag Repartect B808 against refractory substrate.
Figure 3-14. Pictures from the experiment of DEW slag Repartect B809 against refractory substrate.
Figure 3-15. Photos from the experiment of DEW slag against refractory substrate a) AKF 550, b) Repartect B808, c) Repartect B809.
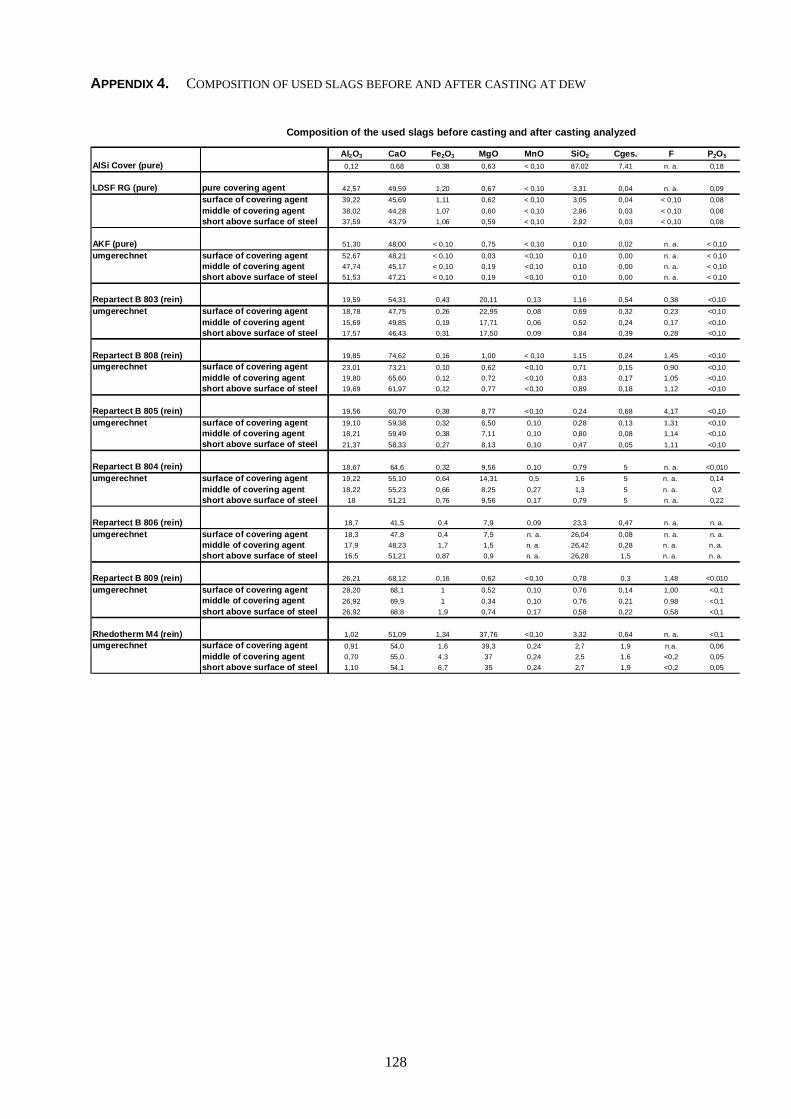
128
APPENDIX 4. COMPOSITION OF USED SLAGS BEFORE AND AFTER CASTING AT DEW
Al2O3 CaO Fe2O3 MgO MnO SiO2 Cges. F P2O5
AlSi Cover (pure) 0,12 0,68 0,38 0,63 < 0,10 87,02 7,41 n. a. 0,18
LDSF RG (pure) pure covering agent 42,57 49,59 1,20 0,67 < 0,10 3,31 0,04 n. a. 0,09surface of covering agent 39,22 45,69 1,11 0,62 < 0,10 3,05 0,04 < 0,10 0,08middle of covering agent 38,02 44,28 1,07 0,60 < 0,10 2,96 0,03 < 0,10 0,08short above surface of steel 37,59 43,79 1,06 0,59 < 0,10 2,92 0,03 < 0,10 0,08
AKF (pure) 51,30 48,00 < 0,10 0,75 < 0,10 0,10 0,02 n. a. < 0,10
umgerechnet surface of covering agent 52,67 48,21 < 0,10 0,03 <0,10 0,10 0,00 n. a. < 0,10middle of covering agent 47,74 45,17 < 0,10 0,19 <0,10 0,10 0,00 n. a. < 0,10short above surface of steel 51,53 47,21 < 0,10 0,19 <0,10 0,10 0,00 n. a. < 0,10
Repartect B 803 (rein) 19,59 54,31 0,43 20,11 0,13 1,16 0,54 0,38 <0,10umgerechnet surface of covering agent 18,78 47,75 0,26 22,95 0,08 0,69 0,32 0,23 <0,10
middle of covering agent 15,69 49,85 0,19 17,71 0,06 0,52 0,24 0,17 <0,10short above surface of steel 17,57 46,43 0,31 17,50 0,09 0,84 0,39 0,28 <0,10
Repartect B 808 (rein) 19,85 74,62 0,16 1,00 < 0,10 1,15 0,24 1,45 <0,10umgerechnet surface of covering agent 23,01 73,21 0,10 0,62 <0,10 0,71 0,15 0,90 <0,10
middle of covering agent 19,80 65,60 0,12 0,72 <0,10 0,83 0,17 1,05 <0,10short above surface of steel 19,69 61,97 0,12 0,77 <0,10 0,89 0,18 1,12 <0,10
Repartect B 805 (rein) 19,56 60,70 0,38 8,77 <0,10 0,24 0,68 4,17 <0,10
umgerechnet surface of covering agent 19,10 59,38 0,32 6,50 0,10 0,28 0,13 1,31 <0,10middle of covering agent 18,21 59,49 0,38 7,11 0,10 0,80 0,08 1,14 <0,10short above surface of steel 21,37 58,33 0,27 8,13 0,10 0,47 0,05 1,11 <0,10
Repartect B 804 (rein) 18,67 64,6 0,32 9,56 0,10 0,79 5 n. a. <0,010umgerechnet surface of covering agent 19,22 55,10 0,64 14,31 0,5 1,6 5 n. a. 0,14
middle of covering agent 18,22 55,23 0,66 8,25 0,27 1,3 5 n. a. 0,2short above surface of steel 18 51,21 0,76 9,56 0,17 0,79 5 n. a. 0,22
Repartect B 806 (rein) 18,7 41,5 0,4 7,9 0,09 23,3 0,47 n. a. n. a.
umgerechnet surface of covering agent 18,3 47,8 0,4 7,5 n. a. 26,04 0,08 n. a. n. a.middle of covering agent 17,9 48,23 1,7 1,5 n. a. 26,42 0,28 n. a. n. a. short above surface of steel 16,5 51,21 0,87 0,9 n. a. 26,28 1,5 n. a. n. a.
Repartect B 809 (rein) 26,21 68,12 0,16 0,62 <0,10 0,78 0,3 1,48 <0,010
umgerechnet surface of covering agent 28,20 68,1 1 0,52 0,10 0,76 0,14 1,00 <0,1middle of covering agent 26,92 69,9 1 0,34 0,10 0,76 0,21 0,98 <0,1short above surface of steel 26,92 68,8 1,9 0,74 0,17 0,58 0,22 0,58 <0,1
Rhedotherm M4 (rein) 1,02 51,09 1,34 37,76 <0,10 3,32 0,64 n. a. <0,1umgerechnet surface of covering agent 0,91 54,0 1,6 39,3 0,24 2,7 1,9 n.a. 0,06
middle of covering agent 0,70 55,0 4,3 37 0,24 2,5 1,6 <0,2 0,05short above surface of steel 1,10 54,1 6,7 35 0,24 2,7 1,9 <0,2 0,05
Composition of the used slags before casting and after casting analyzed
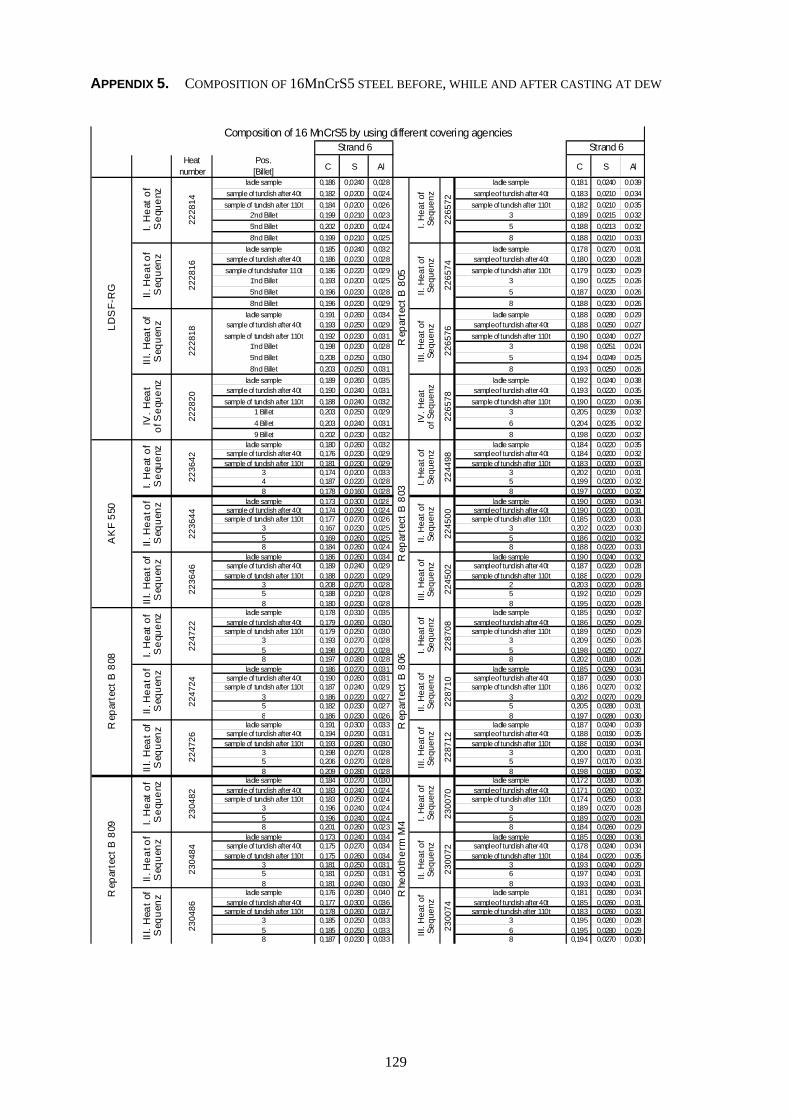
129
APPENDIX 5. COMPOSITION OF 16MnCrS5 STEEL BEFORE, WHILE AND AFTER CASTING AT DEW
Heatnumber
Pos.[Billet] C S Al C S Al
ladle sample 0,186 0,0240 0,028 ladle sample 0,181 0,0240 0,039sample of tundish after 40t 0,182 0,0200 0,024 sample of tundish after 40t 0,183 0,0210 0,034sample of tundish after 110t 0,184 0,0200 0,026 sample of tundish after 110t 0,182 0,0210 0,035
2'nd Billet 0,199 0,0210 0,023 3 0,189 0,0215 0,0325'nd Billet 0,202 0,0200 0,024 5 0,188 0,0213 0,0328'nd Billet 0,199 0,0210 0,025 8 0,188 0,0210 0,033
ladle sample 0,185 0,0240 0,032 ladle sample 0,178 0,0270 0,031sample of tundish after 40t 0,186 0,0230 0,028 sample of tundish after 40t 0,180 0,0230 0,028sample of tundishafter 110t 0,186 0,0220 0,029 sample of tundish after 110t 0,179 0,0230 0,029
1'nd Billet 0,193 0,0200 0,025 3 0,190 0,0225 0,0265'nd Billet 0,196 0,0230 0,028 5 0,187 0,0230 0,0268'nd Billet 0,196 0,0230 0,029 8 0,188 0,0230 0,026
ladle sample 0,191 0,0260 0,034 ladle sample 0,188 0,0280 0,029sample of tundish after 40t 0,193 0,0250 0,029 sample of tundish after 40t 0,188 0,0250 0,027sample of tundish after 110t 0,192 0,0230 0,031 sample of tundish after 110t 0,190 0,0240 0,027
1'nd Billet 0,198 0,0230 0,028 3 0,198 0,0251 0,0245'nd Billet 0,208 0,0250 0,030 5 0,194 0,0249 0,0258'nd Billet 0,203 0,0250 0,031 8 0,193 0,0250 0,026
ladle sample 0,189 0,0260 0,035 ladle sample 0,192 0,0240 0,038sample of tundish after 40t 0,190 0,0240 0,031 sample of tundish after 40t 0,193 0,0220 0,035sample of tundish after 110t 0,188 0,0240 0,032 sample of tundish after 110t 0,190 0,0220 0,036
1 Billet 0,203 0,0250 0,029 3 0,205 0,0239 0,0324 Billet 0,203 0,0240 0,031 6 0,204 0,0235 0,0329 Billet 0,202 0,0230 0,032 8 0,198 0,0220 0,032
ladle sample 0,180 0,0260 0,032 ladle sample 0,184 0,0220 0,035sample of tundish after 40t 0,176 0,0230 0,029 sample of tundish after 40t 0,184 0,0200 0,032sample of tundish after 110t 0,181 0,0230 0,029 sample of tundish after 110t 0,183 0,0200 0,033
3 0,174 0,0200 0,033 3 0,202 0,0210 0,0314 0,187 0,0220 0,028 5 0,199 0,0200 0,0328 0,178 0,0160 0,028 8 0,197 0,0200 0,032
ladle sample 0,173 0,0300 0,028 ladle sample 0,190 0,0260 0,034sample of tundish after 40t 0,174 0,0290 0,024 sample of tundish after 40t 0,190 0,0230 0,031sample of tundish after 110t 0,177 0,0270 0,026 sample of tundish after 110t 0,185 0,0220 0,033
3 0,167 0,0230 0,025 3 0,202 0,0220 0,0305 0,169 0,0260 0,025 5 0,186 0,0210 0,0328 0,184 0,0260 0,024 8 0,188 0,0220 0,033
ladle sample 0,186 0,0260 0,034 ladle sample 0,190 0,0240 0,032sample of tundish after 40t 0,189 0,0240 0,029 sample of tundish after 40t 0,187 0,0220 0,028sample of tundish after 110t 0,188 0,0220 0,029 sample of tundish after 110t 0,188 0,0220 0,029
3 0,208 0,0270 0,028 2 0,203 0,0220 0,0285 0,188 0,0210 0,028 5 0,192 0,0210 0,0298 0,180 0,0230 0,028 8 0,195 0,0220 0,028
ladle sample 0,178 0,0310 0,035 ladle sample 0,185 0,0290 0,032sample of tundish after 40t 0,179 0,0260 0,030 sample of tundish after 40t 0,186 0,0250 0,029sample of tundish after 110t 0,179 0,0250 0,030 sample of tundish after 110t 0,189 0,0250 0,029
3 0,193 0,0270 0,028 3 0,209 0,0250 0,0265 0,198 0,0270 0,028 5 0,198 0,0250 0,0278 0,197 0,0280 0,028 8 0,202 0,0180 0,026
ladle sample 0,186 0,0270 0,031 ladle sample 0,185 0,0290 0,034sample of tundish after 40t 0,190 0,0260 0,031 sample of tundish after 40t 0,187 0,0290 0,030sample of tundish after 110t 0,187 0,0240 0,029 sample of tundish after 110t 0,186 0,0270 0,032
3 0,186 0,0220 0,027 3 0,202 0,0270 0,0295 0,182 0,0230 0,027 5 0,205 0,0280 0,0318 0,186 0,0230 0,026 8 0,197 0,0280 0,030
ladle sample 0,191 0,0300 0,033 ladle sample 0,187 0,0240 0,039sample of tundish after 40t 0,194 0,0290 0,031 sample of tundish after 40t 0,188 0,0190 0,035sample of tundish after 110t 0,193 0,0280 0,030 sample of tundish after 110t 0,188 0,0190 0,034
3 0,198 0,0270 0,028 3 0,200 0,0200 0,0315 0,206 0,0270 0,028 5 0,197 0,0170 0,0338 0,209 0,0280 0,028 8 0,198 0,0180 0,032
ladle sample 0,184 0,0270 0,030 ladle sample 0,172 0,0280 0,036sample of tundish after 40t 0,183 0,0240 0,024 sample of tundish after 40t 0,171 0,0260 0,032sample of tundish after 110t 0,183 0,0250 0,024 sample of tundish after 110t 0,174 0,0250 0,033
3 0,196 0,0240 0,024 3 0,189 0,0270 0,0285 0,196 0,0240 0,024 5 0,189 0,0270 0,0288 0,201 0,0260 0,023 8 0,184 0,0260 0,029
ladle sample 0,173 0,0240 0,034 ladle sample 0,185 0,0280 0,036sample of tundish after 40t 0,175 0,0270 0,034 sample of tundish after 40t 0,178 0,0240 0,034sample of tundish after 110t 0,175 0,0260 0,034 sample of tundish after 110t 0,184 0,0220 0,035
3 0,181 0,0250 0,031 3 0,193 0,0240 0,0295 0,181 0,0250 0,031 6 0,197 0,0240 0,0318 0,181 0,0240 0,030 8 0,193 0,0240 0,031
ladle sample 0,176 0,0280 0,040 ladle sample 0,181 0,0280 0,034sample of tundish after 40t 0,177 0,0300 0,036 sample of tundish after 40t 0,185 0,0260 0,031sample of tundish after 110t 0,178 0,0260 0,037 sample of tundish after 110t 0,183 0,0260 0,033
3 0,185 0,0250 0,033 3 0,195 0,0260 0,0285 0,185 0,0250 0,033 6 0,195 0,0280 0,0298 0,187 0,0230 0,033 8 0,194 0,0270 0,030
Strand 6Composition of 16 MnCrS5 by using different covering agencies
Rhe
doth
erm
M4 I.
Hea
t of
Seq
uenz
2300
70
II. H
eat o
f Se
quen
z
2300
72
III. H
eat o
f Se
quen
z
2300
74
Rep
arte
ct B
809 I.
Hea
t of
Seq
uenz
2304
82
II. H
eat o
f S
eque
nz
2304
84
III. H
eat o
f S
eque
nz
2304
86
Rep
arte
ct B
806
I. H
eat o
f S
eque
nz
2287
08
II. H
eat o
f Se
quen
z
2287
10
III. H
eat o
f Se
quen
z
2287
12
Rep
arte
ct B
808 I.
Hea
t of
Seq
uenz
II. H
eat o
f S
eque
nzIII
. Hea
t of
Seq
uenz
2247
2222
4724
2247
26
Rep
arte
ct B
805
I. H
eat o
f S
eque
nz
2265
72
II. H
eat o
f Se
quen
z
2265
74
III. H
eat o
f Se
quen
z
2265
76
IV. H
eat
of S
eque
nz
2265
78
II. H
eat o
f Se
quen
z
2245
00
III. H
eat o
f Se
quen
z
2245
02
Rep
arte
ct B
803
I. H
eat o
f S
eque
nz
2244
98
IV. H
eat
of S
eque
nz
2228
20
AK
F 55
0
I. H
eat o
f S
eque
nz
2236
42
II. H
eat o
f S
eque
nz
2236
44
III. H
eat o
f S
eque
nz
2236
46
Strand 6
LDS
F-R
G
I. H
eat o
f S
eque
nz
2228
14
II. H
eat o
f S
eque
nz
2228
16
III. H
eat o
f S
eque
nz
2228
18
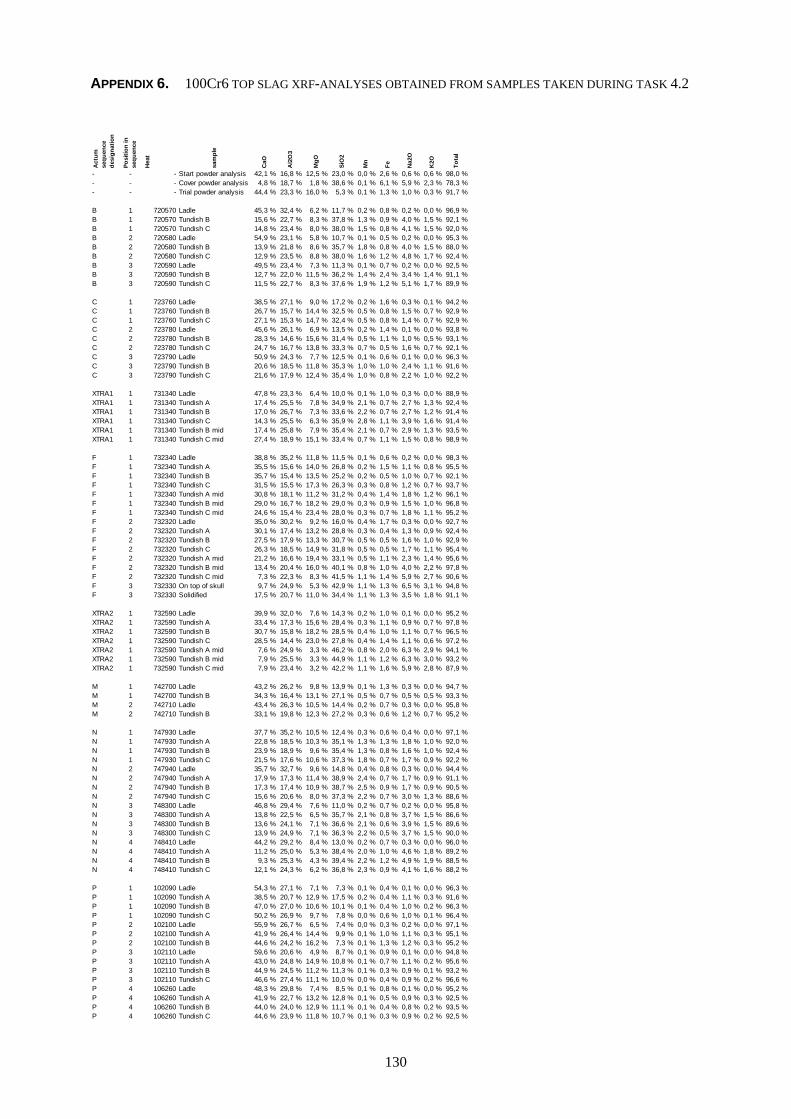
130
APPENDIX 6. 100Cr6 TOP SLAG XRF-ANALYSES OBTAINED FROM SAMPLES TAKEN DURING TASK 4.2
Act
um
sequ
ence
de
sign
atio
n
Posi
tion
in
sequ
ence
Hea
t
sam
ple
CaO
Al2
O3
MgO
SiO
2
Mn
Fe Na2
O
K2O
Tota
l
- - - Start powder analysis 42,1 % 16,8 % 12,5 % 23,0 % 0,0 % 2,6 % 0,6 % 0,6 % 98,0 %- - - Cover powder analysis 4,8 % 18,7 % 1,8 % 38,6 % 0,1 % 6,1 % 5,9 % 2,3 % 78,3 %- - - Trial powder analysis 44,4 % 23,3 % 16,0 % 5,3 % 0,1 % 1,3 % 1,0 % 0,3 % 91,7 %
B 1 720570 Ladle 45,3 % 32,4 % 6,2 % 11,7 % 0,2 % 0,8 % 0,2 % 0,0 % 96,9 %B 1 720570 Tundish B 15,6 % 22,7 % 8,3 % 37,8 % 1,3 % 0,9 % 4,0 % 1,5 % 92,1 %B 1 720570 Tundish C 14,8 % 23,4 % 8,0 % 38,0 % 1,5 % 0,8 % 4,1 % 1,5 % 92,0 %B 2 720580 Ladle 54,9 % 23,1 % 5,8 % 10,7 % 0,1 % 0,5 % 0,2 % 0,0 % 95,3 %B 2 720580 Tundish B 13,9 % 21,8 % 8,6 % 35,7 % 1,8 % 0,8 % 4,0 % 1,5 % 88,0 %B 2 720580 Tundish C 12,9 % 23,5 % 8,8 % 38,0 % 1,6 % 1,2 % 4,8 % 1,7 % 92,4 %B 3 720590 Ladle 49,5 % 23,4 % 7,3 % 11,3 % 0,1 % 0,7 % 0,2 % 0,0 % 92,5 %B 3 720590 Tundish B 12,7 % 22,0 % 11,5 % 36,2 % 1,4 % 2,4 % 3,4 % 1,4 % 91,1 %B 3 720590 Tundish C 11,5 % 22,7 % 8,3 % 37,6 % 1,9 % 1,2 % 5,1 % 1,7 % 89,9 %
C 1 723760 Ladle 38,5 % 27,1 % 9,0 % 17,2 % 0,2 % 1,6 % 0,3 % 0,1 % 94,2 %C 1 723760 Tundish B 26,7 % 15,7 % 14,4 % 32,5 % 0,5 % 0,8 % 1,5 % 0,7 % 92,9 %C 1 723760 Tundish C 27,1 % 15,3 % 14,7 % 32,4 % 0,5 % 0,8 % 1,4 % 0,7 % 92,9 %C 2 723780 Ladle 45,6 % 26,1 % 6,9 % 13,5 % 0,2 % 1,4 % 0,1 % 0,0 % 93,8 %C 2 723780 Tundish B 28,3 % 14,6 % 15,6 % 31,4 % 0,5 % 1,1 % 1,0 % 0,5 % 93,1 %C 2 723780 Tundish C 24,7 % 16,7 % 13,8 % 33,3 % 0,7 % 0,5 % 1,6 % 0,7 % 92,1 %C 3 723790 Ladle 50,9 % 24,3 % 7,7 % 12,5 % 0,1 % 0,6 % 0,1 % 0,0 % 96,3 %C 3 723790 Tundish B 20,6 % 18,5 % 11,8 % 35,3 % 1,0 % 1,0 % 2,4 % 1,1 % 91,6 %C 3 723790 Tundish C 21,6 % 17,9 % 12,4 % 35,4 % 1,0 % 0,8 % 2,2 % 1,0 % 92,2 %
XTRA1 1 731340 Ladle 47,8 % 23,3 % 6,4 % 10,0 % 0,1 % 1,0 % 0,3 % 0,0 % 88,9 %XTRA1 1 731340 Tundish A 17,4 % 25,5 % 7,8 % 34,9 % 2,1 % 0,7 % 2,7 % 1,3 % 92,4 %XTRA1 1 731340 Tundish B 17,0 % 26,7 % 7,3 % 33,6 % 2,2 % 0,7 % 2,7 % 1,2 % 91,4 %XTRA1 1 731340 Tundish C 14,3 % 25,5 % 6,3 % 35,9 % 2,8 % 1,1 % 3,9 % 1,6 % 91,4 %XTRA1 1 731340 Tundish B mid 17,4 % 25,8 % 7,9 % 35,4 % 2,1 % 0,7 % 2,9 % 1,3 % 93,5 %XTRA1 1 731340 Tundish C mid 27,4 % 18,9 % 15,1 % 33,4 % 0,7 % 1,1 % 1,5 % 0,8 % 98,9 %
F 1 732340 Ladle 38,8 % 35,2 % 11,8 % 11,5 % 0,1 % 0,6 % 0,2 % 0,0 % 98,3 %F 1 732340 Tundish A 35,5 % 15,6 % 14,0 % 26,8 % 0,2 % 1,5 % 1,1 % 0,8 % 95,5 %F 1 732340 Tundish B 35,7 % 15,4 % 13,5 % 25,2 % 0,2 % 0,5 % 1,0 % 0,7 % 92,1 %F 1 732340 Tundish C 31,5 % 15,5 % 17,3 % 26,3 % 0,3 % 0,8 % 1,2 % 0,7 % 93,7 %F 1 732340 Tundish A mid 30,8 % 18,1 % 11,2 % 31,2 % 0,4 % 1,4 % 1,8 % 1,2 % 96,1 %F 1 732340 Tundish B mid 29,0 % 16,7 % 18,2 % 29,0 % 0,3 % 0,9 % 1,5 % 1,0 % 96,8 %F 1 732340 Tundish C mid 24,6 % 15,4 % 23,4 % 28,0 % 0,3 % 0,7 % 1,8 % 1,1 % 95,2 %F 2 732320 Ladle 35,0 % 30,2 % 9,2 % 16,0 % 0,4 % 1,7 % 0,3 % 0,0 % 92,7 %F 2 732320 Tundish A 30,1 % 17,4 % 13,2 % 28,8 % 0,3 % 0,4 % 1,3 % 0,9 % 92,4 %F 2 732320 Tundish B 27,5 % 17,9 % 13,3 % 30,7 % 0,5 % 0,5 % 1,6 % 1,0 % 92,9 %F 2 732320 Tundish C 26,3 % 18,5 % 14,9 % 31,8 % 0,5 % 0,5 % 1,7 % 1,1 % 95,4 %F 2 732320 Tundish A mid 21,2 % 16,6 % 19,4 % 33,1 % 0,5 % 1,1 % 2,3 % 1,4 % 95,6 %F 2 732320 Tundish B mid 13,4 % 20,4 % 16,0 % 40,1 % 0,8 % 1,0 % 4,0 % 2,2 % 97,8 %F 2 732320 Tundish C mid 7,3 % 22,3 % 8,3 % 41,5 % 1,1 % 1,4 % 5,9 % 2,7 % 90,6 %F 3 732330 On top of skull 9,7 % 24,9 % 5,3 % 42,9 % 1,1 % 1,3 % 6,5 % 3,1 % 94,8 %F 3 732330 Solidified 17,5 % 20,7 % 11,0 % 34,4 % 1,1 % 1,3 % 3,5 % 1,8 % 91,1 %
XTRA2 1 732590 Ladle 39,9 % 32,0 % 7,6 % 14,3 % 0,2 % 1,0 % 0,1 % 0,0 % 95,2 %XTRA2 1 732590 Tundish A 33,4 % 17,3 % 15,6 % 28,4 % 0,3 % 1,1 % 0,9 % 0,7 % 97,8 %XTRA2 1 732590 Tundish B 30,7 % 15,8 % 18,2 % 28,5 % 0,4 % 1,0 % 1,1 % 0,7 % 96,5 %XTRA2 1 732590 Tundish C 28,5 % 14,4 % 23,0 % 27,8 % 0,4 % 1,4 % 1,1 % 0,6 % 97,2 %XTRA2 1 732590 Tundish A mid 7,6 % 24,9 % 3,3 % 46,2 % 0,8 % 2,0 % 6,3 % 2,9 % 94,1 %XTRA2 1 732590 Tundish B mid 7,9 % 25,5 % 3,3 % 44,9 % 1,1 % 1,2 % 6,3 % 3,0 % 93,2 %XTRA2 1 732590 Tundish C mid 7,9 % 23,4 % 3,2 % 42,2 % 1,1 % 1,6 % 5,9 % 2,8 % 87,9 %
M 1 742700 Ladle 43,2 % 26,2 % 9,8 % 13,9 % 0,1 % 1,3 % 0,3 % 0,0 % 94,7 %M 1 742700 Tundish B 34,3 % 16,4 % 13,1 % 27,1 % 0,5 % 0,7 % 0,5 % 0,5 % 93,3 %M 2 742710 Ladle 43,4 % 26,3 % 10,5 % 14,4 % 0,2 % 0,7 % 0,3 % 0,0 % 95,8 %M 2 742710 Tundish B 33,1 % 19,8 % 12,3 % 27,2 % 0,3 % 0,6 % 1,2 % 0,7 % 95,2 %
N 1 747930 Ladle 37,7 % 35,2 % 10,5 % 12,4 % 0,3 % 0,6 % 0,4 % 0,0 % 97,1 %N 1 747930 Tundish A 22,8 % 18,5 % 10,3 % 35,1 % 1,3 % 1,3 % 1,8 % 1,0 % 92,0 %N 1 747930 Tundish B 23,9 % 18,9 % 9,6 % 35,4 % 1,3 % 0,8 % 1,6 % 1,0 % 92,4 %N 1 747930 Tundish C 21,5 % 17,6 % 10,6 % 37,3 % 1,8 % 0,7 % 1,7 % 0,9 % 92,2 %N 2 747940 Ladle 35,7 % 32,7 % 9,6 % 14,8 % 0,4 % 0,8 % 0,3 % 0,0 % 94,4 %N 2 747940 Tundish A 17,9 % 17,3 % 11,4 % 38,9 % 2,4 % 0,7 % 1,7 % 0,9 % 91,1 %N 2 747940 Tundish B 17,3 % 17,4 % 10,9 % 38,7 % 2,5 % 0,9 % 1,7 % 0,9 % 90,5 %N 2 747940 Tundish C 15,6 % 20,6 % 8,0 % 37,3 % 2,2 % 0,7 % 3,0 % 1,3 % 88,6 %N 3 748300 Ladle 46,8 % 29,4 % 7,6 % 11,0 % 0,2 % 0,7 % 0,2 % 0,0 % 95,8 %N 3 748300 Tundish A 13,8 % 22,5 % 6,5 % 35,7 % 2,1 % 0,8 % 3,7 % 1,5 % 86,6 %N 3 748300 Tundish B 13,6 % 24,1 % 7,1 % 36,6 % 2,1 % 0,6 % 3,9 % 1,5 % 89,6 %N 3 748300 Tundish C 13,9 % 24,9 % 7,1 % 36,3 % 2,2 % 0,5 % 3,7 % 1,5 % 90,0 %N 4 748410 Ladle 44,2 % 29,2 % 8,4 % 13,0 % 0,2 % 0,7 % 0,3 % 0,0 % 96,0 %N 4 748410 Tundish A 11,2 % 25,0 % 5,3 % 38,4 % 2,0 % 1,0 % 4,6 % 1,8 % 89,2 %N 4 748410 Tundish B 9,3 % 25,3 % 4,3 % 39,4 % 2,2 % 1,2 % 4,9 % 1,9 % 88,5 %N 4 748410 Tundish C 12,1 % 24,3 % 6,2 % 36,8 % 2,3 % 0,9 % 4,1 % 1,6 % 88,2 %
P 1 102090 Ladle 54,3 % 27,1 % 7,1 % 7,3 % 0,1 % 0,4 % 0,1 % 0,0 % 96,3 %P 1 102090 Tundish A 38,5 % 20,7 % 12,9 % 17,5 % 0,2 % 0,4 % 1,1 % 0,3 % 91,6 %P 1 102090 Tundish B 47,0 % 27,0 % 10,6 % 10,1 % 0,1 % 0,4 % 1,0 % 0,2 % 96,3 %P 1 102090 Tundish C 50,2 % 26,9 % 9,7 % 7,8 % 0,0 % 0,6 % 1,0 % 0,1 % 96,4 %P 2 102100 Ladle 55,9 % 26,7 % 6,5 % 7,4 % 0,0 % 0,3 % 0,2 % 0,0 % 97,1 %P 2 102100 Tundish A 41,9 % 26,4 % 14,4 % 9,9 % 0,1 % 1,0 % 1,1 % 0,3 % 95,1 %P 2 102100 Tundish B 44,6 % 24,2 % 16,2 % 7,3 % 0,1 % 1,3 % 1,2 % 0,3 % 95,2 %P 3 102110 Ladle 59,6 % 20,6 % 4,9 % 8,7 % 0,1 % 0,9 % 0,1 % 0,0 % 94,8 %P 3 102110 Tundish A 43,0 % 24,8 % 14,9 % 10,8 % 0,1 % 0,7 % 1,1 % 0,2 % 95,6 %P 3 102110 Tundish B 44,9 % 24,5 % 11,2 % 11,3 % 0,1 % 0,3 % 0,9 % 0,1 % 93,2 %P 3 102110 Tundish C 46,6 % 27,4 % 11,1 % 10,0 % 0,0 % 0,4 % 0,9 % 0,2 % 96,6 %P 4 106260 Ladle 48,3 % 29,8 % 7,4 % 8,5 % 0,1 % 0,8 % 0,1 % 0,0 % 95,2 %P 4 106260 Tundish A 41,9 % 22,7 % 13,2 % 12,8 % 0,1 % 0,5 % 0,9 % 0,3 % 92,5 %P 4 106260 Tundish B 44,0 % 24,0 % 12,9 % 11,1 % 0,1 % 0,4 % 0,8 % 0,2 % 93,5 %P 4 106260 Tundish C 44,6 % 23,9 % 11,8 % 10,7 % 0,1 % 0,3 % 0,9 % 0,2 % 92,5 %
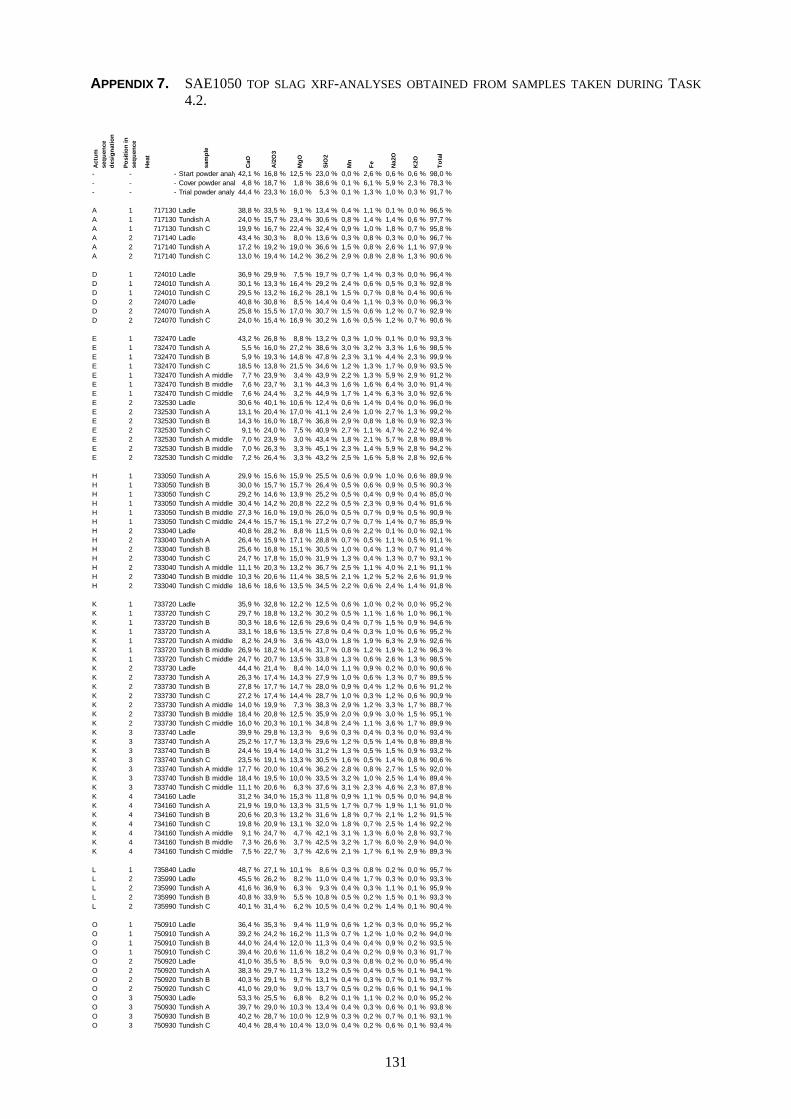
131
APPENDIX 7. SAE1050 TOP SLAG XRF-ANALYSES OBTAINED FROM SAMPLES TAKEN DURING TASK 4.2.
Act
um
sequ
ence
de
sign
atio
n
Posi
tion
in
sequ
ence
Hea
t
sam
ple
CaO
Al2
O3
MgO
SiO
2
Mn
Fe Na2
O
K2O
Tota
l
- - - Start powder analy 42,1 % 16,8 % 12,5 % 23,0 % 0,0 % 2,6 % 0,6 % 0,6 % 98,0 %- - - Cover powder anal 4,8 % 18,7 % 1,8 % 38,6 % 0,1 % 6,1 % 5,9 % 2,3 % 78,3 %- - - Trial powder analys44,4 % 23,3 % 16,0 % 5,3 % 0,1 % 1,3 % 1,0 % 0,3 % 91,7 %
A 1 717130 Ladle 38,8 % 33,5 % 9,1 % 13,4 % 0,4 % 1,1 % 0,1 % 0,0 % 96,5 %A 1 717130 Tundish A 24,0 % 15,7 % 23,4 % 30,6 % 0,8 % 1,4 % 1,4 % 0,6 % 97,7 %A 1 717130 Tundish C 19,9 % 16,7 % 22,4 % 32,4 % 0,9 % 1,0 % 1,8 % 0,7 % 95,8 %A 2 717140 Ladle 43,4 % 30,3 % 8,0 % 13,6 % 0,3 % 0,8 % 0,3 % 0,0 % 96,7 %A 2 717140 Tundish A 17,2 % 19,2 % 19,0 % 36,6 % 1,5 % 0,8 % 2,6 % 1,1 % 97,9 %A 2 717140 Tundish C 13,0 % 19,4 % 14,2 % 36,2 % 2,9 % 0,8 % 2,8 % 1,3 % 90,6 %
D 1 724010 Ladle 36,9 % 29,9 % 7,5 % 19,7 % 0,7 % 1,4 % 0,3 % 0,0 % 96,4 %D 1 724010 Tundish A 30,1 % 13,3 % 16,4 % 29,2 % 2,4 % 0,6 % 0,5 % 0,3 % 92,8 %D 1 724010 Tundish C 29,5 % 13,2 % 16,2 % 28,1 % 1,5 % 0,7 % 0,8 % 0,4 % 90,6 %D 2 724070 Ladle 40,8 % 30,8 % 8,5 % 14,4 % 0,4 % 1,1 % 0,3 % 0,0 % 96,3 %D 2 724070 Tundish A 25,8 % 15,5 % 17,0 % 30,7 % 1,5 % 0,6 % 1,2 % 0,7 % 92,9 %D 2 724070 Tundish C 24,0 % 15,4 % 16,9 % 30,2 % 1,6 % 0,5 % 1,2 % 0,7 % 90,6 %
E 1 732470 Ladle 43,2 % 26,8 % 8,8 % 13,2 % 0,3 % 1,0 % 0,1 % 0,0 % 93,3 %E 1 732470 Tundish A 5,5 % 16,0 % 27,2 % 38,6 % 3,0 % 3,2 % 3,3 % 1,6 % 98,5 %E 1 732470 Tundish B 5,9 % 19,3 % 14,8 % 47,8 % 2,3 % 3,1 % 4,4 % 2,3 % 99,9 %E 1 732470 Tundish C 18,5 % 13,8 % 21,5 % 34,6 % 1,2 % 1,3 % 1,7 % 0,9 % 93,5 %E 1 732470 Tundish A middle 7,7 % 23,9 % 3,4 % 43,9 % 2,2 % 1,3 % 5,9 % 2,9 % 91,2 %E 1 732470 Tundish B middle 7,6 % 23,7 % 3,1 % 44,3 % 1,6 % 1,6 % 6,4 % 3,0 % 91,4 %E 1 732470 Tundish C middle 7,6 % 24,4 % 3,2 % 44,9 % 1,7 % 1,4 % 6,3 % 3,0 % 92,6 %E 2 732530 Ladle 30,6 % 40,1 % 10,6 % 12,4 % 0,6 % 1,4 % 0,4 % 0,0 % 96,0 %E 2 732530 Tundish A 13,1 % 20,4 % 17,0 % 41,1 % 2,4 % 1,0 % 2,7 % 1,3 % 99,2 %E 2 732530 Tundish B 14,3 % 16,0 % 18,7 % 36,8 % 2,9 % 0,8 % 1,8 % 0,9 % 92,3 %E 2 732530 Tundish C 9,1 % 24,0 % 7,5 % 40,9 % 2,7 % 1,1 % 4,7 % 2,2 % 92,4 %E 2 732530 Tundish A middle 7,0 % 23,9 % 3,0 % 43,4 % 1,8 % 2,1 % 5,7 % 2,8 % 89,8 %E 2 732530 Tundish B middle 7,0 % 26,3 % 3,3 % 45,1 % 2,3 % 1,4 % 5,9 % 2,8 % 94,2 %E 2 732530 Tundish C middle 7,2 % 26,4 % 3,3 % 43,2 % 2,5 % 1,6 % 5,8 % 2,8 % 92,6 %
H 1 733050 Tundish A 29,9 % 15,6 % 15,9 % 25,5 % 0,6 % 0,9 % 1,0 % 0,6 % 89,9 %H 1 733050 Tundish B 30,0 % 15,7 % 15,7 % 26,4 % 0,5 % 0,6 % 0,9 % 0,5 % 90,3 %H 1 733050 Tundish C 29,2 % 14,6 % 13,9 % 25,2 % 0,5 % 0,4 % 0,9 % 0,4 % 85,0 %H 1 733050 Tundish A middle 30,4 % 14,2 % 20,8 % 22,2 % 0,5 % 2,3 % 0,9 % 0,4 % 91,6 %H 1 733050 Tundish B middle 27,3 % 16,0 % 19,0 % 26,0 % 0,5 % 0,7 % 0,9 % 0,5 % 90,9 %H 1 733050 Tundish C middle 24,4 % 15,7 % 15,1 % 27,2 % 0,7 % 0,7 % 1,4 % 0,7 % 85,9 %H 2 733040 Ladle 40,8 % 28,2 % 8,8 % 11,5 % 0,6 % 2,2 % 0,1 % 0,0 % 92,1 %H 2 733040 Tundish A 26,4 % 15,9 % 17,1 % 28,8 % 0,7 % 0,5 % 1,1 % 0,5 % 91,1 %H 2 733040 Tundish B 25,6 % 16,8 % 15,1 % 30,5 % 1,0 % 0,4 % 1,3 % 0,7 % 91,4 %H 2 733040 Tundish C 24,7 % 17,8 % 15,0 % 31,9 % 1,3 % 0,4 % 1,3 % 0,7 % 93,1 %H 2 733040 Tundish A middle 11,1 % 20,3 % 13,2 % 36,7 % 2,5 % 1,1 % 4,0 % 2,1 % 91,1 %H 2 733040 Tundish B middle 10,3 % 20,6 % 11,4 % 38,5 % 2,1 % 1,2 % 5,2 % 2,6 % 91,9 %H 2 733040 Tundish C middle 18,6 % 18,6 % 13,5 % 34,5 % 2,2 % 0,6 % 2,4 % 1,4 % 91,8 %
K 1 733720 Ladle 35,9 % 32,8 % 12,2 % 12,5 % 0,6 % 1,0 % 0,2 % 0,0 % 95,2 %K 1 733720 Tundish C 29,7 % 18,8 % 13,2 % 30,2 % 0,5 % 1,1 % 1,6 % 1,0 % 96,1 %K 1 733720 Tundish B 30,3 % 18,6 % 12,6 % 29,6 % 0,4 % 0,7 % 1,5 % 0,9 % 94,6 %K 1 733720 Tundish A 33,1 % 18,6 % 13,5 % 27,8 % 0,4 % 0,3 % 1,0 % 0,6 % 95,2 %K 1 733720 Tundish A middle 8,2 % 24,9 % 3,6 % 43,0 % 1,8 % 1,9 % 6,3 % 2,9 % 92,6 %K 1 733720 Tundish B middle 26,9 % 18,2 % 14,4 % 31,7 % 0,8 % 1,2 % 1,9 % 1,2 % 96,3 %K 1 733720 Tundish C middle 24,7 % 20,7 % 13,5 % 33,8 % 1,3 % 0,6 % 2,6 % 1,3 % 98,5 %K 2 733730 Ladle 44,4 % 21,4 % 8,4 % 14,0 % 1,1 % 0,9 % 0,2 % 0,0 % 90,6 %K 2 733730 Tundish A 26,3 % 17,4 % 14,3 % 27,9 % 1,0 % 0,6 % 1,3 % 0,7 % 89,5 %K 2 733730 Tundish B 27,8 % 17,7 % 14,7 % 28,0 % 0,9 % 0,4 % 1,2 % 0,6 % 91,2 %K 2 733730 Tundish C 27,2 % 17,4 % 14,4 % 28,7 % 1,0 % 0,3 % 1,2 % 0,6 % 90,9 %K 2 733730 Tundish A middle 14,0 % 19,9 % 7,3 % 38,3 % 2,9 % 1,2 % 3,3 % 1,7 % 88,7 %K 2 733730 Tundish B middle 18,4 % 20,8 % 12,5 % 35,9 % 2,0 % 0,9 % 3,0 % 1,5 % 95,1 %K 2 733730 Tundish C middle 16,0 % 20,3 % 10,1 % 34,8 % 2,4 % 1,1 % 3,6 % 1,7 % 89,9 %K 3 733740 Ladle 39,9 % 29,8 % 13,3 % 9,6 % 0,3 % 0,4 % 0,3 % 0,0 % 93,4 %K 3 733740 Tundish A 25,2 % 17,7 % 13,3 % 29,6 % 1,2 % 0,5 % 1,4 % 0,8 % 89,8 %K 3 733740 Tundish B 24,4 % 19,4 % 14,0 % 31,2 % 1,3 % 0,5 % 1,5 % 0,9 % 93,2 %K 3 733740 Tundish C 23,5 % 19,1 % 13,3 % 30,5 % 1,6 % 0,5 % 1,4 % 0,8 % 90,6 %K 3 733740 Tundish A middle 17,7 % 20,0 % 10,4 % 36,2 % 2,8 % 0,8 % 2,7 % 1,5 % 92,0 %K 3 733740 Tundish B middle 18,4 % 19,5 % 10,0 % 33,5 % 3,2 % 1,0 % 2,5 % 1,4 % 89,4 %K 3 733740 Tundish C middle 11,1 % 20,6 % 6,3 % 37,6 % 3,1 % 2,3 % 4,6 % 2,3 % 87,8 %K 4 734160 Ladle 31,2 % 34,0 % 15,3 % 11,8 % 0,9 % 1,1 % 0,5 % 0,0 % 94,8 %K 4 734160 Tundish A 21,9 % 19,0 % 13,3 % 31,5 % 1,7 % 0,7 % 1,9 % 1,1 % 91,0 %K 4 734160 Tundish B 20,6 % 20,3 % 13,2 % 31,6 % 1,8 % 0,7 % 2,1 % 1,2 % 91,5 %K 4 734160 Tundish C 19,8 % 20,9 % 13,1 % 32,0 % 1,8 % 0,7 % 2,5 % 1,4 % 92,2 %K 4 734160 Tundish A middle 9,1 % 24,7 % 4,7 % 42,1 % 3,1 % 1,3 % 6,0 % 2,8 % 93,7 %K 4 734160 Tundish B middle 7,3 % 26,6 % 3,7 % 42,5 % 3,2 % 1,7 % 6,0 % 2,9 % 94,0 %K 4 734160 Tundish C middle 7,5 % 22,7 % 3,7 % 42,6 % 2,1 % 1,7 % 6,1 % 2,9 % 89,3 %
L 1 735840 Ladle 48,7 % 27,1 % 10,1 % 8,6 % 0,3 % 0,8 % 0,2 % 0,0 % 95,7 %L 2 735990 Ladle 45,5 % 26,2 % 8,2 % 11,0 % 0,4 % 1,7 % 0,3 % 0,0 % 93,3 %L 2 735990 Tundish A 41,6 % 36,9 % 6,3 % 9,3 % 0,4 % 0,3 % 1,1 % 0,1 % 95,9 %L 2 735990 Tundish B 40,8 % 33,9 % 5,5 % 10,8 % 0,5 % 0,2 % 1,5 % 0,1 % 93,3 %L 2 735990 Tundish C 40,1 % 31,4 % 6,2 % 10,5 % 0,4 % 0,2 % 1,4 % 0,1 % 90,4 %
O 1 750910 Ladle 36,4 % 35,3 % 9,4 % 11,9 % 0,6 % 1,2 % 0,3 % 0,0 % 95,2 %O 1 750910 Tundish A 39,2 % 24,2 % 16,2 % 11,3 % 0,7 % 1,2 % 1,0 % 0,2 % 94,0 %O 1 750910 Tundish B 44,0 % 24,4 % 12,0 % 11,3 % 0,4 % 0,4 % 0,9 % 0,2 % 93,5 %O 1 750910 Tundish C 39,4 % 20,6 % 11,6 % 18,2 % 0,4 % 0,2 % 0,9 % 0,3 % 91,7 %O 2 750920 Ladle 41,0 % 35,5 % 8,5 % 9,0 % 0,3 % 0,8 % 0,2 % 0,0 % 95,4 %O 2 750920 Tundish A 38,3 % 29,7 % 11,3 % 13,2 % 0,5 % 0,4 % 0,5 % 0,1 % 94,1 %O 2 750920 Tundish B 40,3 % 29,1 % 9,7 % 13,1 % 0,4 % 0,3 % 0,7 % 0,1 % 93,7 %O 2 750920 Tundish C 41,0 % 29,0 % 9,0 % 13,7 % 0,5 % 0,2 % 0,6 % 0,1 % 94,1 %O 3 750930 Ladle 53,3 % 25,5 % 6,8 % 8,2 % 0,1 % 1,1 % 0,2 % 0,0 % 95,2 %O 3 750930 Tundish A 39,7 % 29,0 % 10,3 % 13,4 % 0,4 % 0,3 % 0,6 % 0,1 % 93,8 %O 3 750930 Tundish B 40,2 % 28,7 % 10,0 % 12,9 % 0,3 % 0,2 % 0,7 % 0,1 % 93,1 %O 3 750930 Tundish C 40,4 % 28,4 % 10,4 % 13,0 % 0,4 % 0,2 % 0,6 % 0,1 % 93,4 %
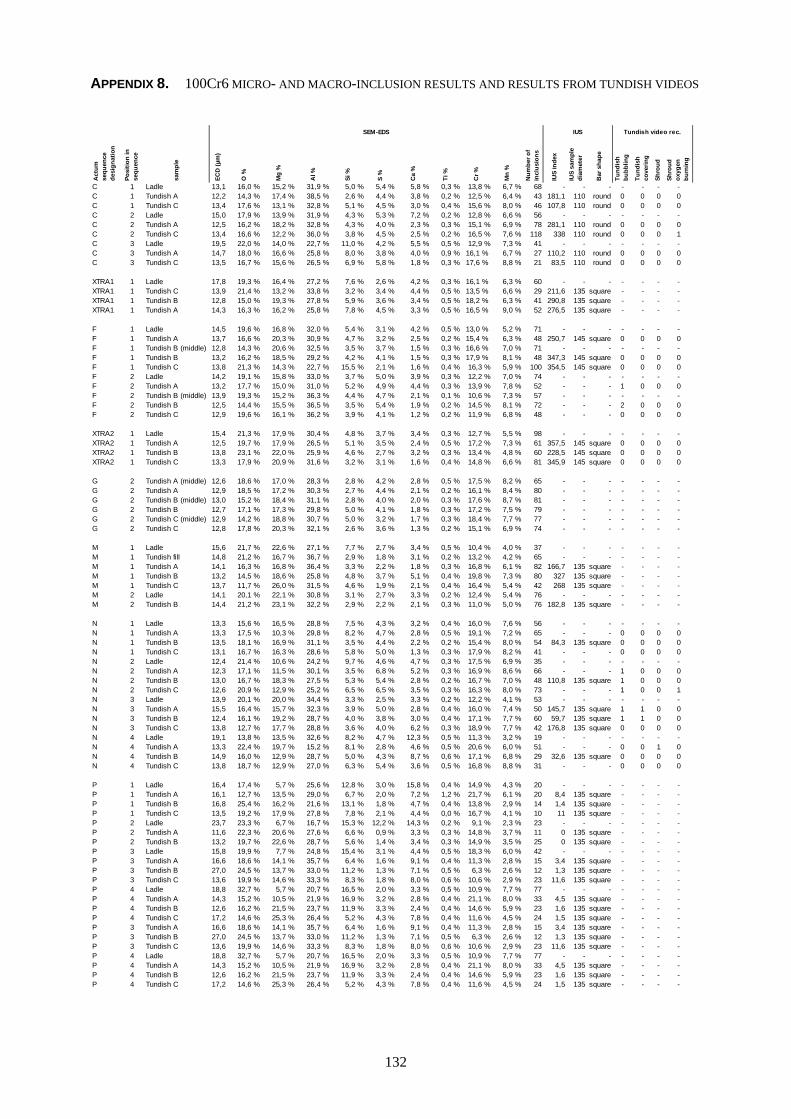
132
APPENDIX 8. 100Cr6 MICRO- AND MACRO-INCLUSION RESULTS AND RESULTS FROM TUNDISH VIDEOS
Act
um
sequ
ence
de
sign
atio
n
Posi
tion
in
sequ
ence
sam
ple
ECD
(µm
)
O %
Mg
%
Al %
Si %
S %
Ca
%
Ti %
Cr %
Mn
%
Num
ber o
f in
clus
ions
IUS
inde
x
IUS
sam
ple
diam
eter
Bar
sha
pe
Tund
ish
bubb
ling
Tund
ish
cove
ring
Shro
ud
Shro
ud
oxyg
en
burn
ing
C 1 Ladle 13,1 16,0 % 15,2 % 31,9 % 5,0 % 5,4 % 5,8 % 0,3 % 13,8 % 6,7 % 68 - - - - - - -C 1 Tundish A 12,2 14,3 % 17,4 % 38,5 % 2,6 % 4,4 % 3,8 % 0,2 % 12,5 % 6,4 % 43 181,1 110 round 0 0 0 0C 1 Tundish C 13,4 17,6 % 13,1 % 32,8 % 5,1 % 4,5 % 3,0 % 0,4 % 15,6 % 8,0 % 46 107,8 110 round 0 0 0 0C 2 Ladle 15,0 17,9 % 13,9 % 31,9 % 4,3 % 5,3 % 7,2 % 0,2 % 12,8 % 6,6 % 56 - - - - - - -C 2 Tundish A 12,5 16,2 % 18,2 % 32,8 % 4,3 % 4,0 % 2,3 % 0,3 % 15,1 % 6,9 % 78 281,1 110 round 0 0 0 0C 2 Tundish C 13,4 16,6 % 12,2 % 36,0 % 3,8 % 4,5 % 2,5 % 0,2 % 16,5 % 7,6 % 118 338 110 round 0 0 0 1C 3 Ladle 19,5 22,0 % 14,0 % 22,7 % 11,0 % 4,2 % 5,5 % 0,5 % 12,9 % 7,3 % 41 - - - - - - -C 3 Tundish A 14,7 18,0 % 16,6 % 25,8 % 8,0 % 3,8 % 4,0 % 0,9 % 16,1 % 6,7 % 27 110,2 110 round 0 0 0 0C 3 Tundish C 13,5 16,7 % 15,6 % 26,5 % 6,9 % 5,8 % 1,8 % 0,3 % 17,6 % 8,8 % 21 83,5 110 round 0 0 0 0
XTRA1 1 Ladle 17,8 19,3 % 16,4 % 27,2 % 7,6 % 2,6 % 4,2 % 0,3 % 16,1 % 6,3 % 60 - - - - - - -XTRA1 1 Tundish C 13,9 21,4 % 13,2 % 33,8 % 3,2 % 3,4 % 4,4 % 0,5 % 13,5 % 6,6 % 29 211,6 135 square - - - -XTRA1 1 Tundish B 12,8 15,0 % 19,3 % 27,8 % 5,9 % 3,6 % 3,4 % 0,5 % 18,2 % 6,3 % 41 290,8 135 square - - - -XTRA1 1 Tundish A 14,3 16,3 % 16,2 % 25,8 % 7,8 % 4,5 % 3,3 % 0,5 % 16,5 % 9,0 % 52 276,5 135 square - - - -
F 1 Ladle 14,5 19,6 % 16,8 % 32,0 % 5,4 % 3,1 % 4,2 % 0,5 % 13,0 % 5,2 % 71 - - - - - - -F 1 Tundish A 13,7 16,6 % 20,3 % 30,9 % 4,7 % 3,2 % 2,5 % 0,2 % 15,4 % 6,3 % 48 250,7 145 square 0 0 0 0F 1 Tundish B (middle) 12,8 14,3 % 20,6 % 32,5 % 3,5 % 3,7 % 1,5 % 0,3 % 16,6 % 7,0 % 71 - - - - - - -F 1 Tundish B 13,2 16,2 % 18,5 % 29,2 % 4,2 % 4,1 % 1,5 % 0,3 % 17,9 % 8,1 % 48 347,3 145 square 0 0 0 0F 1 Tundish C 13,8 21,3 % 14,3 % 22,7 % 15,5 % 2,1 % 1,6 % 0,4 % 16,3 % 5,9 % 100 354,5 145 square 0 0 0 0F 2 Ladle 14,2 19,1 % 15,8 % 33,0 % 3,7 % 5,0 % 3,9 % 0,3 % 12,2 % 7,0 % 74 - - - - - - -F 2 Tundish A 13,2 17,7 % 15,0 % 31,0 % 5,2 % 4,9 % 4,4 % 0,3 % 13,9 % 7,8 % 52 - - - 1 0 0 0F 2 Tundish B (middle) 13,9 19,3 % 15,2 % 36,3 % 4,4 % 4,7 % 2,1 % 0,1 % 10,6 % 7,3 % 57 - - - - - - -F 2 Tundish B 12,5 14,4 % 15,5 % 36,5 % 3,5 % 5,4 % 1,9 % 0,2 % 14,5 % 8,1 % 72 - - - 2 0 0 0F 2 Tundish C 12,9 19,6 % 16,1 % 36,2 % 3,9 % 4,1 % 1,2 % 0,2 % 11,9 % 6,8 % 48 - - - 0 0 0 0
XTRA2 1 Ladle 15,4 21,3 % 17,9 % 30,4 % 4,8 % 3,7 % 3,4 % 0,3 % 12,7 % 5,5 % 98 - - - - - - -XTRA2 1 Tundish A 12,5 19,7 % 17,9 % 26,5 % 5,1 % 3,5 % 2,4 % 0,5 % 17,2 % 7,3 % 61 357,5 145 square 0 0 0 0XTRA2 1 Tundish B 13,8 23,1 % 22,0 % 25,9 % 4,6 % 2,7 % 3,2 % 0,3 % 13,4 % 4,8 % 60 228,5 145 square 0 0 0 0XTRA2 1 Tundish C 13,3 17,9 % 20,9 % 31,6 % 3,2 % 3,1 % 1,6 % 0,4 % 14,8 % 6,6 % 81 345,9 145 square 0 0 0 0
G 2 Tundish A (middle) 12,6 18,6 % 17,0 % 28,3 % 2,8 % 4,2 % 2,8 % 0,5 % 17,5 % 8,2 % 65 - - - - - - -G 2 Tundish A 12,9 18,5 % 17,2 % 30,3 % 2,7 % 4,4 % 2,1 % 0,2 % 16,1 % 8,4 % 80 - - - - - - -G 2 Tundish B (middle) 13,0 15,2 % 18,4 % 31,1 % 2,8 % 4,0 % 2,0 % 0,3 % 17,6 % 8,7 % 81 - - - - - - -G 2 Tundish B 12,7 17,1 % 17,3 % 29,8 % 5,0 % 4,1 % 1,8 % 0,3 % 17,2 % 7,5 % 79 - - - - - - -G 2 Tundish C (middle) 12,9 14,2 % 18,8 % 30,7 % 5,0 % 3,2 % 1,7 % 0,3 % 18,4 % 7,7 % 77 - - - - - - -G 2 Tundish C 12,8 17,8 % 20,3 % 32,1 % 2,6 % 3,6 % 1,3 % 0,2 % 15,1 % 6,9 % 74 - - - - - - -
M 1 Ladle 15,6 21,7 % 22,6 % 27,1 % 7,7 % 2,7 % 3,4 % 0,5 % 10,4 % 4,0 % 37 - - - - - - -M 1 Tundish fill 14,8 21,2 % 16,7 % 36,7 % 2,9 % 1,8 % 3,1 % 0,2 % 13,2 % 4,2 % 65 - - - - - - -M 1 Tundish A 14,1 16,3 % 16,8 % 36,4 % 3,3 % 2,2 % 1,8 % 0,3 % 16,8 % 6,1 % 82 166,7 135 square - - - -M 1 Tundish B 13,2 14,5 % 18,6 % 25,8 % 4,8 % 3,7 % 5,1 % 0,4 % 19,8 % 7,3 % 80 327 135 square - - - -M 1 Tundish C 13,7 11,7 % 26,0 % 31,5 % 4,6 % 1,9 % 2,1 % 0,4 % 16,4 % 5,4 % 42 268 135 square - - - -M 2 Ladle 14,1 20,1 % 22,1 % 30,8 % 3,1 % 2,7 % 3,3 % 0,2 % 12,4 % 5,4 % 76 - - - - - - -M 2 Tundish B 14,4 21,2 % 23,1 % 32,2 % 2,9 % 2,2 % 2,1 % 0,3 % 11,0 % 5,0 % 76 182,8 135 square - - - -
N 1 Ladle 13,3 15,6 % 16,5 % 28,8 % 7,5 % 4,3 % 3,2 % 0,4 % 16,0 % 7,6 % 56 - - - - - - -N 1 Tundish A 13,3 17,5 % 10,3 % 29,8 % 8,2 % 4,7 % 2,8 % 0,5 % 19,1 % 7,2 % 65 - - - 0 0 0 0N 1 Tundish B 13,5 18,1 % 16,9 % 31,1 % 3,5 % 4,4 % 2,2 % 0,2 % 15,4 % 8,0 % 54 84,3 135 square 0 0 0 0N 1 Tundish C 13,1 16,7 % 16,3 % 28,6 % 5,8 % 5,0 % 1,3 % 0,3 % 17,9 % 8,2 % 41 - - - 0 0 0 0N 2 Ladle 12,4 21,4 % 10,6 % 24,2 % 9,7 % 4,6 % 4,7 % 0,3 % 17,5 % 6,9 % 35 - - - - - - -N 2 Tundish A 12,3 17,1 % 11,5 % 30,1 % 3,5 % 6,8 % 5,2 % 0,3 % 16,9 % 8,6 % 66 - - - 1 0 0 0N 2 Tundish B 13,0 16,7 % 18,3 % 27,5 % 5,3 % 5,4 % 2,8 % 0,2 % 16,7 % 7,0 % 48 110,8 135 square 1 0 0 0N 2 Tundish C 12,6 20,9 % 12,9 % 25,2 % 6,5 % 6,5 % 3,5 % 0,3 % 16,3 % 8,0 % 73 - - - 1 0 0 1N 3 Ladle 13,9 20,1 % 20,0 % 34,4 % 3,3 % 2,5 % 3,3 % 0,2 % 12,2 % 4,1 % 53 - - - - - - -N 3 Tundish A 15,5 16,4 % 15,7 % 32,3 % 3,9 % 5,0 % 2,8 % 0,4 % 16,0 % 7,4 % 50 145,7 135 square 1 1 0 0N 3 Tundish B 12,4 16,1 % 19,2 % 28,7 % 4,0 % 3,8 % 3,0 % 0,4 % 17,1 % 7,7 % 60 59,7 135 square 1 1 0 0N 3 Tundish C 13,8 12,7 % 17,7 % 28,8 % 3,6 % 4,0 % 6,2 % 0,3 % 18,9 % 7,7 % 42 176,8 135 square 0 0 0 0N 4 Ladle 19,1 13,8 % 13,5 % 32,6 % 8,2 % 4,7 % 12,3 % 0,5 % 11,3 % 3,2 % 19 - - - - - - -N 4 Tundish A 13,3 22,4 % 19,7 % 15,2 % 8,1 % 2,8 % 4,6 % 0,5 % 20,6 % 6,0 % 51 - - - 0 0 1 0N 4 Tundish B 14,9 16,0 % 12,9 % 28,7 % 5,0 % 4,3 % 8,7 % 0,6 % 17,1 % 6,8 % 29 32,6 135 square 0 0 0 0N 4 Tundish C 13,8 18,7 % 12,9 % 27,0 % 6,3 % 5,4 % 3,6 % 0,5 % 16,8 % 8,8 % 31 - - - 0 0 0 0
P 1 Ladle 16,4 17,4 % 5,7 % 25,6 % 12,8 % 3,0 % 15,8 % 0,4 % 14,9 % 4,3 % 20 - - - - - - -P 1 Tundish A 16,1 12,7 % 13,5 % 29,0 % 6,7 % 2,0 % 7,2 % 1,2 % 21,7 % 6,1 % 20 8,4 135 square - - - -P 1 Tundish B 16,8 25,4 % 16,2 % 21,6 % 13,1 % 1,8 % 4,7 % 0,4 % 13,8 % 2,9 % 14 1,4 135 square - - - -P 1 Tundish C 13,5 19,2 % 17,9 % 27,8 % 7,8 % 2,1 % 4,4 % 0,0 % 16,7 % 4,1 % 10 11 135 square - - - -P 2 Ladle 23,7 23,3 % 6,7 % 16,7 % 15,3 % 12,2 % 14,3 % 0,2 % 9,1 % 2,3 % 23 - - - - - - -P 2 Tundish A 11,6 22,3 % 20,6 % 27,6 % 6,6 % 0,9 % 3,3 % 0,3 % 14,8 % 3,7 % 11 0 135 square - - - -P 2 Tundish B 13,2 19,7 % 22,6 % 28,7 % 5,6 % 1,4 % 3,4 % 0,3 % 14,9 % 3,5 % 25 0 135 square - - - -P 3 Ladle 15,8 19,9 % 7,7 % 24,8 % 15,4 % 3,1 % 4,4 % 0,5 % 18,3 % 6,0 % 42 - - - - - - -P 3 Tundish A 16,6 18,6 % 14,1 % 35,7 % 6,4 % 1,6 % 9,1 % 0,4 % 11,3 % 2,8 % 15 3,4 135 square - - - -P 3 Tundish B 27,0 24,5 % 13,7 % 33,0 % 11,2 % 1,3 % 7,1 % 0,5 % 6,3 % 2,6 % 12 1,3 135 square - - - -P 3 Tundish C 13,6 19,9 % 14,6 % 33,3 % 8,3 % 1,8 % 8,0 % 0,6 % 10,6 % 2,9 % 23 11,6 135 square - - - -P 4 Ladle 18,8 32,7 % 5,7 % 20,7 % 16,5 % 2,0 % 3,3 % 0,5 % 10,9 % 7,7 % 77 - - - - - - -P 4 Tundish A 14,3 15,2 % 10,5 % 21,9 % 16,9 % 3,2 % 2,8 % 0,4 % 21,1 % 8,0 % 33 4,5 135 square - - - -P 4 Tundish B 12,6 16,2 % 21,5 % 23,7 % 11,9 % 3,3 % 2,4 % 0,4 % 14,6 % 5,9 % 23 1,6 135 square - - - -P 4 Tundish C 17,2 14,6 % 25,3 % 26,4 % 5,2 % 4,3 % 7,8 % 0,4 % 11,6 % 4,5 % 24 1,5 135 square - - - -P 3 Tundish A 16,6 18,6 % 14,1 % 35,7 % 6,4 % 1,6 % 9,1 % 0,4 % 11,3 % 2,8 % 15 3,4 135 square - - - -P 3 Tundish B 27,0 24,5 % 13,7 % 33,0 % 11,2 % 1,3 % 7,1 % 0,5 % 6,3 % 2,6 % 12 1,3 135 square - - - -P 3 Tundish C 13,6 19,9 % 14,6 % 33,3 % 8,3 % 1,8 % 8,0 % 0,6 % 10,6 % 2,9 % 23 11,6 135 square - - - -P 4 Ladle 18,8 32,7 % 5,7 % 20,7 % 16,5 % 2,0 % 3,3 % 0,5 % 10,9 % 7,7 % 77 - - - - - - -P 4 Tundish A 14,3 15,2 % 10,5 % 21,9 % 16,9 % 3,2 % 2,8 % 0,4 % 21,1 % 8,0 % 33 4,5 135 square - - - -P 4 Tundish B 12,6 16,2 % 21,5 % 23,7 % 11,9 % 3,3 % 2,4 % 0,4 % 14,6 % 5,9 % 23 1,6 135 square - - - -P 4 Tundish C 17,2 14,6 % 25,3 % 26,4 % 5,2 % 4,3 % 7,8 % 0,4 % 11,6 % 4,5 % 24 1,5 135 square - - - -
SEM-EDS IUS Tundish video rec.
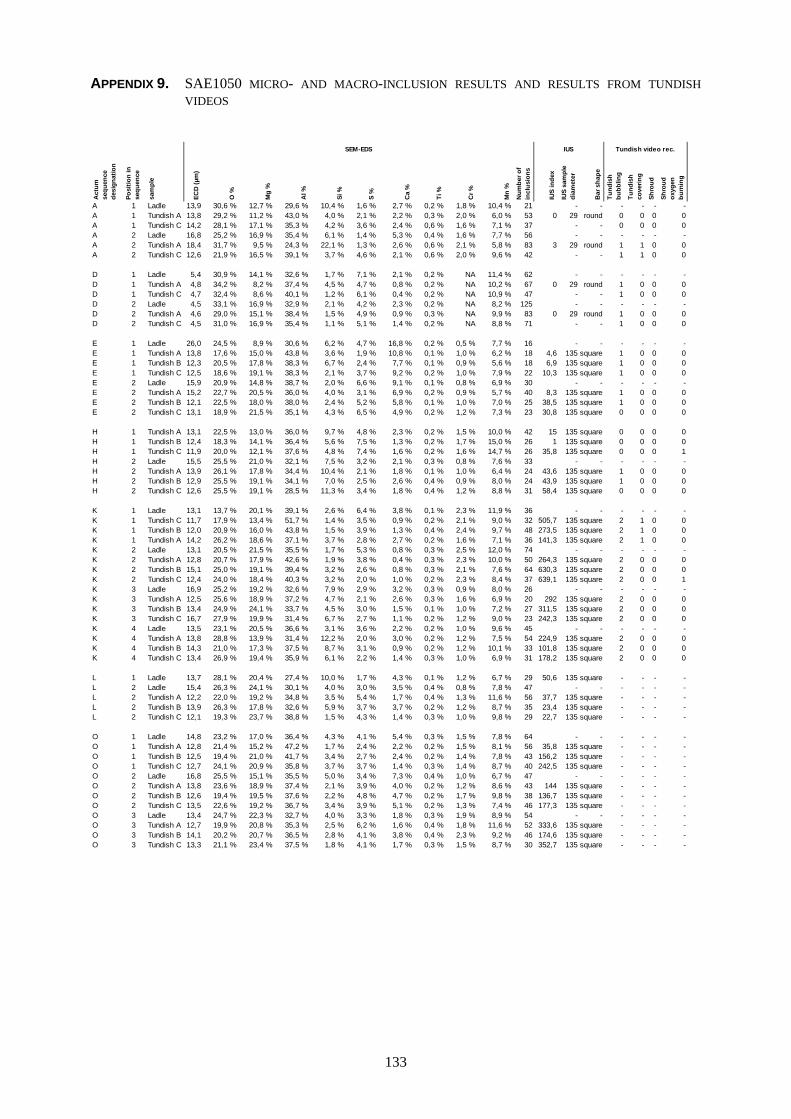
133
APPENDIX 9. SAE1050 MICRO- AND MACRO-INCLUSION RESULTS AND RESULTS FROM TUNDISH VIDEOS
Act
um
sequ
ence
de
sign
atio
n
Posi
tion
in
sequ
ence
sam
ple
ECD
(µm
)
O %
Mg
%
Al %
Si %
S %
Ca
%
Ti %
Cr %
Mn
%
Num
ber o
f in
clus
ions
IUS
inde
x
IUS
sam
ple
diam
eter
Bar
sha
pe
Tund
ish
bubb
ling
Tund
ish
cove
ring
Shro
ud
Shro
ud
oxyg
en
burn
ing
A 1 Ladle 13,9 30,6 % 12,7 % 29,6 % 10,4 % 1,6 % 2,7 % 0,2 % 1,8 % 10,4 % 21 - - - - - -A 1 Tundish A 13,8 29,2 % 11,2 % 43,0 % 4,0 % 2,1 % 2,2 % 0,3 % 2,0 % 6,0 % 53 0 29 round 0 0 0 0A 1 Tundish C 14,2 28,1 % 17,1 % 35,3 % 4,2 % 3,6 % 2,4 % 0,6 % 1,6 % 7,1 % 37 - - 0 0 0 0A 2 Ladle 16,8 25,2 % 16,9 % 35,4 % 6,1 % 1,4 % 5,3 % 0,4 % 1,6 % 7,7 % 56 - - - - - -A 2 Tundish A 18,4 31,7 % 9,5 % 24,3 % 22,1 % 1,3 % 2,6 % 0,6 % 2,1 % 5,8 % 83 3 29 round 1 1 0 0A 2 Tundish C 12,6 21,9 % 16,5 % 39,1 % 3,7 % 4,6 % 2,1 % 0,6 % 2,0 % 9,6 % 42 - - 1 1 0 0
D 1 Ladle 5,4 30,9 % 14,1 % 32,6 % 1,7 % 7,1 % 2,1 % 0,2 % NA 11,4 % 62 - - - - - -D 1 Tundish A 4,8 34,2 % 8,2 % 37,4 % 4,5 % 4,7 % 0,8 % 0,2 % NA 10,2 % 67 0 29 round 1 0 0 0D 1 Tundish C 4,7 32,4 % 8,6 % 40,1 % 1,2 % 6,1 % 0,4 % 0,2 % NA 10,9 % 47 - - 1 0 0 0D 2 Ladle 4,5 33,1 % 16,9 % 32,9 % 2,1 % 4,2 % 2,3 % 0,2 % NA 8,2 % 125 - - - - - -D 2 Tundish A 4,6 29,0 % 15,1 % 38,4 % 1,5 % 4,9 % 0,9 % 0,3 % NA 9,9 % 83 0 29 round 1 0 0 0D 2 Tundish C 4,5 31,0 % 16,9 % 35,4 % 1,1 % 5,1 % 1,4 % 0,2 % NA 8,8 % 71 - - 1 0 0 0
E 1 Ladle 26,0 24,5 % 8,9 % 30,6 % 6,2 % 4,7 % 16,8 % 0,2 % 0,5 % 7,7 % 16 - - - - - -E 1 Tundish A 13,8 17,6 % 15,0 % 43,8 % 3,6 % 1,9 % 10,8 % 0,1 % 1,0 % 6,2 % 18 4,6 135 square 1 0 0 0E 1 Tundish B 12,3 20,5 % 17,8 % 38,3 % 6,7 % 2,4 % 7,7 % 0,1 % 0,9 % 5,6 % 18 6,9 135 square 1 0 0 0E 1 Tundish C 12,5 18,6 % 19,1 % 38,3 % 2,1 % 3,7 % 9,2 % 0,2 % 1,0 % 7,9 % 22 10,3 135 square 1 0 0 0E 2 Ladle 15,9 20,9 % 14,8 % 38,7 % 2,0 % 6,6 % 9,1 % 0,1 % 0,8 % 6,9 % 30 - - - - - -E 2 Tundish A 15,2 22,7 % 20,5 % 36,0 % 4,0 % 3,1 % 6,9 % 0,2 % 0,9 % 5,7 % 40 8,3 135 square 1 0 0 0E 2 Tundish B 12,1 22,5 % 18,0 % 38,0 % 2,4 % 5,2 % 5,8 % 0,1 % 1,0 % 7,0 % 25 38,5 135 square 1 0 0 0E 2 Tundish C 13,1 18,9 % 21,5 % 35,1 % 4,3 % 6,5 % 4,9 % 0,2 % 1,2 % 7,3 % 23 30,8 135 square 0 0 0 0
H 1 Tundish A 13,1 22,5 % 13,0 % 36,0 % 9,7 % 4,8 % 2,3 % 0,2 % 1,5 % 10,0 % 42 15 135 square 0 0 0 0H 1 Tundish B 12,4 18,3 % 14,1 % 36,4 % 5,6 % 7,5 % 1,3 % 0,2 % 1,7 % 15,0 % 26 1 135 square 0 0 0 0H 1 Tundish C 11,9 20,0 % 12,1 % 37,6 % 4,8 % 7,4 % 1,6 % 0,2 % 1,6 % 14,7 % 26 35,8 135 square 0 0 0 1H 2 Ladle 15,5 25,5 % 21,0 % 32,1 % 7,5 % 3,2 % 2,1 % 0,3 % 0,8 % 7,6 % 33 - - - - - -H 2 Tundish A 13,9 26,1 % 17,8 % 34,4 % 10,4 % 2,1 % 1,8 % 0,1 % 1,0 % 6,4 % 24 43,6 135 square 1 0 0 0H 2 Tundish B 12,9 25,5 % 19,1 % 34,1 % 7,0 % 2,5 % 2,6 % 0,4 % 0,9 % 8,0 % 24 43,9 135 square 1 0 0 0H 2 Tundish C 12,6 25,5 % 19,1 % 28,5 % 11,3 % 3,4 % 1,8 % 0,4 % 1,2 % 8,8 % 31 58,4 135 square 0 0 0 0
K 1 Ladle 13,1 13,7 % 20,1 % 39,1 % 2,6 % 6,4 % 3,8 % 0,1 % 2,3 % 11,9 % 36 - - - - - -K 1 Tundish C 11,7 17,9 % 13,4 % 51,7 % 1,4 % 3,5 % 0,9 % 0,2 % 2,1 % 9,0 % 32 505,7 135 square 2 1 0 0K 1 Tundish B 12,0 20,9 % 16,0 % 43,8 % 1,5 % 3,9 % 1,3 % 0,4 % 2,4 % 9,7 % 48 273,5 135 square 2 1 0 0K 1 Tundish A 14,2 26,2 % 18,6 % 37,1 % 3,7 % 2,8 % 2,7 % 0,2 % 1,6 % 7,1 % 36 141,3 135 square 2 1 0 0K 2 Ladle 13,1 20,5 % 21,5 % 35,5 % 1,7 % 5,3 % 0,8 % 0,3 % 2,5 % 12,0 % 74 - - - - - -K 2 Tundish A 12,8 20,7 % 17,9 % 42,6 % 1,9 % 3,8 % 0,4 % 0,3 % 2,3 % 10,0 % 50 264,3 135 square 2 0 0 0K 2 Tundish B 15,1 25,0 % 19,1 % 39,4 % 3,2 % 2,6 % 0,8 % 0,3 % 2,1 % 7,6 % 64 630,3 135 square 2 0 0 0K 2 Tundish C 12,4 24,0 % 18,4 % 40,3 % 3,2 % 2,0 % 1,0 % 0,2 % 2,3 % 8,4 % 37 639,1 135 square 2 0 0 1K 3 Ladle 16,9 25,2 % 19,2 % 32,6 % 7,9 % 2,9 % 3,2 % 0,3 % 0,9 % 8,0 % 26 - - - - - -K 3 Tundish A 12,5 25,6 % 18,9 % 37,2 % 4,7 % 2,1 % 2,6 % 0,3 % 1,6 % 6,9 % 20 292 135 square 2 0 0 0K 3 Tundish B 13,4 24,9 % 24,1 % 33,7 % 4,5 % 3,0 % 1,5 % 0,1 % 1,0 % 7,2 % 27 311,5 135 square 2 0 0 0K 3 Tundish C 16,7 27,9 % 19,9 % 31,4 % 6,7 % 2,7 % 1,1 % 0,2 % 1,2 % 9,0 % 23 242,3 135 square 2 0 0 0K 4 Ladle 13,5 23,1 % 20,5 % 36,6 % 3,1 % 3,6 % 2,2 % 0,2 % 1,0 % 9,6 % 45 - - - - - -K 4 Tundish A 13,8 28,8 % 13,9 % 31,4 % 12,2 % 2,0 % 3,0 % 0,2 % 1,2 % 7,5 % 54 224,9 135 square 2 0 0 0K 4 Tundish B 14,3 21,0 % 17,3 % 37,5 % 8,7 % 3,1 % 0,9 % 0,2 % 1,2 % 10,1 % 33 101,8 135 square 2 0 0 0K 4 Tundish C 13,4 26,9 % 19,4 % 35,9 % 6,1 % 2,2 % 1,4 % 0,3 % 1,0 % 6,9 % 31 178,2 135 square 2 0 0 0
L 1 Ladle 13,7 28,1 % 20,4 % 27,4 % 10,0 % 1,7 % 4,3 % 0,1 % 1,2 % 6,7 % 29 50,6 135 square - - - -L 2 Ladle 15,4 26,3 % 24,1 % 30,1 % 4,0 % 3,0 % 3,5 % 0,4 % 0,8 % 7,8 % 47 - - - - - -L 2 Tundish A 12,2 22,0 % 19,2 % 34,8 % 3,5 % 5,4 % 1,7 % 0,4 % 1,3 % 11,6 % 56 37,7 135 square - - - -L 2 Tundish B 13,9 26,3 % 17,8 % 32,6 % 5,9 % 3,7 % 3,7 % 0,2 % 1,2 % 8,7 % 35 23,4 135 square - - - -L 2 Tundish C 12,1 19,3 % 23,7 % 38,8 % 1,5 % 4,3 % 1,4 % 0,3 % 1,0 % 9,8 % 29 22,7 135 square - - - -
O 1 Ladle 14,8 23,2 % 17,0 % 36,4 % 4,3 % 4,1 % 5,4 % 0,3 % 1,5 % 7,8 % 64 - - - - - -O 1 Tundish A 12,8 21,4 % 15,2 % 47,2 % 1,7 % 2,4 % 2,2 % 0,2 % 1,5 % 8,1 % 56 35,8 135 square - - - -O 1 Tundish B 12,5 19,4 % 21,0 % 41,7 % 3,4 % 2,7 % 2,4 % 0,2 % 1,4 % 7,8 % 43 156,2 135 square - - - -O 1 Tundish C 12,7 24,1 % 20,9 % 35,8 % 3,7 % 3,7 % 1,4 % 0,3 % 1,4 % 8,7 % 40 242,5 135 square - - - -O 2 Ladle 16,8 25,5 % 15,1 % 35,5 % 5,0 % 3,4 % 7,3 % 0,4 % 1,0 % 6,7 % 47 - - - - - -O 2 Tundish A 13,8 23,6 % 18,9 % 37,4 % 2,1 % 3,9 % 4,0 % 0,2 % 1,2 % 8,6 % 43 144 135 square - - - -O 2 Tundish B 12,6 19,4 % 19,5 % 37,6 % 2,2 % 4,8 % 4,7 % 0,2 % 1,7 % 9,8 % 38 136,7 135 square - - - -O 2 Tundish C 13,5 22,6 % 19,2 % 36,7 % 3,4 % 3,9 % 5,1 % 0,2 % 1,3 % 7,4 % 46 177,3 135 square - - - -O 3 Ladle 13,4 24,7 % 22,3 % 32,7 % 4,0 % 3,3 % 1,8 % 0,3 % 1,9 % 8,9 % 54 - - - - - -O 3 Tundish A 12,7 19,9 % 20,8 % 35,3 % 2,5 % 6,2 % 1,6 % 0,4 % 1,8 % 11,6 % 52 333,6 135 square - - - -O 3 Tundish B 14,1 20,2 % 20,7 % 36,5 % 2,8 % 4,1 % 3,8 % 0,4 % 2,3 % 9,2 % 46 174,6 135 square - - - -O 3 Tundish C 13,3 21,1 % 23,4 % 37,5 % 1,8 % 4,1 % 1,7 % 0,3 % 1,5 % 8,7 % 30 352,7 135 square - - - -
SEM-EDS IUS Tundish video rec.
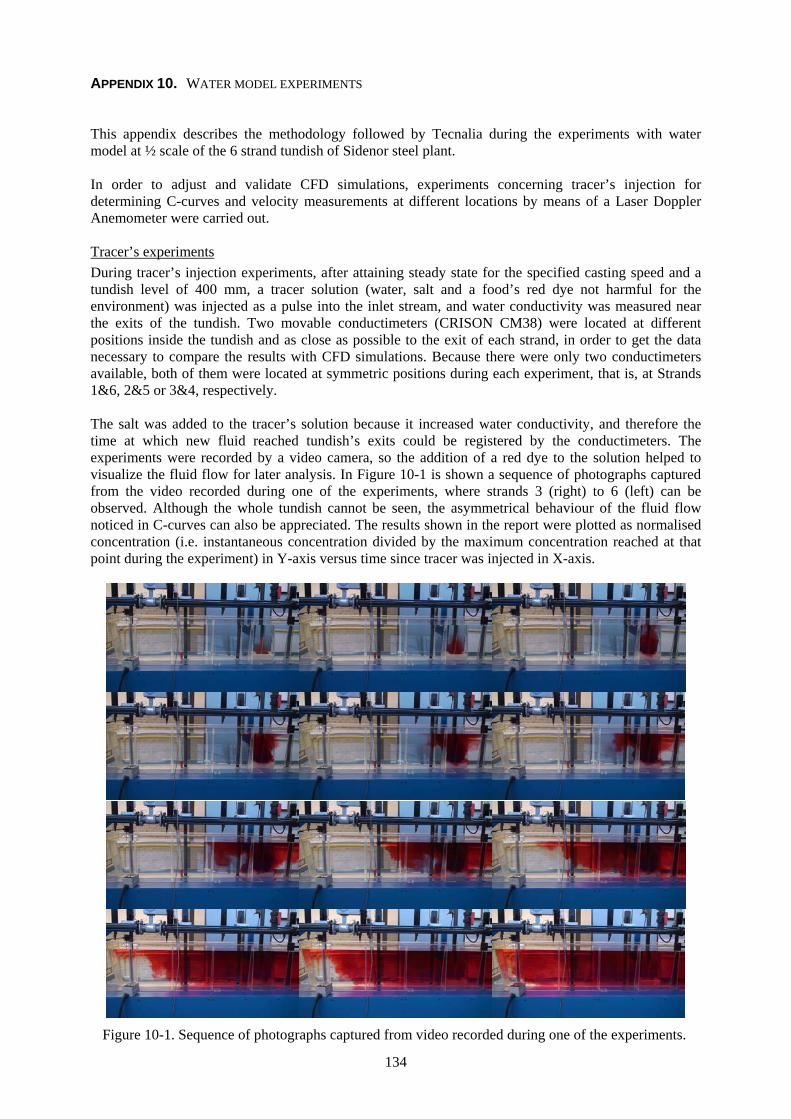
134
APPENDIX 10. WATER MODEL EXPERIMENTS This appendix describes the methodology followed by Tecnalia during the experiments with water model at ½ scale of the 6 strand tundish of Sidenor steel plant. In order to adjust and validate CFD simulations, experiments concerning tracer’s injection for determining C-curves and velocity measurements at different locations by means of a Laser Doppler Anemometer were carried out. Tracer’s experiments During tracer’s injection experiments, after attaining steady state for the specified casting speed and a tundish level of 400 mm, a tracer solution (water, salt and a food’s red dye not harmful for the environment) was injected as a pulse into the inlet stream, and water conductivity was measured near the exits of the tundish. Two movable conductimeters (CRISON CM38) were located at different positions inside the tundish and as close as possible to the exit of each strand, in order to get the data necessary to compare the results with CFD simulations. Because there were only two conductimeters available, both of them were located at symmetric positions during each experiment, that is, at Strands 1&6, 2&5 or 3&4, respectively. The salt was added to the tracer’s solution because it increased water conductivity, and therefore the time at which new fluid reached tundish’s exits could be registered by the conductimeters. The experiments were recorded by a video camera, so the addition of a red dye to the solution helped to visualize the fluid flow for later analysis. In Figure 10-1 is shown a sequence of photographs captured from the video recorded during one of the experiments, where strands 3 (right) to 6 (left) can be observed. Although the whole tundish cannot be seen, the asymmetrical behaviour of the fluid flow noticed in C-curves can also be appreciated. The results shown in the report were plotted as normalised concentration (i.e. instantaneous concentration divided by the maximum concentration reached at that point during the experiment) in Y-axis versus time since tracer was injected in X-axis.
Figure 10-1. Sequence of photographs captured from video recorded during one of the experiments.
135
Several campaigns of measurements were carried out in an attempt to adjust experimental and simulation results. In this sense, conductivity was measured at intermediate locations less affected by local turbulence near the tip of the stopper rod. Besides, because the mass flow rate was fairly unstable at each strand, simulations were carried out in order to consider at each strand the mass flow rate measured during a particular experiment, and also the density of the tracer injected. Another possible cause of not achieving repeatability when measuring concentration at the same strand could be that the location of conductimeters might vary slightly from one experiment to another, because they were positioned manually. To avoid this problem, three consecutive tracer’s injections at each position were carried out. But, discrepancies were also observed in this case. Finally it was concluded that due to instabilities and complexity of the six strand water model, it was difficult to achieve a good agreement and repeatability between experimental and CFD results. However, results suggested that CFD simulations of the water model were in accordance to the results of experimental data regarding tracer concentration measurement for most of the locations. LDA measurements A Laser Doppler Anemometer was used to measure velocity at different points of the tundish in the water model and compare with CFD simulations. It was not possible to introduce seeding particles inside the tundish (open system) so only the own particles that carried the water were used, and therefore it was difficult to get a good LDA signal. The LDA probe was mounted into a traverse system and laser beams had to enter the tundish perpendicular to the wall that was inclined 10 degrees, so the probe had to be orientated. The coordinates of a reference point were measured when the tundish reached the working level (i.e. 400 mm), and then the traverse system was displaced to measure velocity components at different locations (Figure 124 in the report). LDA probe was rotated in order to measure X-component and Z-component of the velocities within the tundish. LDA measurements required quite long times, and besides the instabilities of the water model that difficult achieving the steady state considered for simulations, another problem appeared because the working level was varying during the experiments, so the mass flow rate might increase temporarily. Discrepancies between LDA measurements and CFD simulations were clear. Although a good agreement was obtained for some points and a good tendency might be observed for the shape of the curves, in general the velocities measured in the water model were higher (in absolute value) than the ones predicted by CFD simulations.
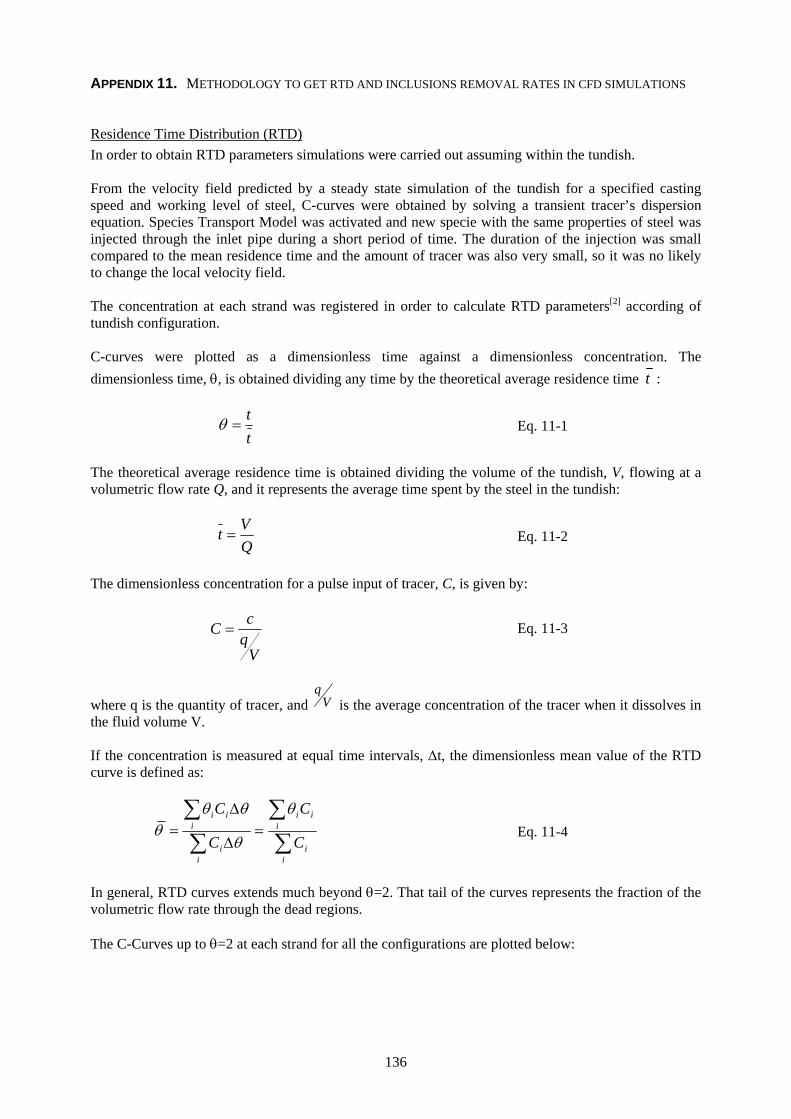
136
APPENDIX 11. METHODOLOGY TO GET RTD AND INCLUSIONS REMOVAL RATES IN CFD SIMULATIONS Residence Time Distribution (RTD) In order to obtain RTD parameters simulations were carried out assuming within the tundish. From the velocity field predicted by a steady state simulation of the tundish for a specified casting speed and working level of steel, C-curves were obtained by solving a transient tracer’s dispersion equation. Species Transport Model was activated and new specie with the same properties of steel was injected through the inlet pipe during a short period of time. The duration of the injection was small compared to the mean residence time and the amount of tracer was also very small, so it was no likely to change the local velocity field. The concentration at each strand was registered in order to calculate RTD parameters[2] according of tundish configuration. C-curves were plotted as a dimensionless time against a dimensionless concentration. The dimensionless time, θ, is obtained dividing any time by the theoretical average residence time t :
tt
=θ Eq. 11-1
The theoretical average residence time is obtained dividing the volume of the tundish, V, flowing at a volumetric flow rate Q, and it represents the average time spent by the steel in the tundish:
QVt = Eq. 11-2
The dimensionless concentration for a pulse input of tracer, C, is given by:
VqcC = Eq. 11-3
where q is the quantity of tracer, and Vq
is the average concentration of the tracer when it dissolves in the fluid volume V. If the concentration is measured at equal time intervals, ∆t, the dimensionless mean value of the RTD curve is defined as:
∑∑
∑∑
=∆
∆=
ii
iii
ii
iii
C
C
C
C θ
θ
θθθ Eq. 11-4
In general, RTD curves extends much beyond θ=2. That tail of the curves represents the fraction of the volumetric flow rate through the dead regions. The C-Curves up to θ=2 at each strand for all the configurations are plotted below:
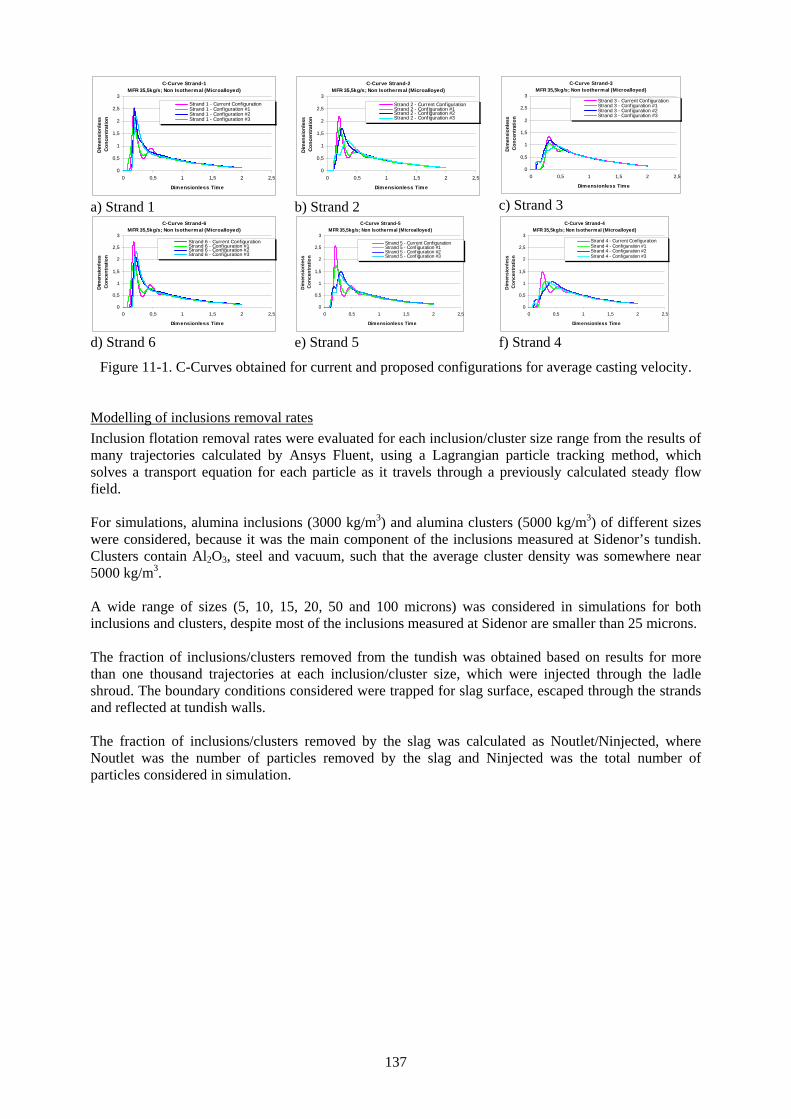
137
C-Curve Strand-1 MFR 35,5kg/s; Non Isothermal (Microalloyed)
0
0,5
1
1,5
2
2,5
3
0 0,5 1 1,5 2 2,5
Dimensionless Time
Dim
ensi
onle
ss
Con
cent
ratio
nStrand 1 - Current ConfigurationStrand 1 - Conf iguration #1Strand 1 - Conf iguration #2Strand 1 - Conf iguration #3
a) Strand 1
C-Curve Strand-2 MFR 35,5kg/s; Non Isothermal (Microalloyed)
0
0,5
1
1,5
2
2,5
3
0 0,5 1 1,5 2 2,5
Dimensionless Time
Dim
ensi
onle
ss
Con
cent
ratio
n
Strand 2 - Current ConfigurationStrand 2 - Conf iguration #1Strand 2 - Conf iguration #2Strand 2 - Conf iguration #3
b) Strand 2
C-Curve Strand-3 MFR 35,5kg/s; Non Isothermal (Microalloyed)
0
0,5
1
1,5
2
2,5
3
0 0,5 1 1,5 2 2,5
Dimensionless Time
Dim
ensi
onle
ss
Con
cent
ratio
n
Strand 3 - Current ConfigurationStrand 3 - Configuration #1Strand 3 - Configuration #2Strand 3 - Configuration #3
c) Strand 3
C-Curve Strand-6 MFR 35,5kg/s; Non Isothermal (Microalloyed)
0
0,5
1
1,5
2
2,5
3
0 0,5 1 1,5 2 2,5
Dimensionless Time
Dim
ensi
onle
ss
Con
cent
ratio
n
Strand 6 - Current ConfigurationStrand 6 - Configuration #1Strand 6 - Configuration #2Strand 6 - Configuration #3
d) Strand 6
C-Curve Strand-5 MFR 35,5kg/s; Non Isothermal (Microalloyed)
0
0,5
1
1,5
2
2,5
3
0 0,5 1 1,5 2 2,5
Dimensionless Time
Dim
ensi
onle
ss
Con
cent
ratio
n
Strand 5 - Current ConfigurationStrand 5 - Conf iguration #1Strand 5 - Conf iguration #2Strand 5 - Conf iguration #3
e) Strand 5
C-Curve Strand-4 MFR 35,5kg/s; Non Isothermal (Microalloyed)
0
0,5
1
1,5
2
2,5
3
0 0,5 1 1,5 2 2,5
Dimensionless Time
Dim
ensi
onle
ss
Con
cent
ratio
n
Strand 4 - Current Conf igurationStrand 4 - Configuration #1Strand 4 - Configuration #2Strand 4 - Configuration #3
f) Strand 4
Figure 11-1. C-Curves obtained for current and proposed configurations for average casting velocity. Modelling of inclusions removal rates Inclusion flotation removal rates were evaluated for each inclusion/cluster size range from the results of many trajectories calculated by Ansys Fluent, using a Lagrangian particle tracking method, which solves a transport equation for each particle as it travels through a previously calculated steady flow field. For simulations, alumina inclusions (3000 kg/m3) and alumina clusters (5000 kg/m3) of different sizes were considered, because it was the main component of the inclusions measured at Sidenor’s tundish. Clusters contain Al2O3, steel and vacuum, such that the average cluster density was somewhere near 5000 kg/m3. A wide range of sizes (5, 10, 15, 20, 50 and 100 microns) was considered in simulations for both inclusions and clusters, despite most of the inclusions measured at Sidenor are smaller than 25 microns. The fraction of inclusions/clusters removed from the tundish was obtained based on results for more than one thousand trajectories at each inclusion/cluster size, which were injected through the ladle shroud. The boundary conditions considered were trapped for slag surface, escaped through the strands and reflected at tundish walls. The fraction of inclusions/clusters removed by the slag was calculated as Noutlet/Ninjected, where Noutlet was the number of particles removed by the slag and Ninjected was the total number of particles considered in simulation.
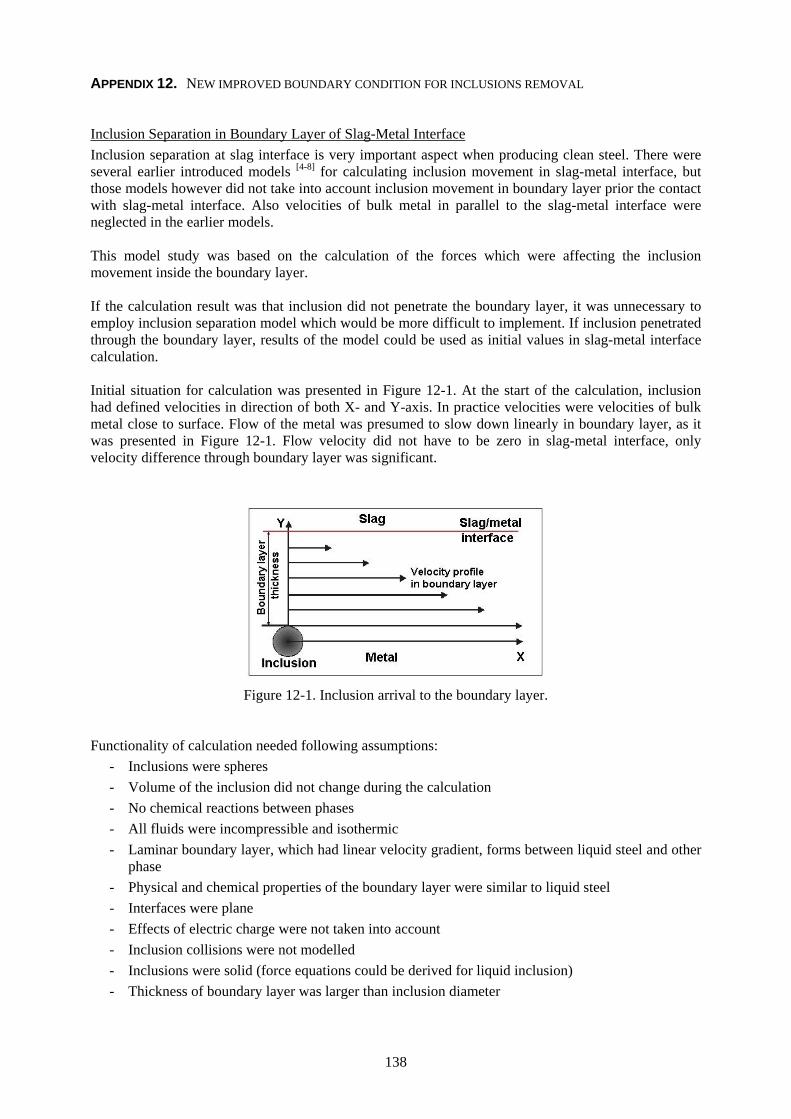
138
APPENDIX 12. NEW IMPROVED BOUNDARY CONDITION FOR INCLUSIONS REMOVAL Inclusion Separation in Boundary Layer of Slag-Metal Interface Inclusion separation at slag interface is very important aspect when producing clean steel. There were several earlier introduced models [4-8] for calculating inclusion movement in slag-metal interface, but those models however did not take into account inclusion movement in boundary layer prior the contact with slag-metal interface. Also velocities of bulk metal in parallel to the slag-metal interface were neglected in the earlier models. This model study was based on the calculation of the forces which were affecting the inclusion movement inside the boundary layer. If the calculation result was that inclusion did not penetrate the boundary layer, it was unnecessary to employ inclusion separation model which would be more difficult to implement. If inclusion penetrated through the boundary layer, results of the model could be used as initial values in slag-metal interface calculation. Initial situation for calculation was presented in Figure 12-1. At the start of the calculation, inclusion had defined velocities in direction of both X- and Y-axis. In practice velocities were velocities of bulk metal close to surface. Flow of the metal was presumed to slow down linearly in boundary layer, as it was presented in Figure 12-1. Flow velocity did not have to be zero in slag-metal interface, only velocity difference through boundary layer was significant.
Figure 12-1. Inclusion arrival to the boundary layer.
Functionality of calculation needed following assumptions:
- Inclusions were spheres - Volume of the inclusion did not change during the calculation - No chemical reactions between phases - All fluids were incompressible and isothermic - Laminar boundary layer, which had linear velocity gradient, forms between liquid steel and other
phase - Physical and chemical properties of the boundary layer were similar to liquid steel - Interfaces were plane - Effects of electric charge were not taken into account - Inclusion collisions were not modelled - Inclusions were solid (force equations could be derived for liquid inclusion) - Thickness of boundary layer was larger than inclusion diameter
139
Forces Affecting Inclusion in Boundary Layer The forces affecting the solid spherical inclusion when it moves in boundary layer were studied. Presented forces are generally accepted and already used in several particle movement models. Buoyancy Force In liquid steel inclusion particles have without exception lower density than the bulk steel, so they have a tendency to ascend in bulk. Direction of this force is towards the positive Y-axis and it is presented mathematically in Equation 12-1 [9, 10]:
)(34 3
IMIb gRF ρρπ −= Eq. 12-1
in which IR is radius of inclusion (m) g is gravitational acceleration (m/s2) Mρ is density of metal (kg/m3) Iρ is density of inclusion (kg/m3) Inertia Mass Force – Virtual Mass Inertia mass force, which is also known as virtual mass, is caused by inertia of the fluid, when it is accelerated with the inclusion. Volume of the virtual mass is half of the volume of the inclusion which is in accelerated motion. Direction of the inertia mass force is normal to direction of propagation. In practice this force is preventing the movement of the inclusion. Inertia mass force for the spherical inclusion in the boundary layer is presented in Equation 12-2 [10, 11]:
2
23
32
dtZdRF MIf ρπ= Eq. 12-2
in which IR is radius of the inclusion (m) Mρ is density of metal (kg/m3) Z is location of the inclusion (m) t is time (s) Friction Force As object moves in viscous fluid, friction force is acting against the progression. Direction of the friction force is opposite to the objects velocity vector. Friction force is present only in the cases when velocity difference between the objects and bulk fluid exits. Friction force applied to inclusion movement in boundary layer is presented in Equation 12-3 [9, 10, 12]:
dtdZRF MId µπ6= Eq. 12-3
in which IR is radius of the inclusion (m) Mµ is viscosity of metal (Pa·s) Z is location (m) t is time (s) Lift Force When inclusion moves in boundary layer with velocity gradient, forces affecting to its top and bottom surfaces are unequal. Difference in these forces causes force which is normal to the velocity gradient presented in Equation 12-4 [13]. Direction of the force is towards smaller velocity difference of the inclusion and bulk flow. This equation is partly empirical and some additional assumptions are needed to be known when using it [14, 15, 16]:
140
( ) 21246.6 MIrML GRvF νρ= Eq. 12-4
in which Mρ is density of metal (kg/m3) rv is relative velocity of inclusion (m/s) IR is radius of inclusion (m) Mν is kinematic viscosity of metal (m2/s) G is velocity gradient in boundary layer Momentum Equations for Inclusion Movement in Boundary Layer Momentum Equation in Direction of Y-axis Forces to include in momentum equation in Y-axis direction are buoyancy, friction, inertia mass and lift force. There forces cause the changes in inclusion movement in boundary layer and therefore represent behaviour of inclusion inside the boundary layer. Equation 12-5 is momentum equation in Y-axis direction:
LfdbII FFFFdt
YdR −−−=2
23
34 ρπ Eq. 12-5
Equation 12-6 shows how momentum equation looks like, when previously presented forces (Eq. 12-1 to 12-4) are added to Equation 12-5. This equation is needed to be solved numerically and it will result movement of the inclusion in Y-direction as function of time:
( ) 046.6
326)(
34
34
212
2
233
2
23
=+
++−−
MIrM
MIMIIMIII
GRvdt
YdRdtdYRgR
dtYdR
νρ
ρπµπρρπρπ Eq. 12-6
in which rv is function of dX/dt. Momentum Equation in Direction of X-axis In momentum equation in X-axis direction friction force and inertia mass force are needed to take into account. In practice also the share rate forces of the inclusion can influence other friction forces in X-direction, but their effects are neglected. When calculating the forces, relative velocity of the inclusion will be used as velocity in X-direction and effects of the inclusion spinning are neglected. In practice these assumptions do not introduce significant error in X-axis movement calculations. Momentum equation is shown in Equation 12-7, in which friction force is divided to two parts. Friction force is considered in this examination to be combination of friction of boundary layer flow (which moves inclusion) as well as friction resisting inclusion movement:
fdflowdII FFFdt
XdR −−= ,2
23
34 ρπ Eq. 12-7
When force equations are added to Equation 12-7, momentum equation in X-axis direction is available (Equation 12-8):
( ) 03266
34
2
23
2
23 =++−
dtXdR
dtdXRvelocityR
dtXdR MIMIMIII ρπµπµπρπ Eq. 12-8
where velocity is function of Y(t).
141
Implementation of Calculation Equations shown in previous chapter were complicated and movement in Y-axis depended on movement in X-axis and vice versa. Because of this equations could not be solve analytically but numerically solution was necessary. With numerical solution aim was to solve the most important part, which was movement of the inclusion in Y-axis direction as function of time. This way it was possible to find out if the inclusion would move through the boundary layer and how long time it would take. In this study location of the inclusion in Y-axis as function of time was calculated numerically using ODE (ordinary differential equation) calculations. This routine (named “calculateReflection”) was based on explicit Runge-Kutta (2,3) pair of Bogacki and Shampine method. Initial values required by “calculateReflection”-routine were location and velocities of the inclusion in X- and Y-direction as well as time step size of the calculation. Inclusion location and velocities in X- and Y-direction were obtained directly from CFD-model. Other needed values in the case of solid inclusion were gravitational constant, radius of the inclusion, densities of inclusion and metal, viscosity of metal, bulk metal velocity in parallel to the surface at the start of boundary layer and at the slag interface and boundary layer thickness. Modelling of Removal of Inclusions in the Tundish Using New Boundary Condition Routine The “calculateReflection” routine was integrated in Ansys Fluent model for the cases of alumina inclusions of 15 and 100 microns of diameter, and it was observed that none of the inclusions which reached the slag boundary layer did bounce back. So, it was interesting to know in which cases the inclusions would bounce. The first trial was to implement a C program with the same routine, keeping the steel and inclusion properties and changing the velocities. There were a lot of cases where the inclusions bounced (with high velocities), so it was necessary to adjust the input velocities. According to the data obtained from Ansys Fluent for isothermal case with a working level of 800mm:
- The magnitude of steel velocities on slag-steel interface was ranging between 0.00038 and 0.08 m/s.
- The magnitude of inclusions’ velocities in the tangential plane (i.e. slag-steel interface) was very similar (from 0.00037 to 0.08).
- The angle between the tangential velocity of the inclusions and the velocity of the layer oscillated from 0º to 27º, i.e. both of them went in the similar direction.
- The magnitude of normal velocity of the inclusions went from 0.00185 to 0.05561. The properties data were fixed:
- Inclusion’s radius: 0.00005 m (50 microns) - Inclusion’s density: 2900 kg/m3 - Steel density: 7000 kg/m3 - Steed viscosity 0.0067 Pa·s - Velocity of the steel in X: (iVrpkPX) = 0, in order to have a fix direction of movement.
The rest of the values were combined as follows:
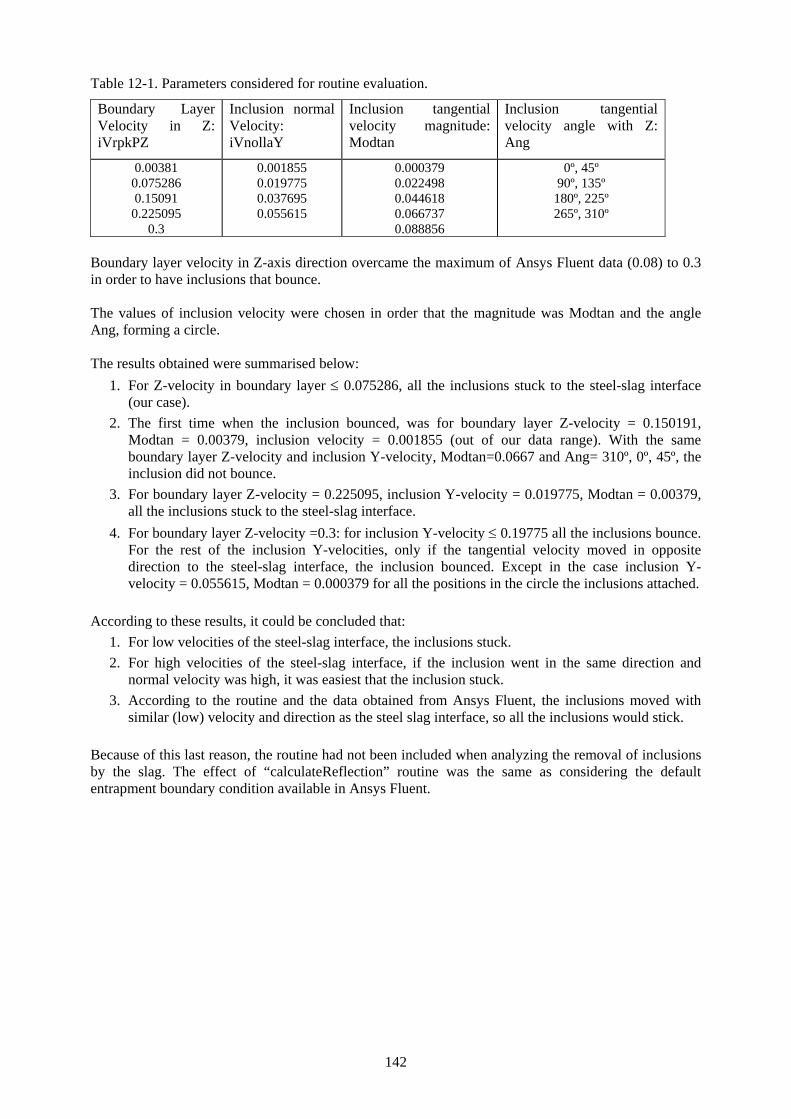
142
Table 12-1. Parameters considered for routine evaluation.
Boundary Layer Velocity in Z: iVrpkPZ
Inclusion normal Velocity: iVnollaY
Inclusion tangential velocity magnitude: Modtan
Inclusion tangential velocity angle with Z: Ang
0.00381 0.075286 0.15091 0.225095
0.3
0.001855 0.019775 0.037695 0.055615
0.000379 0.022498 0.044618 0.066737 0.088856
0º, 45º 90º, 135º
180º, 225º 265º, 310º
Boundary layer velocity in Z-axis direction overcame the maximum of Ansys Fluent data (0.08) to 0.3 in order to have inclusions that bounce. The values of inclusion velocity were chosen in order that the magnitude was Modtan and the angle Ang, forming a circle. The results obtained were summarised below:
1. For Z-velocity in boundary layer ≤ 0.075286, all the inclusions stuck to the steel-slag interface (our case).
2. The first time when the inclusion bounced, was for boundary layer Z-velocity = 0.150191, Modtan = 0.00379, inclusion velocity = 0.001855 (out of our data range). With the same boundary layer Z-velocity and inclusion Y-velocity, Modtan=0.0667 and Ang= 310º, 0º, 45º, the inclusion did not bounce.
3. For boundary layer Z-velocity = 0.225095, inclusion Y-velocity = 0.019775, Modtan = 0.00379, all the inclusions stuck to the steel-slag interface.
4. For boundary layer Z-velocity =0.3: for inclusion Y-velocity ≤ 0.19775 all the inclusions bounce. For the rest of the inclusion Y-velocities, only if the tangential velocity moved in opposite direction to the steel-slag interface, the inclusion bounced. Except in the case inclusion Y-velocity = 0.055615, Modtan = 0.000379 for all the positions in the circle the inclusions attached.
According to these results, it could be concluded that:
1. For low velocities of the steel-slag interface, the inclusions stuck. 2. For high velocities of the steel-slag interface, if the inclusion went in the same direction and
normal velocity was high, it was easiest that the inclusion stuck. 3. According to the routine and the data obtained from Ansys Fluent, the inclusions moved with
similar (low) velocity and direction as the steel slag interface, so all the inclusions would stick. Because of this last reason, the routine had not been included when analyzing the removal of inclusions by the slag. The effect of “calculateReflection” routine was the same as considering the default entrapment boundary condition available in Ansys Fluent.
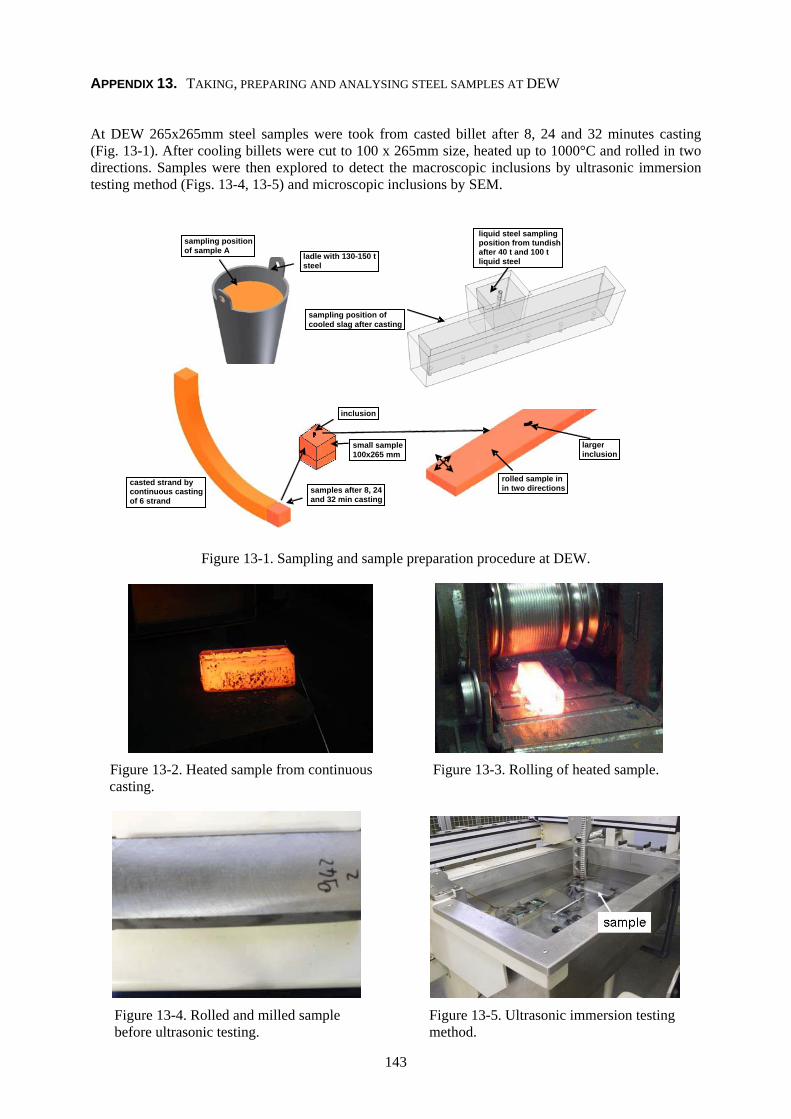
143
ladle with 130-150 t steel
inclusion
samples after 8, 24 and 32 min casting
small sample 100x265 mm
larger inclusion
rolled sample in in two directions
casted strand by continuous casting of 6 strand
sampling position of sample A
sampling position of cooled slag after casting
liquid steel sampling position from tundish
after 40 t and 100 t liquid steel
APPENDIX 13. TAKING, PREPARING AND ANALYSING STEEL SAMPLES AT DEW At DEW 265x265mm steel samples were took from casted billet after 8, 24 and 32 minutes casting (Fig. 13-1). After cooling billets were cut to 100 x 265mm size, heated up to 1000°C and rolled in two directions. Samples were then explored to detect the macroscopic inclusions by ultrasonic immersion testing method (Figs. 13-4, 13-5) and microscopic inclusions by SEM.
Figure 13-1. Sampling and sample preparation procedure at DEW.
Figure 13-2. Heated sample from continuous
casting. Figure 13-3. Rolling of heated sample.
Figure 13-4. Rolled and milled sample before ultrasonic testing.
Figure 13-5. Ultrasonic immersion testing method.
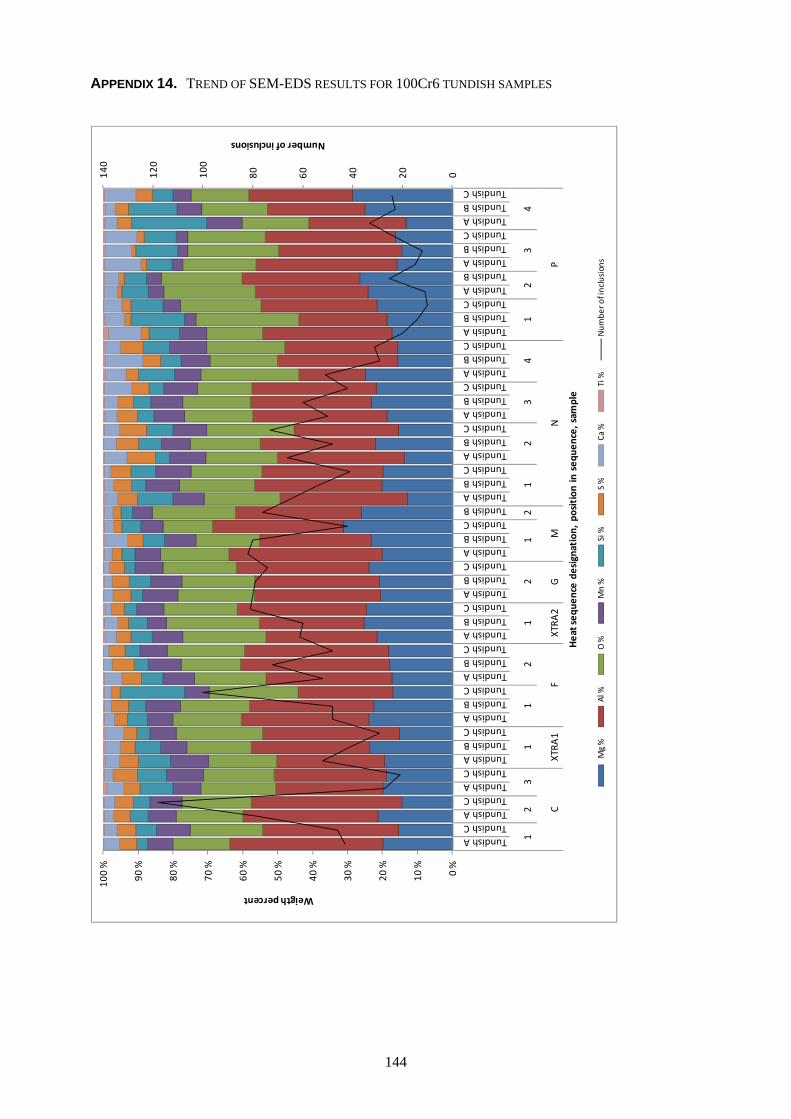
144
APPENDIX 14. TREND OF SEM-EDS RESULTS FOR 100Cr6 TUNDISH SAMPLES
020406080100
120
140
0 %
10 %
20 %
30 %
40 %
50 %
60 %
70 %
80 %
90 %
100 %
Tundish ATundish CTundish ATundish CTundish ATundish CTundish ATundish BTundish CTundish ATundish BTundish CTundish ATundish BTundish CTundish ATundish BTundish CTundish ATundish BTundish CTundish ATundish BTundish CTundish BTundish ATundish BTundish CTundish ATundish BTundish CTundish ATundish BTundish CTundish ATundish BTundish CTundish ATundish BTundish CTundish ATundish BTundish ATundish BTundish CTundish ATundish BTundish C
12
31
12
12
12
12
34
12
34
CXTRA
1F
XTRA
2G
MN
P
Number of inclusions
Weigth percent
Heat seq
uence de
signation, position in seq
uence, sam
ple
Mg %
Al %
O %
Mn %
Si %
S %
Ca %
Ti %
Num
ber o
f inclusions

145
APPENDIX 15. TREND OF SEM-EDS RESULTS FOR SAE1050 TUNDISH SAMPLES
0102030405060708090
0 %
10 %
20 %
30 %
40 %
50 %
60 %
70 %
80 %
90 %
100 %
Tundish A
Tundish C
Tundish A
Tundish CTundish A
Tundish C
Tundish ATundish C
Tundish A
Tundish BTundish C
Tundish A
Tundish BTundish C
Tundish A
Tundish BTundish C
Tundish A
Tundish BTundish C
Tundish A
Tundish B
Tundish CTundish A
Tundish B
Tundish CTundish A
Tundish B
Tundish CTundish A
Tundish B
Tundish CTundish A
Tundish B
Tundish CTundish A
Tundish B
Tundish CTundish A
Tundish B
Tundish C
Tundish ATundish B
Tundish C
12
12
12
12
12
34
21
23
AD
EH
KL
O
Number of Inclusions
Weigth percent
Heat seq
uence de
signation, position in seq
uence, sam
ple
Mg %
Al %
O %
Mn %
Si %
S %
Ca %
Ti %
Cr %
Num
ber o
f inclusions

146
APPENDIX 16. IUS CLEANLINESS INDEX COMPARED TO NUMBER OF MICRO-INCLUSIONS, STEEL GRADE 100Cr6
181 10
828133
8 110 84
27729
1 21225
1347355
358 22
9346
16732
7 268 18
3
84
111
146 60
177
33
81
110
03
112
52
202040608010
0
120
140
050100
150
200
250
300
350
400
Tundish ATundish CTundish ATundish CTundish ATundish CTundish ATundish BTundish CTundish ATundish BTundish CTundish ATundish BTundish CTundish ATundish BTundish CTundish ATundish BTundish CTundish ATundish BTundish CTundish BTundish ATundish BTundish CTundish ATundish BTundish CTundish ATundish BTundish CTundish ATundish BTundish CTundish ATundish BTundish CTundish ATundish BTundish ATundish BTundish CTundish ATundish BTundish C
12
31
12
12
12
12
34
12
34
CXTRA
1F
XTRA
2G
MN
P
Number of microinclusions
IUS index
Heat seq
uence de
signation, position in seq
uence, sam
ple
IUS inde
xNum
ber of inclusions (SEM
‐EDS)

147
APPENDIX 17. IUS CLEANLINESS INDEX COMPARED TO NUMBER OF MICRO-INCLUSION, STEEL GRADE SAE1050
03
00
57
108
3931
151
3644
4458
506 27
4 14126
4630639
29231
2 242 225
10217
8
3823
2336
15624
3 144 137
17733
4 17535
3
0102030405060708090
0
100
200
300
400
500
600
700
Tundish ATundish C
Tundish ATundish C
Tundish ATundish C
Tundish ATundish CTundish A
Tundish BTundish C
Tundish ATundish B
Tundish CTundish ATundish B
Tundish CTundish A
Tundish BTundish C
Tundish ATundish BTundish C
Tundish ATundish B
Tundish CTundish A
Tundish BTundish C
Tundish ATundish BTundish C
Tundish ATundish B
Tundish CTundish A
Tundish BTundish CTundish A
Tundish BTundish C
Tundish ATundish B
Tundish C
12
12
12
12
12
34
21
23
AD
EH
KL
O
Number of microinclusions
IUS index
Heat seq
uence de
signation, position in seq
uence, sam
ple
IUS inde
x Num
ber of inclusions

148
APPENDIX 18. GRAPH OF 100Cr6 TUNDISH TOP SLAG XRF-ANALYSES
0 %
10 %
20 %
30 %
40 %
50 %
60 %
70 %
80 %
90 %
100 %
Start powder analysisCover powder analysisTrial powder analysis
Tundish BTundish CTundish BTundish CTundish BTundish CTundish BTundish CTundish BTundish CTundish BTundish CTundish ATundish BTundish C
Tundish B midTundish C mid
Tundish ATundish BTundish C
Tundish A midTundish B midTundish C mid
Tundish ATundish BTundish C
Tundish A midTundish B midTundish C mid
Tundish ATundish BTundish C
Tundish A midTundish B midTundish C mid
Tundish BTundish BTundish ATundish BTundish CTundish ATundish BTundish CTundish ATundish BTundish CTundish ATundish BTundish CTundish ATundish BTundish CTundish ATundish BTundish ATundish BTundish CTundish ATundish BTundish C
‐1
23
12
31
12
11
21
23
41
23
4
‐B
CXTRA
1F
XTRA
2M
NP
Weigth percent
Heat seq
uence de
signation, position in seq
uence, sam
ple
CaO
Al2O3
MgO
SiO2
Mn
FeNa2O
K2O

149
APPENDIX 19. GRAPH OF SAE 1050 TUNDISH TOP SLAG XRF-ANALYSES
0 %
10 %
20 %
30 %
40 %
50 %
60 %
70 %
80 %
90 %
100 %
Tundish A
Tundish C
Tundish A
Tundish C
Tundish A
Tundish C
Tundish A
Tundish C
Tundish A
Tundish B
Tundish C
Tundish A
Tundish B
Tundish C
Tundish A
Tundish B
Tundish C
Tundish A
Tundish B
Tundish C
Tundish A
Tundish B
Tundish C
Tundish A
Tundish B
Tundish C
Tundish A
Tundish B
Tundish C
Tundish A
Tundish B
Tundish C
Tundish A
Tundish B
Tundish C
Tundish A
Tundish B
Tundish C
Tundish A
Tundish B
Tundish C
Tundish A
Tundish B
Tundish C
12
12
12
12
12
34
21
23
AD
EH
KL
O
Weigth percent
Heat seq
uence de
signation, position in seq
uence, sam
ple
CaO
Al2O3
MgO
SiO2
Mn
FeNa2O
K2O

150
APPENDIX 20. CLEANNESS RESULTS FOR STANDARD CASTS AT TATA STEEL
Steel Cleanness
0
1
2
3
4
5
6
7
8
9
10
0 100 200 300 400 500 600 700 800 900Tons of steel
Incl
usio
n in
dex
Al2O3 + SiO2 CaO + Al2O3 Al2O3 + MgO
Steel Cleanness
0
1
2
3
4
5
6
7
8
9
10
0 100 200 300 400 500 600 700 800 900Tons of steel
Incl
usio
n in
dex
Al2O3 + SiO2 CaO + Al2O3 Al2O3 + MgO
Steel Cleanness
0
1
2
3
4
5
6
7
8
9
10
0 100 200 300 400 500 600 700 800 900Tons of steel
Incl
usio
n in
dex
Al2O3 + SiO2 CaO + Al2O3 Al2O3 + MgO
Steel Cleanness
0
1
2
3
4
5
6
7
8
9
10
0 100 200 300 400 500 600 700 800 900Tons of steel
Incl
usio
n in
dex
Al2O3 + SiO2 CaO + Al2O3 Al2O3 + MgO
Figure 20-1. Slag sampling across the tundish.
Tundish Slag Composition
0%
20%
40%
60%
80%
100%
1 2 3 4 5 6 7 8
Sample
Perc
enta
ge %
MgO
Al2O3MnO
SiO2CaO
Tundish Slag Composition
0%
10%
20%
30%
40%
50%
60%
70%
80%
90%
100%
1 2 3 4 5 6 7 8 9
Sample
Perc
enta
ge %
MgO
Al2O3MnO
SiO2CaO
Figure 20-2. Slag samples from the centre of the tundish.
Figure 20-3. Slag samples from the end of the tundish.

European Commission EUR 25875 — Active tundish metallurgy (AcTuM) Luxembourg: Publications Office of the European Union 2013 — 150 pp. — 21 × 29.7 cm ISBN 978-92-79-29039-8doi:10.2777/62336


EUROPEAN COMMISSION Directorate-General for Research and Innovation Directorate G — Industrial Technologies Unit G.5 — Research Fund for Coal and Steel
E-mail: [email protected] [email protected]
Contact: RFCS Publications
European Commission B-1049 Brussels
HOW TO OBTAIN EU PUBLICATIONS Free publications: • via EU Bookshop (http://bookshop.europa.eu);
• at the European Union’s representations or delegations. You can obtain their contact details on the Internet (http://ec.europa.eu) or by sending a fax to +352 2929-42758.
Priced publications: • via EU Bookshop (http://bookshop.europa.eu).
Priced subscriptions (e.g. annual series of the Official Journal of the European Union and reports of cases before the Court of Justice of the European Union): • via one of the sales agents of the Publications Office of the European Union
(http://publications.europa.eu/others/agents/index_en.htm).

Active tundishmetallurgy
(AcTuM)
doi:10.2777/62336
Active tundish metallurgy (AcTuM
)EU
EUR 25875
KI-NA-25875-EN
-N
The Active Tundish Metallurgy project aimed at improved, better guaranteed steel cleanness by applying tailored tundish slag with high capacity to efficiently absorb macro- and micro-inclusions from different steels.
Thermodynamic calculations showed that industrial partners’ slags used in their standard practice were either solid or have only limited capability to dissolve inclusions from steel at tundich temperatures.
Fundamental studies on factors influencing inclusion removal and inclusion cleanliness in tundish as well as thermodynamic calculations showed that more basic slag would lead to a more effective tundish slag having higher capacity to absorb inclusions compared to standard practice. Based on these results better slags and practices were proposed for industrial trials.
Experimental tests with the new proposed tundish powders showed improvement in steel cleanness compared to standard practice. At OvakoImatra due to good results with the usability of the new powder the old tundish powder practice was abandoned, and a new basic powder was adopted into regular use. At Sidenor new tundish cover is used for heats with special cleanness requirements, however length would be limited to 3 heats due to the excessive erosion of isostatic refractory pieces and slag cover hardening. At DEW good results with the new suggested cover powders will be verified in large scale production trail and based on these results their implementation to standard tundish practice will be evaluated. At Tata Steel two new powders have been tested with good results, but no long-term proof of cleanness improvements has been found and hence economic benefits cannot be shown.
Studies and reports
Research and Innovation EUR 25875 EN