Embed Size (px)
Citation preview

THIS REPORT CONTAINS ASSESSMENTS OF COMMODITY AND TRADE ISSUES MADE BY
USDA STAFF AND NOT NECESSARILY STATEMENTS OF OFFICIAL U.S. GOVERNMENT
POLICY
Date:
GAIN Report Number:
Approved By:
Prepared By:
Report Highlights:
The EU28’s grain harvest in MY2018/19 is forecast to be the sixth to surpass 300 MMT in a decade. A
slight reduction in area is forecast to be more than offset by a second successive year of improved
yields, meaning a small increase in production. After a mild winter and cold snap in February, the crop
is reported to be in a good condition. Wet weather has caused some delays to spring planting but it is
now well under way. EU28 wheat exports have faced stiff competition in MY2017/18. They are
currently forecast to improve in MY2018/19, but not to pre-MY2016/17 levels.
Steve Knight
Stan Phillips
2018
Grain and Feed Annual
EU-28
4/13/2018
Required Report - public distribution

Introduction
This report presents the first outlook for grain and feed, and Production, Supply and Demand (PS&D)
forecasts for the Marketing Year (MY) 2018/19. Unless stated otherwise, data in this report is based on
the views of Foreign Agricultural Service analysts in the EU28 and is not official USDA data.
This report would not have been possible without the valuable expert contributions from the following
Foreign Service analysts:
Xavier Audran, FAS/Paris covering France
Ornella Bettini, FAS/Rome covering Italy
Mila Boshnakova, FAS/Sofia covering Bulgaria
Monica Dobrescu, FAS/Bucharest covering Romania
Dimosthenis Faniadis, FAS/Rome covering Greece
Bob Flach, FAS/The Hague covering the Netherlands, Finland, Denmark, and Sweden
Gellert Golya, FAS/Budapest covering Hungary
Marta Guerrero, FAS/Madrid covering Spain and Portugal
Mira Kobuszynska, FAS/Warsaw covering Poland, Lithuania, Latvia, and Estonia
Steve Knight, FAS/London covering the United Kingdom and Ireland
Roswitha Krautgartner, FAS/Vienna covering Austria and Slovenia
Sabine Lieberz, FAS/Berlin covering Germany
Jana Mikulasova, FAS/Prague covering the Czech Republic and Slovakia
Andreja Misir, FAS/Zagreb covering Croatia
Yvan Polet, FAS/USEU/Brussels covering Belgium and Luxembourg
Barrie Williams, FAS/USEU/Brussels covering policy
HA = Hectares
MT = Metric Tonne
MY = Marketing Year. Post and USDA official data both follow the EU28 local marketing year of July
to June except for corn which follows an October to September calendar.
TY = July to June for wheat and October to September for coarse grains

Table of Contents
Executive Summary ........................................................................................................................ 4
Harvest outlook ............................................................................................................................... 5
Crop specific ................................................................................................................................... 7
Wheat .......................................................................................................................................... 7
Corn ........................................................................................................................................... 12
Barley ........................................................................................................................................ 14
Rye ............................................................................................................................................ 16
Sorghum .................................................................................................................................... 17
Oats............................................................................................................................................ 18
Mixed Grain .............................................................................................................................. 19
Rice............................................................................................................................................ 20
Policy ............................................................................................................................................ 22
EU Import Policy ...................................................................................................................... 22
Reductions for Maize (Corn) and Sorghum – “Abatimento” ............................................... 24
EU Export Policy ...................................................................................................................... 25
Intervention Mechanism ............................................................................................................ 26
Special Support Measures ......................................................................................................... 26
Promotion of Sorghum .............................................................................................................. 26
Biotechnology ........................................................................................................................... 27
Authorization of GE 1507 corn for cultivation ..................................................................... 27
Member States allowed to “opt out” of cultivating approved biotech crops ........................ 27
Cultivation of MON 810 corn ............................................................................................... 27
Rice............................................................................................................................................ 28
Import and export licenses .................................................................................................... 28
Tariff Rate Quotas ................................................................................................................. 28
WTO Quotas ......................................................................................................................... 29
Investigation into rice imports from Cambodia and Myanmar ............................................. 29
CAP Reform .............................................................................................................................. 30
Pesticides ................................................................................................................................... 30

Executive Summary
The MY2018/19 EU28 grain crop is currently forecast to reach 305.7 MMT, just over 1 MMT up on a
year earlier. If realized, this will be the sixth EU28 crop to surpass 300 MMT in a decade but over 21
MMT shy of the record grain crop of MY2014/15. Forecast planted area in MY2018/19 is little changed
on MY2017/18, what little decline there is being in wheat in France and Germany and, to a lesser extent,
Spain. A wet fall and mild winter was cause for some concern but the late February cold snap has been
generally positive for the EU28 crop outlook, both in terms of size and quality. The recent cold and wet
weather has delayed the start to spring plantings in a number of Member States. If the producers are
unable to catch up or there are further delays, this may lead to an increased corn area at the expense of
other crops.
MY2017/18 can largely be considered a return to normal in terms of production after the significant
decline in the wheat crop in France, the EU’s largest exporter of grain, in MY2016/17. However, the
same cannot be said for exports. The EU28 has faced significant competition on export markets, notably
from Russia and Black Seas Origins (BSO), as well as currency pressure. Indeed, EU28 wheat exports
are currently expected to be lower year-on-year as well as below previous expectations. This would be
the lowest wheat export volume for five years. Increased exports of both barley and corn in MY2017/18
limit the expected year-on-year fall in overall EU28 grain exports to just over 1.5 MMT.
The increased availability of wheat on the domestic market has seen its usage as feed increase while
poor crops in Spain have reduced the total amount of barley fed and increased that of corn, both
domestically produced and imported. Overall, this means a year-on-year increase of over 2 MMT in
total EU28 feed grain use in MY2017/18 is now expected. Total Food, Seed & Industrial (FSI) usage in
MY2017/18 is also expected up, both year-on-year and as compared to previously forecast. The
increase is a combination of increased food use of wheat in France and increased industrial use of corn,
mainly in the Austrian, Hungarian, Spanish and UK biofuels sectors. Overall, total consumption is
expected to rise around 3.5 MMT but the year-on-year production increase and decline in exports means
total EU28 grain ending stocks in MY2017/18 are still forecast to rise, albeit not as significantly as
previously suggested.
For MY2018/19, total domestic consumption is forecast to rise just 500,000 MT. Total grain feed use is
forecast unchanged, masking a switch back to barley from other grains. In fact, the entire rise is forecast
to be accounted for by increased industrial use of corn in Austria, Hungary and, to a lesser extent, Spain.
The forecast rise in production but measured increase in exports, mainly wheat, means stocks are once
again forecast to decline. However, as was demonstrated in MY2016/17, much will ultimately depend
on the size and quality of the EU28 crop. Other factors at play include the export situation in Ukraine,
both a key supplier to the EU28 market as well as competitor on third country export markets; in Russia;
and the pricing of the EU28 crop versus Black Sea Origin grains.

Harvest outlook
A wet fall hampered plantings and a mild winter increased concerns for plant susceptibility to pests and
disease. It also increased the focus on the likely impact of the late February cold snap which was felt
across much of the EU28 and, to a lesser extent, a second spell of colder weather in mid-March. In
many instances, the cold weather was welcomed and the sentiment for the MY2018/19 harvest has
improved, both in terms of size and quality. While there were some country-specific challenges at
planting of the winter crops, the general consensus is that the crop was given a good start. While the
winter was mild, where it was needed snow cover was reported to be sufficient to protect the crop. The
recent cold and wet weather has delayed the start to spring plantings in a number of Member States. In
combination with some concerns regarding seed availability in the likes of Germany, this may affect the
spring crop balance.
Given the significance of the French grain crop for the overall EU28 balance, especially trade, the much
smaller and lower quality grain crop in France in MY2016/17 has increased attention on the
development of its MY2018/19 crop. This is despite MY2017/18 seeing a return to more typical yields
and quality. France experienced a dry fall, which was good for winter plantings, but then a very mild
and wet winter. While this was generally good for crop development, the root systems will be less
developed which could lead to susceptibility to any prolonged dry weather later in the season. The over
winter conditions were also good for pests and disease which has led to some concerns for damage to the
crop and a possible increase in spring plantings of other grains. The cold weather in late February and,
to a lesser extent, in mid-March has therefore been welcomed, especially as it is thought to have had
little impact on the quality of the crop. If concerns remain, it is that fields are wet, limiting access for
crop assessment and management. These same conditions have also caused some delays to spring
barley plantings which would normally be well under way by now. While France has a relatively large
window for getting this crop in the ground, producers are keen to proceed and, unless there is a
prolonged dry spell, could start to look to switch to later planted spring crops, such as corn. This all said
the mood is generally optimistic with no serious causes for alarm.
In contrast to France, Germany experienced a wet fall and this detrimentally affected plantings and early
management of the crop. It is expected to lead to increased planting of spring wheat, barley and oats.
While the late February weather was particularly cold in Germany, it was relatively short lived and a
good covering of snow is reported to have protected the crop in most of the country except parts of
Eastern Germany. Where winterkill has occurred, this will further increase spring plantings. Germany
does face similar challenges to France with regards wet fields and whether this will hamper the
aforementioned spring plantings. Should the fields continue to be too wet for planting or a shortage of
summer seed occurs, the corn area could benefit later in the year.

The UK crop is reported to be in good condition. The cold weather is not thought to have damaged the
winter crops. In fact, it has been good for pest control and soil moisture. The only real concern is that
recent wet weather has delayed the start of spring plantings.
Poland experienced some delays to its winter plantings but they ultimately proceeded well and the
winter dormancy rate was rated as the same as in MY2017/18. Like France, Poland experienced a mild
winter. Combined with wet soils, this created excellent conditions for crop development but the cold
weather in late February and mid-March was generally welcomed by producers. While there was some
reported damage where the snow cover was insufficient to protect the crop, particularly to winter barley,
overall it is expected to have been good for the crops, boding well for future development.
For Hungary, the winter crops are reported be in good condition, albeit the mild winter has increased
disease pressure and the overly wet weather affected crop development. Unlike other Member States,
temperatures in late February and into March, while cold, remained above average and have not
impacted the crop. If there are any real concerns, it is that wet fields are expected to reduce access for
crop management in the coming weeks.
Bulgaria’s crop is currently in excellent condition following a wet and mild winter. While the crop was
protected from the worst of the cold weather in February by snow, this has now melted. The crop is not
considered to have developed resilience to the cold weather, as it would have done in a more normal
winter, so is susceptible to future damage.
Romania experienced excellent planting conditions and the cold spell is unlikely to have had any
significant impact on winter crops due to snow cover.
Prior to the cold snap, the mild winter saw the crops in the Czech Republic in in good condition, with
sufficient moisture in the soils. However, limited snow cover, particularly in the north, means there is
some expectation of winterkill, albeit limited.
It is a similarly positive story in Italy where the crop was reported to be developing very well. February
brought snow and with it some uncertainty but the sentiment remains very positive, not least as snow
means moisture for the soils even if there are some isolated losses.
Spain and Portugal experienced a very dry fall which reduced the planted area. These conditions
continued through the winter meaning plants are somewhat behind in their development but have grown
extensive root systems. The cold weather elsewhere in the EU28 presented itself as rain in the Iberian
Peninsula and this has continued into March and bodes well for spring plantings and winter crop
development. With no concerns regarding water reserves, the outlook is positive as we approach the key
determining months for the Iberian Peninsula - April and May.

Austria reports good planting conditions, increased sowing of winter grains at the expense of spring
plantings, good moisture levels and timely snow cover. The latter protected the crop in February, the
cold weather also reducing pest and disease occurrence, but with the snow now melted it is considered
susceptible to any further cold weather. Overall though, the outlook is very positive in Austria. The
area planted to organic grain, currently around 17 percent of the crop, is still rising year-on-year.
Finland, Sweden and Denmark saw winter plantings delayed due to the late harvest in 2017. This is
expected to marginally lower wheat production and increase spring barley and oat production in
MY2018/19. If there are real concerns for the crop anywhere in the EU28, it is in the Baltics (Estonia,
Latvia and Lithuania). They also experienced a late harvest in 2017, delaying winter wheat plantings at
a time when the weather conditions were particularly unfavorable. With fields difficult to access due to
the wet conditions, the winter wheat acreage is diminished but is expected to be compensated by
increased spring wheat sowing. The cold weather was particularly harsh but it is too early to ascertain
winterkill on an already small crop. Like in some other Member States, the weather is expected to have
increased the plants’ resilience, reduced insect incidence and increased plant growth potential.
Looking forward to the corn crop specifically, the planted area is currently forecast unchanged. As has
been mentioned, however, much could depend on the progress of spring plantings of other crops. After
a delayed start, if they do not go well, this could lead to an increase in the area planted to corn,
especially in Germany. With three pesticides from the neonicotinoid family remaining prohibited across
the EU28, for the fifth year Romania requested, and was granted, European Commission approval to
allow farmers to use seeds treated with insecticides from the affected family of chemicals this year. It
should be noted that the ban on neonicotinoids also presents pest control problems, mainly in the form of
rootworm, for other Member States, particularly those in the south east. There is no viable technical
solution available in the EU28 at this time.
Crop specific
Wheat
Wheat 2016/2017 2017/2018 2018/2019 Market Begin Year Jul 2016 Jul 2017 Jul 2018
European Union USDA Official New Post USDA Official New Post USDA Official New Post
Area Harvested 27260 27225 26398 26275 0 25950
Beginning Stocks 15557 15557 10772 10786 0 12936
Production 145248 145350 151600 151550 0 151200
MY Imports 5286 5297 5500 5500 0 5250
TY Imports 5286 5297 5500 5500 0 5250
TY Imp. from U.S. 708 742 0 0 0 0
Total Supply 166091 166204 167872 167836 0 169386
MY Exports 27319 27418 24000 24000 0 26500
TY Exports 27319 27418 24000 24000 0 26500
Feed and Residual 56000 56000 58500 58500 0 58000
FSI Consumption 72000 72000 72400 72400 0 72500
Total Consumption 128000 128000 130900 130900 0 130500
Ending Stocks 10772 10786 12972 12936 0 12386
Total Distribution 166091 166204 167872 167836 0 169386
Yield 5.3282 5.3388 5.7429 5.7678 0 5.8266
(1000 HA) ,(1000 MT) ,(MT/HA)
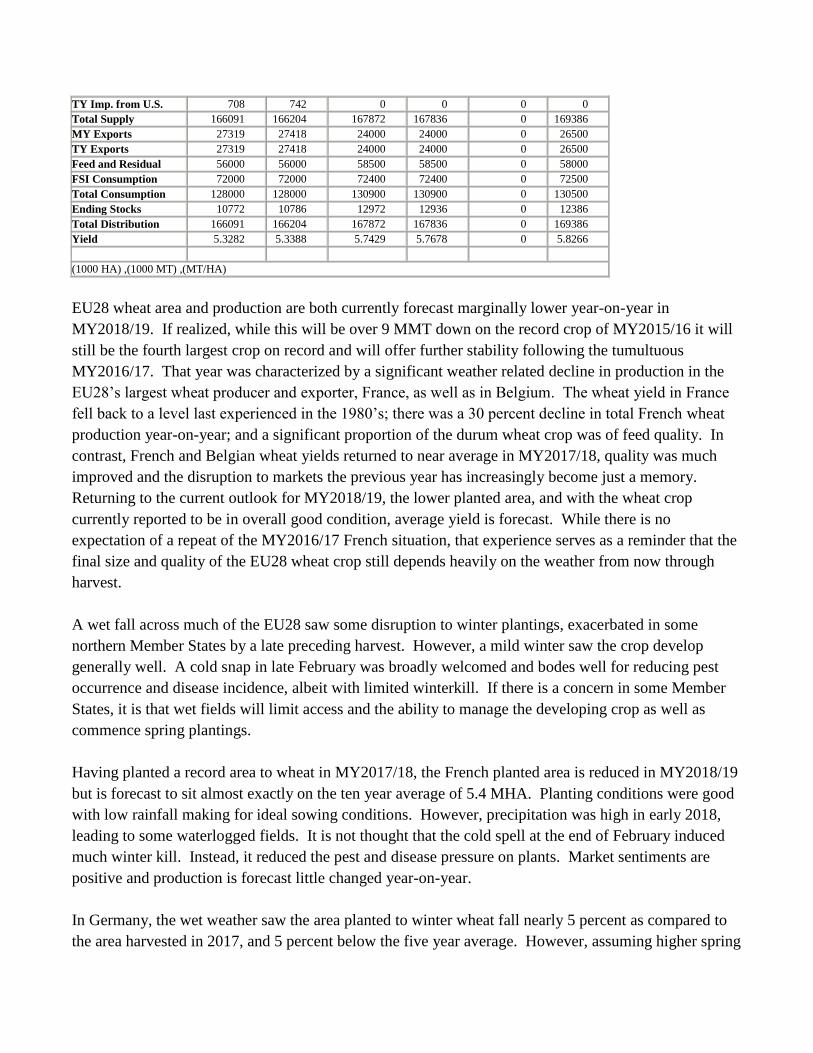
EU28 wheat area and production are both currently forecast marginally lower year-on-year in
MY2018/19. If realized, while this will be over 9 MMT down on the record crop of MY2015/16 it will
still be the fourth largest crop on record and will offer further stability following the tumultuous
MY2016/17. That year was characterized by a significant weather related decline in production in the
EU28’s largest wheat producer and exporter, France, as well as in Belgium. The wheat yield in France
fell back to a level last experienced in the 1980’s; there was a 30 percent decline in total French wheat
production year-on-year; and a significant proportion of the durum wheat crop was of feed quality. In
contrast, French and Belgian wheat yields returned to near average in MY2017/18, quality was much
improved and the disruption to markets the previous year has increasingly become just a memory.
Returning to the current outlook for MY2018/19, the lower planted area, and with the wheat crop
currently reported to be in overall good condition, average yield is forecast. While there is no
expectation of a repeat of the MY2016/17 French situation, that experience serves as a reminder that the
final size and quality of the EU28 wheat crop still depends heavily on the weather from now through
harvest.
A wet fall across much of the EU28 saw some disruption to winter plantings, exacerbated in some
northern Member States by a late preceding harvest. However, a mild winter saw the crop develop
generally well. A cold snap in late February was broadly welcomed and bodes well for reducing pest
occurrence and disease incidence, albeit with limited winterkill. If there is a concern in some Member
States, it is that wet fields will limit access and the ability to manage the developing crop as well as
commence spring plantings.
Having planted a record area to wheat in MY2017/18, the French planted area is reduced in MY2018/19
but is forecast to sit almost exactly on the ten year average of 5.4 MHA. Planting conditions were good
with low rainfall making for ideal sowing conditions. However, precipitation was high in early 2018,
leading to some waterlogged fields. It is not thought that the cold spell at the end of February induced
much winter kill. Instead, it reduced the pest and disease pressure on plants. Market sentiments are
positive and production is forecast little changed year-on-year.
In Germany, the wet weather saw the area planted to winter wheat fall nearly 5 percent as compared to
the area harvested in 2017, and 5 percent below the five year average. However, assuming higher spring

plantings and five year average yields, production is forecast virtually unchanged as compared to
MY2017/18.
In the UK, the area planted to wheat is forecast slightly lower year-on-year. A very mild winter means
the outlook is positive. This is despite the cold snap in late February and, to a lesser extent in mid-
March. If anything, these weather events were a positive for the development of the UK winter wheat
crop.
Wheat production in Poland is forecast down in MY2017/18. The planted area is slightly lower year-on-
year and there is a concern that the winter wheat yield in the north of the country will be below average
due to difficult planting conditions in the fall of 2017 - a combination of excessive soil moisture and
delays due to a prolonged corn harvest.
The area sown to winter wheat in Romania in the fall of 2017 is unchanged as compared to the previous
year. The long and mild fall allowed the winter crops to develop well before the snow, which arrived at
the end of February and the beginning of March, brought the necessary cover for the crops to protect
them from the low temperatures. The snow melt will increase soil moisture throughout the country and
the prospects look positive for the Romanian wheat crop. However, with yields forecast to decline
slightly, but stay close to the 5 year average, production is forecast down year-on-year.
In the Czech Republic, the wheat area is also down due to increased plantings of rapeseed. The crop is
reported to be in a good condition, with sufficient moisture in the soil, although some winterkill is
expected to have occurred in February in areas without sufficient snow cover. With yields forecast to
recover after the five year low in MY2017/18, wheat production is currently forecast up in MY2018/19.
The area planted to wheat in Bulgaria is forecast very little changed in MY2018/19. What decline there
is will be planted with protein crops (mainly chickpeas and peas) in early spring. Most planting was
completed in a timely fashion despite some early fall dryness in September. The winter was very mild,
with above normal temperatures and average rainfall, until mid-February when there was a heavy snow
and low temperatures. Winterkill was limited but there are reports of some frost damage. While soil
moisture levels are good they are making field access challenging, reducing fertilizer applications, and
the overall mild winter has led to premature development and some disease issues (rust). Yields are
forecast to be slightly below the record achieved in 2017 but above the five year average due to
improved genetics.
In MY2018/19, the Hungarian wheat area is expected to remain unchanged year-on-year but a lower, but
still good, yield means production is forecast to fall slightly. So far, the weather has been very mild in
Hungary this winter. Despite a week-long cold snap at the end of February, temperatures remained
above average for the season, and the country received some snowfall. Given these conditions, there are
no reports of winterkill damage. Winter wheat is reported to be in a generally good condition but pest

and disease pressure is likely to be higher than normal in the spring, as a result of the mild winter. Soil
moisture levels are high, good for plant development but, as has been mentioned in other Member
States, excess water in fields are already presenting challenges for crop management.
Finland, Sweden and Denmark saw winter plantings delayed due to the late harvest in 2017. This is
expected to marginally lower wheat production in MY2018/19. Estonia, Latvia and Lithuania also
experienced a late harvest in 2017, delaying winter wheat plantings at a time when the weather
conditions were particularly unfavorable. With fields difficult to access due to the wet conditions, the
winter wheat acreage is diminished but is expected to be compensated by increased spring wheat
sowing. The February cold weather was particularly harsh but it is too early to ascertain winterkill on an
already small crop. Like in some other Member States, the weather is expected to have been good for
plant resilience, reduced insect incidence and increased plant growth potential.
Finally, turning to the south, a very small increase in the planted area in Italy – soft wheat replacing corn
and more than offsetting a decline in the area planted to durum – and a benign winter means wheat
production is currently forecast little changed year-on-year. In Spain, the total area planted to wheat is
forecast to continue to decline marginally due to the steady increase of olive groves and tree nuts
plantings. Dry conditions in the fall delayed plantings as the soil was too dry. There followed a mild
winter and while there were concerns over a continued lack of rain, these have abated in recent weeks
with rain falling in late February and into March, replenishing reservoir supplies. After the extremely
poor yields in MY2017/18, yields are forecast to return to average level. If realized, and much will
depend on continued rain in the spring, production is forecast to rise over 1 MMT, one of the few
Member States currently forecasting an increase in MY2017/18 and largely offsetting the reductions
elsewhere.
In summary, the sentiment is generally good but with the EU28 entering a critical yield and quality
determining period all eyes remain on the weather.
Regarding the current MY2017/18 season, after the production and quality shock of MY2016/17, wheat
production recovered, albeit on a reduced area following the record area planted the previous year.
Unsurprisingly, the largest year-on-year increase, over 9MMT, is for France which experienced average
yield and production following the disastrous and poor quality, MY2016/17 crop. Romanian yields
were higher than initially forecast, although the quality was variable, poorest in the areas affected by
rains close to harvest. Germany also saw its wheat harvest interrupted by frequent rains, which caused
delays and created some quality issues. Poland experienced much improved yields on an unchanged
area, boosting production by nearly 1 MMT, but quality was also poor with wet grain requiring
significant drying. Latvia, Estonia and Lithuania all harvested larger wheat crops but quality was
affected by wet weather. Producers in all three countries adopted improved genetics, adapted to the
local conditions, with Latvia experiencing yields only second to the record achieved in MY2015/16.
Bulgaria experienced record high production due to favorable weather and the wider adoption of high

yielding genetics. Quality was also very good. While Hungary had an excellent crop in MY2016/17,
the average yield was even higher in MY2017/18 reaching a level not seen since 1988 and 15 percent
above the five year average. Despite this, production was lower year-on-year due to a smaller acreage.
Italy and Greece both experienced lower area, yields and production and the wheat area and production
were both below average in Croatia. This was as expected due to a new price setting system based on
protein content, a system to which Croatian farmers have struggled to adjust.
Total EU28 domestic wheat consumption in MY2017/18 is expected rise nearly 3 MMT year-on-year.
Within this total, both Food, Seed and Industrial (FSI) and feed use are expected to rise, the latter by 2.5
MMT supported by its good availability and competitive price as compared to other grains. With regards
FSI use, the increase is largely due to increased food and non-biofuel industrial uses in France. Total
industrial use is marginally lower year-on-year, a decline in use in the United Kingdom, following a four
month closure of one of its two bioethanol facilities, is partially offset by increased use in Poland.
The EU28 has faced significant competition on export markets in MY2017/18, notably from Russia and
Black Seas Origins (BSO), and currency pressure. Export licenses through mid-March amount to 15.2
MMT, 4.4 MMT lower than the same time in MY2016/17, and total year exports are currently expected
to be significantly lower year-on-year as well as below previous expectations. This is despite
MY2016/17 recording the lowest wheat export volume for four years due to the French situation that
saw it lose its crown as principal wheat exporter not just to Germany but also to Romania. Albeit the
export pace has been somewhat sluggish this season, France will regain its title in MY2017/18, and by a
wide margin. This is not just due to the inevitable, but partial, recovery in French exports. German
exports are expected to more than halve in MY2017/18, notably to South Africa, Algeria, Saudi Arabia
and Turkey. These are all countries that recorded an increase in MY2016/17 when German exports
benefitted from the lower availability of French wheat. MY2017/18 is also seeing lower German
imports from both the Czech Republic and the Baltics which are often re-exported. Romanian exports
are expected to decline around 1 MMT, in large part due to the regional competition. Exports from
Poland are also expected to be nearly 1 MMT lower in MY2017/18. This is largely due to reduced
exports to Saudi Arabia due to lower quality but also the strong competition from Russia. The main
recipients for EU28 wheat are traditionally North Africa and the Middle East, principally Algeria,
Morocco, Saudi Arabia and Egypt. The EU28 lost market share in these markets in MY2016/17. While
the aforementioned increased competition has tempered the recovery in MY2017/18, these markets
remain the principal destinations with substantive exports also being reported to the likes of Nigeria,
Jordan and South Africa.
Imports are expected to reach 5.5 MMT in MY2017/18, marginally higher year-on-year. This is due to
increases in import demand by the two principal EU28 wheat importers, Italy and Spain, following their
smaller domestic crops. The slow export pace and steady FSI use means that, despite increased feed
wheat consumption, stocks are now forecast to rise 2 MMT through MY2017/18.

The year-on-year rise in carry in stocks, while lower than previously forecast, will mean increased
availability of supplies in MY2018/19 despite the forecast marginal decline in EU28 production.
Imports are forecast to fall slightly, in the main to Spain due to reduced import demand following their
improved wheat crop outlook. While exports are forecast to continue to face stiff competition,
especially from Russia, they are currently forecast to increase by 2.5 MMT from their expected five year
low in MY2017/18. FSI use is forecast little changed, a forecast increase in industrial use in the UK,
following the anticipated reopening of the second bioethanol facility, largely offset by reduced food
consumption overall. With feed wheat use currently forecast to decline marginally, largely due to
increased availability of feed barley, stocks are forecast to decline once more, albeit only slightly.
Corn
Corn 2016/2017 2017/2018 2018/2019 Market Begin Year Oct 2016 Oct 2017 Oct 2018
European Union USDA Official New Post USDA Official New Post USDA Official New Post
Area Harvested 8562 8560 8478 8400 0 8400
Beginning Stocks 6719 6719 7542 8022 0 7222
Production 61453 61750 61139 62000 0 61000
MY Imports 15241 15243 16200 16000 0 16000
TY Imports 15241 15243 16200 16000 0 16000
TY Imp. from U.S. 869 1012 0 0 0 0
Total Supply 83413 83712 84881 86022 0 84222
MY Exports 2171 2190 2000 2500 0 2500
TY Exports 2171 2190 2000 2500 0 2500
Feed and Residual 55000 54500 56300 56500 0 55000
FSI Consumption 18700 19000 19500 19800 0 20250
Total Consumption 73700 73500 75800 76300 0 75250
Ending Stocks 7542 8022 7081 7222 0 6472
Total Distribution 83413 83712 84881 86022 0 84222
Yield 7.1774 7.2138 7.2115 7.381 0 7.2619
(1000 HA) ,(1000 MT) ,(MT/HA)
Production in MY2017/18 is expected little changed year-on-year, a small decline in area being offset by
increased yield. In France, the EU28’s largest corn producer, the corn crop area is unchanged but
production is expected up over 2.5 MMT due to yield exceeding 10 MT per HA. The crop was planted
in good conditions and there was then excellent weather throughout the growing season, with ample
rains but a dry harvest period. Romanian corn also enjoyed very favorable growing conditions,
particularly in terms of soil moisture and warmth. Improved inputs, including high quality seeds,
irrigation and increasingly modern agricultural equipment are also important factors leading to
significantly higher than average yields , albeit just below 5 MT per HA. Farmers in the south of the

country fared particularly well. In contrast, after an outstanding corn yield the previous year, heat waves
and drought reduced the average yield in Hungary. Planted area also declined meaning Hungarian
production fell over 20 percent (or just under 2 MMT) in MY2017/18. Bulgaria’s crop also suffered
following late summer dryness and heat at the end of July and into August but improved genetics and
new investment in irrigation limited the damage. Yields and production rose marginally year-on-year.
German corn production was up over 10 percent in MY2017/18, albeit 3 percent below the 5 year
average. Area was at the second lowest level in 10 years but yields benefitted from wet conditions in the
late summer and early fall, reaching their second highest level in the last 10 years. These same rains
were less than beneficial for Poland. Indeed, heavy rains in September flooded fields and disrupted the
harvest, especially in the north of the country. Some corn was abandoned in the fields. What was
harvested had to be dried and production fell overall due to reduced area and yield. Italy and Spain both
recorded reduced production year-on-year on reduced areas, Spain seeing a sixth year in succession of
lower area due to poor margins, and to a lesser extent, crop diversification prompted by greening and
water restrictions.
EU28 planted area is forecast unchanged in MY2018/19, an increase in Hungary offset by a fall in
Romania, the latter due to reduced plantings in the areas affected by drought the previous year, and a
switch to sunflowers. Production is therefore forecast down in Romania and up in Hungary, based on
average yields. On an unchanged area, French production is unsurprisingly forecast to decline from the
high in MY2017/18. When this is combined with the forecast changes in the other two main producers,
and given minimal changes are forecast elsewhere, total EU28 production is currently forecast to fall 1
MMT. One factor that could change this is German plantings which could rise substantially if the
current wet conditions impede the spring plantings of other crops or winter kill proves to be worse than
currently thought. With three pesticides from the neonicotinoid family remaining prohibited across the
EU28, for the fifth year Romania requested, and was granted, European Commission approval to allow
farmers to use seeds treated with insecticides from the affected family of chemicals this year. It should
be noted that the ban on neonicotinoids also presents pest control problems, mainly in the form of
rootworm, for other Member States, particularly those in the south east. There is no viable technical
solution available in the EU28 at this time.
Returning to MY2017/18, on the demand side, the main story is increased use in the feed sector,
principally in Spain where increased imports are compensating for the domestic crop shortfall. Indeed,
Spanish feed consumption of corn is expected to reach a record level in MY2017/18, supported by
strong pork export demand. The main origin of corn imports thus far this season has been Brazil, which
has displaced U.S. corn, but more Ukrainian imports are expected as the season progresses. Imports
from Argentina are limited by pesticide issues. Third country corn imports are still expected to reach 16
MMT – while import licenses to mid-March are nearing 12 MMT, these are on a July-June year.
MY2018/19 is forecast to see improved availability of barley within the EU28 and increased
incorporation in the feed ration. That said, corn import volumes are forecast to remain robust and are
currently forecast unchanged year-on-year.

Also offering support to import volumes is FSI use which is expected to rise in MY2017/18 with a
further rise forecast for MY2018/19. Both rises are because of increased industrial use of corn. The
most significant industrial user of corn is Hungary which has two of the EU28’s largest corn processing
factories following the completion of a KALL-Ingredients Ltd facility in Tiszapüspöki in October, 2017.
With this plant alone having an annual processing capacity of 530,000 MT, the industrial use of corn in
Hungary is expected to progressively increase to 2.7 million MT in the next two years – Hungarian corn
processors are also important players in the starch, isosugar, dextrose, gluten, distillers dried grain and
corn gluten feed markets. Spain’s largest grain-based in-land bioethanol plant reopened just prior to the
MY2017/18 season meaning an expected rise in consumption. A further increase is forecast for
MY2018/19, corn anticipated to be the preferred and most likely sole feedstock for the Spanish grain-
bioethanol industry. Corn consumption in Germany and Italy, both significant consumers, is expected
little changed in MY2017/18 and into MY2018/19. Instead, it is increased incorporation in the
bioethanol mix in Austria and the UK that is further buoying the year-on-year increase in consumption
in MY2017/18. Overall, industrial use is expected up about 700,000 MT in MY2017/18 with a further
450,000 MT forecast for MY 2018/19. Together these changes account for the majority of the shift in
FSI use.
Corn export licenses to mid-March totaled just 800,000 MT, again on a July-June year but less than half
of that recorded at this time last year. However, producers in the main exporter, Romania, where
supplies are plentiful following the bumper crop, are reported to be waiting on higher prices. Whether
these come or not, export pace is expected to increase in the coming months due to storage limitations.
Indeed, an expected rise in year-on-year Romanian exports means EU28 exports in MY2017/18 are now
expected to be 2.5 MMT. With Romanian exports also forecast strong in MY2018/19, total EU28 corn
exports are currently forecast unchanged in the out year.
Barley
Barley 2016/2017 2017/2018 2018/2019 Market Begin Year Jul 2016 Jul 2017 Jul 2018
European Union USDA Official New Post USDA Official New Post USDA Official New Post
Area Harvested 12291 12300 12313 12125 0 12175
Beginning Stocks 6060 6060 5649 5542 0 4792
Production 59860 59950 58728 59000 0 61500
MY Imports 398 399 500 450 0 250
TY Imports 447 447 500 500 0 250
TY Imp. from U.S. 0 0 0 0 0 0
Total Supply 66318 66409 64877 64992 0 66542
MY Exports 5669 5667 6200 7000 0 7250
TY Exports 5683 5683 6200 7000 0 7250
Feed and Residual 40100 40100 38600 38000 0 39500
FSI Consumption 14900 15100 14900 15200 0 15250
Total Consumption 55000 55200 53500 53200 0 54750
Ending Stocks 5649 5542 5177 4792 0 4542

Total Distribution 66318 66409 64877 64992 0 66542
Yield 4.8702 4.874 4.7696 4.866 0 5.0513
(1000 HA) ,(1000 MT) ,(MT/HA)
Like wheat, the wet fall across much of the EU28 caused some disruption to winter plantings but the
mild winter saw the crop develop generally well, albeit it was a little wet in parts of France and
Germany. The cold snap in late February bodes well for reducing pest occurrence and disease
incidence, and while there may have been some winterkill it is expected to be limited. If there is a
concern in some Member States, it is that wet fields will limit access and the ability to manage the
developing crop as well as commence spring plantings which might be reduced as a consequence.
Currently though, with the total planted area forecast little changed year-on-year and yields forecast
upwards in the key producers of France, Germany, Spain and the UK, production is forecast to increase
by 2.5 MMT in MY2018/19.
Returning to the current season, total EU28 planted barley area and production declined in MY2017/18,
overall yields being unchanged. Increased production in France, the EU28’s largest barley producer,
was more than offset by a significant decline in Spain. As was the case for wheat, France suffered a
much diminished barley crop in MY2016/17 so, while sizeable, the MY2017/18 crop was actually
planted on a slightly reduced area. In a further change to MY2016/17, it is also of good quality. The
second largest EU28 barley producer is Germany, where production is little changed in MY2017/18.
An increase in yield, albeit significantly less than the increase in France, has offset a reduction in the
area. Improved yields in Bulgaria and Hungary limited the impact of reduced planted areas in those
countries while both Poland the UK experienced larger crops and higher yields on increased planted
areas. With production either up or little changed in most other Member States, it is the aforementioned
Spanish barley crop that has seen overall EU28 production decline by around 1 MMT. Spain alone has
seen a 3 MMT year-on-year decline in barley production, albeit from an eight year high in MY2016/17,
due to extremely poor yields.
The tighter barley supply situation in the EU28 has not constrained exports. Strong demand in the
Middle East has seen 3.9 MMT of export licenses, excluding malting barley, granted up to the middle of
March, slightly ahead of the same point in MY2016/17. News of a 1 MMT Saudi Arabia barley tender
in late March, for delivery up to June, has provided further support to the market and with EU28 barley
priced competitively on third country markets, full season exports are currently forecast to reach 7
MMT. Of the 2.7 MMT exported through end-December, some of which was exported using licenses
obtained in MY2016/17, nearly 1.2 MMT has been exported to Saudi Arabia. The main exporters
remain France, Germany and Romania, the latter two seeing a 30 and 40 percent increase, respectively,
in third country exports over this period as compared to MY2016/17.
The reduced crop in Spain in MY2017/18 translates directly into increased imports, both third country
and intra-EU, but still means decreased feed use in that country along with a decline in stocks.
Consumption of feed barley in France is lower year-on-year due to the good export pace and increased

consumption of wheat and corn. It is a similar story in the Netherlands, in its case the good pace of
exports reducing intra-community availability. When the French and Dutch situations are combined,
they more than offset an increase in feed barley consumption in Poland - due to the lower quality of its
crop - and, to a lesser extent, elsewhere. Overall, expected feed barley use is further lowered in
MY2017/18. With FSI usage expected unchanged, ending stocks are also lowered further.
With exports in MY2018/19 currently forecast to maintain a similar volume to those in MY2017/18, in
the main to Saudi Arabia, and no change anticipated for FSI use, the forecast year-on-year increase in
the size of the barley harvest will increase the availability for feed use. At the current time, it is forecast
to rise 1.5 MMT while stocks are forecast to decline marginally.
Rye
Rye 2016/2017 2017/2018 2018/2019 Market Begin Year Jul 2016 Jul 2017 Jul 2018
European Union USDA Official New Post USDA Official New Post USDA Official New Post
Area Harvested 1900 1900 1963 1950 0 1985
Beginning Stocks 1084 1084 817 844 0 894
Production 7493 7420 7484 7500 0 7800
MY Imports 16 16 50 50 0 50
TY Imports 16 16 50 50 0 50
TY Imp. from U.S. 0 0 0 0 0 0
Total Supply 8593 8520 8351 8394 0 8744
MY Exports 76 76 100 100 0 100
TY Exports 139 139 100 100 0 100
Feed and Residual 3900 4000 3900 3700 0 4000
FSI Consumption 3800 3600 3700 3700 0 3700
Total Consumption 7700 7600 7600 7400 0 7700
Ending Stocks 817 844 651 894 0 944
Total Distribution 8593 8520 8351 8394 0 8744
Yield 3.9437 3.9053 3.8125 3.8462 0 3.9295
(1000 HA) ,(1000 MT) ,(MT/HA)
Rye is predominantly planted in less fertile sandy regions. The main producing and consuming
countries for rye in the EU28 are Germany and Poland, which account for about three quarters of the
total EU28 rye market. The German planted area fell for the fourth consecutive year in MY2017/18 but
is forecast to stabilize in MY2018/19. In contrast, the Polish planted area recovered significantly, by
nearly 20 percent, in MY2017/18 following a very difficult year in MY2016/17. In combination with
improved yields, Polish production is expected to increase by over 25 percent year-on-year. Most of this
increase is offset by the smaller German crop meaning total EU28 production is only up marginally in
MY2017/18. Like Germany, no change is forecast for the area planted to rye in Poland in MY2018/19.
This will mean both area and production in Poland remain much lower than the level seen pre-
MY2013/14 despite higher production year-on-year due to very good development of the crop thus far -
high levels of soil moisture, a mild winter, with a short period of frost in late February created good
weather conditions for rye vegetation. Overall, improved forecast yields mean total EU28 rye
production is forecast to rise 300,000 MT in MY2018/19.
Around half of the rye production is used in animal feeds and MY2017/18 is expected to be no
exception. While food use is relatively steady, MY2017/18 saw increased demand for alcohol
production in Poland and industrial use of rye is therefore estimated higher than in the previous year.
This demand is forecast to continue in MY2018/19. The slightly heavier forecast balance in MY2018/19
due to increased production is forecast to see increased feed use of rye and a marginal increase in stocks.
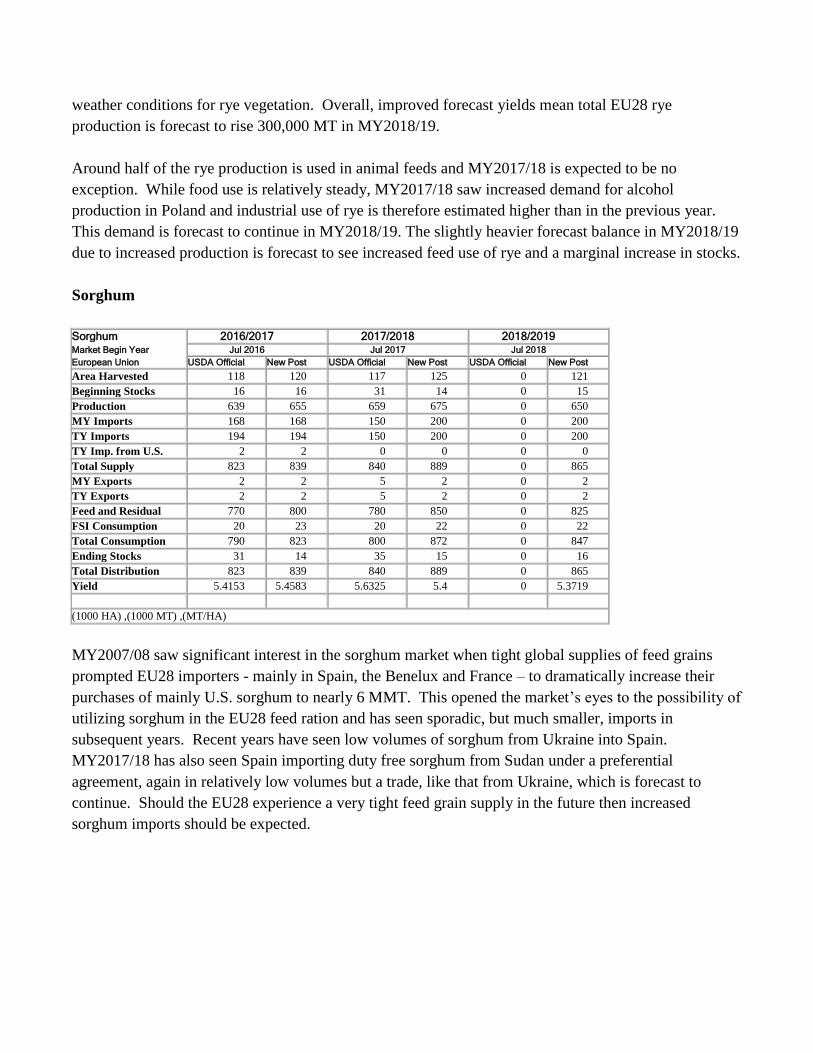
Sorghum
Sorghum 2016/2017 2017/2018 2018/2019 Market Begin Year Jul 2016 Jul 2017 Jul 2018
European Union USDA Official New Post USDA Official New Post USDA Official New Post
Area Harvested 118 120 117 125 0 121
Beginning Stocks 16 16 31 14 0 15
Production 639 655 659 675 0 650
MY Imports 168 168 150 200 0 200
TY Imports 194 194 150 200 0 200
TY Imp. from U.S. 2 2 0 0 0 0
Total Supply 823 839 840 889 0 865
MY Exports 2 2 5 2 0 2
TY Exports 2 2 5 2 0 2
Feed and Residual 770 800 780 850 0 825
FSI Consumption 20 23 20 22 0 22
Total Consumption 790 823 800 872 0 847
Ending Stocks 31 14 35 15 0 16
Total Distribution 823 839 840 889 0 865
Yield 5.4153 5.4583 5.6325 5.4 0 5.3719
(1000 HA) ,(1000 MT) ,(MT/HA)
MY2007/08 saw significant interest in the sorghum market when tight global supplies of feed grains
prompted EU28 importers - mainly in Spain, the Benelux and France – to dramatically increase their
purchases of mainly U.S. sorghum to nearly 6 MMT. This opened the market’s eyes to the possibility of
utilizing sorghum in the EU28 feed ration and has seen sporadic, but much smaller, imports in
subsequent years. Recent years have seen low volumes of sorghum from Ukraine into Spain.
MY2017/18 has also seen Spain importing duty free sorghum from Sudan under a preferential
agreement, again in relatively low volumes but a trade, like that from Ukraine, which is forecast to
continue. Should the EU28 experience a very tight feed grain supply in the future then increased
sorghum imports should be expected.

Oats
Oats 2016/2017 2017/2018 2018/2019 Market Begin Year Jul 2016 Jul 2017 Jul 2018
European Union USDA Official New Post USDA Official New Post USDA Official New Post
Area Harvested 2562 2570 2622 2680 0 2680
Beginning Stocks 690 690 579 636 0 646
Production 8036 8050 8029 8100 0 8225
MY Imports 4 4 5 5 0 5
TY Imports 3 3 5 5 0 5
TY Imp. from U.S. 0 0 0 0 0 0
Total Supply 8730 8744 8613 8741 0 8876
MY Exports 151 148 200 175 0 175
TY Exports 179 179 200 175 0 175
Feed and Residual 6300 6200 6100 6100 0 6150
FSI Consumption 1700 1760 1700 1820 0 1850
Total Consumption 8000 7960 7800 7920 0 8000
Ending Stocks 579 636 613 646 0 701
Total Distribution 8730 8744 8613 8741 0 8876
Yield 3.1366 3.1323 3.0622 3.0224 0 3.069
(1000 HA) ,(1000 MT) ,(MT/HA)
The six main producers of oats in the EU28 are Poland, the UK, Finland, Spain, Germany and Sweden,
traditionally accounting for around 70 percent of production, although production is now on the increase
in France.
Oats can be planted late, seed is inexpensive and readily available, and planted area is influenced by the
prices of other grains, this especially being the case in the largest EU28 oats producer, Poland, where the
price of rye and triticale is a major driving factor. Following a period of steady decline in the planted
area in the EU28, MY2016/17 saw a change of direction. This upward trend in plantings is expected to
continue in MY2017/18, buoyed by increased plantings in Spain, the UK, Poland and Germany and, as
mentioned previously, in France. The oats planted area is currently forecast unchanged in MY2018/19.
While the high average yield seen in MY2016/17 is expected to be followed by a below average yield in
MY2017/18, any decline is more than offset by the increased overall area and a rise in yield in Poland,
meaning total EU28 production is expected to rise year-on-year. With no current reason to expect
anything other than average yields in MY2018/19, production is forecast to rise again in the out year.
The EU28 market remains underpinned by the organic industry which still has an interest in oats for
crop rotation purposes and demand for food and feed use.

Trade in oats is traditionally almost exclusively intra-EU with a minor export volume to non-EU28
countries originating from Finland and Sweden. Third country destinations are mainly Switzerland and
the United States, the latter mainly destined for horse feed.
Total annual FSI use was buoyed by increased food use, predominantly in the UK and Germany, in
MY2016/17. This trend is expected to continue in both MY2017/18 and MY2018/19. Elsewhere within
the total FSI number, usage for the production of bioethanol and biogas is forecast to remain steady at
around 75,000 MT. The remaining production, accounting for over 75 percent of usage, is fed to
animals. The forecast increase in oats production in MY2018/19 will support a building of ending
stocks.
Mixed Grain
Mixed Grain 2016/2017 2017/2018 2018/2019 Market Begin Year Jul 2016 Jul 2017 Jul 2018
European Union USDA Official New Post USDA Official New Post USDA Official New Post
Area Harvested 3971 3970 3979 3975 0 3960
Beginning Stocks 883 883 493 483 0 608
Production 15110 15000 15605 15600 0 15300
MY Imports 0 0 0 0 0 0
TY Imports 0 0 0 0 0 0
TY Imp. from U.S. 0 0 0 0 0 0
Total Supply 15993 15883 16098 16083 0 15908
MY Exports 0 0 0 0 0 0
TY Exports 0 0 0 0 0 0
Feed and Residual 14000 13750 14000 13750 0 13750
FSI Consumption 1500 1650 1500 1725 0 1725
Total Consumption 15500 15400 15500 15475 0 15475
Ending Stocks 493 483 598 608 0 433
Total Distribution 15993 15883 16098 16083 0 15908
Yield 3.8051 3.7783 3.9218 3.9245 0 3.8636
(1000 HA) ,(1000 MT) ,(MT/HA)
Mixed grain numbers include triticale and the threshed, dry seeds of wheat, barley, corn, oats, rye and
sorghum grown and harvested in the same field. The main producing countries are Poland, Germany
and France, together accounting for around 80 percent of the production.
In Poland, following a number of years of successive reduction in the area planted to mixed grain,
MY2017/18 saw an increase back to the level seen in MY2015/16, albeit below historic levels due to
smaller hog production and reduced on farm use – nearly all Polish produced mixed grain is fed-on-
farm. Improved yield meant production is expected nearly 800,000 MT, or 10 percent, up year-on-year.
The area planted to mixed grains is forecast unchanged in Poland in MY2018/19, albeit within this total
the proportion planted to triticale is forecast to continue to increase, it increasingly being the preferred
choice for feed use. Only a very small percentage of the Polish mixed grain crop is used in the

bioethanol sector, up in MY2017/18 but demand in this sector is unstable, while a small volume is
exported within the EU, mainly to Germany, for feed.
The French planted area is little changed in MY2017/18 but the yield is expected to recover after the
significant fall in MY2016/17. As such, French production is expected to rise over 350,000 MT in
MY2017/18 with all of this increase being used as feed, as is the case for nearly all French mixed grain.
German production is expected to be down marginally due to lower yields unchanged along with other
grains, it is nearly all used as feed. In Germany, a marginally lower planted area and slight decline in
yield means production is down around 100,000 MT. Demand for mixed grain as a bioethanol feedstock
in Germany fluctuates around 400,000 MT and is expected to show a slight year-on-year decline in
MY2017/18.
With the overall EU28 mixed grain area forecast unchanged in MY2018/19, a marginal decline in
production and steady FSI and feed use means stocks are currently forecast to fall back below
MY2016/17 following an expected rise in MY2017/18.
Rice
Rice, Milled 2016/2017 2017/2018 2018/2019
Market Begin Year Sep 2016 Sep 2017 Sep 2018
European Union USDA Official New Post USDA Official New Post USDA Official New Post
Area Harvested 439 440 438 430 0 420
Beginning Stocks 1183 1183 1115 1175 0 1162
Milled Production 2068 2078 2090 2037 0 2003
Rough Production 2980 3035 3012 2974 0 2925
Milling Rate (.9999) 6940 6847 6940 6849 0 6848
MY Imports 1833 1834 1900 1900 0 1950
TY Imports 1875 1980 1900 1900 0 1950
TY Imp. from U.S. 58 51 0 0 0 0
Total Supply 5084 5095 5105 5112 0 5115
MY Exports 319 320 280 300 0 300
TY Exports 369 369 280 300 0 300
Consumption and Residual 3650 3600 3750 3650 0 3700
Ending Stocks 1115 1175 1075 1162 0 1115
Total Distribution 5084 5095 5105 5112 0 5115
Yield (Rough) 6.7882 6.8977 6.8767 6.9163 0 6.9643
(1000 HA) ,(1000 MT) ,(MT/HA)
EU28 rice production is concentrated in the Southern Member States, namely Italy, Spain, Greece,
Portugal, France, Romania, Bulgaria and Hungary. Rice cultivation is input intensive as it needs high
initial investments for land preparation and a significant amount of working capital to cover input costs.
Italy is by far the largest rice producer in the EU28, accounting for about 50 per cent of production.
Rice cultivation is mostly located in the north (Piemonte, Lombardia and Veneto regions) where water is
relatively abundant and the rice crop can be raised in flooded fields. Approximately 80 per cent of rice

varieties grown in Italy are Japonica while the remainder are Indica. Except for limited amounts of
rough (unmilled) rice exports and domestic seed sales, virtually all Italian rice is marketed as a whole-
kernel milled product.
Italy’s MY 2017/18 paddy rice production is forecast to fall over 5 percent to 1.46 MMT, a combination
of a 2 percent year-on-year decline in planted area due to reduced profitability in the sector and reduced
yields due to the summer drought in 2017. Following a previous decline in the long grain Indica variety
planted area – industry sources citing increasing long grain imports from Cambodia, Myanmar, Guyana,
and Surinam which enjoy duty free market access under ‘Everything But Arms’ (EBA) agreements –
MY 2017/18 is expected to see a large increase in this planted area, by over 35 percent, despite third
country imports remaining a firm feature. Indeed, the overall area decline is due to reduced round and
long grain japonica plantings as the medium grain japonica area is also expected higher. Overall,
quality is good but lower than in MY2016/17. The total Italian area planted to rice, along with
production, is forecast to fall slightly in MY2018/19 in a continuation of the MY2017/18 trend.
The second largest rice producer in the EU28, accounting for around 30 per cent of the total, is Spain
with the main producing regions being Andalucia, Extremadura, Comunidad Valencia, Cataluna,
Aragon and Navarra. The planted area has been in decline since 2011 but is now stabilizing, there being
no viable alternatives in the traditional growing areas. Low market prices, the aforementioned ongoing
competition from third countries, high input costs and limited active matters available for rice
cultivation are seen as the main drivers for the area reduction. Improved yields mean production is
expected up in MY2017/18 with little change forecast for MY2018/19.
The third largest rice producer is Greece, accounting for around 9 percent of the total. The main rice
producing areas are Thessaloniki, Serres (northern Greece), Lamia (central Greece), and Etoloakarnania
(western Greece). Approximately 60 percent of rice varieties grown in Greece are Japonica, while the
remainder are Indica. Low prices have seen many farmers storing production, in the hope of improved
market conditions. Despite this, area and production is forecast little changed in MY2018/19, there
being few alternate crops.
EU28 consumption is trending upwards but at a slower rate than previously forecast. There is a
traditional affinity for Japonica varieties, in rice producing Member States in particular, due to its
cooking characteristics, namely its capacity to absorb flavors. Indica consumption, which is more
popular in non-producing Member States, along with other non-traditional varieties (ie Basmati, wild
rice blends, brown rice, glutinous rice or starchy rice) and ready-to-eat rice portions continue to grow.
While this could be linked in part to immigration, the more significant factor is consumers continuing to
evolve their eating habits and adopt non-traditional dishes.
India is the key rice supplier to the EU28 but, as mentioned, duty free access for EBA countries, has
seen a surge in imports from the likes of Cambodia, Guyana and Myanmar with the latter challenging

India for largest supplier in MY2016/17. The lowering of the tricyclozole MRL as of January 1, 2018
saw an increase in the pace of basmati imports into Spain prior to this date. After implementation, this
pace has slowed with Pakistan gaining from some of the market lost by India. Italy is reported to have
been unaffected by the change, in large part due to its production of 1.5 MMT of rough rice in
MY2017/18 despite the summer drought. While the United States is not among the main suppliers of
rice to the EU28, ten years on from the discovery of LL601 in commercial channels, a variety
unapproved for food use, and following considerable work by the U.S. rice industry, imports are now on
the rise, in the main to the United Kingdom. Indeed, the United States holds good potential as a supplier
in certain market niches such as specialty rice (Calrose, Jupiter, Wild Rice).
Most rice exports are intra-EU28 but competition from third countries is making this increasingly
challenging. Turkey is the largest recipient of EU28 rice, followed by Switzerland, both due to their
proximity.
Policy
EU Import Policy
The EU limits the entry of lower priced grains from non-EU countries through a system of import duties
and quotas.
Under the WTO Uruguay Round Agreement, all import quotas and variable levies applied to EU imports
of grains and processed cereals were fixed or ‘tariffied’ and subsequently reduced by 36 percent over the
six year period of July 1, 1995 to June 30, 2001. However, under the Blair House Accord concluded
between the United States and the EU in 1993, it was agreed that the difference between the grains
import price (cost insurance freight [cif] duty paid in Rotterdam) and the EU’s intervention price could
not be greater than 55 percent. The EU then developed a system where duties were set on the basis of
separate reference prices for six grain types, and applied to imports of high quality wheat, durum wheat
(high quality), durum wheat (medium quality), maize (corn), flint maize, rye and sorghum. The
resulting duty has been set at Euro 0/Metric Ton (MT) for durum wheat and high quality wheat since the
July 1, 2010 (beginning of the 2010/11 marketing year.) The duty for corn had been set at Euro 0/MT
since August 17, 2010 and the duty for sorghum and rye at Euro 0/MT since October 19, 2010. Duties
of Euro 5.16/MT were introduced for corn, sorghum and rye from August 8, 2017. A rally in U.S. corn
prices driven by strong demand resulted in duties for corn, sorghum and rye being reduced to Euro
0.56/MT with effect from March 2, 2018.
From November 6, 2016 both import and export licenses have only been required (Commission
Delegated Regulation (EU) 2016/1237 and Commission Implementing Regulation (EU) 2016/1239) for
trade subject to Tariff Rate Quotas (TRQs). Actual quantities of grain traded, based on the European
Commission’s DG TAXUD surveillance, have been published on the Europa website on a weekly basis

on Thursdays at 16:00 Brussels time) since July 2016. Import licenses applying to grains subject to
TRQs are valid for the current month plus two.
Reference grains for calculating import duties
Reference variety Reference market High quality wheat U.S. hard red spring No. 2 Minneapolis
Durum wheat (high
quality)
U.S. hard red spring No. 2 Minneapolis
Durum wheat (medium
quality)
U.S. hard red spring No. 2 Minneapolis
Maize (corn) U.S. yellow corn No. 3 Chicago Mercantile
Exchange
Flint maize U.S. yellow corn No. 3 Chicago Mercantile
Exchange
Other feed grains (rye,
sorghum)
U.S. yellow corn No. 3
(Commission Implementing Regulation (EU) No
643/2011, July 1, 2011)
Chicago Mercantile
Exchange
Theoretical example illustrating method of calculating EU import duties
(Euro/
MT)
Representative
world standard
EU
Reference
price
(a)
World
price
(b)
FOB
premium
(c)
Freight
(d)
Representative
world price
(e) =
(b)+(c)+(d)
EU
duty
(a)-
(e) Maize
(corn)
Chicago yellow
corn No. 3
157.03 68.46 16.20 15.56 100.22 56.81
Notes:
Reference price = EU intervention price is 1.55 times Euro 101.31
In January 2003, the EU discontinued this system for low and medium quality wheat and barley and
introduced a system of quotas to protect EU producers from lower priced Black Sea imports, the duty for
which had been calculated on the basis of higher U.S. prices As such, imports entered the EU at very
competitive rates.
More specifically, for medium and low quality wheat, a maximum annual TRQ of 3,112,030 MT was
opened in 2003 for medium and low quality wheat. A country specific quota of 572,000 MT was
allocated for imports originating in the United States and 38,853 MT for those originating in Canada.
The remaining 2.378 million MT is split into four equal tranches of 594,000 MT each on a quarterly
basis, and is open to other non-EU countries on a first come first served basis. All of these TRQs remain
operational today. From April 2017, the Canadian duty free TRQ for wheat increased to 100,000 MT

per annum with the implementation of the EU-Canada Comprehensive Economic and Trade Agreement
(CETA).
In addition to these TRQs, from January 1, 2012, there has been an ergo omnes (open to all) quota
consisting of one tranche of 122,790 MT for medium and low quality wheat. This was opened to take
account of market loss arising from the accession of Bulgaria and Romania to the EU in 2007. The duty
for imports under the quota is set at Euro 12/MT, while imports outside the quota are subject to a duty of
Euro 95/MT.
For barley, the quota of 50,890 MT applies to malting barley at a duty of Euro 8/MT and a separate
quota of 307,105 MT applies for other types of barley at Euro 16/MT. Barley outside the quota faces
duties of Euro 93/MT.
The European Commission’s Cereals Management Committee which met in November 2012 voted to
suspend import duties on low and medium quality soft wheat and feed barley imported into the EU from
January 2013 until the end of June 2013. The move was aimed at easing the pressure on the EU market,
especially for animal feed. The suspension relates to existing tariff rate quotas, where preferential tariffs
of Euro 12/MT and Euro 16/MT respectively were reduced to zero for the volumes permitted under the
quota.
In addition, the Commission introduced an autonomous tariff measure (ATM) introducing zero import
duty for 950,000 MT of wheat, 400,000 MT of corn and 250,000 MT of barley from Ukraine to apply
from the end of April until October 31, 2014. This measure was prolonged to apply from January 1,
2015 until the end of December 2015, and has been a TRQ since January 1, 2016, (Commission
Implementing Regulation (EU) 2015/2081) of November 18, 2015 additionally providing for an annual
increase in the quantity of corn subject to zero import duty from 400,000 MT from January 1, 2016 to
650,000 MT from 2021). In November 2017, Commission Implementing Regulation (EU) 2017/2200
opened 0 duty TRQs for Ukraine, the details of which are as follows: common wheat, spelt and meslin,
flour, groats, meal and pellets – 65,000 MT per annum; corn, other than seed, flour, groats, meal, pellets
and grains – 625,000 MT per annum; barley, other than seed, flour and pellets – 325,000 MT per
annum. The TRQs are open annually from January 1, 2018 to December 31, 2020.
Reductions for Maize (Corn) and Sorghum – “Abatimento”
The accession of Spain to the EU resulted in the application of common EU tariff barriers to Spanish
imports and the loss of competitiveness for imports from non-EU countries. An agreement between the
EU and the United States allows for the import of a fixed quantity of non-EU corn and sorghum at a

preferential import duty as compensation for the loss of the Spanish market. The current agreement
applies to 2 million MT of corn and 0.3 million MT of sorghum.
The EU also operates a reduced tariff import quota of 500,000 MT of corn into Portugal (maximum
tariff of Euro 50 per MT). Amounts are reduced by any quantity of grain substitutes (e.g. starch residues
and citrus pulp) imported in the same year. Flint maize is not permitted to be included within the
concession.
Following the 2004 enlargement of the EU and a subsequent agreement between the EU and the United
States, the EU opened an additional annual duty-free tariff quota of 277,988 MT of imports of corn from
non-EU countries. The quota has been open since July 2006.
The Commission has proposed an amended system of managing the scheme whereby the current bidding
system would be replaced by the automatic fixation of “0” duty from May 1 each year (i.e. the normal
import regime would apply from January 1 until April 31). Spain and Portugal prefer the automatic
fixation of “0” duty to be applied from an earlier date. At the time of writing, discussions on the
Commission’s proposal are ongoing.
EU Export Policy
The EU’s ability to grant export subsidies, especially on wheat, became limited by WTO export subsidy
limit commitments with the implementation of the WTO Uruguay Round Agreement on Agriculture.
As a part of that Agreement, GATT signatories committed to reduce the level of budgetary expenditure
on export subsidies by 36 percent and the volume of subsidized exports by 21 percent over the six year
period between July 1, 1995 and June 30, 2001. At the WTO Ministerial meeting in Hong Kong in
December 2005, it was agreed that all forms of agricultural export subsidy should be phased out by the
end of 2013, with a substantial part already realized by 2010. The WTO Nairobi Agreement provides
that developed WTO Members must eliminate their remaining scheduled export subsidy entitlements
from the date of adoption of the Ministerial Decision.
Within these constraints, the European Commission may fix refunds which enable EU exporters to
compete on the lower priced world market. These may also to be fixed by tender. No export refunds
have been granted on grains since September 2006 and grain-based processed products since 2007.
From November 6, 2016 export licenses have no longer been required. Actual quantities of grain traded,
based on the European Commission’s DG TAXUD surveillance, have been published on the Europa
website on a weekly basis (on Thursdays at 16:00 Brussels time) since July 2016 (Commission
Delegated Regulation (EU) 2016/1237 and Commission Implementing Regulation (EU) 2016/1239).

Intervention Mechanism
EU legislation allows the EU to intervene in markets by purchasing grains from farmers and traders at
an intervention price of Euro 101.31/MT, which reflects the delivered to store price at which EU
purchases are made. Selling into intervention is aimed to be the market of last resort for farmers and
traders. Intervention purchases may be made between November 1 and May 31 for common wheat,
barley, corn and durum wheat. Grain held in intervention stores is disposed of mainly through sale by
tender onto the domestic market or for export, although a proportion may be released for the most
deprived people in the EU.
The intervention arrangement was abolished for rye starting from marketing year 2004/05 (MY – July 1
to June 30 for all grains and grains products). Guaranteed intervention quantities were reduced to zero
MT for corn from MY 2009/10, durum wheat from MY 2009/10, barley from 2010/11 and rice from
MY 2009/10. By reducing the guaranteed intervention quantity to zero, the EU maintains the right to
reintroduce intervention if market conditions are considered to be appropriate. A guaranteed
intervention quantity of three million MT at the intervention price has applied to soft wheat since MY
2010/11. When that quantity has been reached, intervention is made through tenders or bids. In the
absence of guaranteed intervention quantities, tendering procedures were introduced for barley and corn
starting from MY 2010/11. In practice, no grains have been held in intervention since 2010. In 2016,
the rules applying to the intervention system were simplified by Commission Delegated Regulation
(EU) 2016/1238 and Commission Implementing Regulation (EU) 2016/1240.
Special Support Measures
EU legislation allows for special measures in addition to intervention to be taken to support the market
for grains in time of crisis. These measures would take place on an ad hoc basis and be proposed by the
European Commission and decided by the Member States at the Management Committee.
Promotion of Sorghum
Further to calls made by the French National Federation of maize and sorghum seed producers
(FNPSMS), the European Commission cleared Euro 1.17 million, Euro 870,000 of which will be spread
over a three year period from spring 2017 to promote sorghum. The promotion programs will be
concentrated on two geographical regions: five EU Member States (France, Spain, Italy, Bulgaria and
Romania) and two Eastern European countries (Russia and Ukraine).

Biotechnology
Authorization of GE 1507 corn for cultivation
On September 26, 2013, the European Court of Justice (ECJ) found that the European Commission had
failed to forward an application for GE 1507 corn cultivation, submitted by Pioneer Hi-Bred in 2001, in
a timely manner. After not being able to reach an agreement in 2009 at the Commission’s 2001/18
Standing Committee, the Commission failed to put the matter to vote in Council “without delay. “
The ECJ also criticized the Commission for unnecessarily resubmitting the Pioneer application to the
European Food Safety Authority (EFSA) seven times. On March 3, 2014, the application was put to the
General Affairs Council which gave no opinion. As pre-Lisbon rules apply in this case, the Commission
is obliged to adopt the proposal. To date, the Commission has not adopted its proposal.
Member States allowed to “opt out” of cultivating approved biotech crops
The Commission has asserted that the approval of another biotech crop for cultivation necessitates the
introduction of a system for Member States (MS) to opt out of cultivating approved biotech crops for
non-scientific reasons. EU legislation governing plant biotechnology currently allows MS to ban the
cultivation of biotech crops in their territories if new scientific evidence suggests that such cultivation
could be harmful to the environment, or human or animal health. Since many MS have historically used
spurious science to invoke this “safeguard clause,” in 2010 the Commission proposed an amendment to
the legislation that would allow MS to “opt out” of cultivating approved biotech crops for non-scientific
reasons. This proposal failed to achieve a consensus at Council. In March 2014, the Greek Presidency
of the Council tabled a compromise proposal which includes elements that both pro- and anti-biotech
Member States could accept. The proposal was agreed by the Parliament and Council in January 2015
and entered into force in spring 2015.
To date, nineteen MS have “opted out” of genetically engineered (GE) crop cultivation for all or part of
their territories.
Only one biotech product, MON 810 corn, has been approved for cultivation in the EU by the
Commission.
Cultivation of MON 810 corn
The only GE plant approved for cultivation in the EU is MON810 corn. It is a Bacillus thuringensis (Bt)
corn resistant to the European corn borer (a pest). In 2016, four Member States grew MON810 corn
(Spain, Portugal, the Czech Republic, and Slovakia). However, in 2017 only Spain and Portugal
continue to cultivate GE corn. MON810 is only grown by farmers in areas were the corn borer
represents a problem. It is used locally as animal feed and for biogas production.

Cultivation of MON 810 corn in the EU
Source: FAS offices in the EU28
For more information on biotechnology in the EU, see SP1743 “Agricultural Biotechnology Annual”.
Rice
Import and export licenses
Rice products for which an import license is required are as follows:
- Husked rice under heading 1006 20: period of validity is until the end of the second month
following that of application. Security is Euro 30/MT. Current rate of duty is Euro 30/MT
- Milled rice under heading 1006 30: period of validity is until the end of the second month
following that of application. Security is Euro 30/MT. Current rate of duty is Euro 175/MT
- Broken rice under heading 1006 40 00: period of validity is until the end of the second month
following that of application. Security is Euro 1/MT. Current rate of duty is Euro 65/MT
Exports of rice to countries outside the EU are mostly subject to the issuing of an export license.
Tariff Rate Quotas
Various Tariff Rate Quotas (TRQs) following international agreements under WTO or bilateral
negotiations allow rice imports at a lower or zero duty.
Total quantities of rice subject to TRQs are as follows:
Rice type Quantity (MT)
in hectares 2012 2013 2014
(updated)
2015
(updated)
2016
(updated)
2017
(estimate)
Spain 116,307 136,962 131,538 107,749 129,081 124,227
Portugal 7,700 8,202 8,542 8,017 7,069 7,036
Czech Republic 3,050 2,560 1,754 997 75 0
Romania 217 834 771 2.5 0 0
Slovakia 189 100 411 400 112 0
Poland 4,000 0 0 0 0 0
Total Bt corn area 131,463 148,658 143,016 117,166 136,337 131,263
Total corn area planted in
the EU 9,720,000 9,660,000 9,564,000 9,250,000 8,590,000 8,570,000
Share of Bt corn in total
corn area 1.35% 1.54% 1.50% 1.27% 1.59% 1.53%

Husked 28,819
Milled/semi milled 247,165
Broken 225,530
Most of these quantities are imported at 0 duty.
WTO Quotas
The annual tariff quotas in respect of rice and broken rice imports listed below are linked to the 1996
GATT Agreement and are opened on January 1 each year. Full details of the application of these quotas
are given in Commission Implementing Regulation (EU) No 1273/2011.
Rice Type Quantity (MT) Duty
Wholly milled or semi-milled rice (CN
code 1006 30)
63,000 (of which 38,721 MT is allocated to
the United States)
0
Husked rice (CN code 1006 20) 1,634 15 % ad valorem
Broken rice (CN code 1006 40 00) 100,000 (of which 9,000 MT is allocated to
the United States)
Reduction of
30.77 %
Wholly milled or semi-milled rice (CN
code 1006 30)
40,216 (of which2,388 MT is allocated to the
United States)
0
Broken rice (CN code 1006 40 00) 31,788 0
Investigation into rice imports from Cambodia and Myanmar
Following a request from Italy, on March 16, 2018 the European Commission initiated a formal
investigation into duty-free rice imports from Cambodia and Myanmar. Italy has called for safeguard
measures for rice of the Indica variety originating in these two countries on the grounds that it is
imported in volumes and prices which cause serious difficulties to EU28 producers of similar or directly
competing products:

http://trade.ec.europa.eu/doclib/docs/2018/march/tradoc_156652.init-safe.en.C100-2018.pdf
CAP Reform
The last CAP Reform package was approved by the European Parliament in November 2013 and the
Council in December 2013. All aspects of the reform were applicable as from January 2014 with the
exception of the new direct payments structure (including “green” payments and additional support for
young farmers) which applied from 2015. Further to the CAP Reform, sorghum no longer has the
potential to be subject to intervention. Additionally, sectors in difficulty may also receive Voluntary
Coupled Support (VCS) to maintain typical production levels. Durum wheat is the only grain receiving
VCS based on MS’ decisions.
In February 2017 the European Commission launched a three month public consultation on the post-
2020 CAP. The online consultation asks stakeholders questions on how to simplify and modernize the
CAP with a view to achieving Agriculture Commissioner Hogan’s priorities of increased sustainable
production, generational renewal, and market resilience. The Commission published a Communication
on modernizing and simplifying the CAP entitled The Future of Food and Farming in November 2017
ahead of formal legislative proposals expected on May 29, 2018. The Multiannual Financial Framework
(MFF) proposal, setting inter alia the budget allocated to the CAP, should be published before the CAP
legislative proposals on May 2, 2018. The new CAP should be applicable from 2020.
For more information on CAP Reform, see E1710 “Post-2020 CAP consultation launched” , and
E17071 “Deal reached on simplification of Common Agricultural Policy could strengthen farming
sector’s role in supply chain”.
Pesticides
Plant protection products (PPPs) along with maximum residue levels (MRLs) and import tolerances
(ITs) are an increasingly important issue in the EU. EU regulations allow for the banning of certain
pesticides (carcinogens, mutagens, reproductive toxins, and endocrine disruptors) based solely on hazard
identification, rather than on the basis of scientific risk assessments. It is expected that a large number
of pesticides commonly used in the United States will be classified as hazards and banned in the EU.
Although a separate regulation requires the EU to establish MRLs and ITs through risk assessments, the
Commission has indicated that it does not intend to establish MRLs or ITs for banned substances.
Consequently, MRLs for substances banned in the EU may be lowered to trade-restrictive default
levels.
Under the EU’s renewal process, there are ongoing reviews of active substances and their associated
MRLs. Additionally, existing MRLs are also being reviewed through a process known as the Article 12
review. The first list below indicates substances undergoing MRL review under this Article 12 process.

The second list includes active substances, which are, or will soon be, up for renewal. It is important to
note that these lists are not all-inclusive. Due to the complexity of the renewal process and the
importance of the issue, stakeholders should actively engage early in these review processes by reaching
out to the substance manufacturer (i.e., applicant). Together with the applicant, they can ensure that the
necessary data are already available for the review or if trials for data collection are in progress or
should be initiated, especially if the substance is not used or authorized in the EU. It is highly
recommended to contact the assigned "Rapporteur Member State" (RMS) which will carry out the first
evaluation of the active substance and existing EU pesticide MRLs. Stakeholders are encouraged to
engage with FAS on substances and MRLs of importance to their commodities.
Upcoming reviews for MRLs on Barley, Corn, Oats, Rice, Sorghum, Rye and Wheat
1) Article 12 review
Active
substances with
MRLs
Barle
y
Cor
n
Oat
s
Ric
e
Sorghu
m
Ry
e
Whea
t RMS*
Start of
Data
Collectio
n
Expected
date of
RO**
Ampelomyces
quisqualis
x x x x FR Statement 04/21/20
16
Bispyribac x x IT 07/21/20
17
12/15/20
17
Chlorantranilipr
ole
x x x x x x x IE 12/15/20
17
10/30/20
18
Chlorsulfuron x x x EL(PL
)
07/15/20
18
---
Diclofop x x FR(PT
)
03/15/20
18
---
Flubendiamide x x EL 09/15/20
18
---
Fluopyram x x x x x x DE(A
T)
10/13/20
17
11/27/20
18
Fluxapyroxad x x x x x x x UK(F
R)
06/15/20
18
---
Halauxifen-
methyl
x UK Statement 11/22/20
17
Hexythiazox x x x FI 12/21/20
16
07/06/20
18
Imidacloprid x x x x x DE 05/02/20
16
06/05/20
18

Active
substances with
MRLs
Barle
y
Cor
n
Oat
s
Ric
e
Sorghu
m
Ry
e
Whea
t RMS*
Start of
Data
Collectio
n
Expected
date of
RO**
Laminarin x x x x x x BE Statement 04/21/20
16
Penflufen x x x x x x x UK
(PL)
01/15/20
18
12/25/20
18
Prochloraz x x IE 05/23/20
16
05/15/20
18
Sedaxane x x x x x x FR 11/15/20
17
11/05/20
18
Sodium
Hypochlorite
x x x x x x x NL(IE) 03/15/20
18
---
Sulfoxaflor x x x IE Statement 11/22/20
17
Spiromesifen x UK(IT
)
12/10/20
17
10/26/20
18
Tembotrione x AT 09/25/20
17
06/20/20
18
*RMS: Rapporteur Member State
**Expected date of Reasoned Opinion by the European Food Safety Authority (EFSA)
2) Active substances up for review
Last day of application 04/31/2018
Fenbuconazole SI/UK
Pyridaben CZ/BE
Zinc phosphide AT/DE
Last day of application 05/31/2018
Carboxin HR / LV
Cyproconazole IE/EE
Diclofop PT/FR

Flutriafol SK/UK
Hexythiazox FI/SE
Metaldehyde PL/DE
Myclobutanil UK/ES
Tebufenozide ES/DE
Last day of application 07/31/2018
Bispyribac IT/PT
Last day of application 12/31/2018
Azoxystrobin UK / NO
Fluazifop-P FR / IT
Fluquinconazole UK / SK
Fluroxypyr SE / SI
Imazalil (aka enilconazole) NL / BE
Kresoxim-methyl SE / FR
Oxyfluorfen ES / HU
Prochloraz BE / DE
Tefluthrin HU / DK