Embed Size (px)
Citation preview
Security Level:Limited distribution
ETSI Workshop 20150603-05
Methods to estimate future Radio Access Network (RAN) deployment and energy consumption. Case study European network p y preducing energy consumption while supporting traffic evolution.
www.huawei.com
Tomas Edler
Rev B
o as d eSenior Expert Energy EfficiencyHuawei Technologies Sweden
HUAWEI TECHNOLOGIES CO., LTD.
Content
Introduction RAN (Radio Access Network)
evolution energy assessment RAN Evolution studies examples European theoretical country RAN 2010-2020
European country RAN 2014-2020
Huawei global trends study 2010-2030
Proposal for ETSI EE EEPS
HUAWEI Page 2
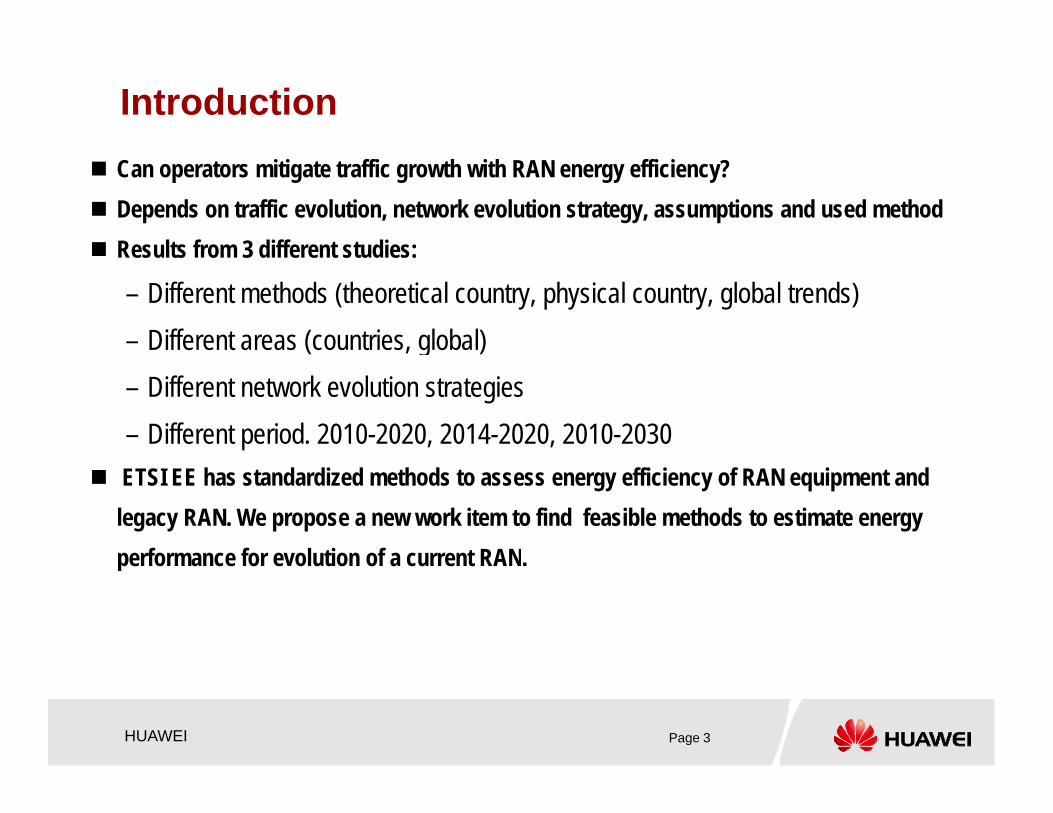
Introduction Can operators mitigate traffic growth with RAN energy efficiency? Depends on traffic evolution, network evolution strategy, assumptions and used method Results from 3 different studies: Results from 3 different studies:
– Different methods (theoretical country, physical country, global trends)– Different areas (countries, global)( g )– Different network evolution strategies– Different period. 2010-2020, 2014-2020, 2010-2030
ETSI EE has standardized methods to assess energy efficiency of RAN equipment and legacy RAN. We propose a new work item to find feasible methods to estimate energy performance for evolution of a current RANperformance for evolution of a current RAN.
HUAWEI Page 3
RAN Evolution Assessment impact factors p
Spectrum Strategyp gy Technology Roadmaps (Standards, Radio concepts, features) Traffic Evolution (services, devices) Area (Topology, Population distribution..)Area (Topology, Population distribution..) RAN/Base Station (Base Station types: Macro/HetNET, Cloud-RAN, Site: Site efficiency...) RAN capacity utilization RAN capacity utilization Known and unknown (disruptive) factors
– Historic: SMS, Smartphones,
Future?: IoT 8K3D Self driven cars Augmented reality Holographic Video new– Future?: IoT, 8K3D, Self driven cars, Augmented reality, Holographic Video, new
5G services....
HUAWEI Page 4
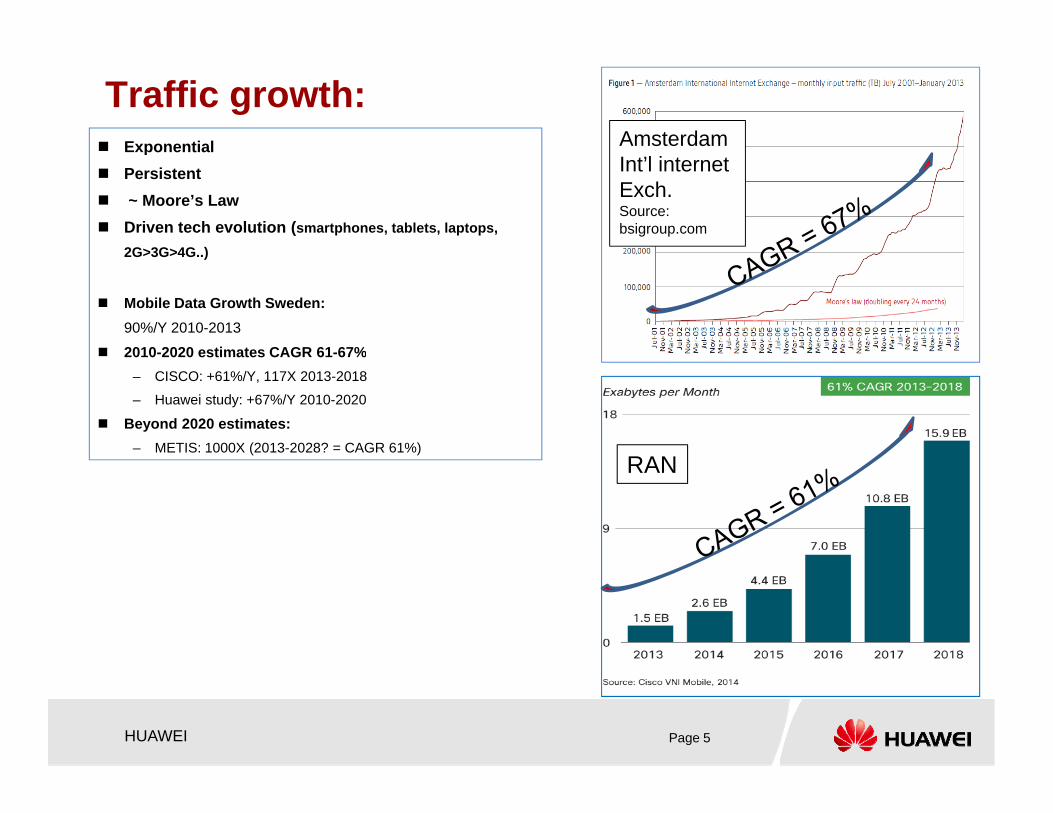
Traffic growth: Exponential Amsterdam Exponential Persistent ~ Moore’s Law Driven tech evolution (smartphones, tablets, laptops,
2G>3G>4G )
Int’l internetExch.Source: bsigroup.com
2G>3G>4G..)
Mobile Data Growth Sweden:90%/Y 2010-2013
2010-2020 estimates CAGR 61-67% 2010 2020 estimates CAGR 61 67%– CISCO: +61%/Y, 117X 2013-2018
– Huawei study: +67%/Y 2010-2020
Beyond 2020 estimates:– METIS: 1000X (2013-2028? = CAGR 61%)
RANRAN
HUAWEI Page 5
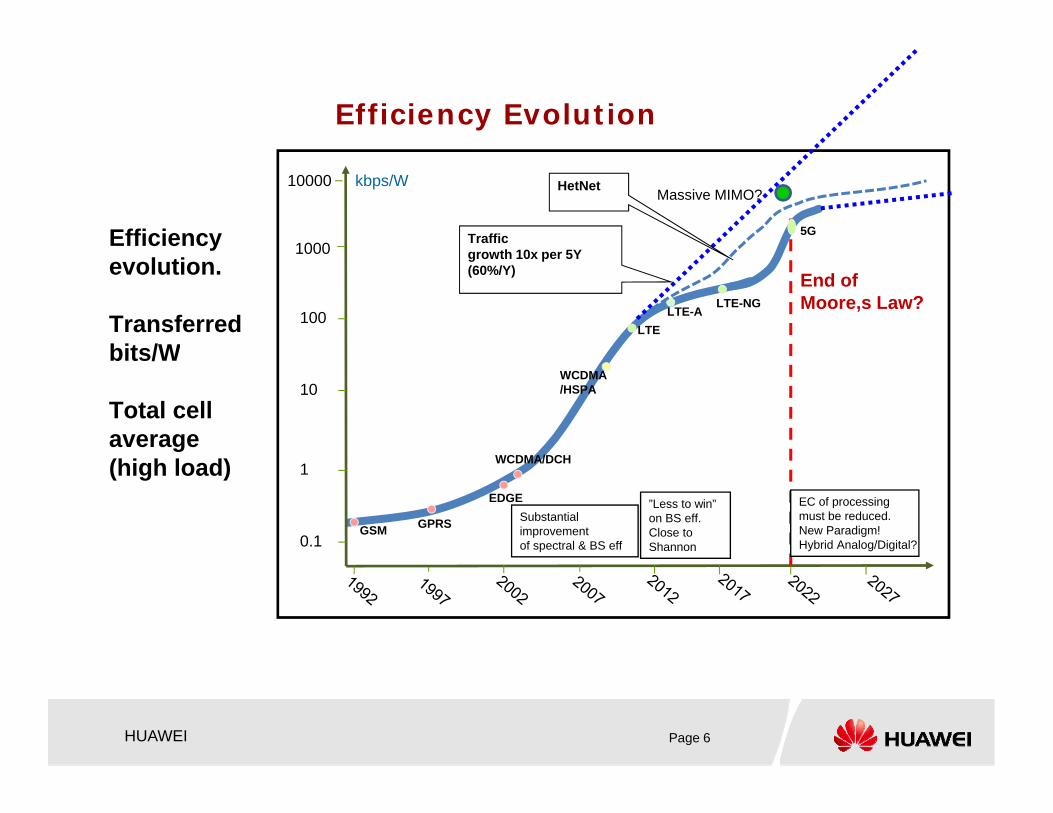
Efficiency Evolution
kbps/W
1000Trafficgrowth 10x per 5Y
Efficiency
Massive MIMO?10000
5G
HetNet
100LTE
LTE-ALTE-NG
1000 growth 10x per 5Y (60%/Y)evolution.
Transferred bits/W
End of Moore,s Law?
10
WCDMA/DCH
WCDMA/HSPA
bits/W
Total cell average
0.1
1
GSM
EDGE
WCDMA/DCH
GPRS Substantial improvement of spectral & BS eff
”Less to win” on BS eff.Close to Shannon
(high load)EC of processing must be reduced.New Paradigm!Hybrid Analog/Digital?
HUAWEI Page 6
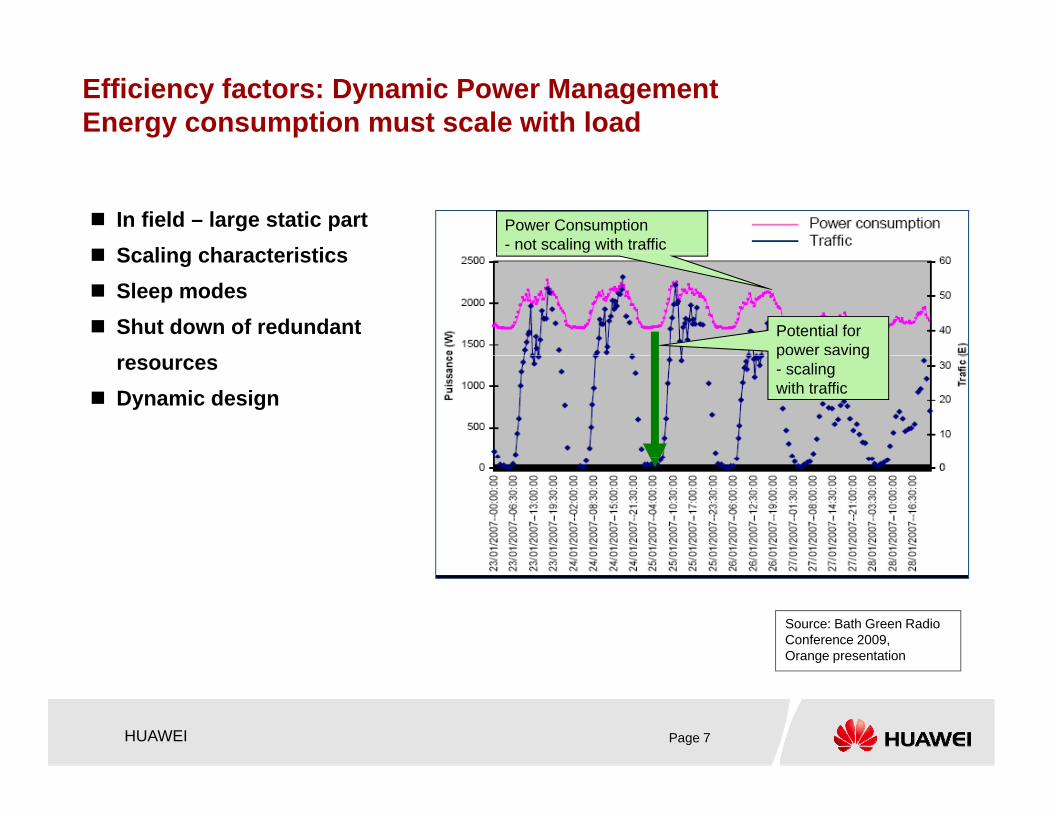
Efficiency factors: Dynamic Power ManagementEnergy consumption must scale with load
Power Consumption- not scaling with traffic
In field – large static part Scaling characteristics
Potential for power saving
g Scaling characteristics Sleep modes Shut down of redundant
p g- scaling with traffic
resources Dynamic design
Source: Bath Green Radio Conference 2009, Orange presentation
HUAWEI Page 7
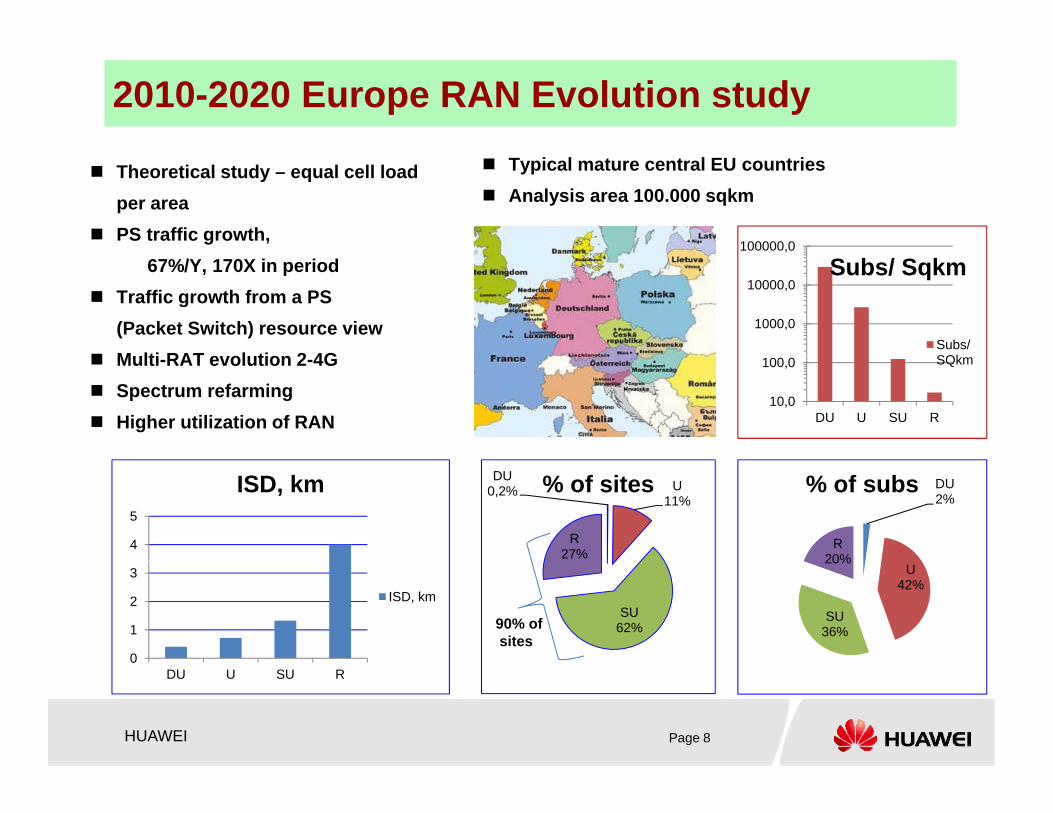
2010-2020 Europe RAN Evolution study
100000,0
Typical mature central EU countries Analysis area 100.000 sqkm
Theoretical study – equal cell load per area
PS traffic growth,
1000,0
10000,0Subs/ Sqkm
Subs/ SQk
67%/Y, 170X in period Traffic growth from a PS
(Packet Switch) resource view M lti RAT l ti 2 4G
10,0
100,0
DU U SU R
SQkm Multi-RAT evolution 2-4G Spectrum refarming Higher utilization of RAN
DU0,2% U
11%
R27%
% of sites DU2%
R20%
% of subs
4
5
ISD, km
SU62%
U42%
SU36%
20%
0
1
2
3
ISD, km
90% ofsites
HUAWEI Page 8
DU U SU R
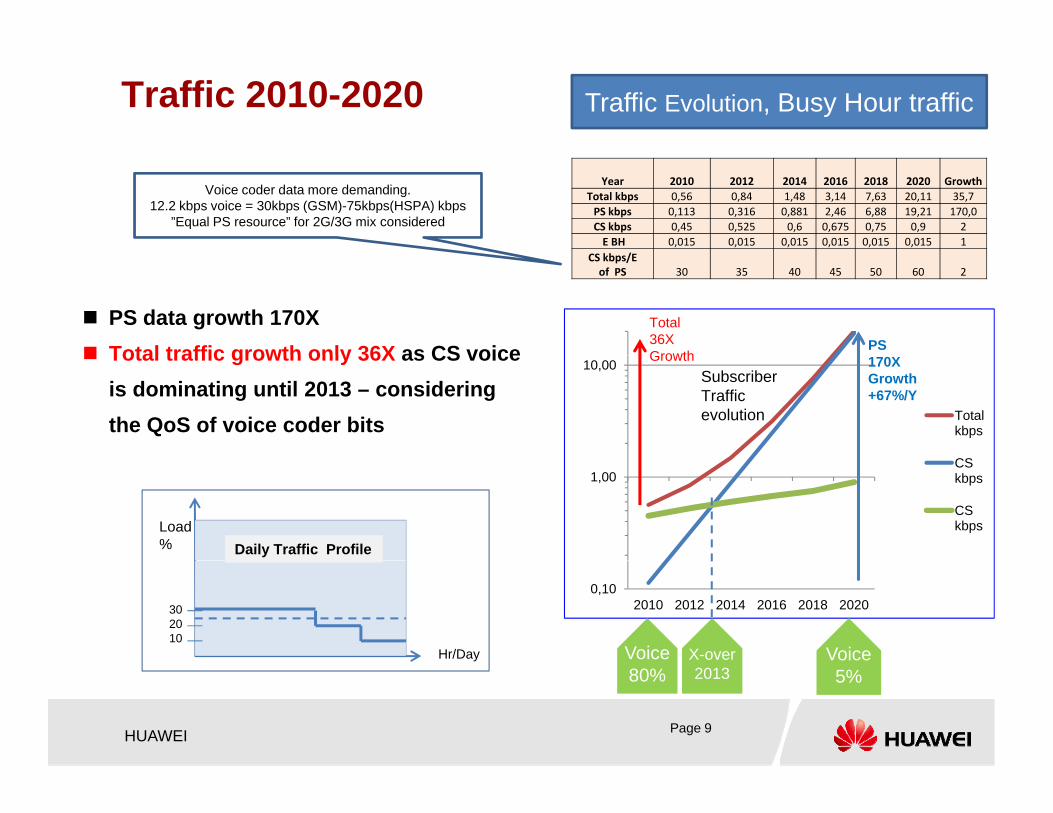
Traffic 2010-2020 Traffic Evolution, Busy Hour traffic
Year 2010 2012 2014 2016 2018 2020 GrowthTotal kbps 0,56 0,84 1,48 3,14 7,63 20,11 35,7PS kbps 0,113 0,316 0,881 2,46 6,88 19,21 170,0CS kbps 0,45 0,525 0,6 0,675 0,75 0,9 2E BH 0,015 0,015 0,015 0,015 0,015 0,015 1
/
Voice coder data more demanding.12.2 kbps voice = 30kbps (GSM)-75kbps(HSPA) kbps
”Equal PS resource” for 2G/3G mix considered
CS kbps/E of PS 30 35 40 45 50 60 2
PS Total36XGrowth
PS data growth 170X Total traffic growth only 36X as CS voice
10,00
Total kbps
CS
SubscriberTraffic evolution
170XGrowth+67%/Y
Growth Total traffic growth only 36X as CS voice is dominating until 2013 – considering the QoS of voice coder bits
1,00CS kbps
CS kbpsLoad
% Daily Traffic Profile
0,102010 2012 2014 2016 2018 2020
Voice Voice X-over
302010
Hr/Day
HUAWEI Page 9
80% 5%2013
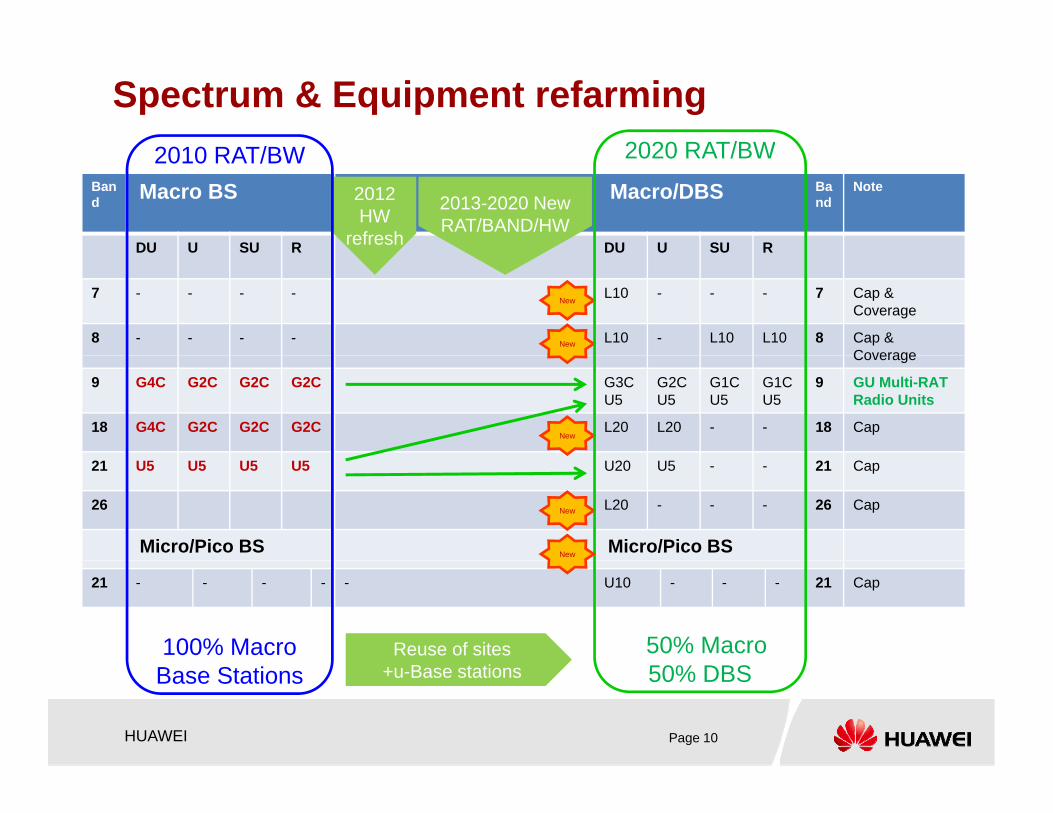
Spectrum & Equipment refarming2010 RAT/BW 2020 RAT/BW
Band Macro BS Macro/DBS Ba
ndNote
DU U SU R DU U SU R
2012 HW
refresh
2013-2020 New RAT/BAND/HW
2010 RAT/BW 2020 RAT/BW
7 - - - - L10 - - - 7 Cap & Coverage
8 - - - - L10 - L10 L10 8 Cap & Coverage
New
New
Coverage
9 G4C G2C G2C G2C G3CU5
G2CU5
G1CU5
G1CU5
9 GU Multi-RAT Radio Units
18 G4C G2C G2C G2C L20 L20 - - 18 CapNew
21 U5 U5 U5 U5 U20 U5 - - 21 Cap
26 L20 - - - 26 Cap
Micro/Pico BS Micro/Pico BS
New
New
21 - - - - - U10 - - - 21 Cap
100% Macro 50% Macro Reuse of sites
HUAWEI Page 10
Base Stations 50% DBS+u-Base stations
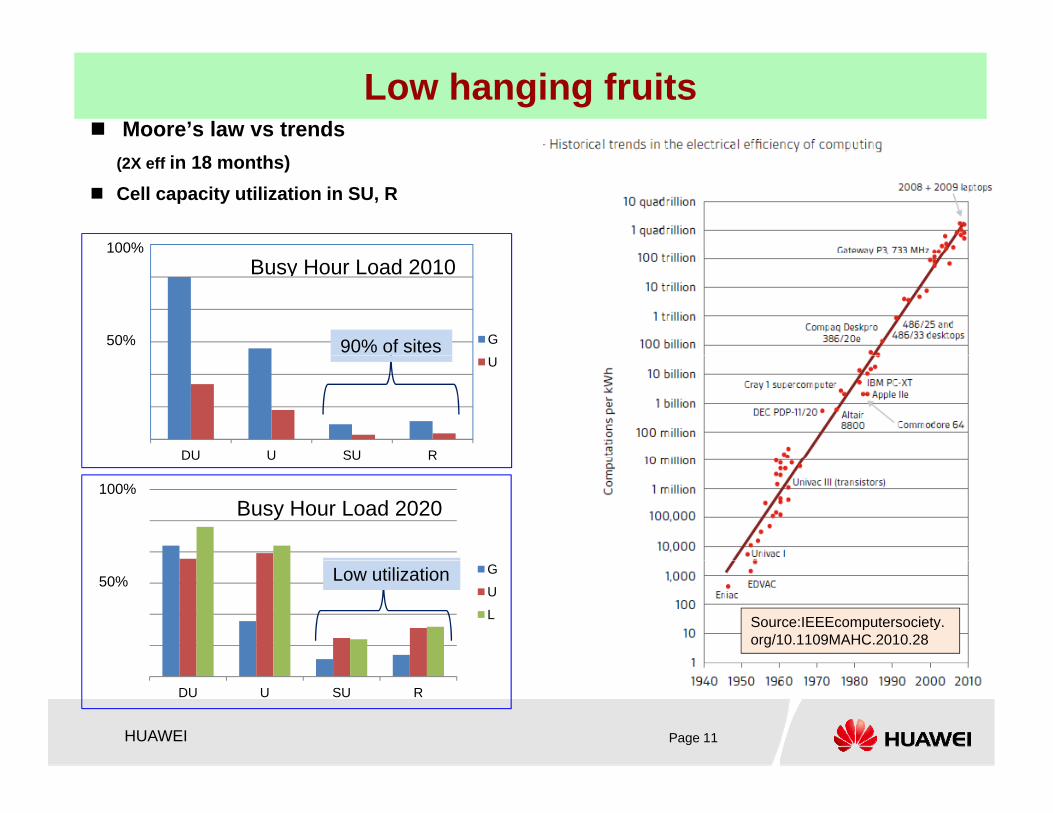
Low hanging fruits Moore’s law vs trends
(2X eff in 18 months) Cell capacity utilization in SU, R
100%
G
Busy Hour Load 2010
50% 90% of sites
DU U SU R
U
DU U SU R
Busy Hour Load 2020 100%
Source:IEEEcomputersociety.org/10.1109MAHC.2010.28
G
U
L
50% Low utilization
HUAWEI Page 11
DU U SU R
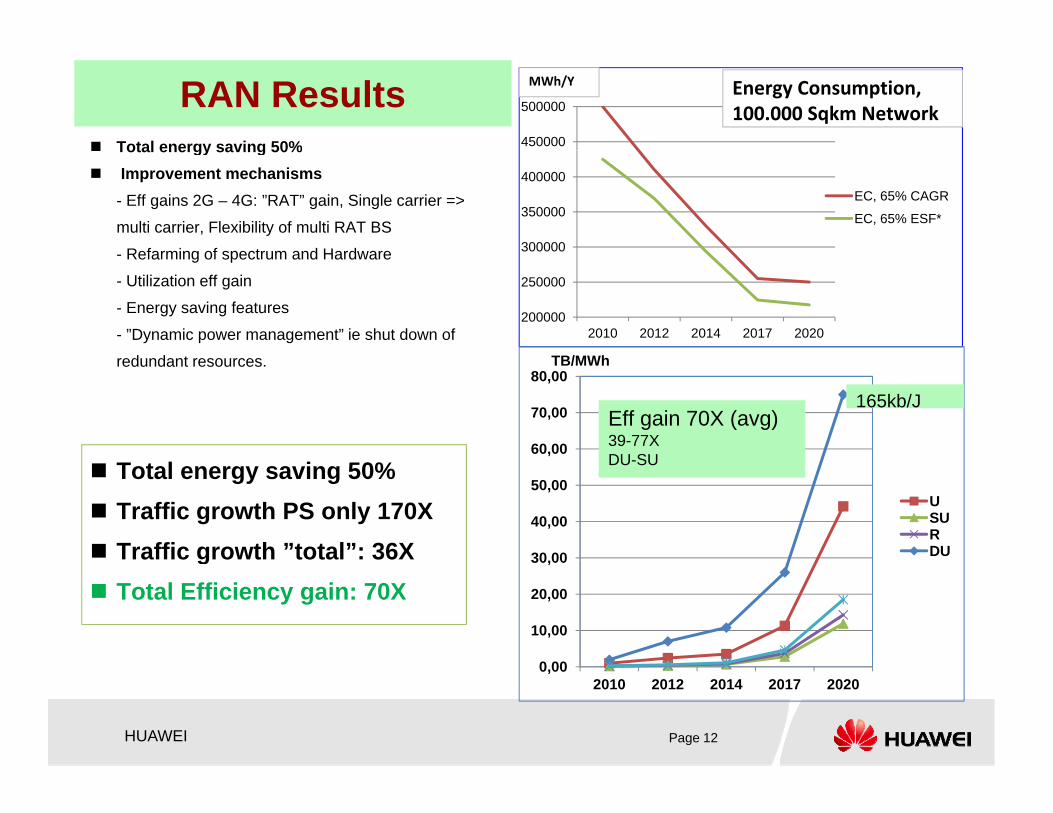
RAN Results Total energy saving 50% 450000
500000
MWh/Y Energy Consumption, 100.000 Sqkm Network
Total energy saving 50% Improvement mechanisms
- Eff gains 2G – 4G: ”RAT” gain, Single carrier =>
multi carrier, Flexibility of multi RAT BS
Refarming of spectrum and Hardware 300000
350000
400000EC, 65% CAGR
EC, 65% ESF*
- Refarming of spectrum and Hardware
- Utilization eff gain
- Energy saving features
- ”Dynamic power management” ie shut down of
d d
200000
250000
2010 2012 2014 2017 2020
TB/MWhredundant resources.
60,00
70,00
80,00
165kb/JEff gain 70X (avg)39-77XDU SU
TB/MWh
Total energy saving 50% Traffic growth PS only 170X Traffic growth ”total”: 36X 30 00
40,00
50,00USU RDU
DU-SU
g Total Efficiency gain: 70X
0 00
10,00
20,00
30,00
HUAWEI Page 12
0,002010 2012 2014 2017 2020
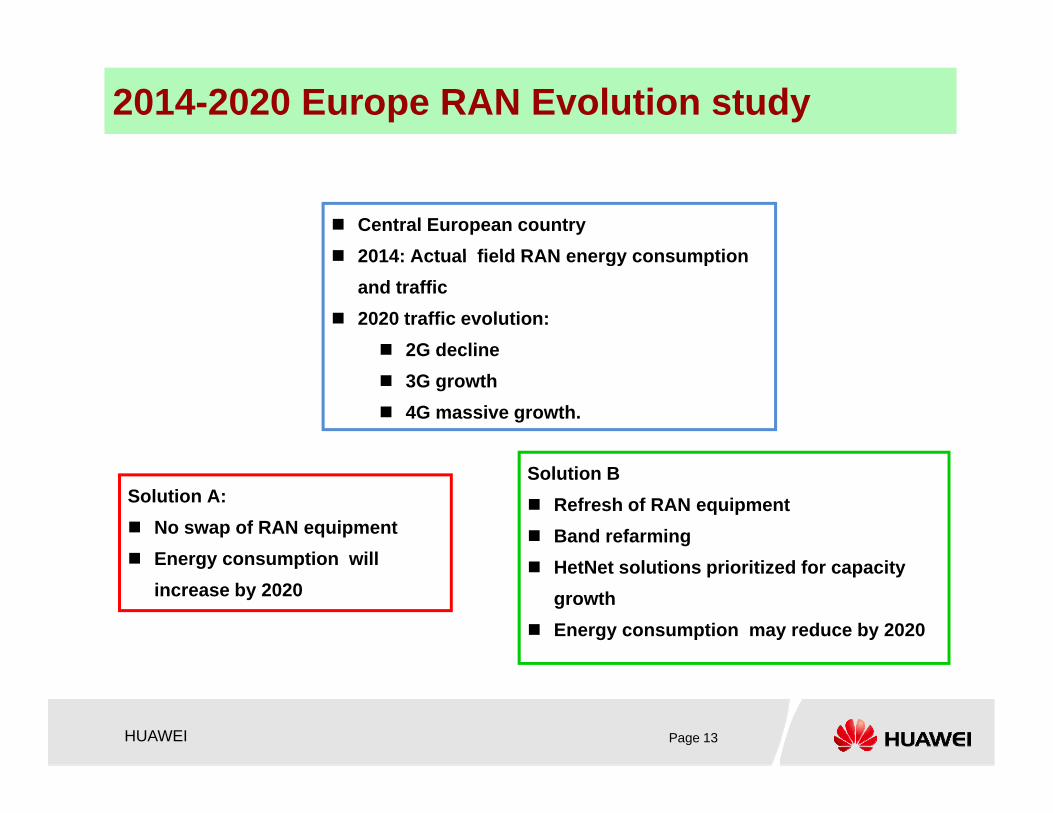
2014-2020 Europe RAN Evolution study
Central European country 2014: Actual field RAN energy consumption 2014: Actual field RAN energy consumption
and traffic 2020 traffic evolution:
2G decline2G decline 3G growth 4G massive growth.
Solution A: No swap of RAN equipment Energy consumption will
Solution B Refresh of RAN equipment Band refarming
H tN t l ti i iti d f it Energy consumption willincrease by 2020
HetNet solutions prioritized for capacity growth
Energy consumption may reduce by 2020
HUAWEI Page 13
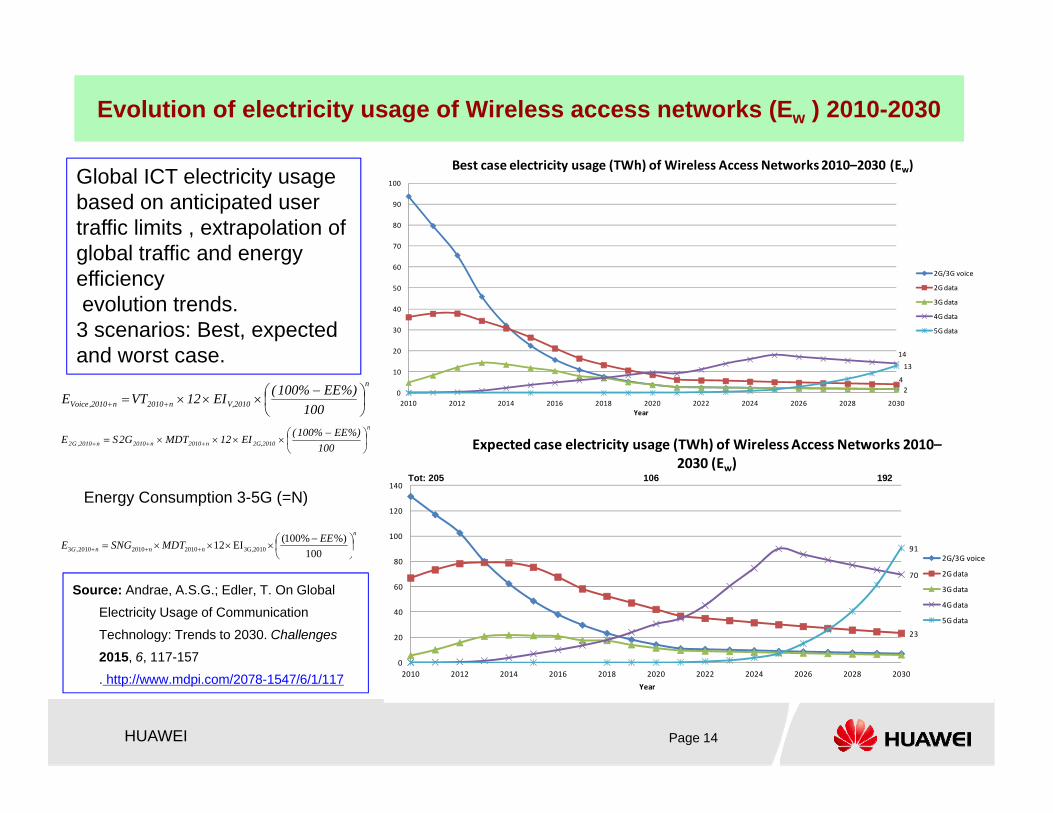
Evolution of electricity usage of Wireless access networks (Ew ) 2010-2030
70
80
90
100
Best case electricity usage (TWh) of Wireless Access Networks 2010–2030 (Ew)Global ICT electricity usage based on anticipated user traffic limits , extrapolation of global traffic and energy
1420
30
40
50
602G/3G voice
2G data
3G data
4G data
5G data
global traffic and energy efficiencyevolution trends. 3 scenarios: Best, expected and worst case
n
2G,2010n2010n2010n2010,G2 100%)EE%100(EI12MDTG2SE
n
V,2010n2010n2010,Voice 100%)EE%100(EI12VTE
42
14
13
0
10
2010 2012 2014 2016 2018 2020 2022 2024 2026 2028 2030Year
Expected case electricity usage (TWh) of Wireless Access Networks 2010–( )
and worst case.
n
nnnGEEMDTSNGE
100%)%100(EI12 3G,2010201020102010,3 91
80
100
120
140
2030 (Ew)
2G/3G voice
Energy Consumption 3-5G (=N)Tot: 205 106 192
Source: Andrae, A.S.G.; Edler, T. On Global
Electricity Usage of Communication
Technology: Trends to 2030. Challenges
2015, 6, 117-157
23
70
0
20
40
60
80 2G/3G voice
2G data
3G data
4G data
5G data
HUAWEI Page 14
, ,
. http://www.mdpi.com/2078-1547/6/1/11702010 2012 2014 2016 2018 2020 2022 2024 2026 2028 2030
Year
Proposal for ETSI EE EEPS
New WI e Methods how to deploy and assess an energy efficient
future RAN, including expected impact of evolution of traffic, services and networks
First task: Review current methods, studies and results to find a best practice for prediction.p p
Result presented as a Technical Report Second task: Define a guideline standard.
HUAWEI Page 15
Thank YouThank You
www.huawei.com
www.huawei.com
HUAWEI TECHNOLOGIES CO., LTD.