Embed Size (px)
Citation preview

CELLULAR & MOLECULAR BIOLOGY LETTERS http://www.cmbl.org.pl
Received: 10 August 2010 Volume 16 (2011) pp 101-113 Final form accepted: 10 December 2010 DOI: 10.2478/s11658-010-0043-z Published online: 27 December 2010 © 2010 by the University of Wrocław, Poland
* Author for correspondence. e-mail: [email protected], phone: +91-22-30818807, fax: +91-22-30813000
Abbreviations used: cDNA – complementary DNA; Ct – cycle threshold; dFdCTP – 2’,2’-difluorodeoxycytidine 5’-triphosphate (gemcitabine triphosphate); DMEM – Dulbecco’s modified Eagle’s medium; DMSO – dimethyl sulfoxide; E26 – avian erythroblastosis virus; Ets-1 – E26 transformation specific sequence-1; FBS – fetal bovine serum; GAPDH – glyceraldehydes-3-phosphate dehydrogenase; MDR1 – multiple drug resistance-1; MMP1 – matrix metalloproteinase-1 (collagenase-1); MMP3 – matrix metallopeptidase-1 (stromelysin-1); MTT – 3-(4,5-dimethylthiazol-2-yl)-2,5-diphenyltetrazolium bromide; PDAC – pancreatic ductal adenocarcinoma; RT-qPCR – reverse transcriptase real-time quantitative PCR; siRNA – small interfering RNA; uPA – urokinase-type plasminogen activator; v-ets – viral transforming gene of E26
Research article
Ets-1 EXPRESSION AND GEMCITABINE CHEMORESISTANCE IN PANCREATIC CANCER CELLS
AMIT KHANNA1, 3, KULANDAIVELU MAHALINGAM3, DEBARSHI
CHAKRABARTI2 and GIRIDHARAN PERIYASAMY1,* 1Department of High Throughput Screening and Biotechnology, 2Department of Biomarker Discovery, Piramal Life Sciences Ltd., 1A, Nirlon Complex,
Goregaon-E, Mumbai 400063, Maharashtra, India, 3School of Biotechnology, Chemical and Bio-Medical Engineering,
VIT University, Vellore, Tamil Nadu, India Abstract: Gemcitabine, a novel pyrimidine nucleoside analog, has become the standard chemotherapeutic agent for pancreatic cancer patients. The clinical impact of gemcitabine remains modest owing to the high degree of inherent and acquired resistance. There are various lines of evidence that confirm the role of Ets-1, a proto-oncoprotein, in tumor invasion, progression, and chemoresistance. This study examines a hypothesis that implicates Ets-1 in the development of gemcitabine-resistance in pancreatic cancer cells. Ets-1 protein expression was assessed in parental pancreatic cancer cells and their gemcitabine-resistant clones. Western blot analysis revealed elevated levels of Ets-1 protein expression in gemcitabine-resistant PANC1GemRes (4.8-fold increase; P < 0.05), MIA PaCa2GemRes (3.2-fold increase; P < 0.05), and Capan2GemRes (2.1-fold increase; P < 0.05) cells as compared to their parental counterparts. A time

Vol. 16. No. 1. 2011 CELL. MOL. BIOL. LETT.
102
course analysis was conducted to determine the change in Ets-1 expression in the parental cells after incubation with gemcitabine. Reverse transcriptase quantitative real-time PCR (RT-qPCR) and Western blot analysis revealed a significant increase in Ets-1 expression. All the three parental cells incubated with gemcitabine showed elevated Ets-1 protein expression at 6 h. By 24 h, the expression level had decreased. Using small interfering RNA (siRNA) against Ets-1 in gemcitabine-resistant cells, we demonstrated a reversal in gemcitabine chemosensitivity and also detected a marked reduction in the expression of the Ets-1 target genes MMP1 and uPA. Our novel finding demonstrates the significance of Ets-1 in the development of gemcitabine chemoresistance in pancreatic cancer cells. Based on these results, a new siRNA-based therapeutic strategy targeting the Ets-1 genes can be designed to overcome chemoresistance. Key words: Gemcitabine, Ets-1, MMP1, uPA, PANC1, MIA PaCa2, Capan2 INTRODUCTION Pancreatic ductal adenocarcinoma (PDAC) is the most common pancreatic neoplasm, accounting for >85% of all pancreatic tumors [1]. Late detection, poor prognosis, and invasiveness at an early stage with aggressive metastasis are some of its characteristics. The majority of patients suffering from pancreatic cancer have a surgically unresectable tumor by the time of diagnosis. Moreover, pancreatic cancer is largely resistant to chemotherapy. Gemcitabine, a pyrimidine-based anti-metabolite, provides a modest survival benefit to pancreatic cancer patients [2, 3]. Gemcitabine is metabolized intracellularly to gemcitabine triphosphate (dFdCTP) and gets incorporated into the DNA, resulting in the induction of apoptosis due to the inhibition of DNA synthesis [4]. The emergence of drug resistance poses a major challenge to successful cancer chemotherapy. Tumor cells acquire drug resistance by various mechanisms, including alterations in drug transport, targets and metabolism, or in the genes regulating cell survival. Clinically, the impact of gemcitabine remains modest due to the development of chemoresistance. Various cellular mechanisms of resistance to gemcitabine have evolved over the last few years [5]. Ets-1 (E26 transformation-specific sequence-1) is a proto-oncoprotein that belongs to the Ets protein family of transcription factors. The Ets sequence was first detected in E26, an avian erythroblastosis virus [6]. It was later discovered that the viral (v-ets) gene is a homolog of the c-Ets-1 gene found in humans. The Ets-1 transcription factor contains a conserved DNA-binding domain, comprising a sequence of 85 amino acids, which forms a winged helix-turn-helix motif. The helix-turn-helix domain of Ets-1 binds to specific purine-rich DNA sequences of the target genes and controls a wide range of functions [7, 8]. Ets-1 regulates the expression of many known target genes involved in the degradation of the extracellular matrix and the promotion of migration and angiogenesis [9, 10]. It plays an important role in cell proliferation, apoptosis, transformation, differentiation, angiogenesis and hematopoiesis. The Ets-1

CELLULAR & MOLECULAR BIOLOGY LETTERS
103
transcription factor is emerging as a significant determinant of chemoresistance in a variety of tumors. Ets-1 overexpression and the emergence of chemoresistance toward a wide range of structurally unrelated anti-cancer agents in various types of tumors has been well documented [11]. The aim of this study was to gain an insight into the cooperative role of Ets-1 in the development of gemcitabine chemoresistance in pancreatic cancer cells. The hypothesis was tested using small interfering RNA (siRNA) inhibition of Ets-1 expression in gemcitabine-resistant pancreatic cancer cells. To the best of our knowledge, this the first report implicating Ets-1 in the gemcitabine chemoresistance of pancreatic cancer cells. MATERIALS AND METHODS Materials The cell culture media and fetal bovine serum (FBS) were respectively obtained from Sigma (St. Louis, MO, USA) and Gibco (Paisley, Scotland, UK). Gemcitabine was procured from Eli Lilly Pharmaceuticals (Indianapolis, IN, USA). For the immunoblot analysis, mouse monoclona anti-Ets-1 antibody (sc-56674), mouse monoclonal anti-β-actin antibody (sc-81178), and mouse monoclonal anti-MMP1 antibody (sc-21731) were purchased from Santa Cruz Biotechnology (Santa Cruz, CA, USA), and mouse monoclonal anti-uPA antibody (ab28230) was purchased from Abcam (Cambridgeshire, UK). The BCA Assay Kit was obtained from Sigma. All other chemicals were of analytical grade and were purchased from Sigma, unless otherwise specified. The cell culture and development of gemcitabine-resistant clones The three pancreatic adenocarcinoma cell lines PANC1 (CRL1469), MIA PaCa2 (CRL1420), and Capan2 (HTB80) were obtained from the American Type Culture Collection (ATCC) (Manassas, VA, USA). The cells were maintained in Dulbecco’s Modified Eagle’s Medium (DMEM) supplemented with 10% FBS, 100 U/ml penicillin, and 100 mg/ml streptomycin. The cells were grown in 75-cm2 culture flasks, maintained in a humidified (37ºC, 5% CO2) incubator, and passaged upon reaching 80% confluence. Gemcitabine-resistant clones of PANC1, MIA PaCa2 and Capan2 were developed as described previously [12]. Gemcitabine was applied in 10 to 5,000 nM dose increments to the parental cells for the stepwise selection of resistant cells. The 100-fold gemcitabine resistant cells were designated PANC1GemRes, MIA PaCa2GemRes and Capan2GemRes. Small interfering RNA transfection The gemcitabine-resistant pancreatic cancer cells were transfected with 50 nM of Ets-1-specific Stealth siRNA (Invitrogen, Carlsbad, CA, USA). The details of the siRNA are: Ets-1: sense, 5’-CGAAUGAACUGUGGUUUCCAGUCCA-3’ Ets-1: antisense, 5’-UGGACUGGAAACCACAGUUCAUUCG-3’

Vol. 16. No. 1. 2011 CELL. MOL. BIOL. LETT.
104
A Fluorescent Oligo control was used as an indicator of transfection efficiency (BLOCK-iT™; Cat. no. 2013; Invitrogen). Briefly, 5 × 10⁴ cells per well were seeded in six-well plates with 2 ml antibiotic-free DMEM medium supplemented with 5% FBS. After appropriate incubation, the cells were overlaid with siRNA duplex-Lipofectamine 2000 reagent (Invitrogen) containing Ets-1 siRNA and Lipofectamine RNAiMAX, and were allowed to grow for 24 h for efficient transfection. All of the assays were performed 48 h after transfection. Cell proliferation assay Cell growth was measured using the 3-(4-, 5-dimethylthiazol-2-yl)-2, 5-diphenyl tetrazolium bromide (MTT) method [13]. Cells were seeded at the appropriate concentrations to prevent confluence throughout the experiment. After a 24 h incubation period, the cells were treated with serial concentrations of gemcitabine. An equal concentration of the vehicle (never exceeding 0.1%) was used as a control. After a 72 h incubation period, 10 µl aliquots of MTT (final concentration 0.5 mg/ml) were added to each well, and the plates were incubated for 4 h at 37ºC. Formazan crystals were solubilized by adding 100 μl of 20% sodium dodecyl sulfate (SDS) in H2O followed by incubation overnight at 37ºC. The extent of MTT reduction was measured using a Tecan Sapphire multi-fluorescence microplate reader (Tecan Germany GmbH, Carlsheim, Germany) at 595 nm. DMSO-treated control cells were considered to have a cell viability of 100%. The average number of viable cells at different drug concentrations was expressed as a percentage of the control. Dose-response curves were generated by plotting the percentage of cell proliferation against gemcitabine concentration (log values) to determine the antiproliferative effect of the drug on the cells. In order to determine the degree of acquired resistance to gemcitabine, the resistance index was calculated using the following formula:
Western blot analysis Western blots were performed as described previously [14]. The cells (2 ×10⁶) were harvested and rinsed with PBS. Cell extracts were prepared using a lysis buffer consisting of 20 mmol/l Tris-HCl (pH 7.5), 0.1% Triton-X, 0.5% sodium deoxycholate, 1 mM phenylmethylsulfonyl fluoride, 10 µg/ml aprotinin and 10 µg/ml leupeptin, and then centrifuged at 12,000 g at 4ºC. The total protein concentration was measured using the BCA assay. Cellular extracts containing 50 µg total protein were electrophoresized on 10% SDS-PAGE, and the proteins were transferred electrophoretically to polyvinylidene difluoride membranes (Invitrogen). After blocking with PBS containing 0.2% casein for 1 h at room temperature, the membranes were incubated with the primary antibody (1:1000 dilution) in PBS containing 0.2% Tween-20 overnight at 4ºC. The Vecstain ABC Kit (Vector Laboratories, Burlingame, CA) and DAB liquid substrate

CELLULAR & MOLECULAR BIOLOGY LETTERS
105
(Sigma) were used for chromogenic detection, according to the manufacturer’s instructions. The band intensities were quantified using Image-Pro Plus 4.0 (Media Cybernetics, Silver Spring, MD, USA) and normalized to those of actin. The blotting experiments were performed in triplicate and the mean densitometric values (± SD) were recorded. Quantitative real-time PCR analysis for gene expression The total RNA was extracted using the RNeasy Mini Kit (Qiagen, Hilden, Germany) with on-column DNase I treatment, according to the manufacturer’s protocol. The purity and quantity of the RNA was determined using the Nanodrop ND-1000 (Nanodrop Inc, Wilmington, DE, US). RNA (2 µg) was reverse transcribed using Superscript III Reverse Transcriptase (Invitrogen) and oligo(dT)13-18 primers (Invitrogen), according to the manufacturer’s protocol. The resulting cDNA was appropriately diluted and used for the RT-qPCR assays. Quantitation of Ets-1 was performed following co-amplification and normalization with glyceraldehydes-3-phosphate-dehydrogenase (GAPDH) as an internal control. Primers for Ets-1 and GAPDH were designed according to the appropriate GenBank sequences (Accession numbers: NM_001143820 and NM_002046). Primers specific for the amplification of the transcripts were chosen using the Primer Select software (DNASTAR, Inc, Madison, US), and the specificity was confirmed by carrying out a detailed BLAST search. The details of the primer pairs are as follows: Ets-1: sense, 5’-AGT GGT GAG GCA AGG ACC TA-3’ Ets-1: antisense, 5’-ATC CCA AAA GGG GTA GCA AG-3’ GAPDH: sense, 5’-CCA CCC ATG GCA AAA TTC CAT GGC A-3’ GAPDH: antisense, 5’-TCT AGA CGG CAG GTC AGG TCC ACC-3’ All of the RT-qPCR reactions were performed in a final volume of 20 µl, with 200 nM of each primer, 10 µl of Power SYBR Green PCR Master Mix (Applied Biosystems, Foster City, CA, USA), and a reverse transcription reaction equivalent to 2 ng RNA. The PCR cycle was carried out in an Eppendorf Realplex instrument (Eppendorf, Hamburg, Germany) and consisted of a 10-min activation of Taq polymerase at 95ºC, followed by denaturation of the template DNA at 95ºC for 15 s. The read-out was incorporated at 60ºC for 30 s. The denaturation and the annealing steps were carried out for 40 cycles to determine the cycling threshold (Ct) values for all of the analyzed genes. The melting curve analysis was carried out after 40 PCR cycles to determine non-specific products or primer-dimer amplification. The Ct values for the target genes in all of the samples were normalized using a GAPDH transcript abundance, and the relative fold-change values were calculated using the ΔΔ Ct method as described earlier [15]. Statistical analysis The data was expressed as means ± SD. The data analysis was performed using ANOVA, the unpaired t test and the Mann-Whitney U test when appropriate, using GraphPad Prism 3.03 (GraphPad Software, Inc, CA, USA). P < 0.05 was considered statistically significant.

Vol. 16. No. 1. 2011 CELL. MOL. BIOL. LETT.
106
RESULTS Development of gemcitabine-resistant cells and the antiproliferative effect of gemcitabine The antiproliferative effect of gemcitabine on sensitive and gemcitabine-resistant pancreatic cancer cells was determined. The IC50 values, defined as the drug concentration at which 50% of the cells are viable, were calculated from the gemcitabine logarithmic cytotoxicity curves for the parental cells and their respective resistant daughter cells. The PANC1 cells demonstrated the maximum resistance towards gemcitabine with an IC50 of 50 ± 0.54 nM, followed by MIA PaCa2 (IC50 = 40 ± 0.98 nM). The Capan2 cells were the most susceptible to gemcitabine, with an IC50 of 12 ± 1.02 nM. The gemcitabine-resistant cells demonstrated a 100-fold higher resistance index (R.I) towards gemcitabine than to their respective parental cells (Fig. 1; Tab. 1). The IC50 values of the gemcitabine-resistant cells were as follows: PANC1GemRes, 5000 ± 0.99 nM (*P < 0.05); MIA PaCa2GemRes, 4000 ± 0.66 nM (*P < 0.05); and Capan2GemRes, 1200 ± 0.78 nM (*P < 0.05).
Fig. 1 Growth curves for parental and gemcitabine-resistant pancreatic cancer cells. Cells were treated with different concentration of gemcitabine and the IC50 was determined 72 h post-treatment using the MTT assay. The mean IC50 of gemcitabine was 50 nM for PANC1, 40 nM for MIA PaCa2 and 12 nM for Capan2. The mean IC50 of gemcitabine was 5000 nM (*P < 0.05) for PANC1GemRes, 4000 nM for MIA PaCa2GemRes (*P < 0.05), and 1200 nM for Capan2GemRes (*P < 0.05). The data is the means of three determinations ± SD. Ets-1 is overexpressed in gemcitabine-resistant cells The Ets-1 mRNA and protein expression was determined in the parental and gemcitabine-resistant cells by RT-qPCR and Western blot. The real-time PCR results clearly indicate that the parental cells (PANC1, MIA PaCa2 and Capan2) expressed Ets-1 intrinsically, whereas the gemcitabine-resistant cells

CELLULAR & MOLECULAR BIOLOGY LETTERS
107
demonstrated elevated levels of Ets-1 mRNA (Fig. 2A; *P < 0.05). The highest mRNA expression was observed in the PANC1GemRes cell line (6.2-fold increase; *P < 0.05), with the maximum resistance to gemcitabine. The lowest expression level was observed in the Capan2GemRes cell line (2.8-fold increase; *P < 0.05), which was the most sensitive cell line to gemcitabine. The total amount of Ets-1 protein was then examined using Western blot analysis (Fig. 2B, C). The protein expression data revealed a significant upregulation of the Ets-1 protein in gemcitabine-resistant cells as compared to their parental counterparts.
Fig. 2. RT-qPCR and Western blot analysis of Ets-1 expression in parental and gemcitabine-resistant cells. A – The relative Ets-1 mRNA expression was calculated in parental and gemcitabine-resistant cells. The relative mRNA expression to GAPDH was calculated, and the results are expressed as the means ± SD. B – The Western blot analysis for the detection of Ets-1 protein levels in the indicated parental and gemcitabine-resistant cell lines. 50 µg of whole cell lysates from each cell line were analyzed using a monoclonal antibody against Ets-1. Actin was used as a loading control. C – The graph depicts the intensity of bands representing Ets-1 normalized to the intensity of bands representing actin. The Ets-1 densitometry values are the means ± SD of three independent determinations, *P < 0.05. Ets-1 is a gemcitabine-responsive gene A time course analysis was carried out to measure the change in Ets-1 expression in the parental pancreatic cancer cells after gemcitabine induction. Parental cells, expressing a low basal level of Ets-1, were pulsed with 20 µM of gemcitabine for 1 h. Subsequently, the medium was replaced with a fresh medium, and the cells were allowed to recover for 4 to 24 h and harvested at different time intervals. RT-qPCR and Western blot analysis were performed to assess the variation in the Ets-1 expression. In RT-qPCR, an increase in the Ets-1 mRNA level was evident in all three parental cell lines at 4 h (Fig. 3A), but this

Vol. 16. No. 1. 2011 CELL. MOL. BIOL. LETT.
108
was found to decrease by 6 h. The Western blot analysis revealed elevated levels of the Ets-1 protein at 6 h, which gradually decreased by 24 h (Fig. 3B, C). The densitometric analysis revealed significant upregulation of the Ets-1 protein in PANC1 (3.4, *P < 0.05), followed by MIA PaCa2 (2.2, *P < 0.05) and Capan2 (1.8, *P < 0.05). These findings suggest that gemcitabine induces Ets-1 expression.
Fig. 3. The change in Ets-1 expression upon gemcitabine induction. A – This time course experiment was conducted to determine the change in Ets-1 mRNA expression using RT-qPCR in parental PANC1, MIA PaCa2 and Capan2 cells upon induction with 20 μM of gemcitabine for 1 h. Following the treatment, the change in Ets-1 mRNA expression was analyzed at various time intervals. The results were expressed as the mean, normalized RT-qPCR values ± SD for the assayed genes. The GAPDH gene was used as the normalization control. B – Following gemcitabine incubation, the change in Ets-1 protein expression was determined by Western blot at different time intervals using the monoclonal antibody against Ets-1. Significant upregulation of the Ets-1 protein expression was observed at 6 h, but had dropped by 24 h (data not shown). C – The graph depicts the intensity of bands representing Ets-1 normalized to the intensity of bands representing actin. Ets-1 densitometry values are the means ± SD of three independent determinations. *P < 0.05 versus control. Ets-1 silencing enhances gemcitabine sensitivity In order to examine the role of Ets-1 expression and gemcitabine chemosensitivity, we silenced the Ets-1 expression in gemcitabine-resistant cells using Ets-1 siRNA. The ability of Ets-1 siRNA to suppress Ets-1 expression was confirmed by RT-qPCR and Western blot analysis. Up to 80% suppression of Ets-1 mRNA levels and protein expression was observed within 24 h of transfection in all three gemcitabine-resistant pancreatic cancer cell lines (Fig. 4A, B, C; *P < 0.05). The actin expression was not affected by either the control or the Ets-1 siRNA treatment, indicating that non-specific downregulation of protein expression did not occur. We determined the effect of

CELLULAR & MOLECULAR BIOLOGY LETTERS
109
Fig. 4. The effect of Ets-1 siRNA treatment on Ets-1 expression in PANC1GemRes, MIA Paca2GemRes and Capan2GemRes cells. A – The relative Ets-1 mRNA expression was calculated in parental and gemcitabine-resistant cells. The results were expressed as the mean, normalized RT-qPCR values ± SD for the assayed genes. The GAPDH gene was used as the normalization control. B – Representative western blot for Ets-1 expression at 48 h following treatment with control siRNA or Ets-1 siRNA. The single base mismatch control siRNA did not significantly affect Ets-1 expression compared to the untreated cells, whereas Ets-1-specific siRNA induced a marked suppression of Ets-1 expression. The expression of actin was unaffected by either siRNA treatment. C – Ets-1 densitometry values are the means ± SD of three independent determinations, *P < 0.05 versus control siRNA.
Fig. 5. The effect of Ets-1 siRNA treatment on Ets-1, MMP1 and uPA expression in PANC1GemRes cells. A – Representative Western blot for Ets-1, MMP1 and uPA expression at 48 h following treatment with control siRNA or Ets-1 siRNA. B – Densitometry values are the means ± SD of three independent determinations, *P < 0.05 versus control siRNA.
Vol. 16. No. 1. 2011 CELL. MOL. BIOL. LETT.
110
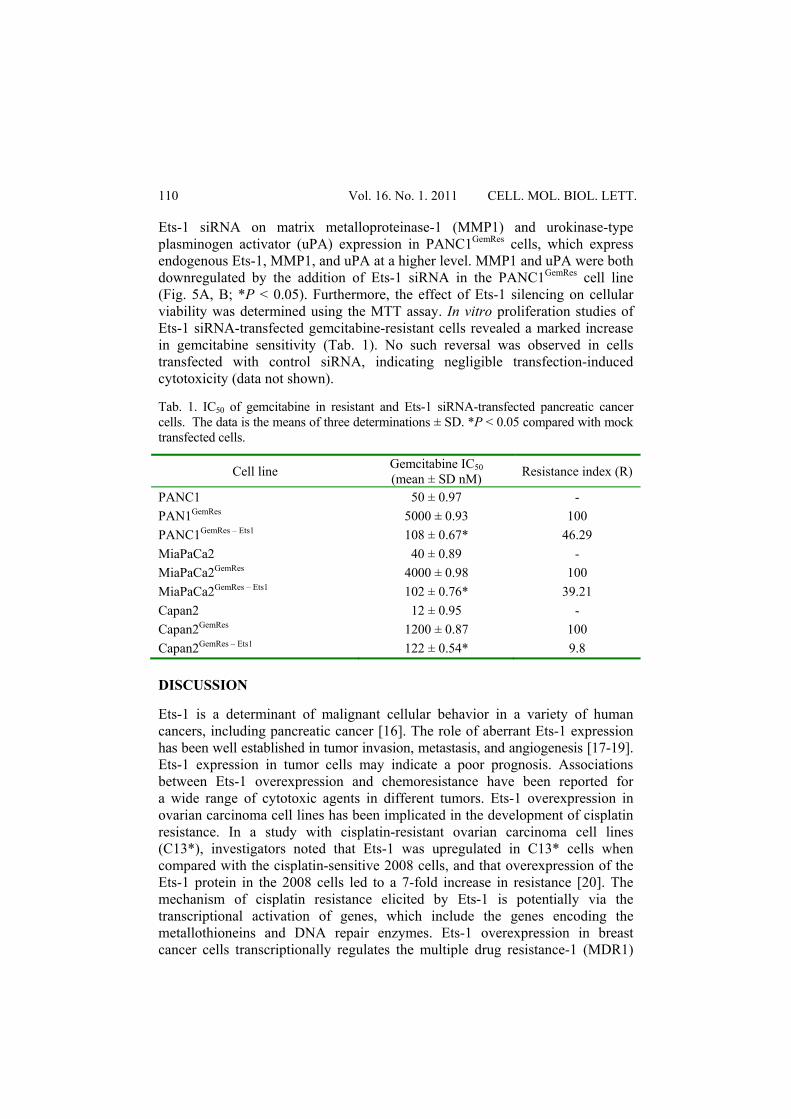
Ets-1 siRNA on matrix metalloproteinase-1 (MMP1) and urokinase-type plasminogen activator (uPA) expression in PANC1GemRes cells, which express endogenous Ets-1, MMP1, and uPA at a higher level. MMP1 and uPA were both downregulated by the addition of Ets-1 siRNA in the PANC1GemRes cell line (Fig. 5A, B; *P < 0.05). Furthermore, the effect of Ets-1 silencing on cellular viability was determined using the MTT assay. In vitro proliferation studies of Ets-1 siRNA-transfected gemcitabine-resistant cells revealed a marked increase in gemcitabine sensitivity (Tab. 1). No such reversal was observed in cells transfected with control siRNA, indicating negligible transfection-induced cytotoxicity (data not shown). Tab. 1. IC50 of gemcitabine in resistant and Ets-1 siRNA-transfected pancreatic cancer cells. The data is the means of three determinations ± SD. *P < 0.05 compared with mock transfected cells.
Cell line Gemcitabine IC50 (mean ± SD nM) Resistance index (R)
PANC1 50 ± 0.97 - PAN1GemRes 5000 ± 0.93 100 PANC1GemRes – Ets1 108 ± 0.67* 46.29 MiaPaCa2 40 ± 0.89 - MiaPaCa2GemRes 4000 ± 0.98 100 MiaPaCa2GemRes – Ets1 102 ± 0.76* 39.21 Capan2 12 ± 0.95 - Capan2GemRes 1200 ± 0.87 100 Capan2GemRes – Ets1 122 ± 0.54* 9.8 DISCUSSION Ets-1 is a determinant of malignant cellular behavior in a variety of human cancers, including pancreatic cancer [16]. The role of aberrant Ets-1 expression has been well established in tumor invasion, metastasis, and angiogenesis [17-19]. Ets-1 expression in tumor cells may indicate a poor prognosis. Associations between Ets-1 overexpression and chemoresistance have been reported for a wide range of cytotoxic agents in different tumors. Ets-1 overexpression in ovarian carcinoma cell lines has been implicated in the development of cisplatin resistance. In a study with cisplatin-resistant ovarian carcinoma cell lines (C13*), investigators noted that Ets-1 was upregulated in C13* cells when compared with the cisplatin-sensitive 2008 cells, and that overexpression of the Ets-1 protein in the 2008 cells led to a 7-fold increase in resistance [20]. The mechanism of cisplatin resistance elicited by Ets-1 is potentially via the transcriptional activation of genes, which include the genes encoding the metallothioneins and DNA repair enzymes. Ets-1 overexpression in breast cancer cells transcriptionally regulates the multiple drug resistance-1 (MDR1)

CELLULAR & MOLECULAR BIOLOGY LETTERS
111
gene and contributes to the development of resistance to the taxoid, vinka alkaloid, and anthracyclin groups of drugs [12]. Previous studies have demonstrated that Ets-1 interacts only with mutant p53 in vitro and in vivo and selectively upregulates the MDR1 gene [11]. These findings suggest possible role of Ets-1 overexpression in the development of chemoresistance in different cancers. Moreover, Ets-1 regulates the expression of several downstream targets in endothelial cells, which promotes an angiogenic phenotype. Ets-1 has also been implicated in both tumor invasion and neovascularization: it upregulates proteinases such as uPA, collagenase-1 (MMP-1), and stromelysin-1 (MMP-3), all of which carry Ets-responsive elements in their promoters [21-23]. This study identified increased Ets-1 activity as a potential chemoprotective mechanism adopted by gemcitabine-resistant pancreatic adenocarcinoma cells. Our findings demonstrated that Ets-1 expression markedly increased in all three gemcitabine-resistant pancreatic cancer cell lines in comparison with the respective parental cells. We examined the kinetics of Ets-1 gene expression in parental cells treated with gemcitabine; an elevation in Ets-1 expression was identified, both at the mRNA and protein levels. We also identified that downregulation of Ets-1 transcripts with siRNA leads to the partial reversal of gemcitabine chemoresistance. Furthermore, we found that silencing Ets-1 in gemcitabine-resistant cells leads to a downregulation of MMP-1 and uPA expression levels. Ets-1 expression following gemcitabine treatment may be an inherent protective response of the cells. The molecular pathways activated in response to acute gemcitabine exposure and the mechanisms involved in Ets-1 expression remain unclear and need further investigation. Clearly, these findings serve only as proof of concept, and confirmatory studies using other cell lines and animal models are needed. Our findings demonstrate that increased Ets-1 expression cannot be attributed to the gemcitabine chemoresistance mechanism alone, but might also serve as a potential therapeutic target in chemoresistant pancreatic adenocarcinoma cells. These findings are a fundamental step forward in understanding the key molecular players that promote the acquisition of the lethal cancer phenotypes. Further research is required to examine the upstream effectors and downstream target genes of Ets-1 associated with gemcitabine chemoresistance. Acknowledgements. We would like to thank Dr. Somesh Sharma, Dr. Arun Balakrishnan and Dr. Asha Almeida (Piramal Life Sciences Ltd. Mumbai) for all their help and support.

Vol. 16. No. 1. 2011 CELL. MOL. BIOL. LETT.
112
REFERENCES 1. Li, D., Xie, K., Wolff, R. and Abbruzzese, J.L. Pancreatic cancer. Lancet
363 (2004) 1049-1057. 2. Klein, B., Sadikov, E., Mishaeli, M., Levin, I. and Figer, A. Comparison of
5-FU and leucovorin to gemcitabine in the treatment of pancreatic cancer. Oncol. Rep. 7 (2000) 875-877.
3. Burris, H.A., Moore, M.J., Andersen. J., Green, M.R., Rothenberg, M.L., Modiano, M.R., Cripps, M.C., Portenoy, R.K., Storniolo, A.M., Tarassoff, P., Nelson, R., Dorr, F.A., Stephens, C.D. and Von Hoff, D.D. Improvements in survival and clinical benefit with gemcitabine as first-line therapy for patients with advanced pancreas cancer: a randomized trial. J. Clin. Oncol. 15 (1997) 2403-2413.
4. Ueno, H., Kiyosawa, K. and Kaniwa, N. Pharmacogenomics of gemcitabine: can genetic studies lead to tailor-made therapy. Br. J. Cancer 97 (2007) 145-151.
5. Galmarini, C.M., Mackey, J.R. and Dumontet, C. Nucleoside analogues: mechanisms of drug resistance and reversal strategies. Leukemia 15 (2001) 875-890.
6. Leprince, D., Gegonne, A., Coll, J., De taisne, C., Schneeberger, A., Lagrou, C. and Stehel, D. A putative second cell-derived oncogene of the avian leukaemia retrovirus E26. Nature 306 (1983) 395-397.
7. Nunn, M.F. and Hunte, T. The Ets sequence is required for induction of erythroblastosis in chickens by avian retrovirus E26. J. Virol. 63 (1989) 398-402.
8. Koizumi S; Fisher R.J., Fujiwara S., Jorcyk C., Bhat N.K.,, Seth A. Isoforms of the human ets-1 protein: generation by alternative splicing and differential phosphorylation. Oncogene 81(1990) 675-681.
9. Oda, N., Abe, M. and Sato, Y. Ets-1 converts endothelial cells to the angiogenic phenotype by inducing the expression of matrix metalloproteinases and integrin beta3. J. Cell Physiol. 178 (1999) 121-132.
10. Nakada, M., Yamashita, J., Okada, Y. and Sato, H. Ets-1 positively regulates expression of urokinase-type plasminogen activator (uPA) and invasiveness of astrocytic tumors. J. Neuropathol. Exp. Neurol. 58 (1999) 329-334.
11. Sampath, J., Sun, D., Kidd, V.J., Grenet, J., Gandhi, A., Shapiro, L.H., Wang, Q., Zambetti, G.P. and Schuetz, J.D. Mutant p53 cooperates with Ets and selectively up-regulates human MDR1 not MRP1. J. Biol. Chem. 276 (2001) 39359-39367.
12. Kars, M.D., Işeri, O.D., Gunduz, U., Ural, A.U., Arpaci, F. and Molnar, J. Development of rational in vitro models for drug resistance in breast cancer and modulation of MDR by selected compounds. Anti Can. Res. 26 (2006) 4559-4568.
CELLULAR & MOLECULAR BIOLOGY LETTERS
113
13. Mosmann, T. Rapid colorimetric assay for cellular growth and survival: application to proliferation and cytotoxicity assays. J. Immunol. Methods 65 (1983) 55-63.
14. Liu, X., Zhou, B., Xue, L., Yen, F., Chu, P., Un, F. and Yen, Y. Ribonucleotide reductase subunits M2 and p53R2 are potential biomarkers for metastasis of colon cancer. Clin. Colorectal Canc. 6 (2007) 374-381.
15. Stephanie, G., Melanie, M., Jerome, P., Olivier, V.W., Catherine, B. and Laurent, G. Normalization of qRT-PCR data: the necessity of adopting a systematic, experimental conditions-specific, validation of references J. Exp. Bot. 60 (2009) 487-493.
16. Lefter, P., Dima, S., Sunamura, M., Furukawa, T., Sato, Y., Abe, M., Chivu, M., Popescu, I. and Horii, A. Transcriptional silencing of Ets-1 efficiently suppresses angiogenesis of pancreatic cancer. Cancer Gene Ther. 16 (2009) 137-148.
17. Maroni, P., Bendinelli, P., Matteucci, E. and Desiderio, M.A. HGF induces CXCR4 and CXCL12-mediated tumor invasion through Ets-1 and NF-B. Carcinogenesis 28 (2007) 267-279.
18. Fujimoto, J., Aoki, I., Toyoki, H., Khatun, S., Sato, E., Sakaguchi, H., and Tamaya, T. Clinical implications of expression of Ets-1 related to angiogenesis in metastatic lesions of ovarian cancers. Oncology 66 (2004) 420-428.
19. Wernert, N., Gilles, F., Fafeur, V. Bouali, F., Raes, M.-B., Pyke, C., Dupressoir, T., Seitz, G., Vandenbunder, B. and Stéhelin, D. Stromal expression of c-Ets-1 transcription factor correlates with tumor invasion. Cancer Res. 54 (1994) 5683-5688.
20. Wilson, L.A., Yamamoto, H. and Singh, G. Role of the transcription factor Ets-1 in cisplatin resistance. Mol. Cancer Ther. 3 (2004) 823-830.
21. Kitange, G., Shibata, S., Tokunaga, Y., Yagi, N., Yasunaga, A., Kishikawa, M. and Naito, S. Ets-1 transcription factor mediated urokinase-type plasminogen activator expression and invasion in glioma cells stimulated by serum and basic fibroblast growth factors. Lab. Invest. 79 (1999) 407-516.
22. Naotaka, H., Nobuo, J., Motokuni, A., Kunio, M., Toshikazu, N., Yasufumi, S., Nahoko, O., Toshio, O., Yasufumi, K. and Ryuichi M. In vivo evidence of angiogenesis induced by transcription factor Ets-1: Ets-1 is located upstream of angiogenesis cascade. Circulation 109 (2004) 3035-3041.
23. Hiromichi, I., Mark, D., Eric, B., Thomas, E. C., Michael, J. Z., Stanley, W. A. and Edward, E. W. Prostaglandin E2 Enhances Pancreatic Cancer Invasiveness through an Ets-1–Dependent Induction of Matrix Metalloproteinase-2. Cancer Res. 64 (2004) 7439-7446.