Embed Size (px)
Citation preview
E*TRADE FINANCIALQ2 2020 STREETWISEREPORTInsights from the E*TRADE quarterly tracking study of 900+ experienced investors
Public
© 2020 E*TRADE Financial Corporation. All rights reserved.
2
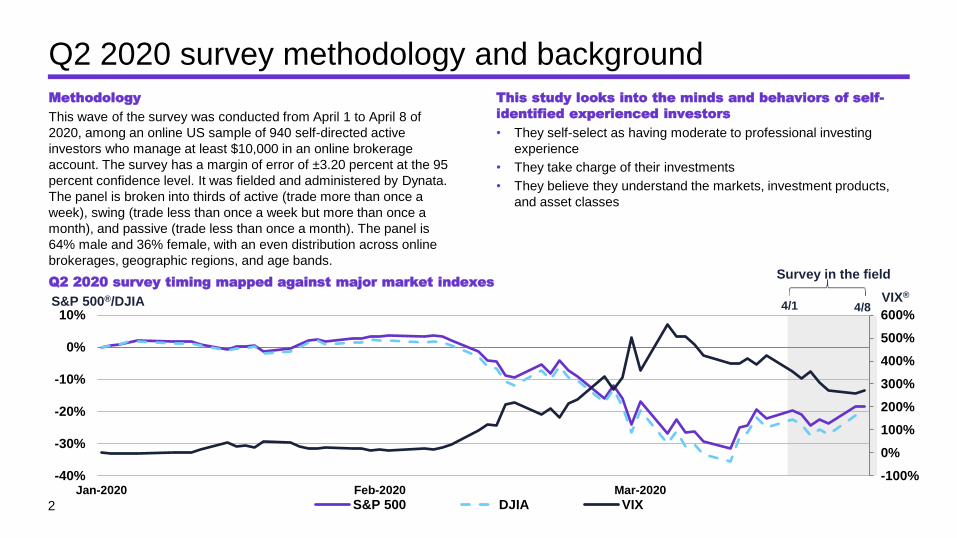
Q2 2020 survey methodology and backgroundMethodology
This wave of the survey was conducted from April 1 to April 8 of
2020, among an online US sample of 940 self-directed active
investors who manage at least $10,000 in an online brokerage
account. The survey has a margin of error of ±3.20 percent at the 95
percent confidence level. It was fielded and administered by Dynata.
The panel is broken into thirds of active (trade more than once a
week), swing (trade less than once a week but more than once a
month), and passive (trade less than once a month). The panel is
64% male and 36% female, with an even distribution across online
brokerages, geographic regions, and age bands.
This study looks into the minds and behaviors of self-
identified experienced investors
• They self-select as having moderate to professional investing
experience
• They take charge of their investments
• They believe they understand the markets, investment products,
and asset classes
-100%
0%
100%
200%
300%
400%
500%
600%
-40%
-30%
-20%
-10%
0%
10%
Jan-2020 Feb-2020 Mar-2020
S&P 500 DJIA VIX
Q2 2020 survey timing mapped against major market indexes
S&P 500®/DJIA
Survey in the field
4/84/1VIX®

3
SENTIMENT
VIEWS ON THE MARKET AND WHERE
OPPORTUNITIES LIE
4 Public
0%
10%
20%
30%
40%
Q2'19 Q3'19 Q4'19 Q1'20 Q2'20Dazed and Confused Easy Rider
Singin' in the Rain Pulp Fiction
Raging Bull Jackass
Apocalypse Now Fear and Loathing in Las Vegas
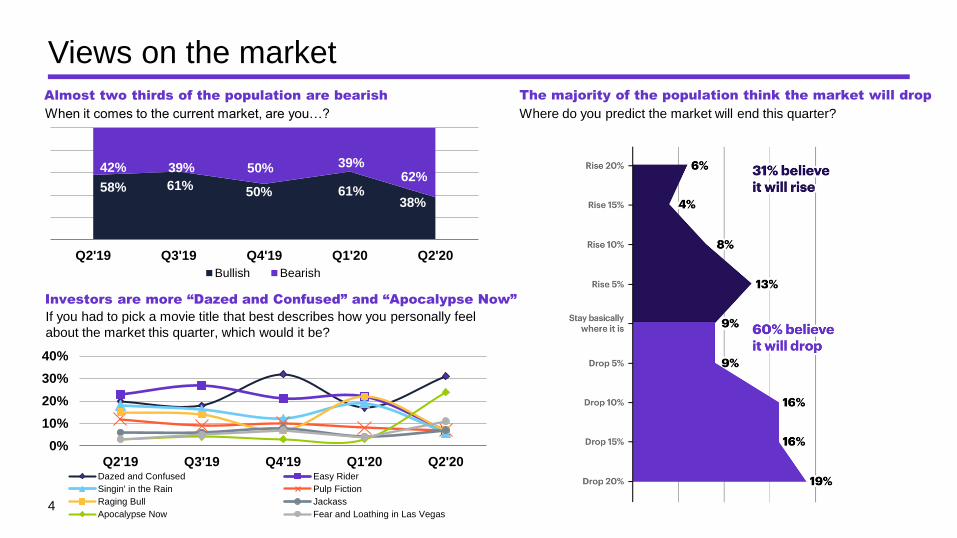
If you had to pick a movie title that best describes how you personally feel
about the market this quarter, which would it be?
58% 61% 50% 61%38%
42% 39% 50% 39%62%
Q2'19 Q3'19 Q4'19 Q1'20 Q2'20
Bullish Bearish
When it comes to the current market, are you…?
Almost two thirds of the population are bearish The majority of the population think the market will drop
Investors are more “Dazed and Confused” and “Apocalypse Now”
Where do you predict the market will end this quarter?
Views on the market
4
5
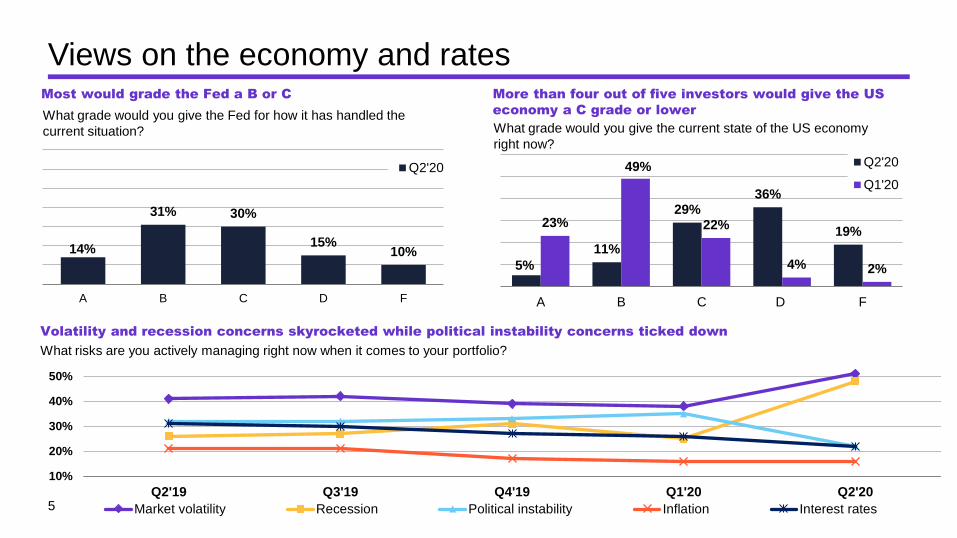
14%
31% 30%
15%10%
A B C D F
Q2'20
Views on the economy and rates
What grade would you give the Fed for how it has handled the
current situation?
10%
20%
30%
40%
50%
Q2'19 Q3'19 Q4'19 Q1'20 Q2'20
Market volatility Recession Political instability Inflation Interest rates
What risks are you actively managing right now when it comes to your portfolio?
Most would grade the Fed a B or C
Volatility and recession concerns skyrocketed while political instability concerns ticked down
5%
11%
29%36%
19%23%
49%
22%
4% 2%
A B C D F
Q2'20
Q1'20
More than four out of five investors would give the US
economy a C grade or lower
What grade would you give the current state of the US economy
right now?
5
6
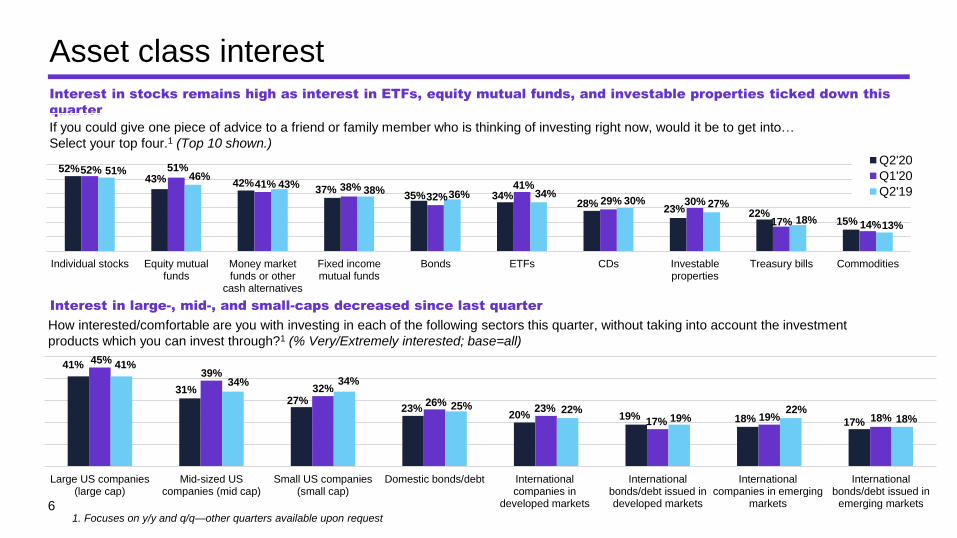
Asset class interestInterest in stocks remains high as interest in ETFs, equity mutual funds, and investable properties ticked down this
quarter
Interest in large-, mid-, and small-caps decreased since last quarter
If you could give one piece of advice to a friend or family member who is thinking of investing right now, would it be to get into…
Select your top four.1 (Top 10 shown.)
How interested/comfortable are you with investing in each of the following sectors this quarter, without taking into account the investment
products which you can invest through?1 (% Very/Extremely interested; base=all)
52%43% 42%
37%35% 34%
28%23% 22%
15%
52% 51%
41% 38%32%
41%
29% 30%
17% 14%
51%46%
43%38% 36% 34%
30% 27%
18%13%
Individual stocks Equity mutualfunds
Money marketfunds or other
cash alternatives
Fixed incomemutual funds
Bonds ETFs CDs Investableproperties
Treasury bills Commodities
Q2'20
Q1'20
Q2'19
41%
31%27%
23%20% 19% 18% 17%
45%
39%
32%
26%23%
17% 19% 18%
41%
34% 34%
25% 22%19%
22%18%
Large US companies(large cap)
Mid-sized UScompanies (mid cap)
Small US companies(small cap)
Domestic bonds/debt Internationalcompanies in
developed markets
Internationalbonds/debt issued indeveloped markets
Internationalcompanies in emerging
markets
Internationalbonds/debt issued in
emerging markets
1. Focuses on y/y and q/q—other quarters available upon request
7
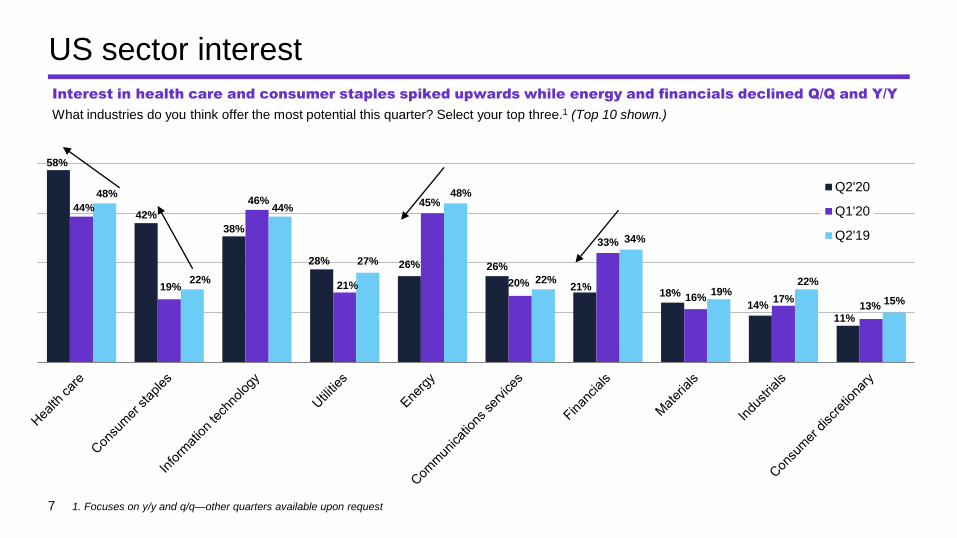
US sector interest
58%
42%
38%
28% 26% 26%
21%18%
14%
11%
44%
19%
46%
21%
45%
20%
33%
16% 17%13%
48%
22%
44%
27%
48%
22%
34%
19%22%
15%
Q2'20
Q1'20
Q2'19
What industries do you think offer the most potential this quarter? Select your top three.1 (Top 10 shown.)
Interest in health care and consumer staples spiked upwards while energy and financials declined Q/Q and Y/Y
1. Focuses on y/y and q/q—other quarters available upon request
8
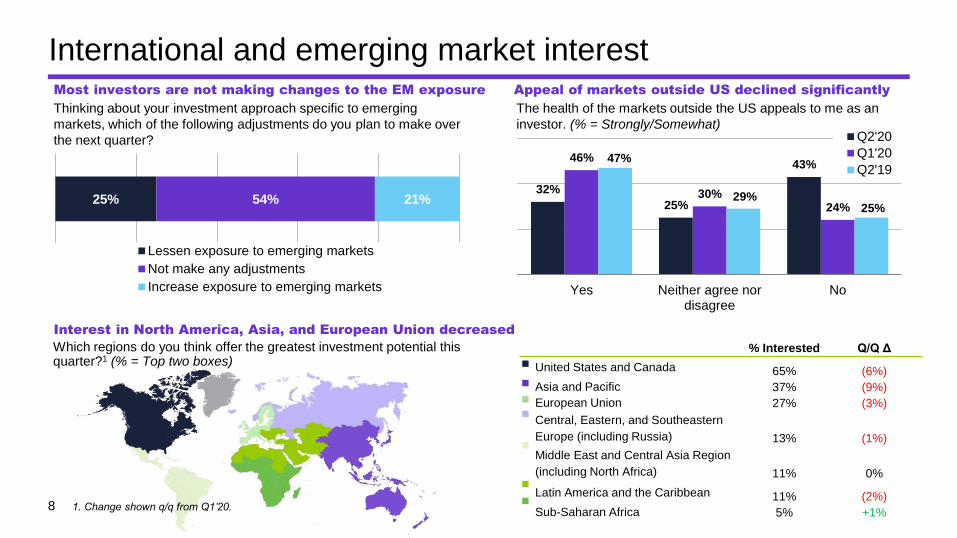
% Interested Q/Q Δ
United States and Canada 65% (6%)
Asia and Pacific 37% (9%)
European Union 27% (3%)
Central, Eastern, and Southeastern
Europe (including Russia) 13% (1%)
Middle East and Central Asia Region
(including North Africa) 11% 0%
Latin America and the Caribbean 11% (2%)
Sub-Saharan Africa 5% +1%
32%
25%
43%46%
30%24%
47%
29%25%
Yes Neither agree nordisagree
No
Q2'20
Q1'20
Q2'19
International and emerging market interest
Which regions do you think offer the greatest investment potential this quarter?1 (% = Top two boxes)
25% 54% 21%
Lessen exposure to emerging markets
Not make any adjustments
Increase exposure to emerging markets
Thinking about your investment approach specific to emerging
markets, which of the following adjustments do you plan to make over
the next quarter?
The health of the markets outside the US appeals to me as an
investor. (% = Strongly/Somewhat)
Appeal of markets outside US declined significantly
Interest in North America, Asia, and European Union decreased
Most investors are not making changes to the EM exposure
1. Change shown q/q from Q1’20.
9
PORTFOLIO MANAGEMENT A LOOK AT HOW DIFFERENT AGE GROUPS MANAGE THEIR
INVESTMENTS
10
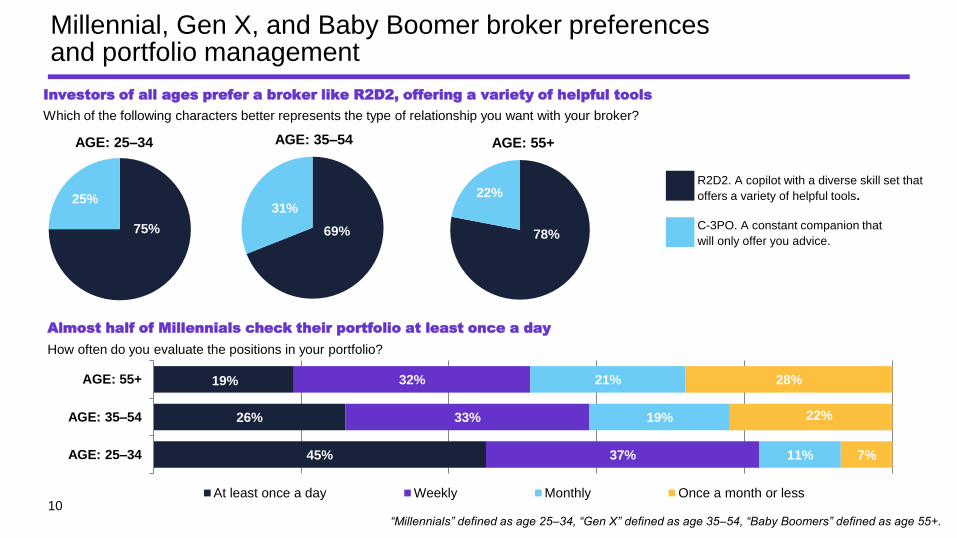
45%
26%
19%
37%
33%
32%
11%
19%
21%
7%
22%
28%
AGE: 25–34
AGE: 35–54
AGE: 55+
At least once a day Weekly Monthly Once a month or less
Millennial, Gen X, and Baby Boomer broker preferences and portfolio management
How often do you evaluate the positions in your portfolio?
“Millennials” defined as age 25–34, “Gen X” defined as age 35–54, “Baby Boomers” defined as age 55+.
Almost half of Millennials check their portfolio at least once a day
Which of the following characters better represents the type of relationship you want with your broker?
75%
25%
AGE: 25–34
69%
31%
AGE: 35–54
78%
22%
AGE: 55+
R2D2. A copilot with a diverse skill set that
offers a variety of helpful tools.
C-3PO. A constant companion that
will only offer you advice.
Investors of all ages prefer a broker like R2D2, offering a variety of helpful tools
11
Mobile usage among Millennials, Gen X, and Baby Boomers
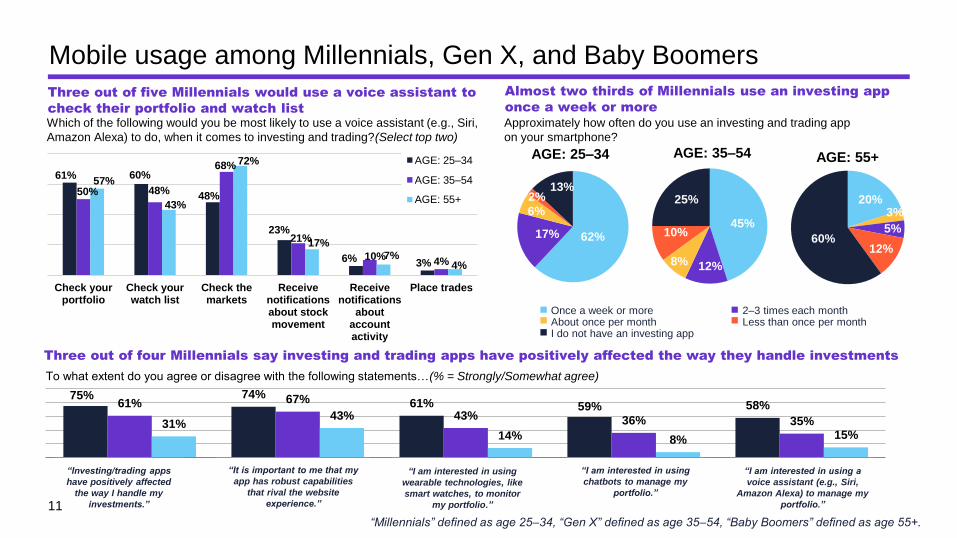
75% 74%61% 59% 58%61% 67%
43% 36% 35%31%43%
14% 8% 15%
positively brokerage's mobile app wearable chatbots voice
To what extent do you agree or disagree with the following statements…(% = Strongly/Somewhat agree)
“I am interested in using
wearable technologies, like
smart watches, to monitor
my portfolio.”
“I am interested in using a
voice assistant (e.g., Siri,
Amazon Alexa) to manage my
portfolio.”
“Investing/trading apps
have positively affected
the way I handle my
investments.”
Which of the following would you be most likely to use a voice assistant (e.g., Siri,
Amazon Alexa) to do, when it comes to investing and trading?(Select top two)
Approximately how often do you use an investing and trading app
on your smartphone?
20%3%
5%
12%60%
AGE: 55+
45%10%
8% 12%
25%
AGE: 35–54
62%17%
6%
2%13%
AGE: 25–34
“It is important to me that my
app has robust capabilities
that rival the website
experience.”
“Millennials” defined as age 25–34, “Gen X” defined as age 35–54, “Baby Boomers” defined as age 55+.
Three out of five Millennials would use a voice assistant to
check their portfolio and watch list
Almost two thirds of Millennials use an investing app
once a week or more
Three out of four Millennials say investing and trading apps have positively affected the way they handle investments
Once a week or more 2–3 times each monthAbout once per month Less than once per monthI do not have an investing app
“I am interested in using
chatbots to manage my
portfolio.”
61% 60%
48%
23%
6% 3%
50% 48%
68%
21%
10%4%
57%
43%
72%
17%
7%4%
Check yourportfolio
Check yourwatch list
Check themarkets
Receivenotificationsabout stockmovement
Receivenotifications
aboutaccountactivity
Place trades
AGE: 25–34
AGE: 35–54
AGE: 55+
12
VIEWS ON RETIREMENT HOW EXPERIENCED INVESTORS THINK
ABOUT RETIREMENT INVESTING
13
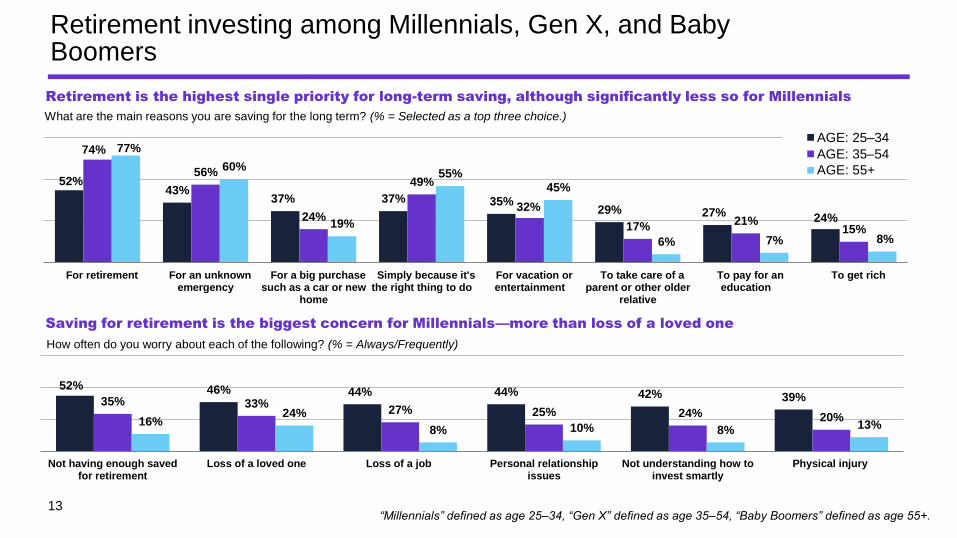
52% 46% 44% 44% 42% 39%35% 33%27% 25% 24% 20%16%
24%
8% 10% 8% 13%
Not having enough savedfor retirement
Loss of a loved one Loss of a job Personal relationshipissues
Not understanding how toinvest smartly
Physical injury
Retirement investing among Millennials, Gen X, and Baby Boomers
52%43%
37% 37% 35%29% 27% 24%
74%
56%
24%
49%
32%
17% 21%15%
77%
60%
19%
55%45%
6% 7% 8%
For retirement For an unknownemergency
For a big purchasesuch as a car or new
home
Simply because it'sthe right thing to do
For vacation orentertainment
To take care of aparent or other older
relative
To pay for aneducation
To get rich
AGE: 25–34
AGE: 35–54
AGE: 55+
What are the main reasons you are saving for the long term? (% = Selected as a top three choice.)
How often do you worry about each of the following? (% = Always/Frequently)
“Millennials” defined as age 25–34, “Gen X” defined as age 35–54, “Baby Boomers” defined as age 55+.
Saving for retirement is the biggest concern for Millennials—more than loss of a loved one
Retirement is the highest single priority for long-term saving, although significantly less so for Millennials
14
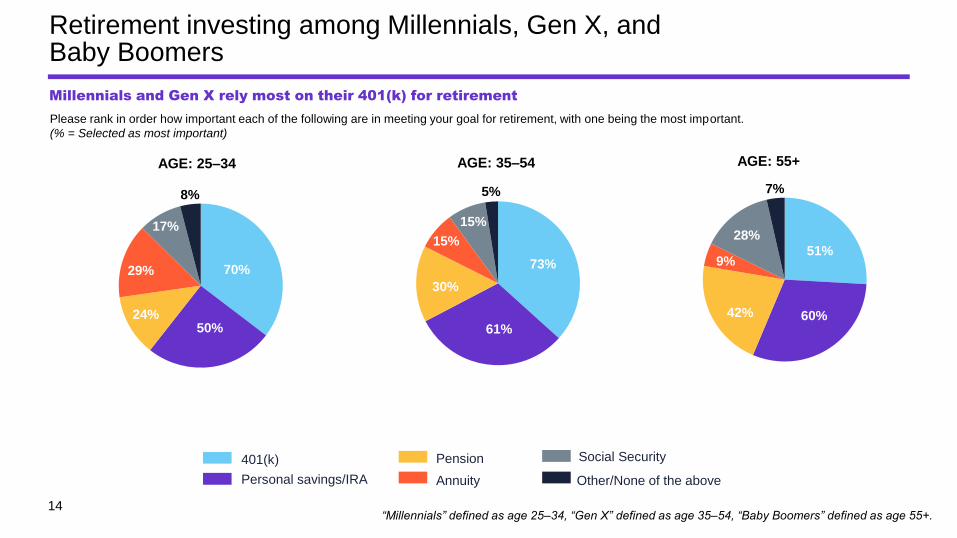
Retirement investing among Millennials, Gen X, and Baby Boomers
Please rank in order how important each of the following are in meeting your goal for retirement, with one being the most important.
(% = Selected as most important)
73%
61%
30%
15%
15%
5%
AGE: 35–54
51%
60%42%
9%
28%
7%
AGE: 55+
Personal savings/IRA
401(k) Pension
Annuity
Social Security
Other/None of the above
“Millennials” defined as age 25–34, “Gen X” defined as age 35–54, “Baby Boomers” defined as age 55+.
Millennials and Gen X rely most on their 401(k) for retirement
70%
50%24%
29%
17%
8%
AGE: 25–34
15
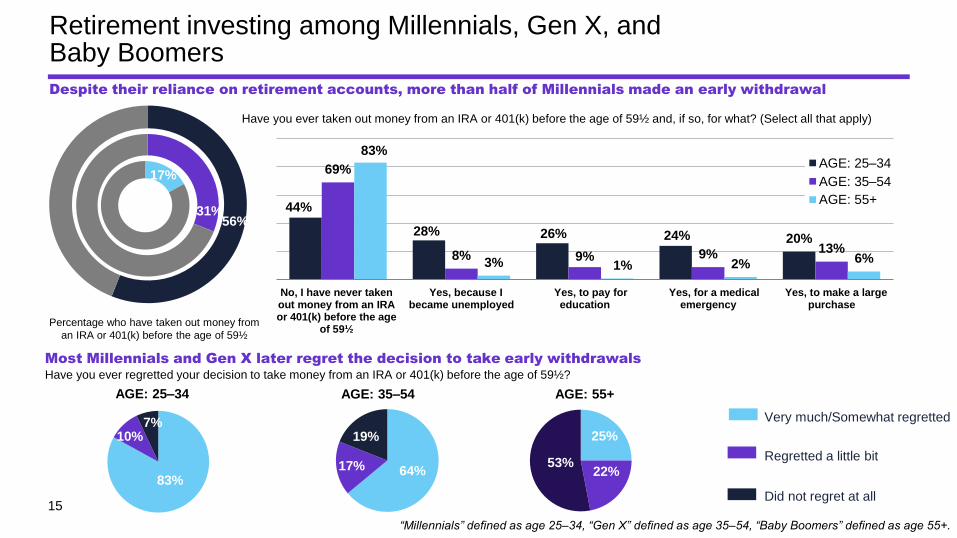
56%
17%
31%
Percentage who have taken out money from
an IRA or 401(k) before the age of 59½
44%
28% 26% 24% 20%
69%
8% 9% 9% 13%
83%
3% 1% 2% 6%
No, I have never takenout money from an IRAor 401(k) before the age
of 59½
Yes, because Ibecame unemployed
Yes, to pay foreducation
Yes, for a medicalemergency
Yes, to make a largepurchase
AGE: 25–34
AGE: 35–54
AGE: 55+
Have you ever taken out money from an IRA or 401(k) before the age of 59½ and, if so, for what? (Select all that apply)
Retirement investing among Millennials, Gen X, and Baby Boomers
Have you ever regretted your decision to take money from an IRA or 401(k) before the age of 59½?
25%
22%53%
AGE: 55+
64%17%
19%
AGE: 35–54
Very much/Somewhat regretted
Regretted a little bit
Did not regret at all
83%
10%7%
AGE: 25–34
“Millennials” defined as age 25–34, “Gen X” defined as age 35–54, “Baby Boomers” defined as age 55+.
Most Millennials and Gen X later regret the decision to take early withdrawals
Despite their reliance on retirement accounts, more than half of Millennials made an early withdrawal
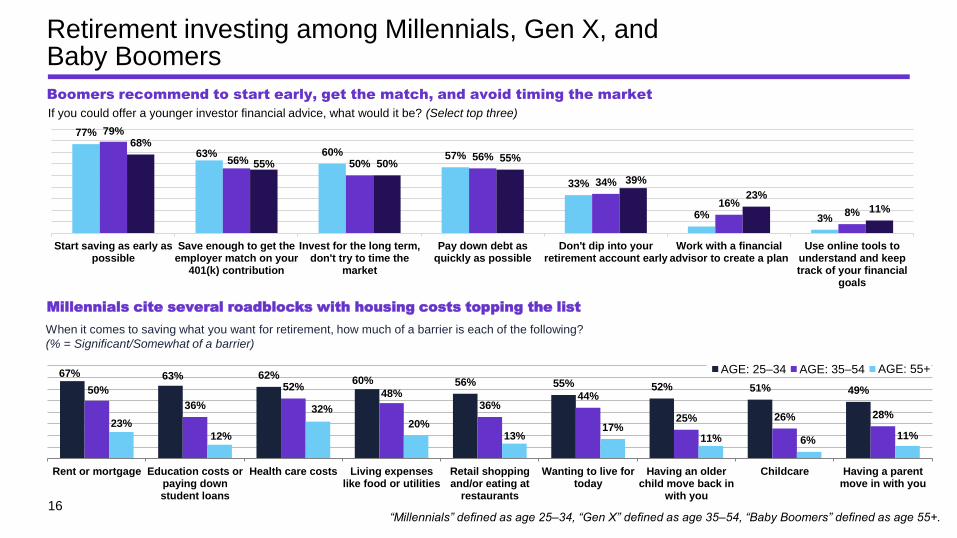
16
67% 63% 62%60% 56% 55% 52% 51% 49%50%
36%
52%48%
36%44%
25% 26% 28%23%
12%
32%
20%13%
17%11% 6% 11%
Rent or mortgage Education costs orpaying downstudent loans
Health care costs Living expenseslike food or utilities
Retail shoppingand/or eating at
restaurants
Wanting to live fortoday
Having an olderchild move back in
with you
Childcare Having a parentmove in with you
AGE: 25–34 AGE: 35–54 AGE: 55+
Retirement investing among Millennials, Gen X, and Baby Boomers
When it comes to saving what you want for retirement, how much of a barrier is each of the following?
(% = Significant/Somewhat of a barrier)
“Millennials” defined as age 25–34, “Gen X” defined as age 35–54, “Baby Boomers” defined as age 55+.
Boomers recommend to start early, get the match, and avoid timing the market
Millennials cite several roadblocks with housing costs topping the list
77%
63% 60% 57%
33%
6% 3%
79%
56% 50%56%
34%
16%8%
68%
55% 50%55%
39%
23%
11%
Start saving as early aspossible
Save enough to get theemployer match on your
401(k) contribution
Invest for the long term,don't try to time the
market
Pay down debt asquickly as possible
Don't dip into yourretirement account early
Work with a financialadvisor to create a plan
Use online tools tounderstand and keeptrack of your financial
goals
If you could offer a younger investor financial advice, what would it be? (Select top three)
17
Please read the important disclosures belowThis presentation presents data from April 1–April 8, 2020.
The data from this and past quarters reflects the opinions of this population only from the time of fielding, which is typically the first two weeks of each quarter. It does not
represent opinions of the full quarter.
E*TRADE Financial Corporation and Dynata are separate companies that are not affiliated. E*TRADE Financial Corporation engages Dynata to program, field, and tabulate the
study.
All information in this presentation reflects results from the survey and should not be construed as reflecting the views of E*TRADE Financial, its affiliates, or Dynata. The results
herein do not constitute a recommendation or endorsement by E*TRADE Financial, its affiliates, or Dynata.
Past performance is no guarantee of future returns. The performance of an index is not an exact representation of any particular investment, as you cannot invest directly in an
index.
Dow Jones Industrial Average: Computed by summing the prices of the stocks of 30 companies and then dividing that total by an adjusted value—one which has been
adjusted over the years to account for the effects of stock splits on the prices of the 30 companies. Dividends are reinvested to reflect the actual performance of the underlying
securities.
S&P 500® Index is a market capitalization-weighted index of 500 widely held stocks often used as a proxy for the US stock market.
All components of the S&P 500 are assigned to at least one of eleven S&P Select Sector Indexes, which track major economic segments and are highly liquid benchmarks.
Stock classifications are based on the Global Industry Classification Standard. The Select Sector Indexes are: Communication Services Select Sector, Consumer Discretionary
Select Sector; Consumer Staples Select Sector; Energy Select Sector; Financials Select Sector; Health Care Select Sector; Industrials Select Sector; Materials Select Sector,
Real Estate Select Sector, Technology Select Sector; and Utilities Select Sector.
VIX® is the ticker symbol for Cboe Volatility Index®. The index, also called the fear index, is calculated by Cboe and generally measures expected volatility of the US market in
the next 30 days. The higher the number, the more bearish the market is in general. The VIX is used to calculate the put/call ratio.
E*TRADE Financial, E*TRADE, and the E*TRADE logo are trademarks or registered trademarks of E*TRADE Financial Corporation.
All other product names are trademarks or registered trademarks of their respective holders.
© 2020 E*TRADE Financial Corporation. All rights reserved.