Embed Size (px)
Citation preview

ETHNO-CULTURAL DIVERSITY AND
MULTIDIMENSIONAL POVERTY
DIFFERENTIAL IN CAMEROON

plan
• Research issue;
• Objectives;
• Review of the literature
• Methodology;
• Results;
• Policy implications.
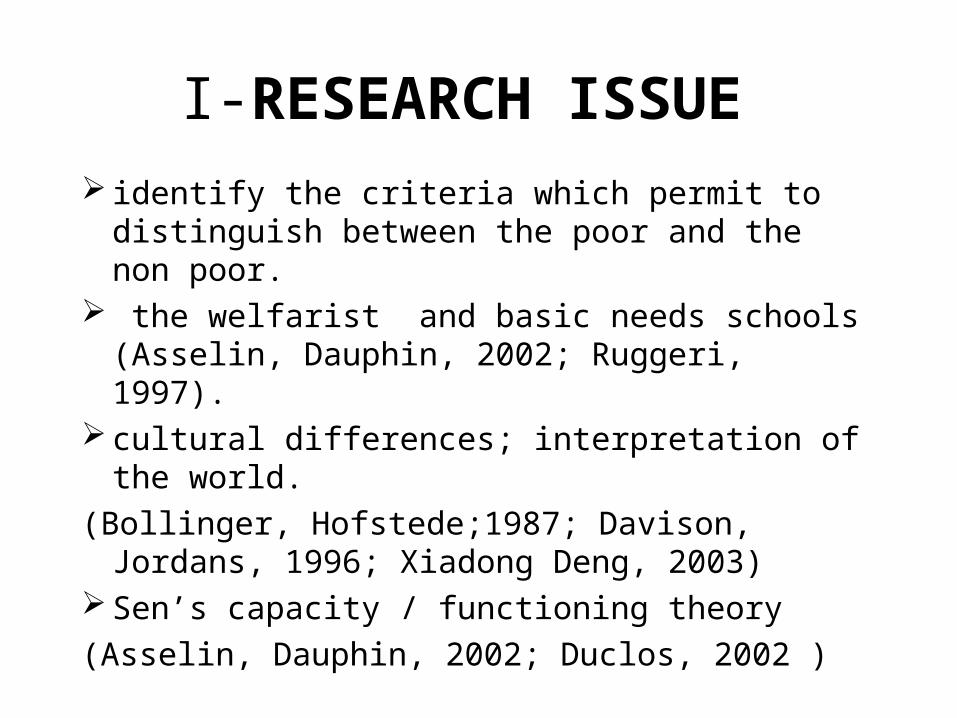
I-RESEARCH ISSUE
identify the criteria which permit to distinguish between the poor and the non poor.
the welfarist and basic needs schools (Asselin, Dauphin, 2002; Ruggeri, 1997).
cultural differences; interpretation of the world.
(Bollinger, Hofstede;1987; Davison, Jordans, 1996; Xiadong Deng, 2003)
Sen’s capacity / functioning theory
(Asselin, Dauphin, 2002; Duclos, 2002 )
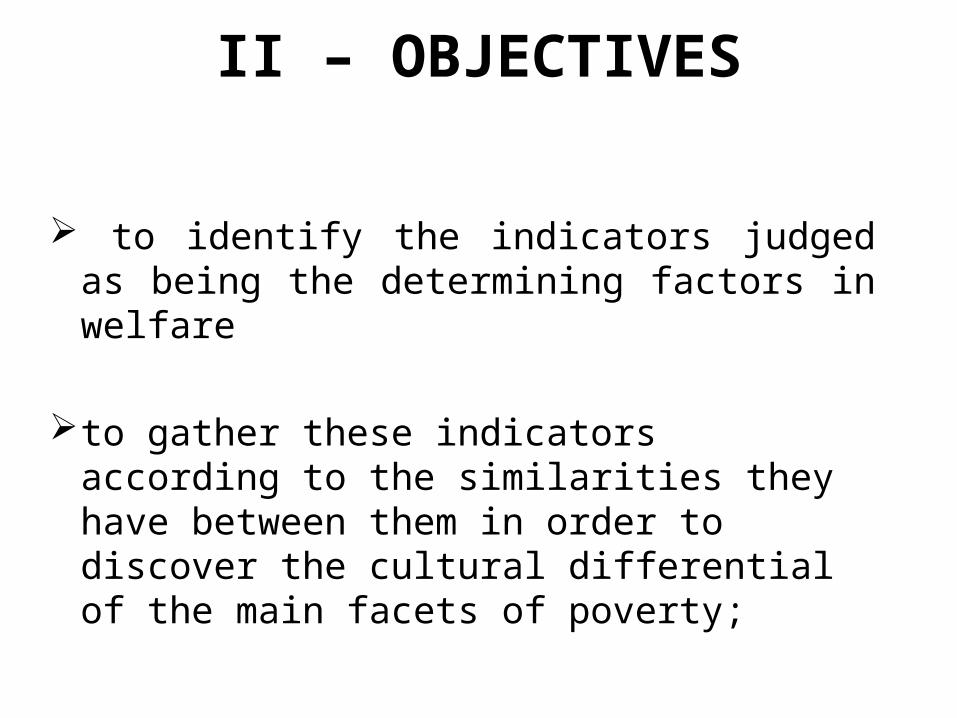
II – OBJECTIVES
to identify the indicators judged as being the determining factors in welfare
to gather these indicators according to the similarities they have between them in order to discover the cultural differential of the main facets of poverty;
II- OBJECTIVES
to determine the cultural differential of the interrelations between different facets of poverty.
to capture the cultural differential of the determinants of poverty.
III-REVIEW OF THE LITERATURE
identification of multidimensional poverty indicators (Asselin et Dauphin; 2000)
identification of the dimensions or facets of poverty
(Bevan, Sandra, 1997; Razafindrakoto et Roubaud, 2001).
III- REVIEW OF THE LITERATURE
indices of multidimensional poverty
(Bourguignon, Chakravarty 2002; Chakravarty, Mukherjee et Ranade ,1997)
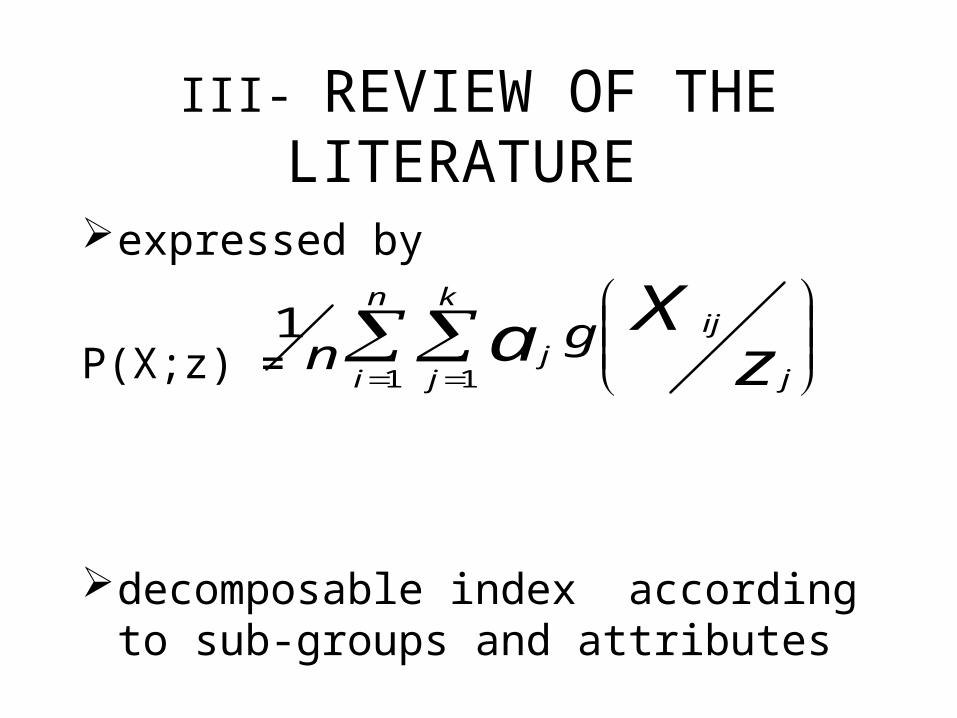
III- REVIEW OF THE LITERATURE
expressed by
P(X;z) =
decomposable index according to sub-groups and attributes
n
i
k
j j
ijj zXa gn
1 1
1
III- REVIEW OF THE LITERATURE
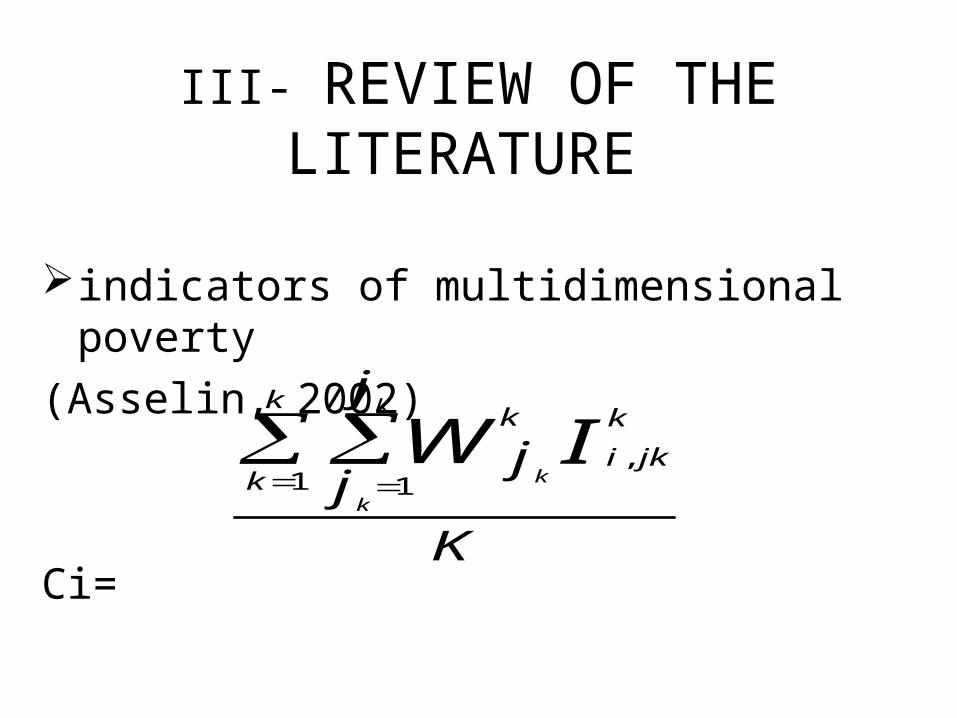
indicators of multidimensional poverty
(Asselin, 2002)
Ci= K
j
jj
k
k
k
jki
kk
k
kIW
1 1,
IV – METHODOLOGY
• IV-1: empirical research framework
IV-2: Structural modelling
• IV-3: Multi-groups modelling
IV-1: empirical research framework
1-the database selected for the analysis
2-Cameroon’s ethno-cultural map
3-Multiple Correspondence Analysis (MCA)
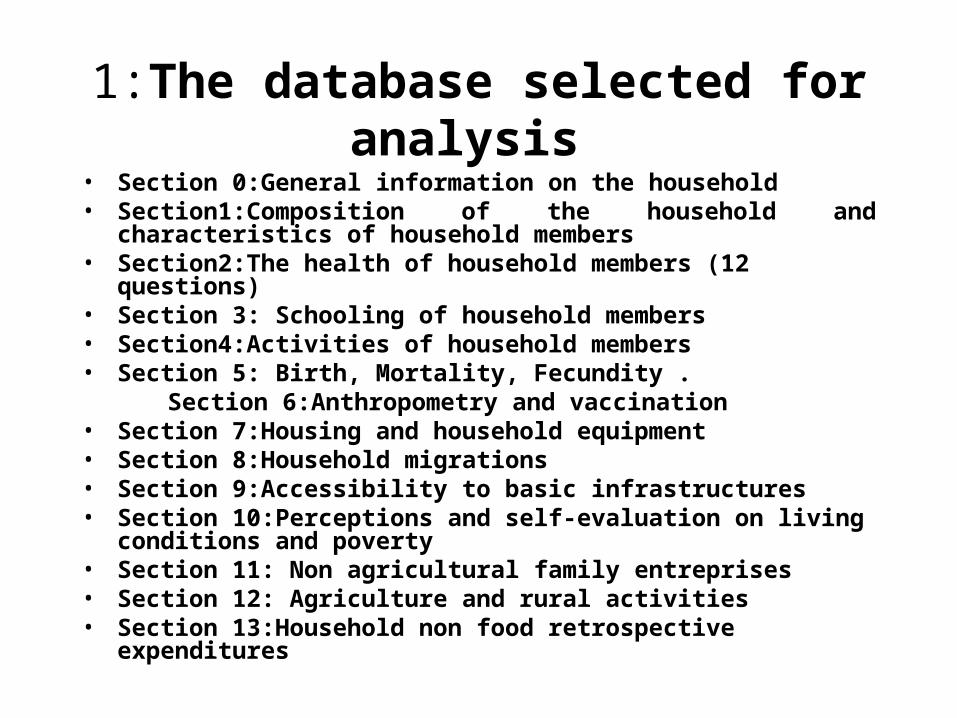
1:The database selected for analysis • Section 0:General information on the household• Section1:Composition of the household and characteristics of household
members• Section2:The health of household members (12 questions)• Section 3: Schooling of household members • Section4:Activities of household members • Section 5: Birth, Mortality, Fecundity . Section 6:Anthropometry and vaccination • Section 7:Housing and household equipment • Section 8:Household migrations • Section 9:Accessibility to basic infrastructures • Section 10:Perceptions and self-evaluation on living conditions and
poverty • Section 11: Non agricultural family entreprises • Section 12: Agriculture and rural activities• Section 13:Household non food retrospective expenditures
1- The database selected for the analysis
Research Interest
37 poverty indicators from this database.
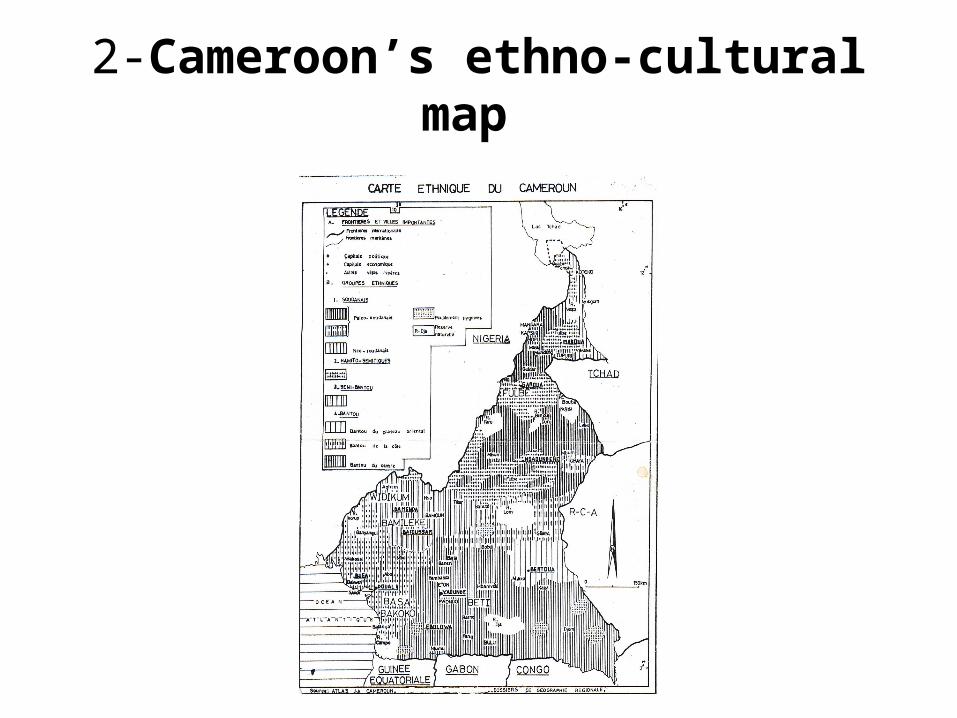
2-Cameroon’s ethno-cultural map
2-Cameroon’s ethno-cultural map
Research Interest
distribute the research sample between the four ethnic groupings.
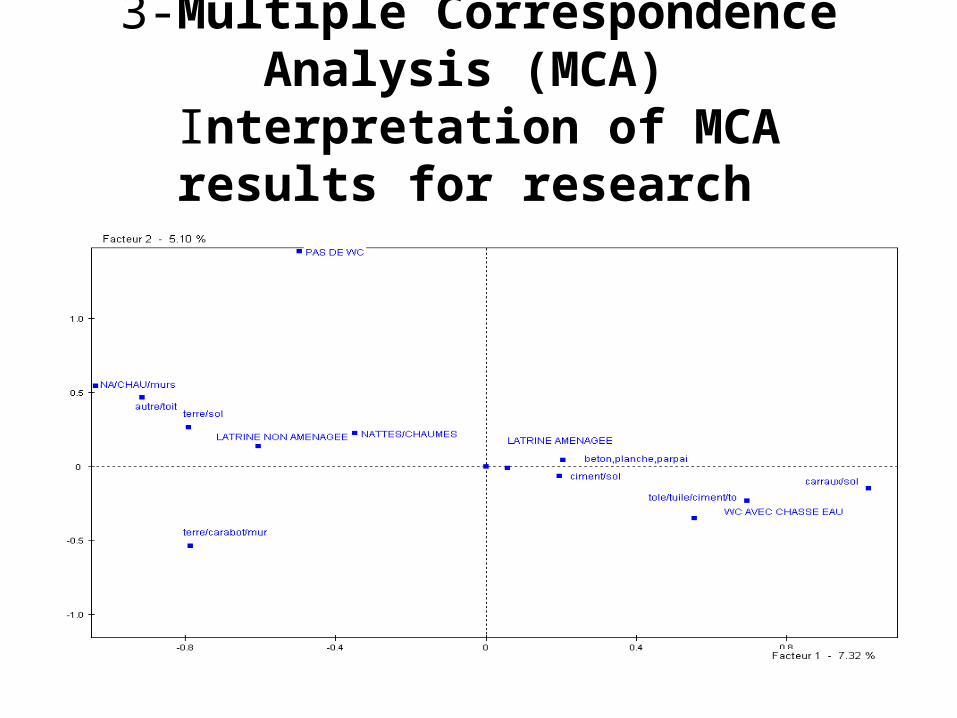
3-Multiple Correspondence Analysis (MCA)
Interpretation of MCA results for research
3-Multiple Correspondence Analysis (MCA)
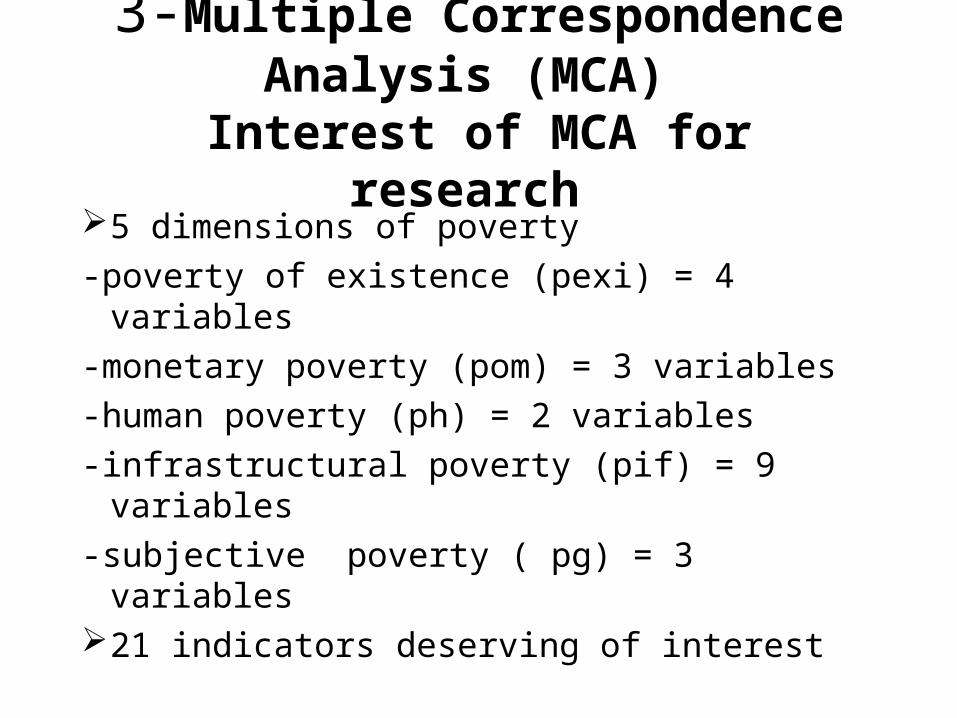
Interest of MCA for research 5 dimensions of poverty
-poverty of existence (pexi) = 4 variables
-monetary poverty (pom) = 3 variables
-human poverty (ph) = 2 variables
-infrastructural poverty (pif) = 9 variables
-subjective poverty ( pg) = 3 variables 21 indicators deserving of interest
IV-2: Modelling Structural Equations with Pooled Data
definition
multivariate analysis method which combines
factorial analysis and regressions
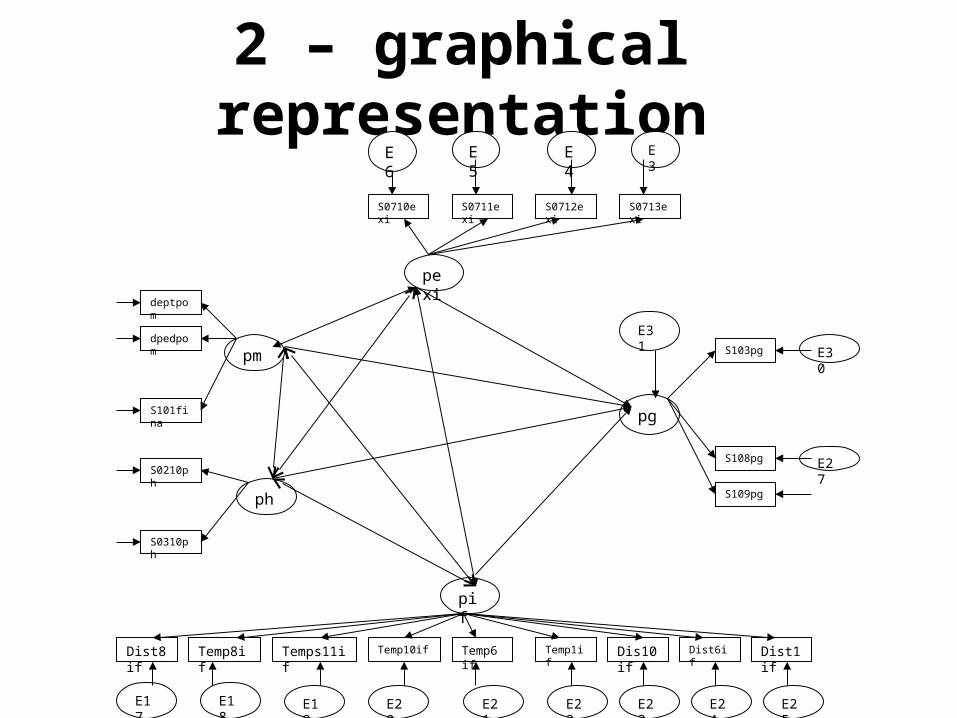
2 – graphical representation
pexi
ph
pm
pif
pg
S0710exi S0711exi S0712exi S0713exi
S103pg
S108pg
S109pg
deptpom
dpedpom
S101fina
S0210ph
S0310ph
Temp10ifTemps11ifTemp8ifDist8if Temp1if Dis10if Dist6if Dist1ifTemp6if
E30
E27
E17 E18 E19 E20 E21 E25E24E23E22
E6
E5
E4
E3
E31
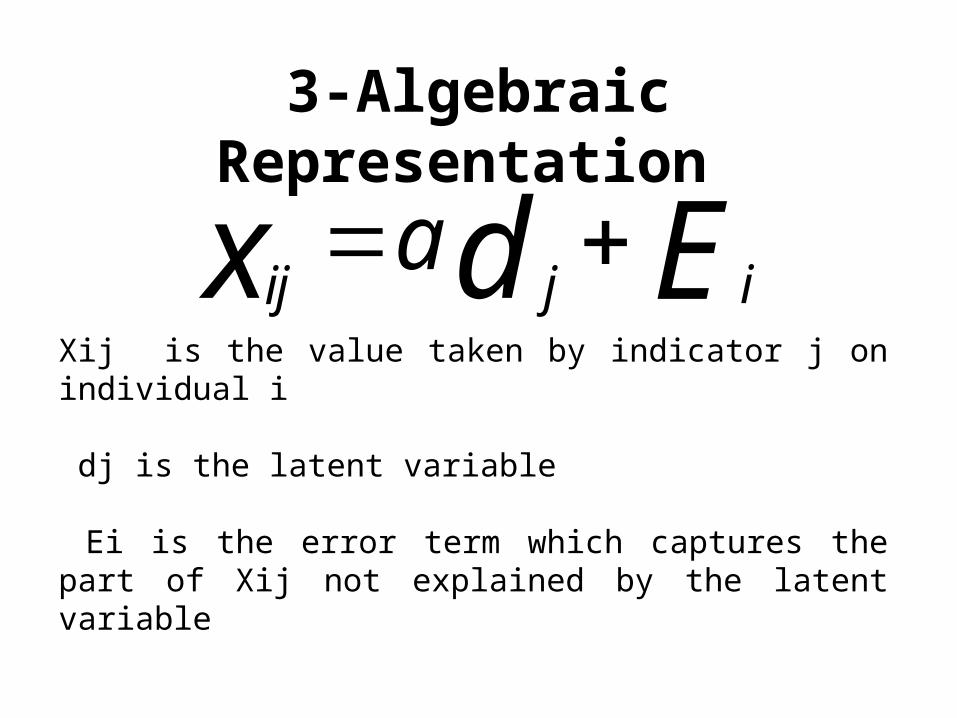
3-Algebraic Representation
Edx ijija
Xij is the value taken by indicator j on individual i
dj is the latent variable
Ei is the error term which captures the part of Xij not explained by the latent variable
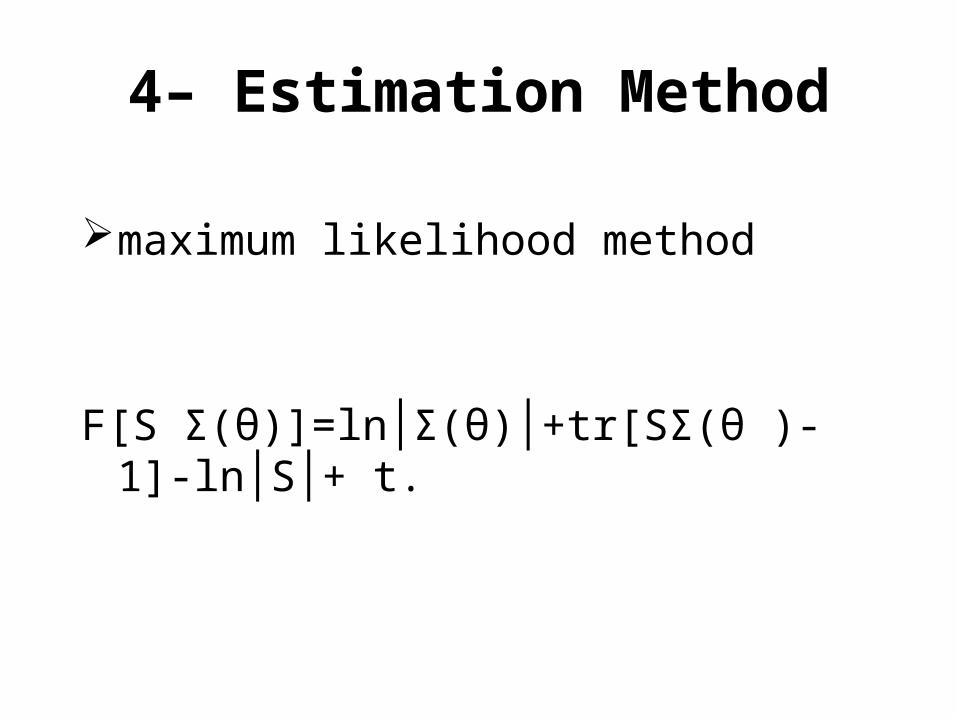
4– Estimation Method
maximum likelihood method
F[S Σ(θ)]=ln│Σ(θ)│+tr[SΣ(θ )-1]-ln│S│+ t.
5– SEM Results.
The estimated coefficients
- confirm the nature of multidimensional poverty
-autogradation is a function of the order of importance of (ph, pif, pexi)
IV –3. Multi-groups modelling
• 1-partition of the population
• 2-formulation of hypotheses.
• 3-Hypothesis testing
1-partition of the population
maximize within group homogeneity and between group heterogeneity
descending method was applied .two cultural spaces relative to the poverty
phenomenon
- bantou-semitique
- Soudano-semibantou
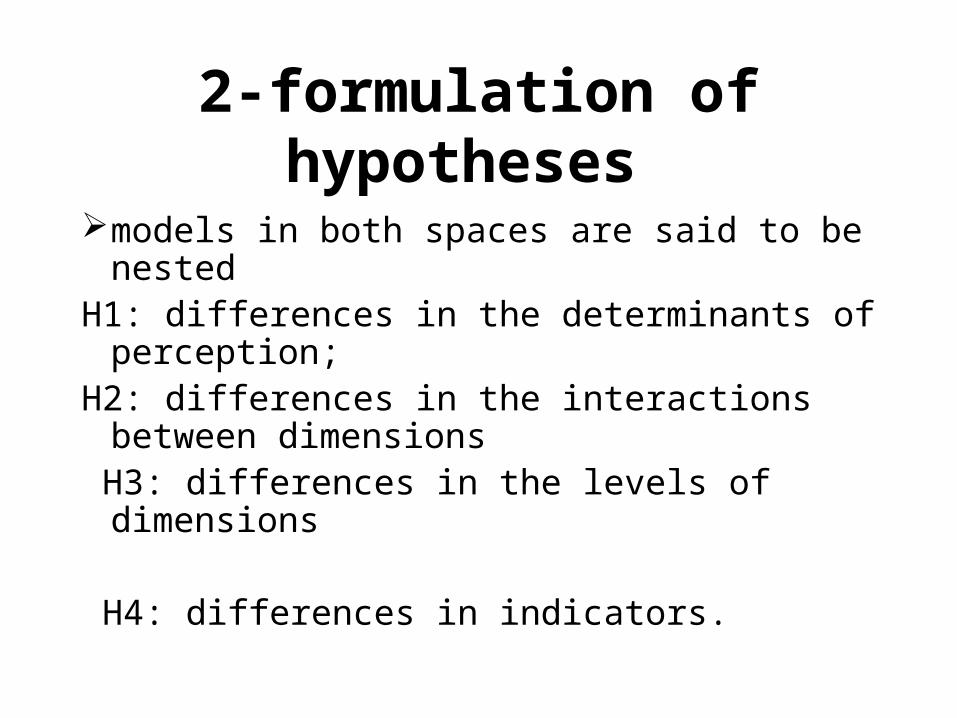
2-formulation of hypotheses
models in both spaces are said to be nested H1: differences in the determinants of
perception; H2: differences in the interactions between
dimensions H3: differences in the levels of dimensions
H4: differences in indicators.
3-Hypothesis Testing Method
Comparing nested models Principles: constrained and unconstrained
Comparison of the constrained model with the unconstrained one is based on the χ2 test.
-
V– THE RESULTS
• 1-The objective differences
• 2-Cultural Mechanisms
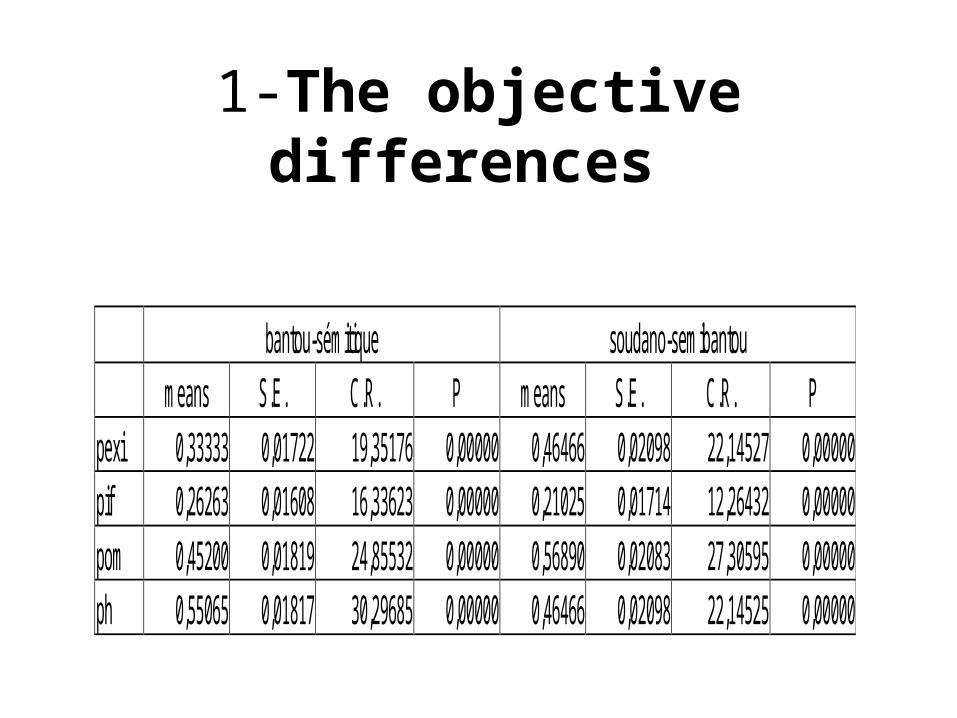
1-The objective differences
bantou-sémitique soudano-semibantou means S.E. C.R. P means S.E. C.R. P pexi 0,33333 0,01722 19,35176 0,00000 0,46466 0,02098 22,14527 0,00000 pif 0,26263 0,01608 16,33623 0,00000 0,21025 0,01714 12,26432 0,00000 pom 0,45200 0,01819 24,85532 0,00000 0,56890 0,02083 27,30595 0,00000 ph 0,55065 0,01817 30,29685 0,00000 0,46466 0,02098 22,14525 0,00000
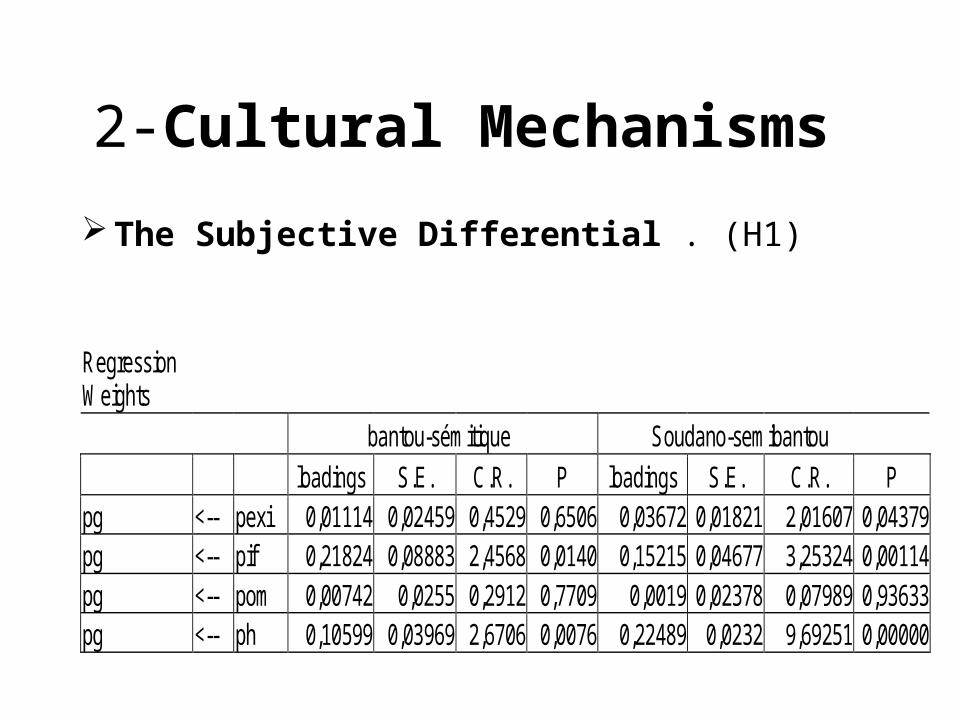
2-Cultural Mechanisms
The Subjective Differential . (H1)
Regression Weights
bantou-sémitique Soudano-semibantou
loadings S.E. C.R. P loadings S.E. C.R. P pg <-- pexi 0,01114 0,02459 0,4529 0,6506 0,03672 0,01821 2,01607 0,04379 pg <-- pif 0,21824 0,08883 2,4568 0,0140 0,15215 0,04677 3,25324 0,00114 pg <-- pom 0,00742 0,0255 0,2912 0,7709 0,0019 0,02378 0,07989 0,93633 pg <-- ph 0,10599 0,03969 2,6706 0,0076 0,22489 0,0232 9,69251 0,00000
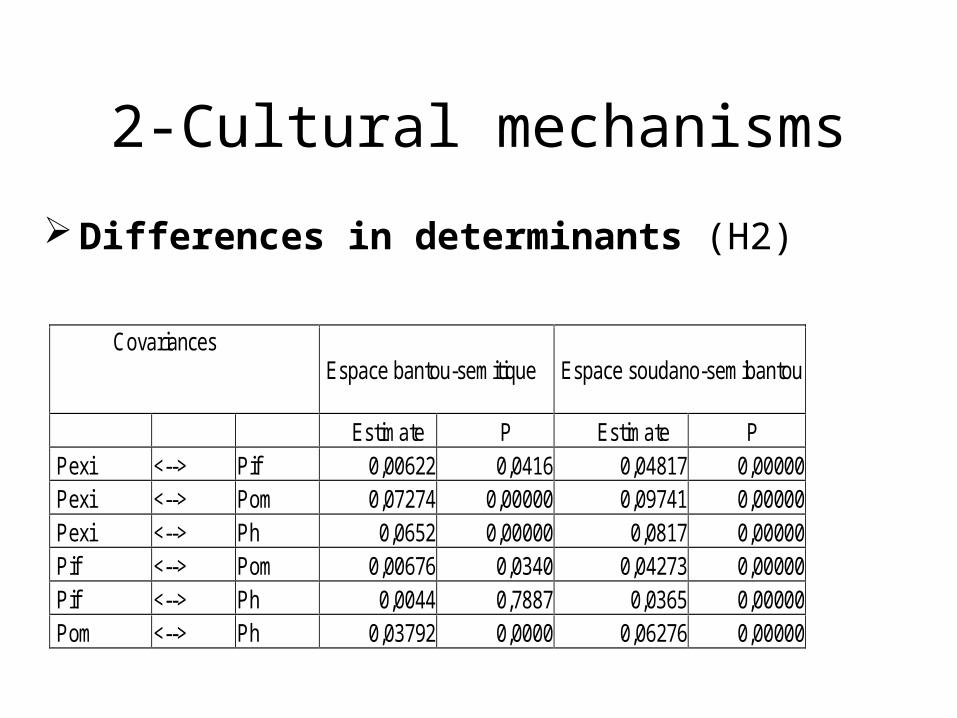
2-Cultural mechanisms
Differences in determinants (H2)
Covariances
Espace bantou-semitique
Espace soudano-semibantou
Estimate P Estimate P Pexi <--> Pif 0,00622 0,0416 0,04817 0,00000 Pexi <--> Pom 0,07274 0,00000 0,09741 0,00000 Pexi <--> Ph 0,0652 0,00000 0,0817 0,00000 Pif <--> Pom 0,00676 0,0340 0,04273 0,00000 Pif <--> Ph 0,0044 0,7887 0,0365 0,00000 Pom <--> Ph 0,03792 0,0000 0,06276 0,00000
VI – POLICY IMPLIMENTATIONS
Taking into account the multidimensional nature of poverty
A prudent decentralization of poverty measurement and of poverty reduction strategies.