Embed Size (px)
Citation preview

Ethnicity

• State
• Nation
• Nation – State
• Nationalism
• Empire

• Ethnicity: Identity with a group of people that share distinct physical and mental traits as a product of common heredity and cultural traditions (Rubenstein)
• Ethnicity: affiliation with a group whose racial, cultural, religious, or linguistic characteristics or national origins distinguish it from a larger population within which it is found (Fellman)

• Ethnocentrism: a tendency to evaluate other culture’s against the standards of one’s own (Fellman 179)
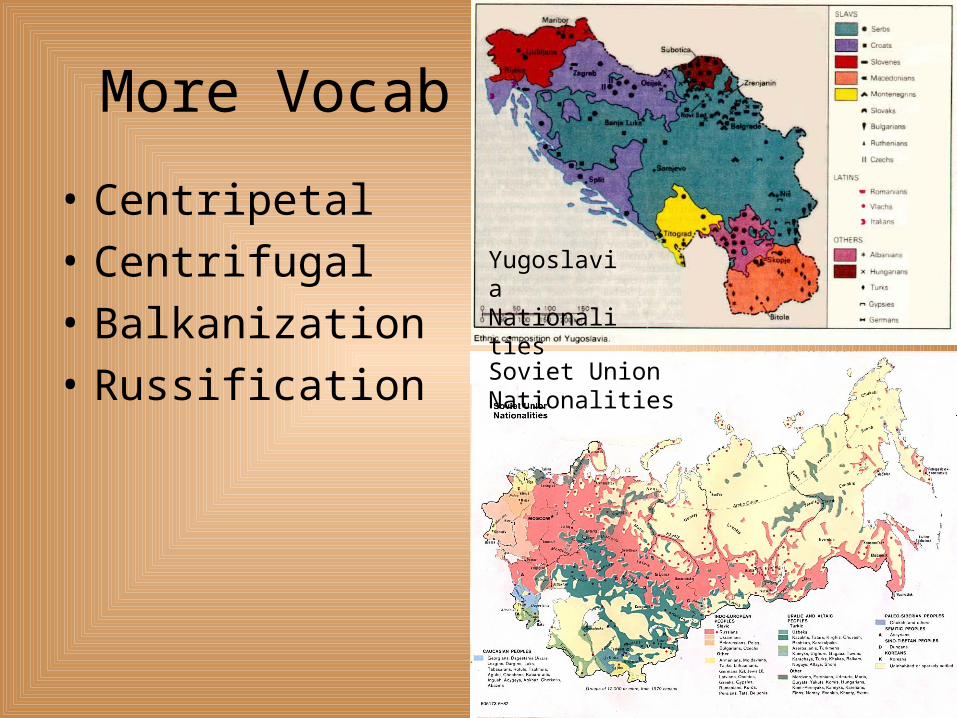
More Vocab
• Centripetal
• Centrifugal
• Balkanization
• Russification
Yugoslavia Nationalities
Soviet Union Nationalities

• For the next few slides: Find the similarities and differences by region
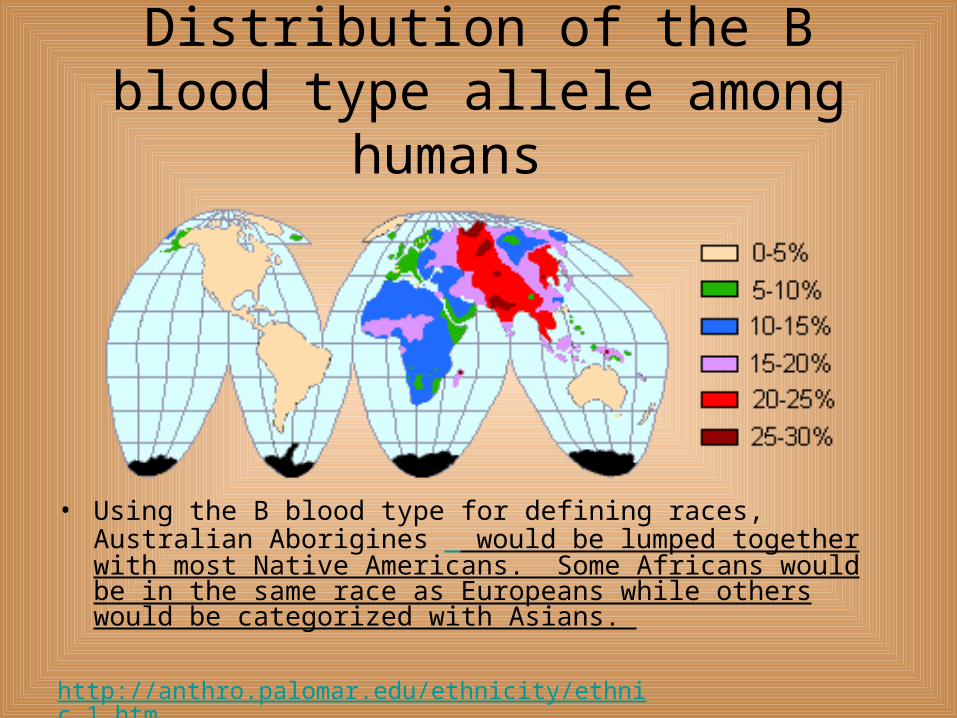
Distribution of the B blood type allele among humans
• Using the B blood type for defining races, Australian Aborigines would be lumped together with most Native Americans. Some Africans would be in the same race as Europeans while others would be categorized with Asians.
http://anthro.palomar.edu/ethnicity/ethnic_1.htm

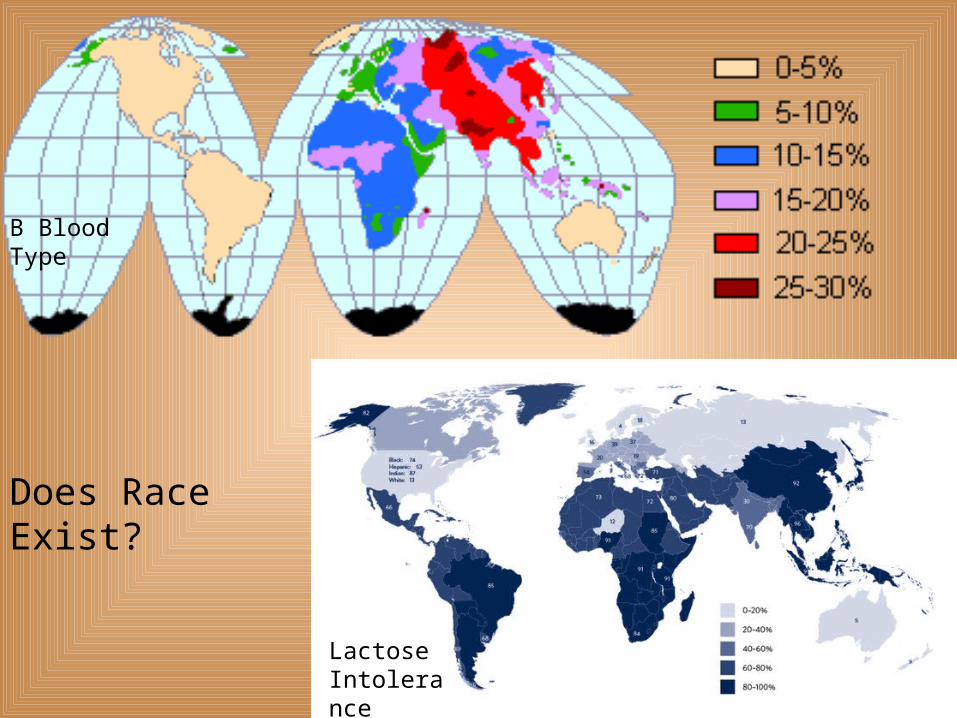
Lactose Intolerance


B Blood Type
Lactose Intolerance
Does Race Exist?

Read
• Does Race Exist?

List the Races
• White
• Black
• Asian
• Native American
• Pacific Islander
Pacific Islander

Recognized Races by US Census
• White• Black or African Am.• Asian• American Indian or
Native Alaskan• Asian Indian• Chinese• Filipino• Japanese
• Korean• Vietnamese • Other Asian• Native Hawaiian• Guamanian or
Chamorro• Samoan• Other Pacific Islander• Other race
Other terms
• Hispanic – from a Spanish-speaking country
• Latino – from a Latin American country

• Hispanic & Latinos can be of any race – for example,
• Many in Argentina are white
• Many in Mexico are Native American
B Blood Type
Lactose Intolerance
Does Race Exist?

Homework
• Part A: On the following slides, answer the questions. Slides do not need to be printed.
• Part B: Read assigned pages from textbook on ethnic conflicts. You will be the only person in the group which has read your assignment. Everyone will be relying on you!– South Africa – p. 228– Ethiopia & Eritrea – p. 237– Sudan – p. 237– Somalia – p. 238– Lebanon – p. 239– South Asia – p. 240– Sri Lanka – p. 240

1. List 2 countries each from a different continent which are mostly homogenous.
2. List 2 countries each from a different continent which are mostly heterogeneous.

3. List 2 countries which may experience ethnic tension. List one reason for your answer.

Distribution of Ethnicities in US
4. Choose 2 ethnic groups and explain the distribution of each.
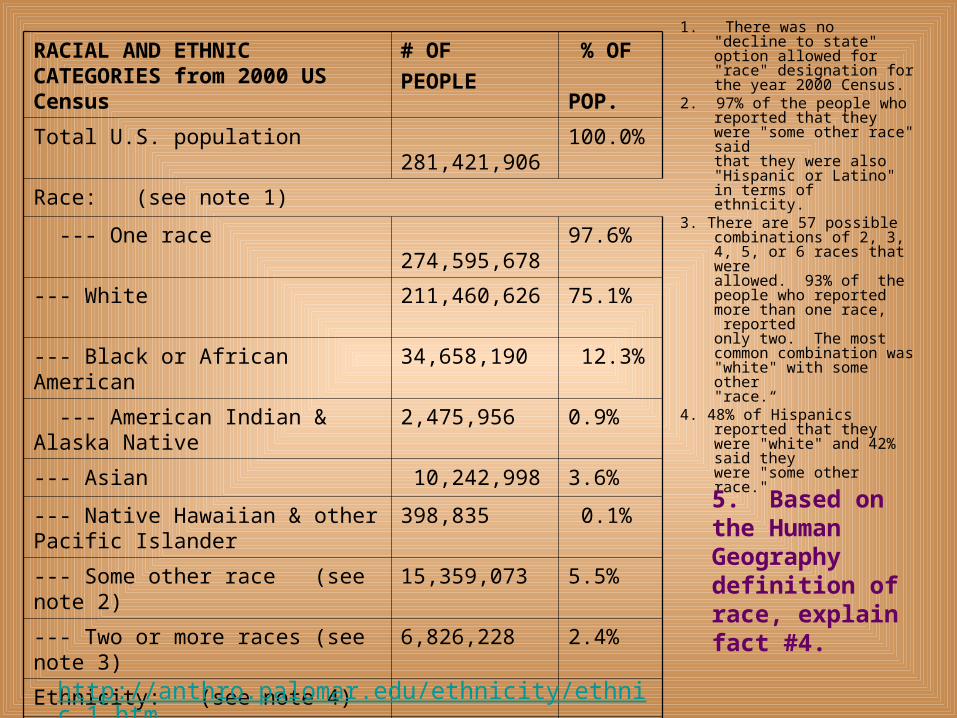
1. There was no "decline to state" option allowed for "race" designation forthe year 2000 Census.
2. 97% of the people who reported that they were "some other race" saidthat they were also "Hispanic or Latino" in terms of ethnicity.
3. There are 57 possible combinations of 2, 3, 4, 5, or 6 races that wereallowed. 93% of the people who reported more than one race, reportedonly two. The most common combination was "white" with some other"race.“
4. 48% of Hispanics reported that they were "white" and 42% said theywere "some other race."
RACIAL AND ETHNIC CATEGORIES from 2000 US Census
# OF
PEOPLE
% OF POP.
Total U.S. population 281,421,906 100.0%
Race: (see note 1)
--- One race 274,595,678 97.6%
--- White 211,460,626 75.1%
--- Black or African American 34,658,190 12.3%
--- American Indian & Alaska Native
2,475,956 0.9%
--- Asian 10,242,998 3.6%
--- Native Hawaiian & other Pacific Islander
398,835 0.1%
--- Some other race (see note 2) 15,359,073 5.5%
--- Two or more races (see note 3) 6,826,228 2.4%
Ethnicity: (see note 4)
--- Hispanic or Latino (of any race) 35,305,818 12.5%
--- Not Hispanic or Latino 246,116,088 87.5%
http://anthro.palomar.edu/ethnicity/ethnic_1.htm
5. Based on the Human Geography definition of race, explain fact #4.

Af-am
• Reflects migration to north in early 20th century
6. List one reason for spatial distribution of African-Americans.

His-am7. List one reason for spatial distribution of Hispanic-Americans.
8. What is the correlation of the distribution of Hispanic-Americans and the dominant religion in the area?

Asia-am8. List two observations about the distribution of Asian-Americans.
9. Explain why Hawaii is in the 50 and above category?

Amerindian, Eskimo, & Aleut10. Why are there so few American Indians in the eastern United States?

11.Explain, using Human Geography vocabulary, the distribution of ethnicities.
12.Explain the large African-American presence.
13.Explain the reason for the spatial distribution of the Chinese.

Forsyth County, NC/ NC• White persons, percent, 2011 (a) 68.1%/72.1% • Black persons, percent, 2011 (a) 27.1%/22.0% • American Indian and Alaska Native persons, percent,
2011 (a) 0.8%/1.5% • Asian persons, percent, 2011 (a) 2.0%/2.3% • Native Hawaiian and Other Pacific Islander persons,
percent, 2011 (a) 0.1%/0.1% • Persons reporting two or more races, percent, 2011
1.9%/1.9% • Persons of Hispanic or Latino Origin, percent, 2011 (b)
12.2%/8.6% • White persons not Hispanic, percent, 2011 58.6%/65.0%• http://quickfacts.census.gov/qfd/states/37/37067.html• Total pop 354,952
14. Add up the percentage of ethnicities in Forsyth Co. Explain your answer.

15. Explain the difference in the racial make-up of Forsyth Co. and Winston-Salem.

wsfcs
• Group wsfcs % West Forsyth %
• Am Indian .2 .2• Asian 2.3 4.0• Black/Afr Am 29.2 13.5• Hispanic 20.6 11.5• Multiracial 4.0 2.2• Natv Hawaiian .1 .2• White 44. 68.• http://www.wsfcs.k12.nc.us/cms/lib/NC01001395/Centricity/Domain/4/2011-
12%20Demographics.pdf 16. Does West Forsyth reflect the racial diversity of Winston-Salem or Forsyth Co.? Defend your answer.

Stop Homework Here


• Ethnic groups in US tend to cluster in cities (Rubenstein 222)
• Why??– Ravenstein’s Laws
• Urban ethnic enclave

Race in the United States
• “separate but equal” doctrine – Plessy vs. Ferguson, 1896
• Brown vs. BOE, Topeka KS, 1954
• “white flight” – 1950’s-1960’s– Blockbusting – Real Estate Agents encourage
white neighbors to sell at a lost, then re-sell higher to African-Americans desperate to escape inner-city

World Examples
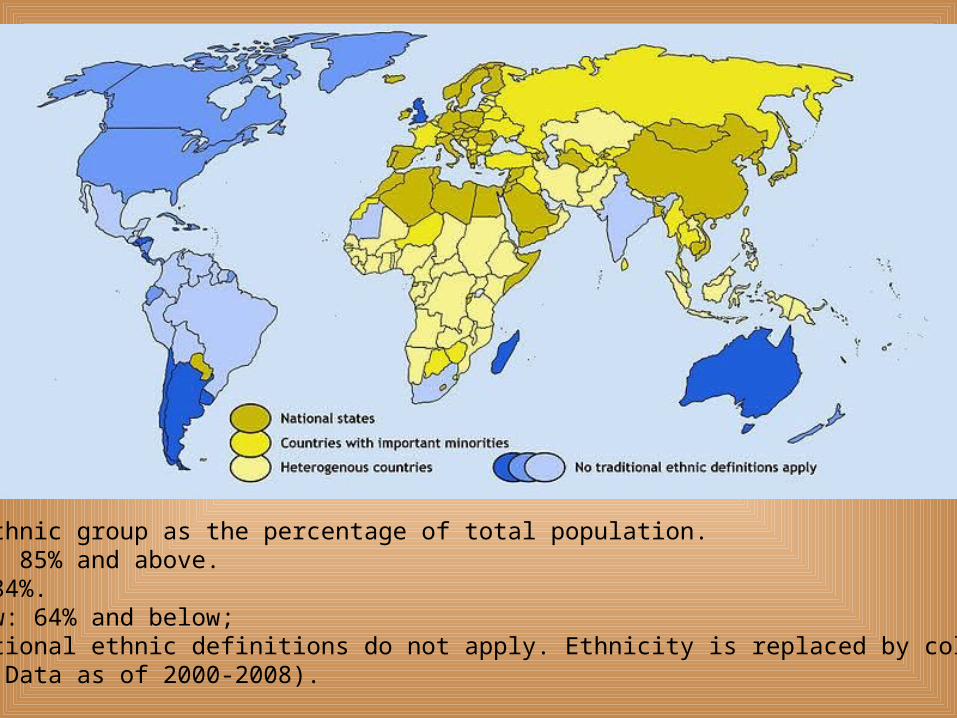
The largest ethnic group as the percentage of total population.* Dark yellow: 85% and above.* Yellow: 65-84%.* Light yellow: 64% and below;* Blue: Traditional ethnic definitions do not apply. Ethnicity is replaced by color of skin.(Source: WFB. Data as of 2000-2008).

Belgium
• Dutch-speaking Flemish
• French-speaking Walloons
• Both consider to be Belgian nationality

United Kingdom
• Multinational– England– Scotland– Wales– Northern Ireland
• Scotland and Wales have separate elected governments
• Each have own national soccer teams
World Cup 2010 Teams


China
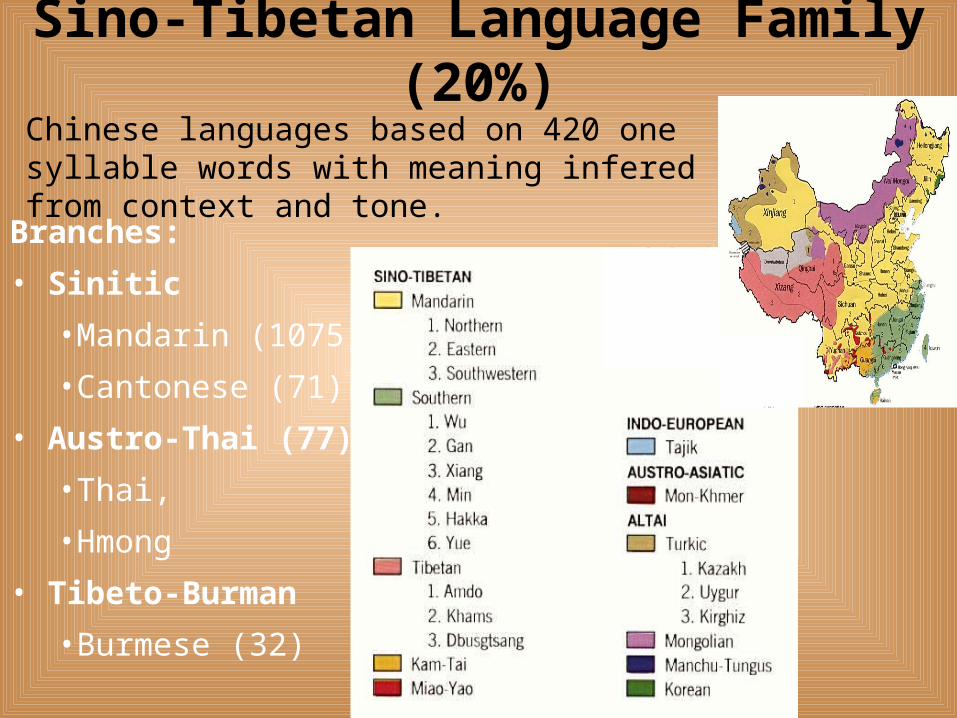
Sino-Tibetan Language Family (20%)
Branches:
• Sinitic
•Mandarin (1075),
•Cantonese (71),
• Austro-Thai (77)
•Thai,
•Hmong
• Tibeto-Burman
•Burmese (32)
Chinese languages based on 420 one syllable words with meaning infered from context and tone.

Sino-Tibetan Language Family (20%)
Language
Ethnicity

Ethnic Conflicts

European colonial empires in 1938
http://anthro.palomar.edu/ethnicity/ethnic_1.htm

Jigsaw
• South Africa – p. 228
• Ethiopia & Eritrea – p. 237
• Sudan – p. 237
• Somalia – p. 238
• Lebanon – p. 239
• South Asia – p. 240
• Sri Lanka – p. 240


Apartheid
• South Africa – 4 races– White– Black– Mixed white and black
(colored)– Asian
• Each race had different legal status
• International pressure to end starting in 1970’s
• Apartheid laws ended in 1991

Indonesia
• Colonized by the Dutch and Japanese• Motto means – Unity through Diversity• 4th most populous nation (largest Muslim country)• Ethnic groups: Javanese 40.6%, Sundanese 15%,
Madurese 3.3%, Minangkabau 2.7%, Betawi 2.4%, Bugis 2.4%,Banten 2%, Banjar 1.7%, other or unspecified 29.9% (2000 census)
• Languages: Bahasa Indonesia (official, modified form of Malay), English, Dutch, local dialects (of which the most widely spoken is Javanese)
• Religions: Muslim 86.1%, Protestant 5.7%, Roman Catholic 3%, Hindu 1.8%, other or unspecified 3.4% (2000 census)

• Secession Movements– Timor-Leste
• Colonized by Portugal• Declared independence in 1975, then invaded by
Indonesia• Independent 2002• Predominantly Roman Catholic
– Has encouraged other ethnicities

Indonesia Secessionist Movements
Aceh• Proposed state: Republic of Aceh
– Militant organisation: Free Aceh Movement (the movement reached an agreement with the Indonesian government in 2005, the separatist movement is no longer exists.
Riau• Proposed state: Riau
South Moluccas• Proposed state: South Moluccas
– Government-in-exile: Republik Maluku Selatan
West Papua• Proposed state: West Papua
– Militant organisation: Free Papua Movement– Government-in-exile: West Paupan Government in exile