Embed Size (px)
Citation preview
Ethnic Diversity and the Quality of Exports:Evidence from Chinese firm-level data ∗
Tuan Anh Luong† Rong Huang ‡
Shenyu Li §
Shanghai University of Finance and Economics
April 16, 2014
Abstract
In this paper, we investigate the impact of ethnic diversity on thequality of export in China. We employ the recent firm-level Chineseexport data together with the National Population Census in 2000. Wefind that ethnically homogeneous provinces export products of 24%higher quality on average than ethnically hetereogeneous provinces.More interestingly, this impact depends on the characteristics of theproducts. In particular, ethnic diversity has a negative impact ondifferentiated products but positive impact on homogeneous products.
∗We would like to thank Volodymyr Lugovskyy, Chen Bo, Li Zhiyuan, Ma Hong, YuMiaojie, Meredith Crowley, Gene Grossman, Sandra Poncet, Gabriel Felbermayr, TonyVenables, Peter Egger and participants in the seminars at Shanghai University of Financeand Economics, Ningbo Nottingham, the University of International Business and Admin-istration, the GEP conference, the Austrasian Trade Workshop for helpful comments. Allthe remaining errors are our own.†Corresponding author: Shanghai University of Finance and Economics, 777 Guoding
Road Shanghai 200433 China. Email: [email protected]‡Contact information: Shanghai University of Finance and Economics, 777 Guoding
Road Shanghai 200433 China. Email: [email protected]§Contact information: Shanghai University of Finance and Economics, 777 Guoding
Road Shanghai 200433 China. Email: [email protected]
1
Keywords: Quality; Exports; Ethnic Diversity; Differentiation;
JEL Classifications: F14.
1 Introduction
Quality of a product plays an important role in economics and more par-ticularly in international trade. For instance, this variable can be used todetermine the pattern of trade of a country. Indeed, according to the Linder(1961) hypothesis, the value of a product is proportional to the income of thebuyer. This hypothesis is supported by Hallak (2006) when he documentsthat rich countries tend to import expensive goods. Also, an implication ofthe Linder hypothesis is that rich countries have a large domestic marketfor high quality goods. As a result, these countries possess the comparativeadvantage in producing high-quality goods. It is then not surprising that thequality of the exported good increases with the income of the exporter. Ac-cording to some estimates by Hummels and Klenow (2005) or Schott (2004),the quality of exports increase by up to 23% when the GDP per capita dou-bles.
Upgrading the quality of products is seen as an indicator of export andgrowth success. The workhorse trade model predicts that only large andproductive firms can survive trade liberalization (Melitz, 2003). This pre-diction is widely supported in many studies. Moreover, they are more likelyto upgrade their product quality. Indeed, Verhoogen (2008) document thatfirms in Mexico are more likely to train their workers and pass the qualitycontrol (an indicator that they upgraded their product quality) when theyare large. Hence, observing better exported products indicates a more lib-eralized market. Moreover, better quality products bring more added value,which boosts the income of the country.
The quality of products has not received enough attention in the lit-erature because unlike other economic variables such as GDP, it is not di-rectly observed from the data. Only recently have suffi cient metrics for thisvariable been discovered, thus the literature on quality has started growing.Unit value was the first natural candidate (Schott, 2004): expensive productsare often of high quality. This measure, however, could be noisy especially
2
for certain products, in particular the ones with a narrow range of quality(Khandelwal, 2010). Since then, improved measures of quality based on thedemand function have been found. The idea is that conditional on prices,the products with better sale values are of higher quality (see for instance,Hallak and Schott, 2011; Khandelwal, 2010).
These new measures of quality allow economists to understand this vari-able. On the macro level, country-specific factors can play a role here. Kr-ishna and Maloney (2011) show that controlling for the product mix, OECDcountries exported products that were of better quality and with a fastergrowth rate in quality than non-OCED countries. Hidalgo et al. (2007) alsoshow that the pattern of the country’s specialization depends on the "po-sition" of this country. In particular, it can only specialize in and developproducts that are close or "related" to its core products. Natural variables,such as the distance between the exporter and the importer, could also influ-ence the quality of export, a phenomenon known as The Washington AppleEffect: countries tend to export higher quality goods to more distant loca-tions (Bastos and Silva, 2010). On the micro level, firms export high qualitygoods because of their superior productivity (Johnson, 2012) and their betterinputs (Manova and Zhang, 2012).
The novelty of our paper is to propose a new factor that has significantimpact on the production of better products. This new factor is ethnic diver-sity, which is already used to explain the rate of economic growth. Accordingto Easterly and Levine (1997), ethnic diversity is one of the reasons for theAfrica’s growth tragedy. They find that the most fractionalized countries inAfrica were also the poorest countries. Also, Africa lagged behind East Asiaas the former was more fractionalized than the latter. In an excellent surveyAlesina and Ferrara (2005) provide the "pros" and "cons" of ethnic diversity.On the one hand, the skills of individuals from different ethnic groups arecomplementary in the production process; therefore more diversity impliesimproved effi ciency. On the other hand, different ethnic groups have differentpreferences over the consumption of the public goods, leading to conflicts.The intersection of these two forces determines the impact of ethnic diversityon the economic performance of a region. In the spirit of these studies, wepose ourselves a different question: Does ethnic diversity have a statisticallyand economically significant impact on the quality of exports?
In order to answer this question, we take China as our case study. Over
3
the last decade the value of Chinese exports has risen substantially withan annual growth rate of more than 20 percent. In 2010, China surpassedGermany to become the largest exporter in the world by value. However,Chinese export cannot be fully explained by traditional economic models.The Chinese export basket is more sophisticated and complicated than canbe accounted for by its income level (Rodrik, 2006) alone. Their exportprofile overlaps with those from the OCED countries (Schott, 2008). More-over, the Chinese government is shifting their export base from "quantity"to "quality". Chinese exports have been pegged as low in both cost andquality, with "Made in China" seen as a pejorative label. To understandhow exports could be upgraded in terms of quality is therefore important forpolicy makers.
China is also an ethnically diverse country with 56 ethnic groups thein mainland, with 19 of the groups having more than 1 million memberseach. They occupy several autonomous regions such as the Inner Mongo-lia , Guangxi Zhuang, Tibet, Ningxia Hui and Xingjian Uygur AutonomousRegions. There are also sub-provincial autonomous prefectures, as well as au-tonomous prefectures, counties, townships and villages scattered in all partsof China (see Figure 1). Therefore China is a good case to study the impactof diversity on their growing export.
Using our custom data from China’custom bureau, we find evidence thatethnic diversity does have a significant impact on the quality of products. Ex-port from a hypothetical, completely ethnically heterogeneous province (i.e.where everyone belongs to a different ethnic group) in general shows greaterthan 30% lower quality as compared to a completely homogenous province(where everyone belongs to the same ethnic group). Additionally, we findthat the impact depends on the characteristics of the product. In particular,while ethnic diversity lowers the quality the differentiated products, it canraise the quality of homogeneous goods. This result helps us to shed light onhow ethnic diversity affects the quality of products in the region.
We can explain our findings by the following argument: people fromdifferent ethnic groups have different qualifications such as knowledge, expe-rience, etc. that potentially improve the quality of exports. As Lazear (1999)points out, these qualifications have to be relevant and easily exchanged orlearned. It is possible that different experiences and cultures are more rel-evant in homogenous agriculture than in differentiated manufacturing. For
4
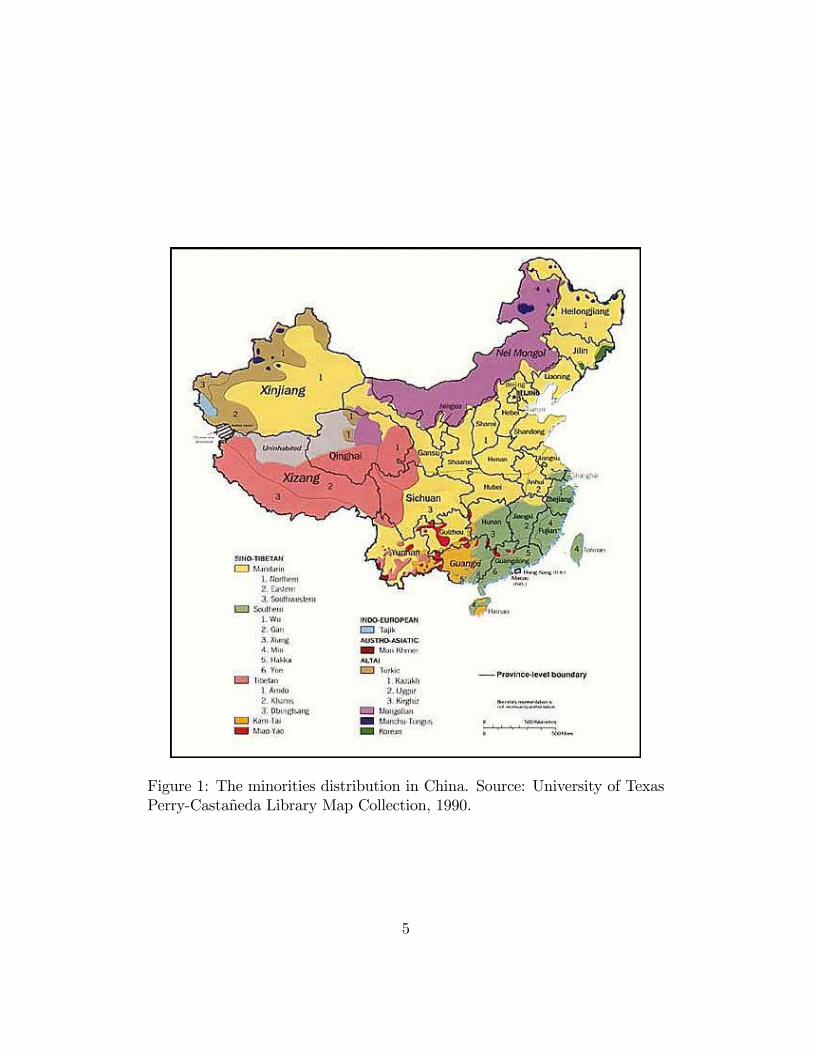
Figure 1: The minorities distribution in China. Source: University of TexasPerry-Castañeda Library Map Collection, 1990.
5
instance, knowledge and experience from his ancestors help the farmer tohave a successful crop. However, people from different ethnic groups havediffi culty communicating. With different background, they could interpretthe same object or notion by different ways. Indeed, according to the linguis-tic relativity principle, or the Sapir—Whorf hypothesis, speakers of differentlanguages tend to think and behave differently depending on the languagethey use. A common object is therefore interpreted in different ways acrossdifferent groups. This divergence is greatly exaggerated by the complexity ofthe ideas. In our context, heterogeneous goods are more complex than homo-geneous goods because they have different varieties, thus more characteristicsthan the latter.
Another way to explain our result is the following: on the one hand, a di-versified team helps to internationalize the products and the firm. As a result,the firm can fare better in foreign market. A recent study by Parrotta, Poz-zoli and Sala (2014) shows that the firms with a diversified workforce tendto have better export performance than their counterparts. On the otherhand, our data shows that workers in differentiated sectors are complemen-tary rather than substitutable. As a result, they have to collaborate closelyto produce differentiated goods. In this case, miscommunication because offractionalization can be a hindrance to the success of the firm.
Our paper can fit in well in the comparative advantage in trade litera-ture. The conventional sources of comparative advantage are productivityas in the Ricardian model and factor endowment as in the Heckscher-Ohlinmodel. Recently Grossman and Maggi (2000) showed that the distributionof factor endowment also play a role. In particular, the country with a rel-atively homogenous population exports the goods produced by a technologywith a higher degree of complementarity tasks while the country with a morediverse workforce exports the goods for which individual success is more im-portant. Matching between workers and firms is also another source (Gross-man, Helpman and Kircher, 2013). Empirically, Bombardini et al. (2012)provide evidence that countries with dispersed skill distribution specialize insectors with a lower degree of complementarity in workers’skill. Our paper isin line with these studies: our results suggest that heterogeneous provinces orcountries have the comparative advantage in producing differentiated goodswith high quality.
The organization of the paper is as follows. Our data will be presented in
6
Section 2. Section 3 lays out the empirical strategy and presents our results.We will show some robustness checks in Section 3.2 and Section 4 concludes
2 Data
2.1 The case of China export
For the past thirty years, China economic growth has been the result ofgenerally well-thought out five-year economic plans. A major part of thissuccess is driven by fast growing exports in most sectors. China now tradeswith more than 200 nations and territories, making it the largest exporter inthe world.
One of the more diffi cult problems for a developing country to solve ishow to change the perception that their exports are both low in price andquality (see Midler, 2009). In order to broaden their export base, somecountries work to upgrade the quality of products.
In this project we will employ customs data which records all types oftrade, including processing trade, exchanges between international organiza-tions, required materials and machines in an oversea contract, etc. However,as Dai, Maitra and Yu (2011) suggested, it is crucial to separate the process-ing trade away from other exporters in China. Indeed, they documentedthat, unlike other countries processing trade exporters, China is less produc-tive and creates less value add per worker than other industries. For thisreason, we eliminated processing trade from our study. In particular, we fo-cus on general trade as the quality of the goods in other forms of trade suchas gifts and exchanges are less likely to be decided by the production source.This type of general trade accounted for 55% of the total export from Chinain 2000.
In order to limit our study to manufacturing firms, and also to includethe enterprises’ characteristics into our project, therefore, we merged thisdataset with data from an industrial survey on manufacturing firms in China
7
conducted by the National Bureau of Statistics. This survey covers all enter-prises with annual revenue greater than CNY 5 million ( or equivalently USD800,000 ). This merged data accounts for 31% of the total export in 2000and 10% of the companies in the industrial data. This is our main datasetused in the project.
2.2 Ethnic diversity in China
As we argue above, China is a country with many ethnical groups. In order tomeasure the fractionalization across provinces, we follow Easterly and Levine(1997) and the literature to compute the ethno-linguistic fractionalization:
Divp = 1−∑k
n2pk
where npk is the population share of group j in province p. This indexrepresents the probability that two randomly selected individuals in the sameregion belong to different ethnic groups. In other words, a high Divp indexindicates that province p is ethnically diverse. This variable takes the value1 when the province is completely heterogeneous and 0 when the province iscompletely homogeneous.
The population distribution is taken from the China National PopulationCensus Data in 2000. We show the ethnic distribution across provinces inTable 3. Using kernel density technique , we are able to draw Figure 2 thatshows that there is a large distribution of ethnic groups across provinces,which we utilize in our study
2.3 The quality of Exports in China
As quality is not observable, we have to estimate this variable. We followBerry (1994) suggestion that quality can be estimated as the excess salesafter controlling for price, an idea that has been used widely (for instance,Hallak and Schott, 2011; Khandelwal, 2010).
In particular, we build the utility in the sector from the CES framework:
8
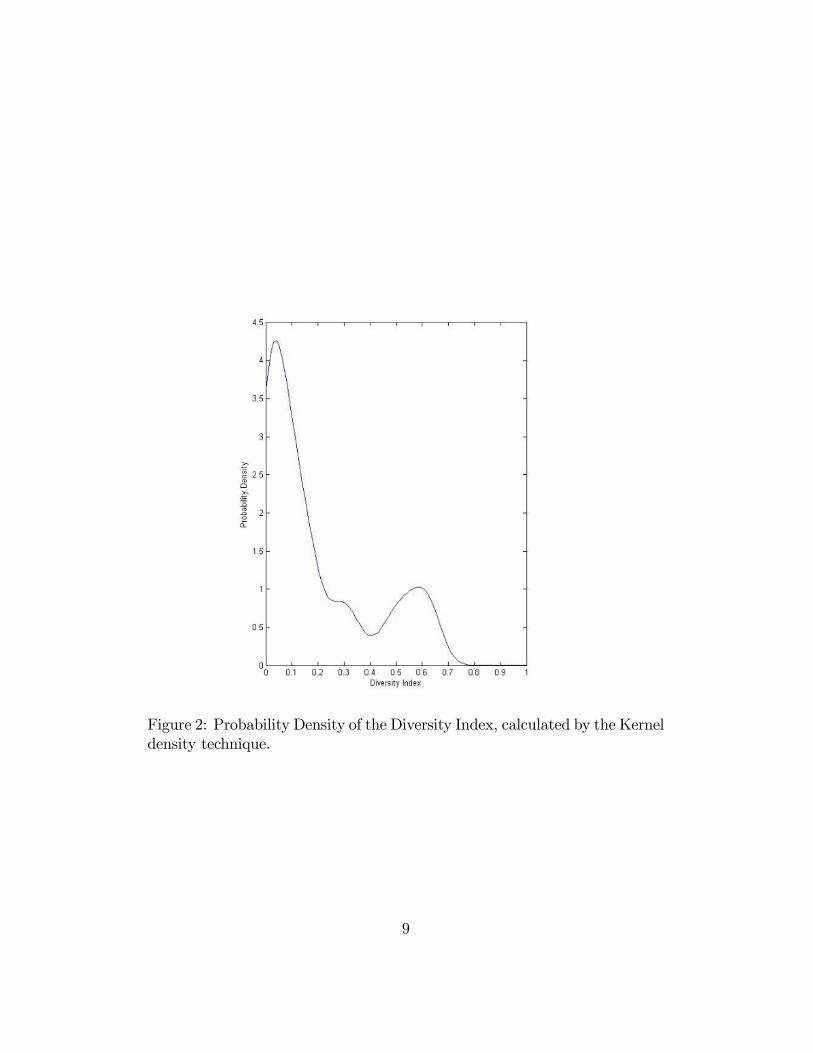
Figure 2: Probability Density of the Diversity Index, calculated by the Kerneldensity technique.
9
U =
∫i∈Ω
θ1σi (qi)
σ−1σ di
σσ−1
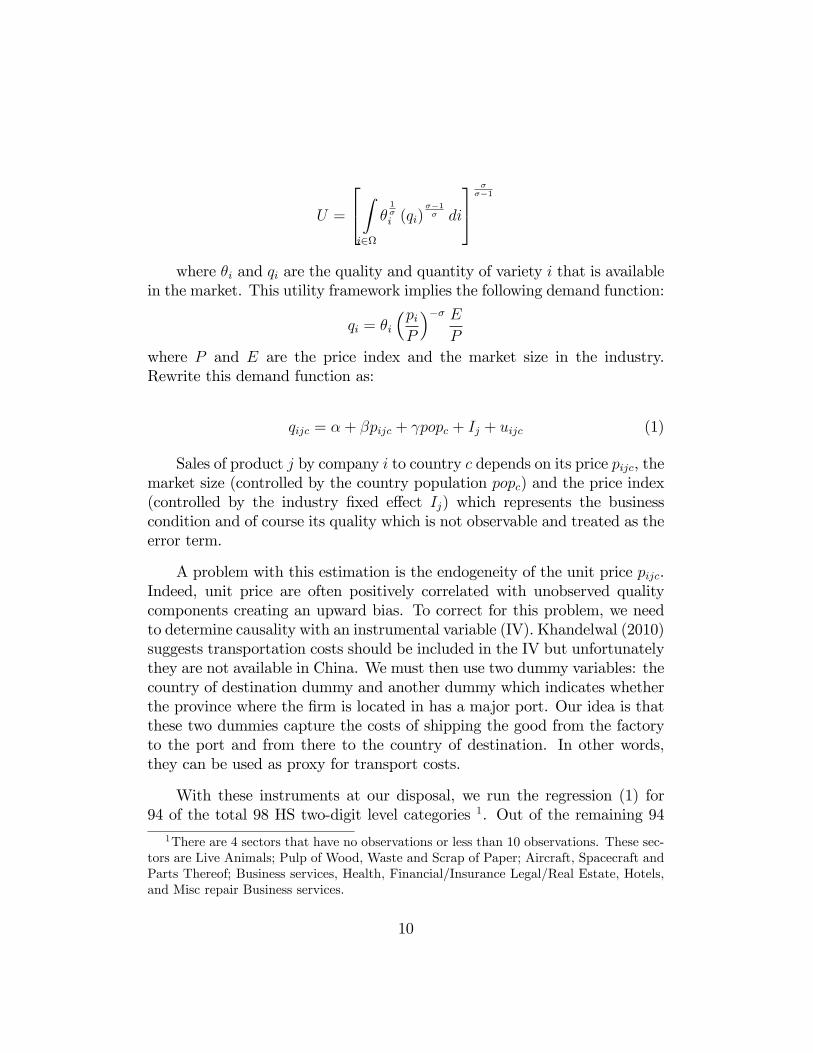
where θi and qi are the quality and quantity of variety i that is availablein the market. This utility framework implies the following demand function:
qi = θi
(piP
)−σ EP
where P and E are the price index and the market size in the industry.Rewrite this demand function as:
qijc = α + βpijc + γpopc + Ij + uijc (1)
Sales of product j by company i to country c depends on its price pijc, themarket size (controlled by the country population popc) and the price index(controlled by the industry fixed effect Ij) which represents the businesscondition and of course its quality which is not observable and treated as theerror term.
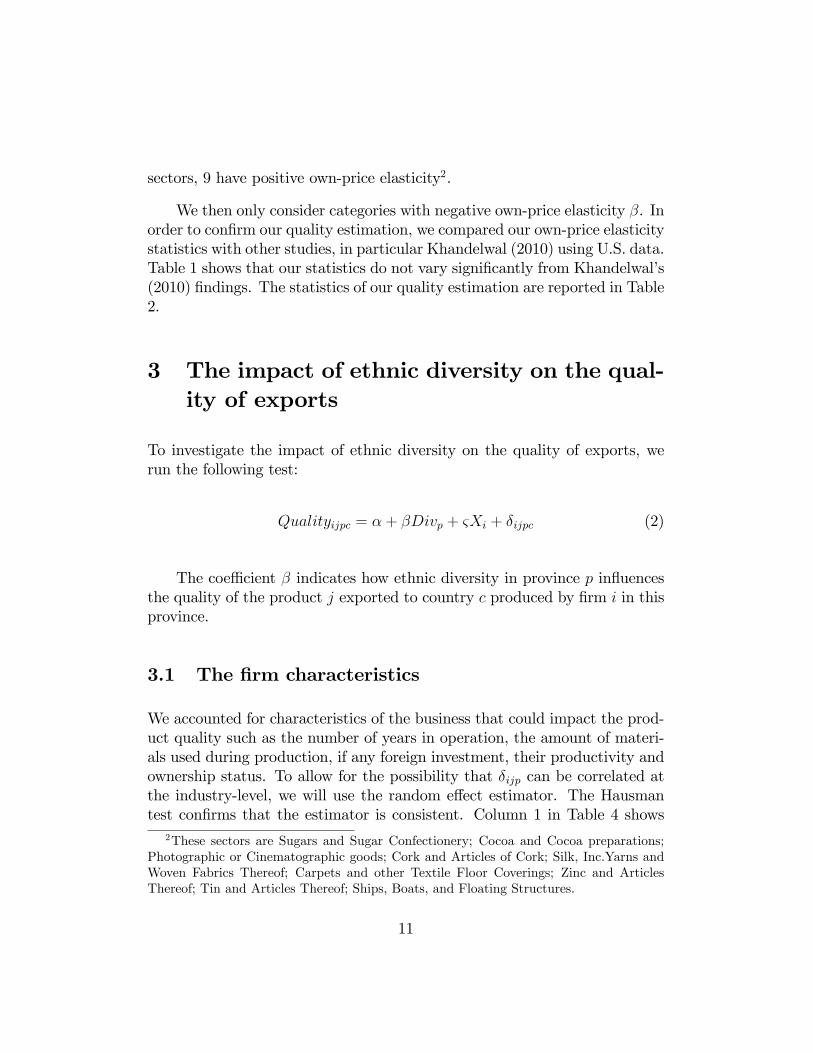
A problem with this estimation is the endogeneity of the unit price pijc.Indeed, unit price are often positively correlated with unobserved qualitycomponents creating an upward bias. To correct for this problem, we needto determine causality with an instrumental variable (IV). Khandelwal (2010)suggests transportation costs should be included in the IV but unfortunatelythey are not available in China. We must then use two dummy variables: thecountry of destination dummy and another dummy which indicates whetherthe province where the firm is located in has a major port. Our idea is thatthese two dummies capture the costs of shipping the good from the factoryto the port and from there to the country of destination. In other words,they can be used as proxy for transport costs.
With these instruments at our disposal, we run the regression (1) for94 of the total 98 HS two-digit level categories 1. Out of the remaining 94
1There are 4 sectors that have no observations or less than 10 observations. These sec-tors are Live Animals; Pulp of Wood, Waste and Scrap of Paper; Aircraft, Spacecraft andParts Thereof; Business services, Health, Financial/Insurance Legal/Real Estate, Hotels,and Misc repair Business services.
10
sectors, 9 have positive own-price elasticity2.
We then only consider categories with negative own-price elasticity β. Inorder to confirm our quality estimation, we compared our own-price elasticitystatistics with other studies, in particular Khandelwal (2010) using U.S. data.Table 1 shows that our statistics do not vary significantly from Khandelwal’s(2010) findings. The statistics of our quality estimation are reported in Table2.
3 The impact of ethnic diversity on the qual-ity of exports
To investigate the impact of ethnic diversity on the quality of exports, werun the following test:
Qualityijpc = α + βDivp + ςXi + δijpc (2)
The coeffi cient β indicates how ethnic diversity in province p influencesthe quality of the product j exported to country c produced by firm i in thisprovince.
3.1 The firm characteristics
We accounted for characteristics of the business that could impact the prod-uct quality such as the number of years in operation, the amount of materi-als used during production, if any foreign investment, their productivity andownership status. To allow for the possibility that δijp can be correlated atthe industry-level, we will use the random effect estimator. The Hausmantest confirms that the estimator is consistent. Column 1 in Table 4 shows
2These sectors are Sugars and Sugar Confectionery; Cocoa and Cocoa preparations;Photographic or Cinematographic goods; Cork and Articles of Cork; Silk, Inc.Yarns andWoven Fabrics Thereof; Carpets and other Textile Floor Coverings; Zinc and ArticlesThereof; Tin and Articles Thereof; Ships, Boats, and Floating Structures.
11
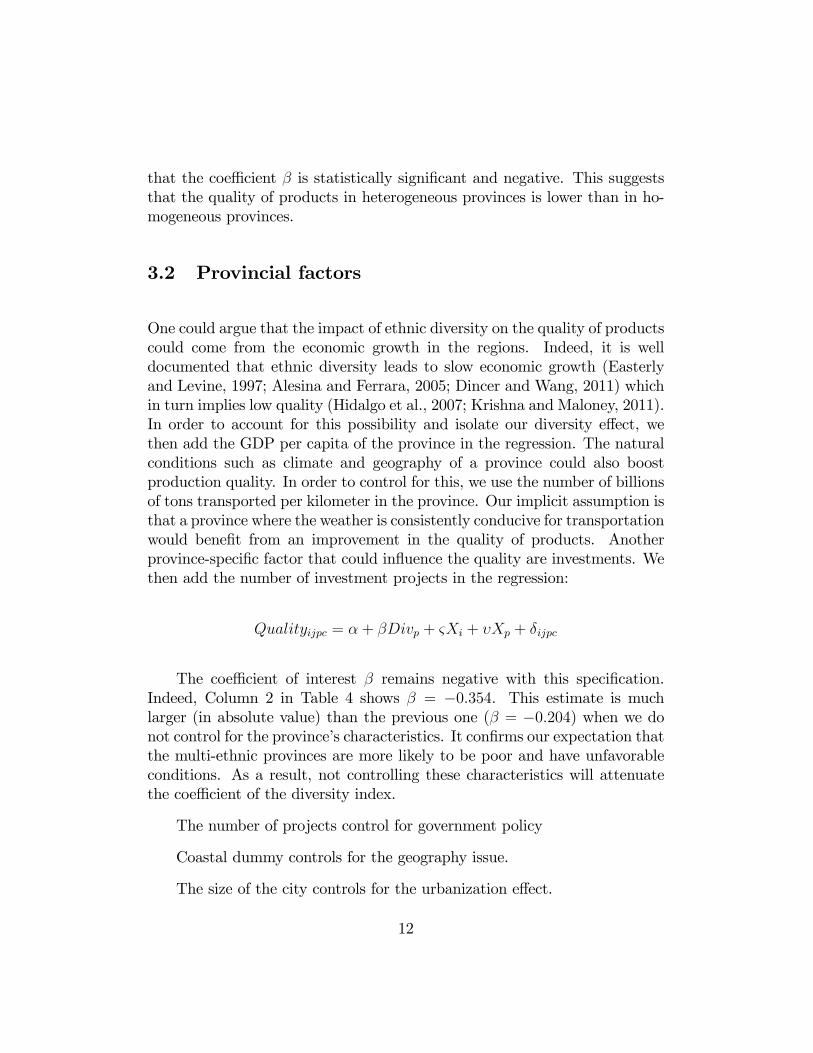
that the coeffi cient β is statistically significant and negative. This suggeststhat the quality of products in heterogeneous provinces is lower than in ho-mogeneous provinces.
3.2 Provincial factors
One could argue that the impact of ethnic diversity on the quality of productscould come from the economic growth in the regions. Indeed, it is welldocumented that ethnic diversity leads to slow economic growth (Easterlyand Levine, 1997; Alesina and Ferrara, 2005; Dincer and Wang, 2011) whichin turn implies low quality (Hidalgo et al., 2007; Krishna and Maloney, 2011).In order to account for this possibility and isolate our diversity effect, wethen add the GDP per capita of the province in the regression. The naturalconditions such as climate and geography of a province could also boostproduction quality. In order to control for this, we use the number of billionsof tons transported per kilometer in the province. Our implicit assumption isthat a province where the weather is consistently conducive for transportationwould benefit from an improvement in the quality of products. Anotherprovince-specific factor that could influence the quality are investments. Wethen add the number of investment projects in the regression:
Qualityijpc = α + βDivp + ςXi + υXp + δijpc
The coeffi cient of interest β remains negative with this specification.Indeed, Column 2 in Table 4 shows β = −0.354. This estimate is muchlarger (in absolute value) than the previous one (β = −0.204) when we donot control for the province’s characteristics. It confirms our expectation thatthe multi-ethnic provinces are more likely to be poor and have unfavorableconditions. As a result, not controlling these characteristics will attenuatethe coeffi cient of the diversity index.
The number of projects control for government policy
Coastal dummy controls for the geography issue.
The size of the city controls for the urbanization effect.
12
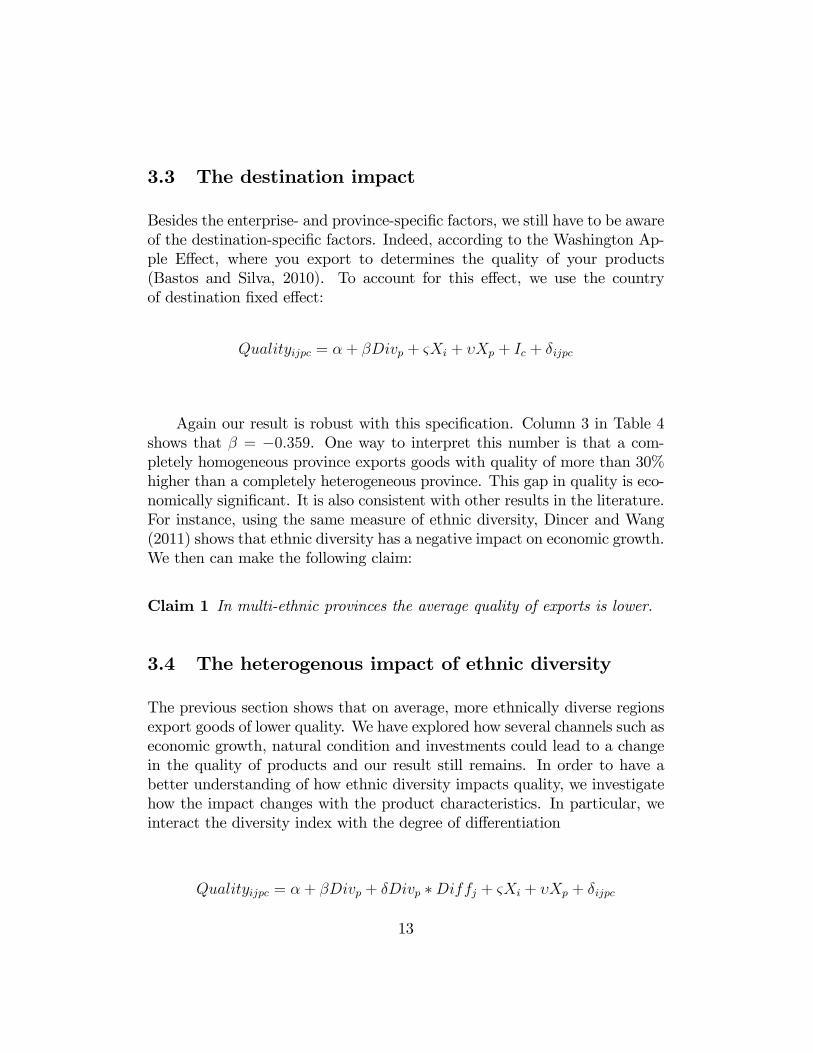
3.3 The destination impact
Besides the enterprise- and province-specific factors, we still have to be awareof the destination-specific factors. Indeed, according to the Washington Ap-ple Effect, where you export to determines the quality of your products(Bastos and Silva, 2010). To account for this effect, we use the countryof destination fixed effect:
Qualityijpc = α + βDivp + ςXi + υXp + Ic + δijpc
Again our result is robust with this specification. Column 3 in Table 4shows that β = −0.359. One way to interpret this number is that a com-pletely homogeneous province exports goods with quality of more than 30%higher than a completely heterogeneous province. This gap in quality is eco-nomically significant. It is also consistent with other results in the literature.For instance, using the same measure of ethnic diversity, Dincer and Wang(2011) shows that ethnic diversity has a negative impact on economic growth.We then can make the following claim:
Claim 1 In multi-ethnic provinces the average quality of exports is lower.
3.4 The heterogenous impact of ethnic diversity
The previous section shows that on average, more ethnically diverse regionsexport goods of lower quality. We have explored how several channels such aseconomic growth, natural condition and investments could lead to a changein the quality of products and our result still remains. In order to have abetter understanding of how ethnic diversity impacts quality, we investigatehow the impact changes with the product characteristics. In particular, weinteract the diversity index with the degree of differentiation
Qualityijpc = α + βDivp + δDivp ∗Diffj + ςXi + υXp + δijpc
13
Here we use the dispersion of quality within the industry as a measureof product differentiation. Column 1 in Table 5 shows that while ethnicdiversity lowers the quality of exports in general, the impact changes withthe degree of differentiation. Indeed, the positive sign of β suggests thatethnic diversity could have a positive impact on homogeneous products. Theinteraction between the diversity index and the degree of differentiation hasa negative coeffi cient, indicating that the more differentiated the product,the more ethnic diversity reduces its quality. Indeed, when we limit our datato products with the quality dispersion lower than 4.18 (10th percentile)the impact of ethnic diversity is positive. However, when the products aredifferentiated, the impact will become negative. We then have our secondfinding:
Claim 2 The impact of ethnic diversity varies across products: the moredifferentiated the product, the more ethnic diversity reduces quality.
3.5 Robustness check
In the previous section, our regression results suggest that the negative im-pact of diversity on quality is robust to various specifications. In this section,we will check for robustness with other methods. Firstly in the benchmarkregression, we apply the random effects estimator. While this estimator ismore effi cient, one could worry about its inconsistency. Being aware of thisconcern, we will cross-reference with the fixed effects model. Column 4 inTable 4 shows that our results are still robust with this estimator, althoughthe coeffi cient is slightly smaller in absolute term. Indeed, provinces that areethnically homogeneous export products of quality 21% higher than multi-ethnic provinces. We can also use the fixed effects estimator when we checkthe impact of diversity across different products. Results reported in Column2 in Table 5 confirm that ethnic diversity could have a positive impact onhomogeneous products but its impact becomes negative with differentiatedproducts.
Another concern is the measure of our independent variables, in partic-ular the diversity index. Beside the group fragmentation as the Div indexprovides us, we can also look at the polarization of the group. We then
14
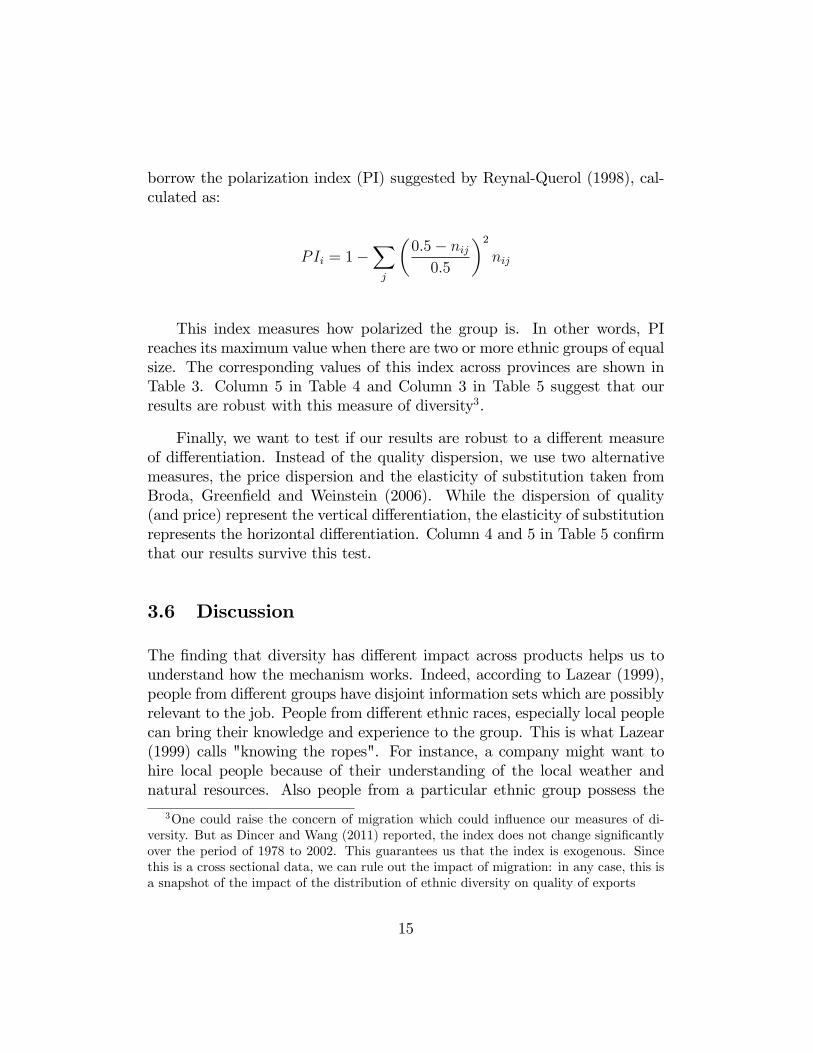
borrow the polarization index (PI) suggested by Reynal-Querol (1998), cal-culated as:
PIi = 1−∑j
(0.5− nij0.5
)2
nij
This index measures how polarized the group is. In other words, PIreaches its maximum value when there are two or more ethnic groups of equalsize. The corresponding values of this index across provinces are shown inTable 3. Column 5 in Table 4 and Column 3 in Table 5 suggest that ourresults are robust with this measure of diversity3.
Finally, we want to test if our results are robust to a different measureof differentiation. Instead of the quality dispersion, we use two alternativemeasures, the price dispersion and the elasticity of substitution taken fromBroda, Greenfield and Weinstein (2006). While the dispersion of quality(and price) represent the vertical differentiation, the elasticity of substitutionrepresents the horizontal differentiation. Column 4 and 5 in Table 5 confirmthat our results survive this test.
3.6 Discussion
The finding that diversity has different impact across products helps us tounderstand how the mechanism works. Indeed, according to Lazear (1999),people from different groups have disjoint information sets which are possiblyrelevant to the job. People from different ethnic races, especially local peoplecan bring their knowledge and experience to the group. This is what Lazear(1999) calls "knowing the ropes". For instance, a company might want tohire local people because of their understanding of the local weather andnatural resources. Also people from a particular ethnic group possess the
3One could raise the concern of migration which could influence our measures of di-versity. But as Dincer and Wang (2011) reported, the index does not change significantlyover the period of 1978 to 2002. This guarantees us that the index is exogenous. Sincethis is a cross sectional data, we can rule out the impact of migration: in any case, this isa snapshot of the impact of the distribution of ethnic diversity on quality of exports
15
required skill for certain tasks, a phenomenon called "best practices" byLazear (1999). A diverse team is more likely to have the necessary personthan a homogenous team.
To realize the gains of diversity, the information from different groupsmust be relevant and easily learned or transferred. "Knowing the ropes" and"best practices" are more likely to be relevant in homogenous sectors such asagriculture. Western provinces such as Sichuan where many ethnic groupslive are well known for their traditional food. In differentiated sectors such asmanufacturing, local experience and culture are of less importance. Whetherthe disjoint information can be easily learned or transferred depends on howpeople communicate. People with different background and culture face morediffi culty when they engage in conversation and discussion. This problem ismore serious when workers are complementary rather than substitutable.This complementarity among workers requires all of them to perform theirtask well, which is more diffi cult when they cannot communicate effi ciently.Another point we can make here is that people from different groups have lesssympathy towards each other than if they belong to the same ethnic group.Again, if the workers are substitutable, this causes little problem to the team.But when they are complementary, the disharmony problem becomes moreserious.
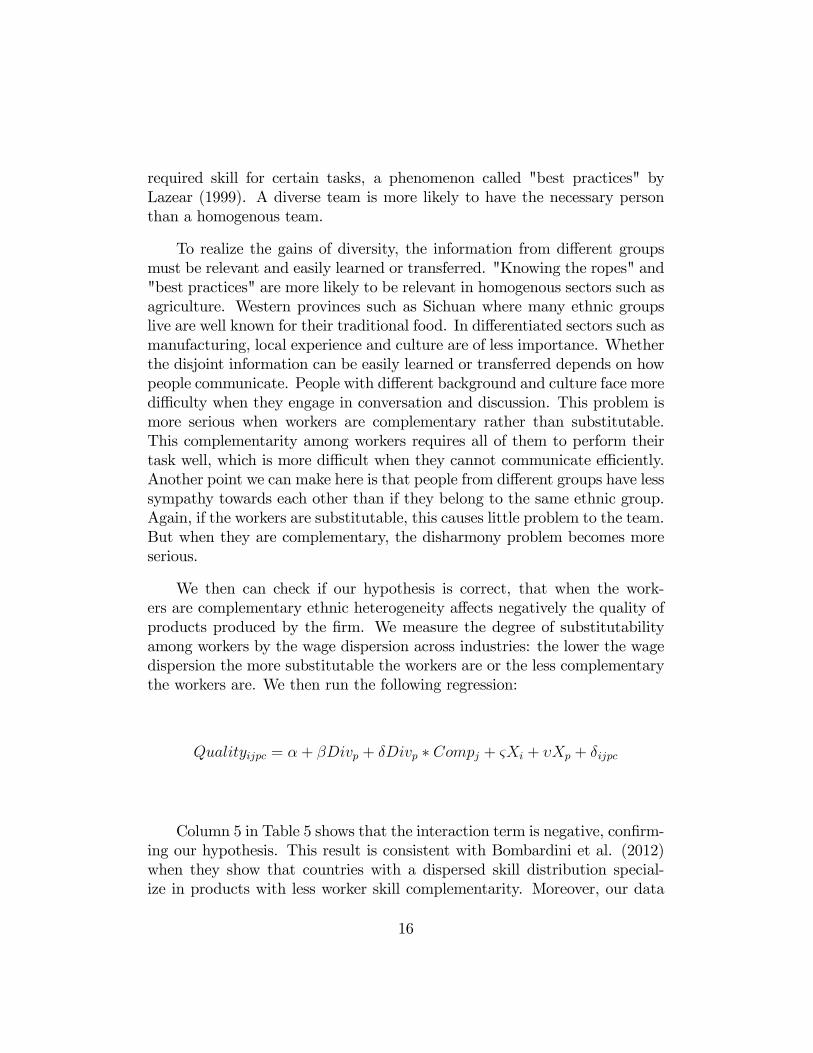
We then can check if our hypothesis is correct, that when the work-ers are complementary ethnic heterogeneity affects negatively the quality ofproducts produced by the firm. We measure the degree of substitutabilityamong workers by the wage dispersion across industries: the lower the wagedispersion the more substitutable the workers are or the less complementarythe workers are. We then run the following regression:
Qualityijpc = α + βDivp + δDivp ∗ Compj + ςXi + υXp + δijpc
Column 5 in Table 5 shows that the interaction term is negative, confirm-ing our hypothesis. This result is consistent with Bombardini et al. (2012)when they show that countries with a dispersed skill distribution special-ize in products with less worker skill complementarity. Moreover, our data
16
shows that wage dispersion is positively correlated with our two measuresof differentiation, namely quality dispersion and price dispersion. Indeedthe correlations are 0.07 and 0.09 respectively. These results then explainthe heterogeneous impact of ethnic diversity on quality as we find in theprevious section.
4 Conclusion
Ethnic diversity is claimed to have a significant impact on economic growth.In this study we investigate the impact of ethnic diversity on another di-mension, or the depth of economic growth: the quality of products. Weuse customs data and the manufacturing survey in China to estimate thequality of exported goods from China in 2000. Our finding is that productsfrom a completely homogeneous province are more than 30% higher qualitythan those from a completely heterogeneous province. While the impact ofethnic diversity is negative for differentiated sectors, it could be positive forhomogeneous sectors. This result allows us to propose a channel for whichdiversity influences quality. Indeed, workers in differentiated sectors are com-plementary, which means they need to work in tandem and communicationis very important. That explains why diverse provinces where people mighthave diffi culty in communication do not produce differentiated goods of highquality in our data. However, in homogeneous goods where experience andknowledge from ancestors can be relevant, diverse provinces can have an ad-vantage in producing high quality. Our paper contributes therefore to theunderstanding of the impact of diversity. It is exciting to follow this roadas others have shown that diversity can be a new source of comparativeadvantage
References
Alesina, A., and E. L. Ferrara (2005): “Ethnic Diversity and EconomicPerformance,”Journal of Economic Literature, XLIII, 762—800.
17
Bastos, P., and J. Silva (2010): “The quality of a firm’s exports: Whereyou export to matters,” Journal of International Economics, 82(2), 99—111.
Berry, S. T. (1994): “Estimating Discrete-Choice Models of Product Dif-ferentiation,”RAND Journal of Economics, 25(2), 242—62.
Bombardini, M., G. Gallipoli, and G. Pupato (2012): “Skill Disper-sion and Trade Flows,”American Economic Review, 102(5), 2327—48.
Broda, C., J. Greenfield, and D. Weinstein (2006): “From Ground-nuts to Globalization: A Structural Estimate of Trade and Growth,”NBER Working Paper No.12512.
Dai, M., M. Maitra, and M. Yu (2011): “Unexceptional Exporter Per-formance in China? The Role of Processing Trade,” Peking Universitymimeo.
Dincer, O., and F. Wang (2011): “Ethnic diversity and economic growthin China,”Journal of Policy Reform, 14(1), 1—10.
Easterly, W., and R. Levine (1997): “Africa’s Growth Tragedy: Policiesand Ethnic Divisions,”The Quarterly Journal of Economics, 112(4), 1203—50.
Grossman, G., E. Helpman, and P. Kircher (2013): “Matching andSorting in a Global Economy,”Princeton University mimeo.
Grossman, G., and G. Maggi (2000): “Diversity and Trade,”AmericanEconomic Review, 90(5), 1255—75.
Hallak, J. C. (2006): “Product Quality and the Direction of Trade,”Jour-nal of International Economics, 68(1), 238—65.
Hallak, J. C., and P. Schott (2011): “Estimating Cross-Country Dif-ferences in Product Quality,” Quarterly Journal of Economics, 126(1),417—74.
Hidalgo, C., B.Klinger, A. BarabÃAsi, and R. Hausmann (2007):“The Product Space Conditions the Development of Nations,” Science,317(5837), 482—87.
18
Hummels, D., and P. Klenow (2005): “The Variety and Quality of aNationâAZs Exports,”American Economics Review, 95(3), 704—23.
Johnson, R. (2012): “Trade and prices with heterogeneous firms,”Journalof International Economics, 86, 43—56.
Khandelwal, A. (2010): “The Long and Short (of) Quality Ladders,”Review of Economic Studies, 77(4), 1450—76.
Krishna, P., and W. F. Maloney (2011): “Export quality dynamics,”Policy Research Working Paper Series 5701, The World Bank.
Lazear, E. P. (1999): “Globalisation and the Market for Team-Mates,”The Economic Journal, 109(454), 15—40.
Manova, K., and Z. Zhang (2012): “Export Prices across Firms andDestinations,”Quarterly Journal of Economics, 127, 379—436.
Midler, P. (2009): Poorly Made in China. John Wiley and Sons, Inc.
Pula, G., and D. Santabarbara (2011): “Is China climbing up the qual-ity ladder? Estimating cross country differences in product quality usingEurostat’s Comext Trade Database,” European Central Bank Workingpaper series.
Reynal-Querol, M. (1998): “Religious Conflict and Growth,”mimeo.
Rodrik, D. (2006): “What’s So Special about China’s Exports?,”Chinaand World Economy, Institute of World Economics and Politics, ChineseAcademy of Social Sciences, 14(5), 1—19.
Schott, P. K. (2004): “Across-Product versus Within-Product Special-ization in International Trade,”Quarterly Journal of Economics, 119(2),647—78.
(2008): “The relative sophistication of Chinese exports,”EconomicPolicy, 23(53), 5—49.
19
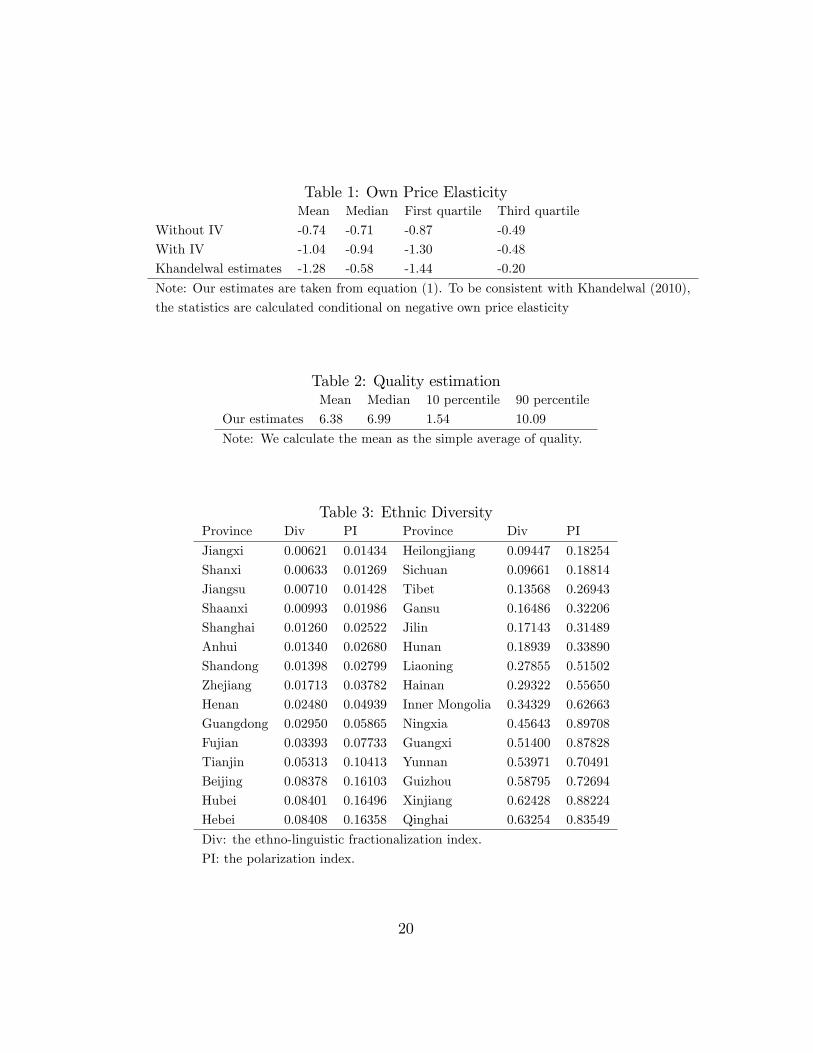
Table 1: Own Price ElasticityMean Median First quartile Third quartile
Without IV -0.74 -0.71 -0.87 -0.49
With IV -1.04 -0.94 -1.30 -0.48
Khandelwal estimates -1.28 -0.58 -1.44 -0.20
Note: Our estimates are taken from equation (1). To be consistent with Khandelwal (2010),
the statistics are calculated conditional on negative own price elasticity
Table 2: Quality estimationMean Median 10 percentile 90 percentile
Our estimates 6.38 6.99 1.54 10.09
Note: We calculate the mean as the simple average of quality.
Table 3: Ethnic DiversityProvince Div PI Province Div PI
Jiangxi 0.00621 0.01434 Heilongjiang 0.09447 0.18254
Shanxi 0.00633 0.01269 Sichuan 0.09661 0.18814
Jiangsu 0.00710 0.01428 Tibet 0.13568 0.26943
Shaanxi 0.00993 0.01986 Gansu 0.16486 0.32206
Shanghai 0.01260 0.02522 Jilin 0.17143 0.31489
Anhui 0.01340 0.02680 Hunan 0.18939 0.33890
Shandong 0.01398 0.02799 Liaoning 0.27855 0.51502
Zhejiang 0.01713 0.03782 Hainan 0.29322 0.55650
Henan 0.02480 0.04939 Inner Mongolia 0.34329 0.62663
Guangdong 0.02950 0.05865 Ningxia 0.45643 0.89708
Fujian 0.03393 0.07733 Guangxi 0.51400 0.87828
Tianjin 0.05313 0.10413 Yunnan 0.53971 0.70491
Beijing 0.08378 0.16103 Guizhou 0.58795 0.72694
Hubei 0.08401 0.16496 Xinjiang 0.62428 0.88224
Hebei 0.08408 0.16358 Qinghai 0.63254 0.83549
Div: the ethno-linguistic fractionalization index.
PI: the polarization index.
20
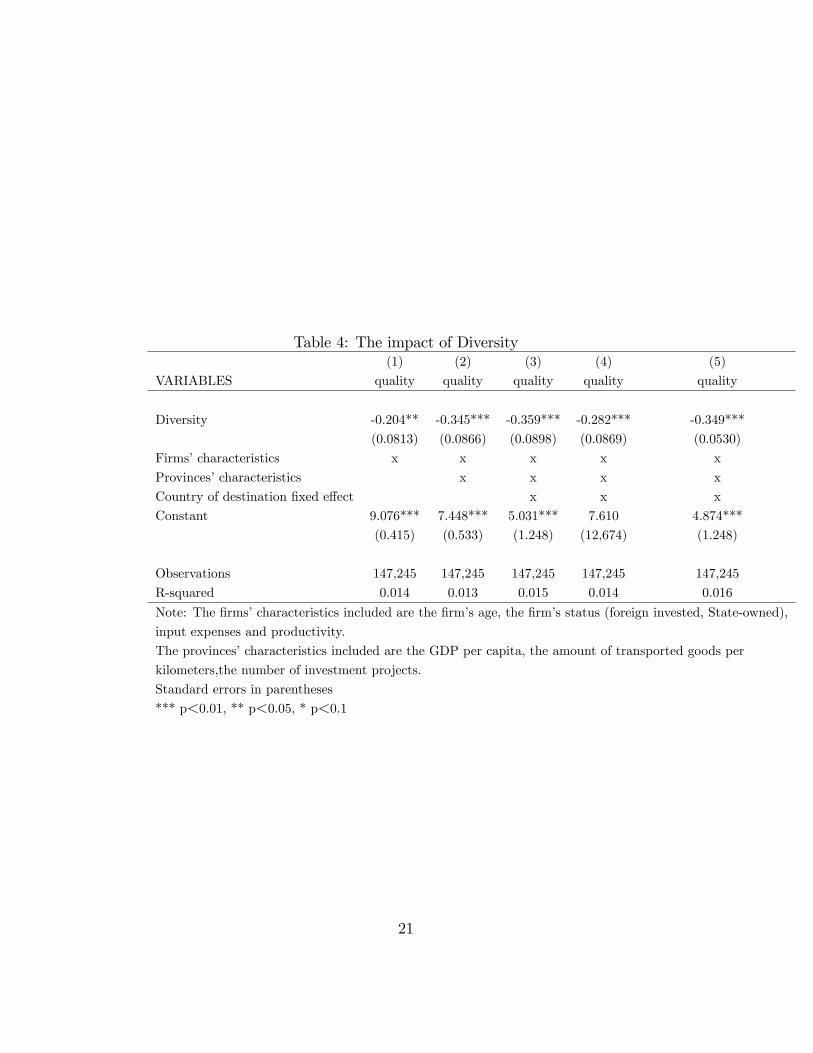
Table 4: The impact of Diversity(1) (2) (3) (4) (5)
VARIABLES quality quality quality quality quality
Diversity -0.204** -0.345*** -0.359*** -0.282*** -0.349***
(0.0813) (0.0866) (0.0898) (0.0869) (0.0530)
Firms’characteristics x x x x x
Provinces’characteristics x x x x
Country of destination fixed effect x x x
Constant 9.076*** 7.448*** 5.031*** 7.610 4.874***
(0.415) (0.533) (1.248) (12,674) (1.248)
Observations 147,245 147,245 147,245 147,245 147,245
R-squared 0.014 0.013 0.015 0.014 0.016
Note: The firms’characteristics included are the firm’s age, the firm’s status (foreign invested, State-owned),
input expenses and productivity.
The provinces’characteristics included are the GDP per capita, the amount of transported goods per
kilometers,the number of investment projects.
Standard errors in parentheses
*** p<0.01, ** p<0.05, * p<0.1
21
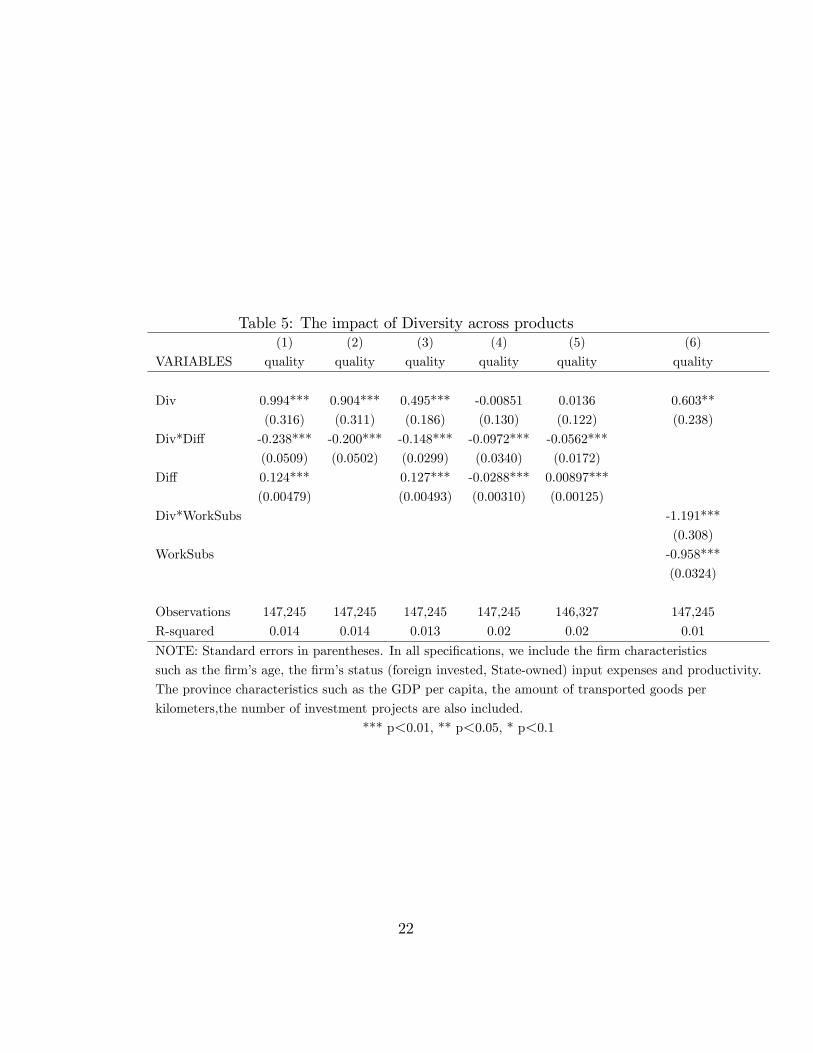
Table 5: The impact of Diversity across products(1) (2) (3) (4) (5) (6)
VARIABLES quality quality quality quality quality quality
Div 0.994*** 0.904*** 0.495*** -0.00851 0.0136 0.603**
(0.316) (0.311) (0.186) (0.130) (0.122) (0.238)
Div*Diff -0.238*** -0.200*** -0.148*** -0.0972*** -0.0562***
(0.0509) (0.0502) (0.0299) (0.0340) (0.0172)
Diff 0.124*** 0.127*** -0.0288*** 0.00897***
(0.00479) (0.00493) (0.00310) (0.00125)
Div*WorkSubs -1.191***
(0.308)
WorkSubs -0.958***
(0.0324)
Observations 147,245 147,245 147,245 147,245 146,327 147,245
R-squared 0.014 0.014 0.013 0.02 0.02 0.01
NOTE: Standard errors in parentheses. In all specifications, we include the firm characteristics
such as the firm’s age, the firm’s status (foreign invested, State-owned) input expenses and productivity.
The province characteristics such as the GDP per capita, the amount of transported goods per
kilometers,the number of investment projects are also included.
*** p<0.01, ** p<0.05, * p<0.1
22