Embed Size (px)
Citation preview
iiCLIMATE RISK COUNTRY PROFILE: ETHIOPIA
COPYRIGHT© 2021 by the World Bank Group1818 H Street NW, Washington, DC 20433Telephone: 202-473-1000; Internet: www.worldbank.org
This work is a product of the staff of the World Bank Group (WBG) and with external contributions. The opinions, findings, interpretations, and conclusions expressed in this work are those of the authors and do not necessarily reflect the views or the official policy or position of the WBG, its Board of Executive Directors, or the governments it represents.
The WBG does not guarantee the accuracy of the data included in this work and do not make any warranty, express or implied, nor assume any liability or responsibility for any consequence of their use. This publication follows the WBG’s practice in references to member designations, borders, and maps. The boundaries, colors, denominations, and other information shown on any map in this work, or the use of the term “country” do not imply any judgment on the part of the WBG, its Boards, or the governments it represents, concerning the legal status of any territory or geographic area or the endorsement or acceptance of such boundaries.
The mention of any specific companies or products of manufacturers does not imply that they are endorsed or recommended by the WBG in preference to others of a similar nature that are not mentioned.
RIGHTS AND PERMISSIONS The material in this work is subject to copyright. Because the WBG encourages dissemination of its knowledge, this work may be reproduced, in whole or in part, for noncommercial purposes as long as full attribution to this work is given.
Please cite the work as follows: Climate Risk Profile: Ethiopia (2021): The World Bank Group.
Any queries on rights and licenses, including subsidiary rights, should be addressed to World Bank Publications, The World Bank Group, 1818 H Street NW, Washington, DC 20433, USA; fax: 202-522-2625; e-mail: [email protected].
Cover Photos: © Arne Hoel/World Bank, “An Overview of Addis” January 24, 2004 via Flickr, Creative Commons CC BY-NC-ND 2.0. © Steve Harris/World Bank, “Sire District, Ethiopia” September 15, 2014 via Flickr, Creative Commons CC BY-NC-ND 2.0.
Graphic Design: Circle Graphics, Reisterstown, MD.
iiiCLIMATE RISK COUNTRY PROFILE: ETHIOPIA
ACKNOWLEDGEMENTSThis profile is part of a series of Climate Risk Country Profiles developed by the World Bank Group (WBG). The country profile synthesizes most relevant data and information on climate change, disaster risk reduction, and adaptation actions and policies at the country level. The country profile series are designed as a quick reference source for development practitioners to better integrate climate resilience in development planning and policy making. This effort is managed and led by Veronique Morin (Senior Climate Change Specialist, WBG) and Ana E. Bucher (Senior Climate Change Specialist, WBG).
This profile was written by MacKenzie Dove (Senior Climate Change Consultant, WBG). Additional support was provided by Yunziyi Lang (Climate Change Analyst, WBG), Viviane Clement (Climate Change Specialist, WBG), Tambi Matambo (Senior Climate Change Specialist), Michelle Winglee (Consultant, WBG), and Jason Johnston (Operations Analyst, WBG).
Climate and climate-related information is largely drawn from the Climate Change Knowledge Portal (CCKP), a WBG online platform with available global climate data and analysis based on the latest Intergovernmental Panel on Climate Change (IPCC) reports and datasets. The team is grateful for all comments and suggestions received from the sector, regional, and country development specialists, as well as climate research scientists and institutions for their advice and guidance on use of climate related datasets.
ivCLIMATE RISK COUNTRY PROFILE: ETHIOPIA
CONTENTS
FOREWORD . . . . . . . . . . . . . . . . . . . . . . . . . . . . . . . . . . . . 1
COUNTRY OVERVIEW . . . . . . . . . . . . . . . . . . . . . . . . . . . . . . . 2
CLIMATOLOGY . . . . . . . . . . . . . . . . . . . . . . . . . . . . . . . . . . 4Climate Baseline 4
Overview 4Key Trends 6
Climate Future 6Overview 6Key Trends 7
CLIMATE RELATED NATURAL HAZARDS . . . . . . . . . . . . . . . . . . . . . . 9Overview 9Forest Fire 11Climate Change Impacts 11Implications for DRM 13
CLIMATE CHANGE IMPACTS TO KEY SECTORS . . . . . . . . . . . . . . . . . . 13Gender 13Agriculture 14Water 16Energy 18Health 19Transport 21
ADAPTATION . . . . . . . . . . . . . . . . . . . . . . . . . . . . . . . . . . 23Institutional Framework for Adaptation 23Policy Framework for Adaptation 23Recommendations 24
Research Gaps 24Data and Information Gaps 24Institutional Gaps 24
1CLIMATE RISK COUNTRY PROFILE: ETHIOPIA
Climate change is a major risk to good development outcomes, and the World Bank Group is committed to playing
an important role in helping countries integrate climate action into their core development agendas. The World
Bank Group is committed to supporting client countries to invest in and build a low-carbon, climate-resilient future,
helping them to be better prepared to adapt to current and future climate impacts.
The World Bank Group is investing in incorporating and systematically managing climate risks in development
operations through its individual corporate commitments.
A key aspect of the World Bank Group’s Action Plan on Adaptation and Resilience (2019) is to help countries
shift from addressing adaptation as an incremental cost and isolated investment to systematically incorporating
climate risks and opportunities at every phase of policy planning, investment design, implementation and evaluation
of development outcomes. For all IDA and IBRD operations, climate and disaster risk screening is one of the
mandatory corporate climate commitments. This is supported by the Bank Group’s Climate and Disaster Risk
Screening Tool which enables all Bank staff to assess short- and long-term climate and disaster risks in operations
and national or sectoral planning processes. This screening tool draws up-to-date and relevant information from
the World Bank’s Climate Change Knowledge Portal, a comprehensive online ‘one-stop shop’ for global, regional,
and country data related to climate change and development.
Recognizing the value of consistent, easy-to-use technical resources for client countries as well as to support
respective internal climate risk assessment and adaptation planning processes, the World Bank Group’s Climate
Change Group has developed this content. Standardizing and pooling expertise facilitates the World Bank Group in
conducting initial assessments of climate risks and opportunities across sectors within a country, within institutional
portfolios across regions, and acts as a global resource for development practitioners.
For developing countries, the climate risk profiles are intended to serve as public goods to facilitate upstream
country diagnostics, policy dialogue, and strategic planning by providing comprehensive overviews of trends
and projected changes in key climate parameters, sector-specific implications, relevant policies and programs,
adaptation priorities and opportunities for further actions.
It is my hope that these efforts will spur deepening of long-term risk management in developing countries and our
engagement in supporting climate change adaptation planning at operational levels.
Bernice Van Bronkhorst Global Director
Climate Change Group (CCG)
The World Bank Group (WBG)
FOREWORD
2CLIMATE RISK COUNTRY PROFILE: ETHIOPIA
COUNTRY OVERVIEW
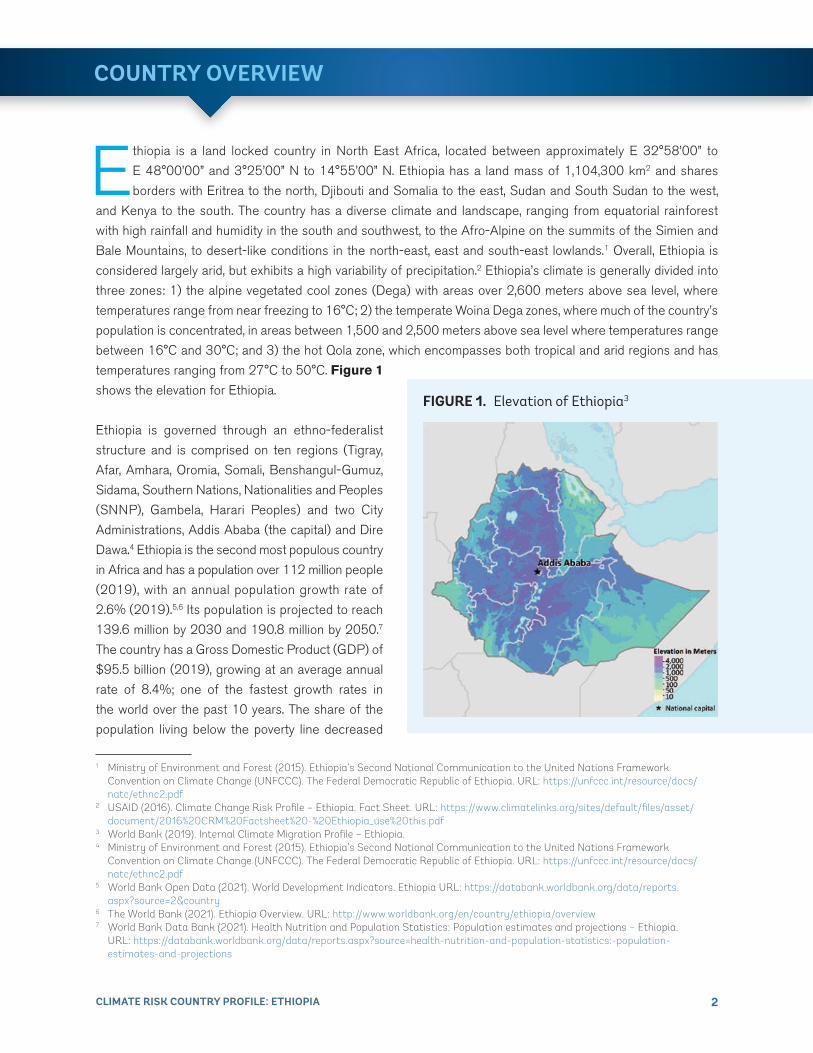
Ethiopia is a land locked country in North East Africa, located between approximately E 32°58’00” to
E 48°00’00” and 3°25’00” N to 14°55’00” N. Ethiopia has a land mass of 1,104,300 km2 and shares
borders with Eritrea to the north, Djibouti and Somalia to the east, Sudan and South Sudan to the west,
and Kenya to the south. The country has a diverse climate and landscape, ranging from equatorial rainforest
with high rainfall and humidity in the south and southwest, to the Afro-Alpine on the summits of the Simien and
Bale Mountains, to desert-like conditions in the north-east, east and south-east lowlands.1 Overall, Ethiopia is
considered largely arid, but exhibits a high variability of precipitation.2 Ethiopia’s climate is generally divided into
three zones: 1) the alpine vegetated cool zones (Dega) with areas over 2,600 meters above sea level, where
temperatures range from near freezing to 16°C; 2) the temperate Woina Dega zones, where much of the country’s
population is concentrated, in areas between 1,500 and 2,500 meters above sea level where temperatures range
between 16°C and 30°C; and 3) the hot Qola zone, which encompasses both tropical and arid regions and has
temperatures ranging from 27°C to 50°C. Figure 1
shows the elevation for Ethiopia.
Ethiopia is governed through an ethno-federalist
structure and is comprised on ten regions (Tigray,
Afar, Amhara, Oromia, Somali, Benshangul-Gumuz,
Sidama, Southern Nations, Nationalities and Peoples
(SNNP), Gambela, Harari Peoples) and two City
Administrations, Addis Ababa (the capital) and Dire
Dawa.4 Ethiopia is the second most populous country
in Africa and has a population over 112 million people
(2019), with an annual population growth rate of
2.6% (2019).5,6 Its population is projected to reach
139.6 million by 2030 and 190.8 million by 2050.7
The country has a Gross Domestic Product (GDP) of
$95.5 billion (2019), growing at an average annual
rate of 8.4%; one of the fastest growth rates in
the world over the past 10 years. The share of the
population living below the poverty line decreased
FIGURE 1 . Elevation of Ethiopia3
1 Ministry of Environment and Forest (2015). Ethiopia’s Second National Communication to the United Nations Framework Convention on Climate Change (UNFCCC). The Federal Democratic Republic of Ethiopia. URL: https://unfccc.int/resource/docs/natc/ethnc2.pdf
2 USAID (2016). Climate Change Risk Profile – Ethiopia. Fact Sheet. URL: https://www.climatelinks.org/sites/default/files/asset/document/2016%20CRM%20Factsheet%20-%20Ethiopia_use%20this.pdf
3 World Bank (2019). Internal Climate Migration Profile – Ethiopia. 4 Ministry of Environment and Forest (2015). Ethiopia’s Second National Communication to the United Nations Framework
Convention on Climate Change (UNFCCC). The Federal Democratic Republic of Ethiopia. URL: https://unfccc.int/resource/docs/natc/ethnc2.pdf
5 World Bank Open Data (2021). World Development Indicators. Ethiopia URL: https://databank.worldbank.org/data/reports.aspx?source=2&country
6 The World Bank (2021). Ethiopia Overview. URL: http://www.worldbank.org/en/country/ethiopia/overview7 World Bank Data Bank (2021). Health Nutrition and Population Statistics: Population estimates and projections – Ethiopia.
URL: https://databank.worldbank.org/data/reports.aspx?source=health-nutrition-and-population-statistics:-population-estimates-and-projections
3CLIMATE RISK COUNTRY PROFILE: ETHIOPIA
from 30% (2011) to 24% (2016). Ethiopia completed its second phase of its Growth and Transformation Plan
(GTP II) (2016–2020).8
Ethiopia is one of the most vulnerable countries to climate variability and climate change due to its high dependence
on rain-fed agriculture and natural resources, and relatively low adaptive capacity to deal with these expected
changes. Challenges include the under-development of water resources, low health service coverage, a high
population growth rate, low economic development, inadequate road infrastructure in drought prone areas, weak
institutional structures, and lack of awareness.9 Ethiopia has frequently experienced extreme events like droughts
and floods, in addition to rainfall variability and increasing temperature which contribute to adverse impacts to
livelihoods. Primary environmental problems are soil erosion, deforestation, recurrent droughts, desertification,
land degradation, and loss of biodiversity and wildlife.10
Ethiopia submitted its Nationally-Determined Contribution to the UNFCCC in 2016, in support of the country’s
efforts to realize its development goals as laid out in its Growth and Transformation Plan II (GTP II) and its
Climate Resilient Green Economy (CRGE) Strategy in order to operationalize green growth planning into the
country’s development and economic planning strategies.11 Ethiopia remains committed to protecting its economy,
reducing its vulnerability to climate change, and protecting the livelihoods of its population, which remains highly
dependent upon natural resources. Climate change adaptation and resilience priorities are focused on increased
adaptation for key sectors including Agriculture (livestock and soil), Forestry, Transport, Electric Power, Industry
(including mining) and Buildings (including Waste and Green Cities).12 Through the GTP II, Ethiopia aims to
continue expanding physical infrastructure through public investments and transformation of the country into a
manufacturing hub.13
Green, Inclusive and Resilient RecoveryThe coronavirus disease (COVID-19) pandemic has led to unprecedented adverse social and economic impacts.
Further, the pandemic has demonstrated the compounding impacts of adding yet another shock on top of
the multiple challenges that vulnerable populations already face in day-to-day life, with the potential to create
devastating health, social, economic and environmental crises that can leave a deep, long-lasting mark. However,
as governments take urgent action and lay the foundations for their financial, economic, and social recovery, they
have a unique opportunity to create economies that are more sustainable, inclusive and resilient. Short and long-
term recovery efforts should prioritize investments that boost jobs and economic activity; have positive impacts on
human, social and natural capital; protect biodiversity and ecosystems services; boost resilience; and advance the
decarbonization of economies.
8 National Planning Commission (2016). Growth and Transformation Plan II, (2015/16-2019/20). URL: https://europa.eu/capacity4dev/resilience_ethiopia/document/growth-and-transformation-plan-ii-gtp-ii-201516-201920
9 UNDP (2011). Ethiopia’s Climate Resilient Green Economy. URL: https://www.undp.org/content/dam/ethiopia/docs/Ethiopia%20CRGE.pdf10 Ministry of Environment and Forest (2015). Ethiopia’s Second National Communication to the United Nations Framework Convention
on Climate Change (UNFCCC). The Federal Democratic Republic of Ethiopia. URL: https://unfccc.int/resource/docs/natc/ethnc2.pdf11 Federal Democratic Republic of Ethiopia (2011). Ethiopia’s Climate-Resilient Green Economy, Green Economy Strategy. URL:
https://www.undp.org/content/dam/ethiopia/docs/Ethiopia%20CRGE.pdf12 Federal Democratic Republic of Ethiopia (2020). Updated Nationally Determined Contributions of the Federal Democratic Republic
of Ethiopia. URL: https://www4.unfccc.int/sites/ndcstaging/PublishedDocuments/Ethiopia%20First/Ethiopia%27s%20NDC%20update%20summary%202020.pdf
13 The World Bank (2021). Ethiopia Overview. URL: http://www.worldbank.org/en/country/ethiopia/overview
4CLIMATE RISK COUNTRY PROFILE: ETHIOPIA
14 Adaptation Partnership (2012). Review of Current and Planned Adaptation Action: East Africa. URL: https://www.preventionweb.net/files/25695_ethiopia.pdf
15 Ministry of Environment and Forest (2015). Ethiopia’s Second National Communication to the United Nations Framework Convention on Climate Change (UNFCCC). The Federal Democratic Republic of Ethiopia. URL: https://unfccc.int/resource/docs/natc/ethnc2.pdf
16 Ministry of Environment and Forest (2015). Ethiopia’s Second National Communication to the United Nations Framework Convention on Climate Change (UNFCCC). The Federal Democratic Republic of Ethiopia. URL: https://unfccc.int/resource/docs/natc/ethnc2.pdf
17 WBG Climate Change Knowledge Portal (CCKP, 2021). Ethiopia. URL: https://climateknowledgeportal.worldbank.org/country/ethiopia/climate-data-historical
TABLE 1 . Data snapshot: Summary statistics
Climate Variables 1901–2020
Mean Annual Temperature (°C) 22.6°C
Mean Annual Precipitation (mm) 815.8 mm
Mean Maximum Annual Temperature (°C) 29.5°C
Mean Minimum Annual Temperature (°C) 15.8°C
CLIMATOLOGY
Climate Baseline
OverviewEthiopia’s large land area and diverse topography results in different climates across the country as well as
temperature and precipitation disparity across its regions. Ethiopia’s equatorial rainforests in the south and south-
west are characterized by high rainfall and humidity, while the Afro-Alpine on the summits of the Semien and Bale
mountains, and the north-east, east and south-east lowlands experiencing desert-like conditions. The highland
regions in the center and north of the country experience cooler climates. The eastern corner of the country is
very arid and experiences very little rainfall. Seasonal rainfall in Ethiopia is driven mainly by the migration of the
Inter-Tropical Convergence Zone (ITCZ) and there is strong inter-annual variability of rainfall across the country.14
Ethiopia has three rainfall seasons: Bega, Belg, and Kiremt. The primary rainy season, Kiremt, occurs from mid-June
to mid-September and accounts for 50–80% of annual rainfall. Parts of central and northern Ethiopia experience a
sporadic, secondary wet-season, Belg, which often has considerably less rainfall and occurs from February to May.
Southern regions of Ethiopia experience two distinct wet seasons, Belg, from February to May, and Bega occurring
from October to December, which has drier and colder conditions.15 Mean annual rainfall distribution is approximately
2,000 mm over the south-western highlands and less than 300 mm over the south-eastern and north-eastern
lowlands. Temperatures across Ethiopia can range from –15°C over the highlands, to above 25°C in the lowlands.16
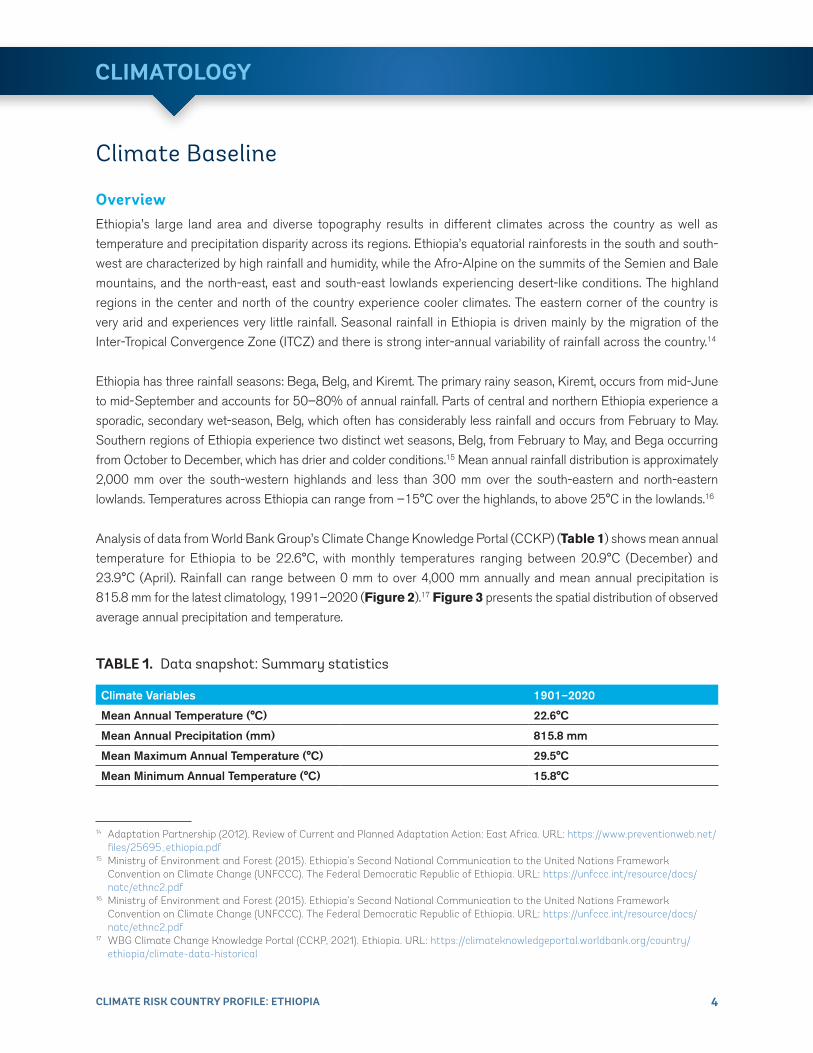
Analysis of data from World Bank Group’s Climate Change Knowledge Portal (CCKP) (Table 1) shows mean annual
temperature for Ethiopia to be 22.6°C, with monthly temperatures ranging between 20.9°C (December) and
23.9°C (April). Rainfall can range between 0 mm to over 4,000 mm annually and mean annual precipitation is
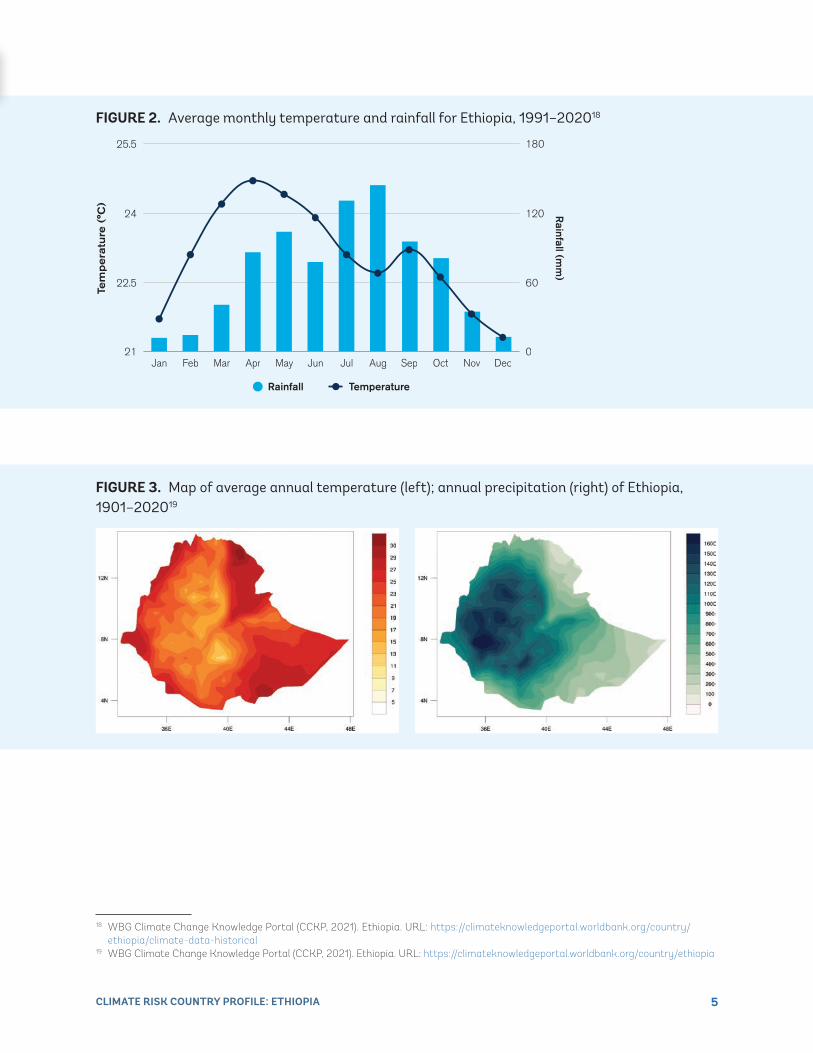
815.8 mm for the latest climatology, 1991–2020 (Figure 2).17 Figure 3 presents the spatial distribution of observed
average annual precipitation and temperature.
5CLIMATE RISK COUNTRY PROFILE: ETHIOPIA
18 WBG Climate Change Knowledge Portal (CCKP, 2021). Ethiopia. URL: https://climateknowledgeportal.worldbank.org/country/ethiopia/climate-data-historical
19 WBG Climate Change Knowledge Portal (CCKP, 2021). Ethiopia. URL: https://climateknowledgeportal.worldbank.org/country/ethiopia
FIGURE 2 . Average monthly temperature and rainfall for Ethiopia, 1991–202018
TemperatureRainfall
Tem
pe
ratu
re (
°C)
Rainfall (m
m)
Jan Feb Mar Apr May Jun Jul Aug Sep Oct Nov Dec21
24
22.5
25.5
0
120
60
180
FIGURE 3 . Map of average annual temperature (left); annual precipitation (right) of Ethiopia, 1901–202019
6CLIMATE RISK COUNTRY PROFILE: ETHIOPIA
Key TrendsTemperatureAverage temperatures in Ethiopia have increased by an average of 1°C since1960, at an average rate of
0.25°C per decade. Increases have been most noticeable from July through September. The average number of
‘hot nights’ (the hottest 10% of nights annually) increased by 37.5% between 1960 and 2003 and the average
number of ‘hot days’ per year, increased by 20%; cold days have also decreased.20 Observed temperature increases
have also lead to increased evapotranspiration and reduced soil moisture; higher rates of warming have been
observed in the central regions and highland areas.21
PrecipitationStrong variability makes long-term precipitation trends for Ethiopia difficult to determine, however an overall decline has
been observed in the last three to four decades, with significant year-to-year volatility. While precipitation trends across
Ethiopia are highly variable, some areas of the country are expected to experience a reduction in rainfall. For example,
the south-central region of the country has experienced a 20% decrease in rainfall since 1960.22 While high degrees
of inter-annual variability exist for precipitation trends across Ethiopia, the incidence of drought increased and the rains
in central and northern areas occurring in February to May have become increasingly less predictable.23 The rise of sea
surface temperatures in the Indian Ocean influences the migration of the ITCZ which can further increase variability
in the timing and duration of rainfall seasons, altering traditional rainfall patterns and causing more frequent drought.24
Climate Future
OverviewThe main data source for World Bank Group’s Climate Change Knowledge Portal (CCKP) is the CMIP5 (Coupled
Inter-comparison Project No.5) data ensemble, which builds the database for the global climate change projections
presented in the Fifth Assessment Report (AR5) of the Intergovernmental Panel on Climate Change (IPCC). Four
Representative Concentration Pathways (i.e. RCP2.6, RCP4.5, RCP6.0, and RCP8.5) were selected and defined
by their total radiative forcing (cumulative measure of GHG emissions from all sources) pathway and level by 2100.
The RCP2.6 for example represents a very strong mitigation scenario, whereas the RCP8.5 assumes business-
as-usual scenario. For more information, please refer to the RCP Database. For simplification, these scenarios are
referred to as a low (RCP2.6); a medium (RCP4.5) and a high (RCP8.5) emission scenario in this profile. Table 2
provides CMIP5 projections for essential climate variables under high emission scenario (RCP8.5) over 4 different
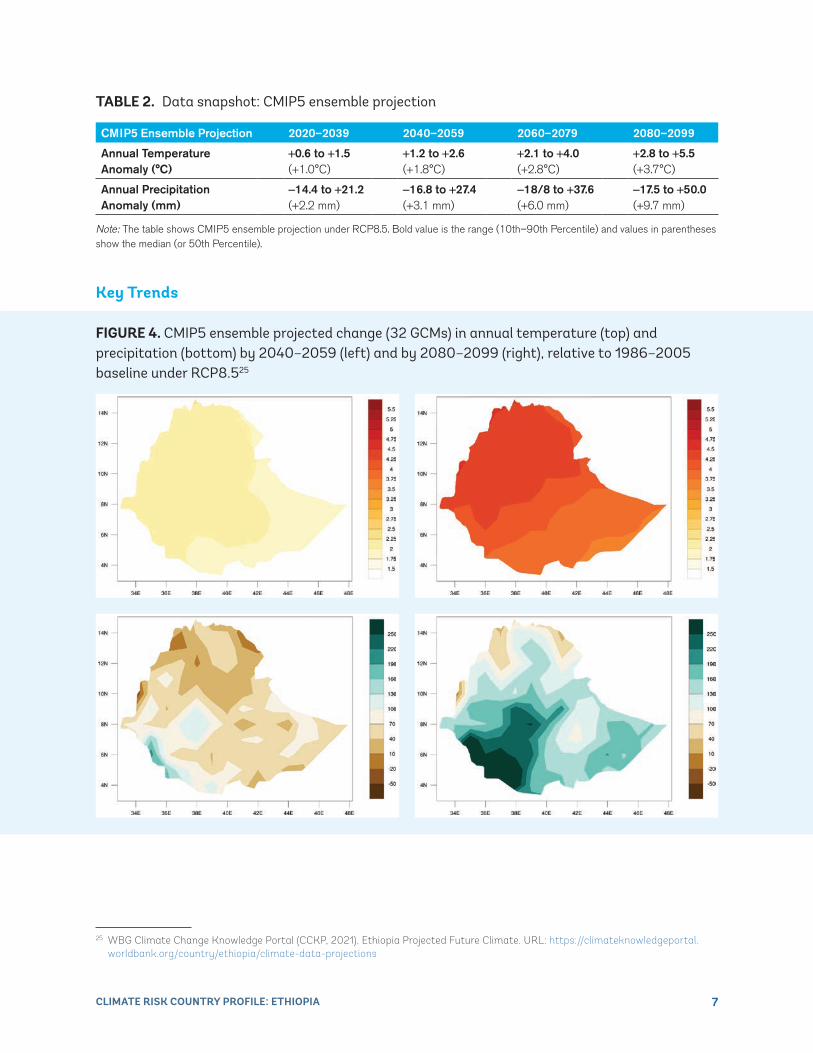
time horizons. Figure 4 presents the multi-model (CMIP5) ensemble of 32 Global Circulation Models (GCMs)
showing the projected changes in annual precipitation and temperature for the periods 2040–2059 and 2080–2099.
20 McSweeney, C., New, M., and Lizcano, G. (2009). UNDP Climate Change Country Profiles – Ethiopia. URL: https://digital.library.unt.edu/ark:/67531/metadc226682/m2/1/high_res_d/Ethiopia.hires.report.pdf
21 Ministry of Environment and Forest (2015). Ethiopia’s Second National Communication to the United Nations Framework Convention on Climate Change (UNFCCC). The Federal Democratic Republic of Ethiopia. URL: https://unfccc.int/resource/docs/natc/ethnc2.pdf
22 USAID (2016). Climate Change Risk Profile – Ethiopia. Fact Sheet. URL: https://www.climatelinks.org/sites/default/files/asset/document/2016%20CRM%20Factsheet%20-%20Ethiopia_use%20this.pdf
23 Ministry of Environment and Forest (2015). Ethiopia’s Second National Communication to the United Nations Framework Convention on Climate Change (UNFCCC). The Federal Democratic Republic of Ethiopia. URL: https://unfccc.int/resource/docs/natc/ethnc2.pdf
24 USAID (2012). Climate Change Adaptation in Ethiopia. URL: https://www.climatelinks.org/sites/default/files/asset/document/ethiopia_adaptation_fact_sheet_jan2012.pdf
7CLIMATE RISK COUNTRY PROFILE: ETHIOPIA
TABLE 2 . Data snapshot: CMIP5 ensemble projection
CMIP5 Ensemble Projection 2020–2039 2040–2059 2060–2079 2080–2099
Annual Temperature Anomaly (°C)
+0.6 to +1.5(+1.0°C)
+1.2 to +2.6(+1.8°C)
+2.1 to +4.0(+2.8°C)
+2.8 to +5.5(+3.7°C)
Annual Precipitation Anomaly (mm)
-14.4 to +21.2(+2.2 mm)
-16.8 to +27.4(+3.1 mm)
-18/8 to +37.6(+6.0 mm)
-17.5 to +50.0(+9.7 mm)
Note: The table shows CMIP5 ensemble projection under RCP8.5. Bold value is the range (10th–90th Percentile) and values in parentheses show the median (or 50th Percentile).
Key Trends
25 WBG Climate Change Knowledge Portal (CCKP, 2021). Ethiopia Projected Future Climate. URL: https://climateknowledgeportal.worldbank.org/country/ethiopia/climate-data-projections
FIGURE 4 . CMIP5 ensemble projected change (32 GCMs) in annual temperature (top) and precipitation (bottom) by 2040–2059 (left) and by 2080–2099 (right), relative to 1986–2005 baseline under RCP8 525
8CLIMATE RISK COUNTRY PROFILE: ETHIOPIA
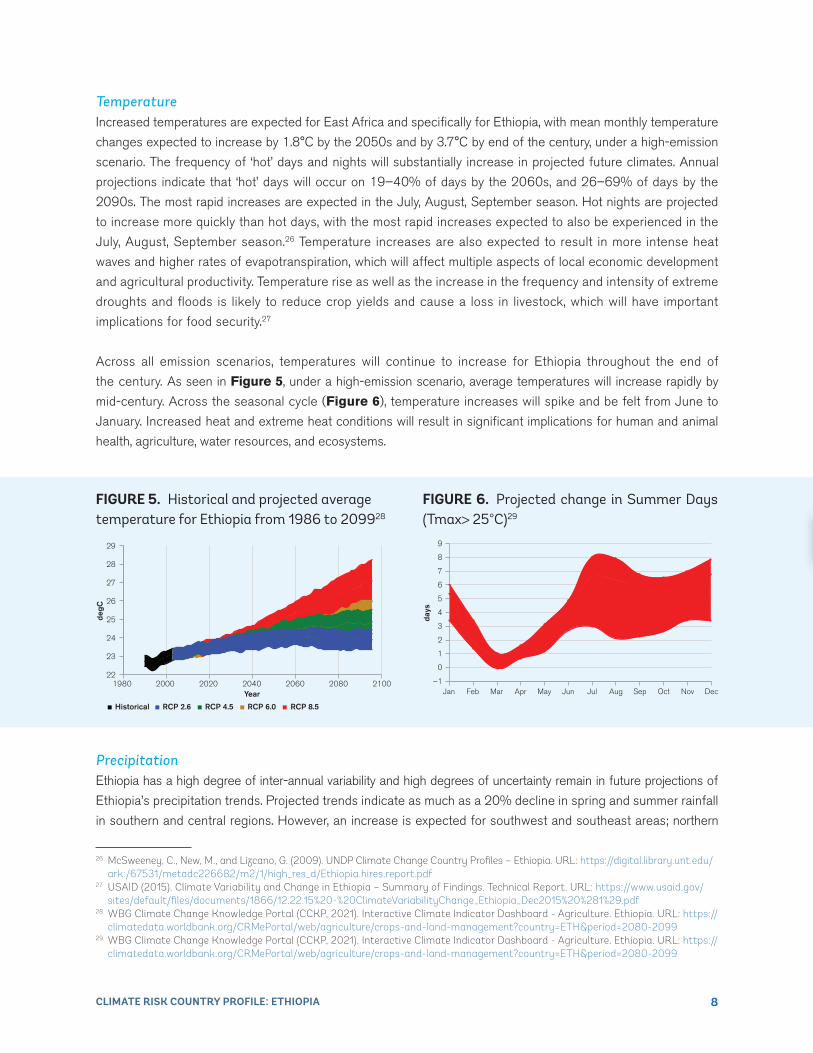
TemperatureIncreased temperatures are expected for East Africa and specifically for Ethiopia, with mean monthly temperature
changes expected to increase by 1.8°C by the 2050s and by 3.7°C by end of the century, under a high-emission
scenario. The frequency of ‘hot’ days and nights will substantially increase in projected future climates. Annual
projections indicate that ‘hot’ days will occur on 19–40% of days by the 2060s, and 26–69% of days by the
2090s. The most rapid increases are expected in the July, August, September season. Hot nights are projected
to increase more quickly than hot days, with the most rapid increases expected to also be experienced in the
July, August, September season.26 Temperature increases are also expected to result in more intense heat
waves and higher rates of evapotranspiration, which will affect multiple aspects of local economic development
and agricultural productivity. Temperature rise as well as the increase in the frequency and intensity of extreme
droughts and floods is likely to reduce crop yields and cause a loss in livestock, which will have important
implications for food security.27
Across all emission scenarios, temperatures will continue to increase for Ethiopia throughout the end of
the century. As seen in Figure 5, under a high-emission scenario, average temperatures will increase rapidly by
mid-century. Across the seasonal cycle (Figure 6), temperature increases will spike and be felt from June to
January. Increased heat and extreme heat conditions will result in significant implications for human and animal
health, agriculture, water resources, and ecosystems.
26 McSweeney, C., New, M., and Lizcano, G. (2009). UNDP Climate Change Country Profiles – Ethiopia. URL: https://digital.library.unt.edu/ark:/67531/metadc226682/m2/1/high_res_d/Ethiopia.hires.report.pdf
27 USAID (2015). Climate Variability and Change in Ethiopia – Summary of Findings. Technical Report. URL: https://www.usaid.gov/sites/default/files/documents/1866/12.22.15%20-%20ClimateVariabilityChange_Ethiopia_Dec2015%20%281%29.pdf
28 WBG Climate Change Knowledge Portal (CCKP, 2021). Interactive Climate Indicator Dashboard - Agriculture. Ethiopia. URL: https://climatedata.worldbank.org/CRMePortal/web/agriculture/crops-and-land-management?country=ETH&period=2080-2099
29 WBG Climate Change Knowledge Portal (CCKP, 2021). Interactive Climate Indicator Dashboard - Agriculture. Ethiopia. URL: https://climatedata.worldbank.org/CRMePortal/web/agriculture/crops-and-land-management?country=ETH&period=2080-2099
FIGURE 5 . Historical and projected average temperature for Ethiopia from 1986 to 209928
22
23
24
25
26
27
28
29
degC
Year2000 2020 2040 2060 2080 21001980
RCP 8.5Historical RCP 2.6 RCP 4.5 RCP 6.0
FIGURE 6 . Projected change in Summer Days (Tmax> 25°C)29
–1
0
1
2
3
4
5
7
8
9
6
days
Jan Feb Mar Apr May Jun Jul Aug Sep Oct Nov Dec
PrecipitationEthiopia has a high degree of inter-annual variability and high degrees of uncertainty remain in future projections of
Ethiopia’s precipitation trends. Projected trends indicate as much as a 20% decline in spring and summer rainfall
in southern and central regions. However, an increase is expected for southwest and southeast areas; northern
9CLIMATE RISK COUNTRY PROFILE: ETHIOPIA
areas are near uniformly expected to experience a general decrease in rainfall.30 Projected warming trends for the
entire country is expected to exacerbate observed declines in rainfall, leading to increased water stress.31 Water
resources are also likely to be increasingly strained as precipitation is expected to increase in some parts of East
Africa, warmer temperatures will accelerate the rate
of evapotranspiration, thus reducing the benefits
of increased rainfall.32 With more frequent and
severe droughts, the region is likely to experience
negative impacts on water supply, biodiversity, and
hydropower generation. A potential simultaneous
increase in floods poses a serious water pollution
threat, affecting health of wetland and forest
ecosystems, which provide critical ecosystem services
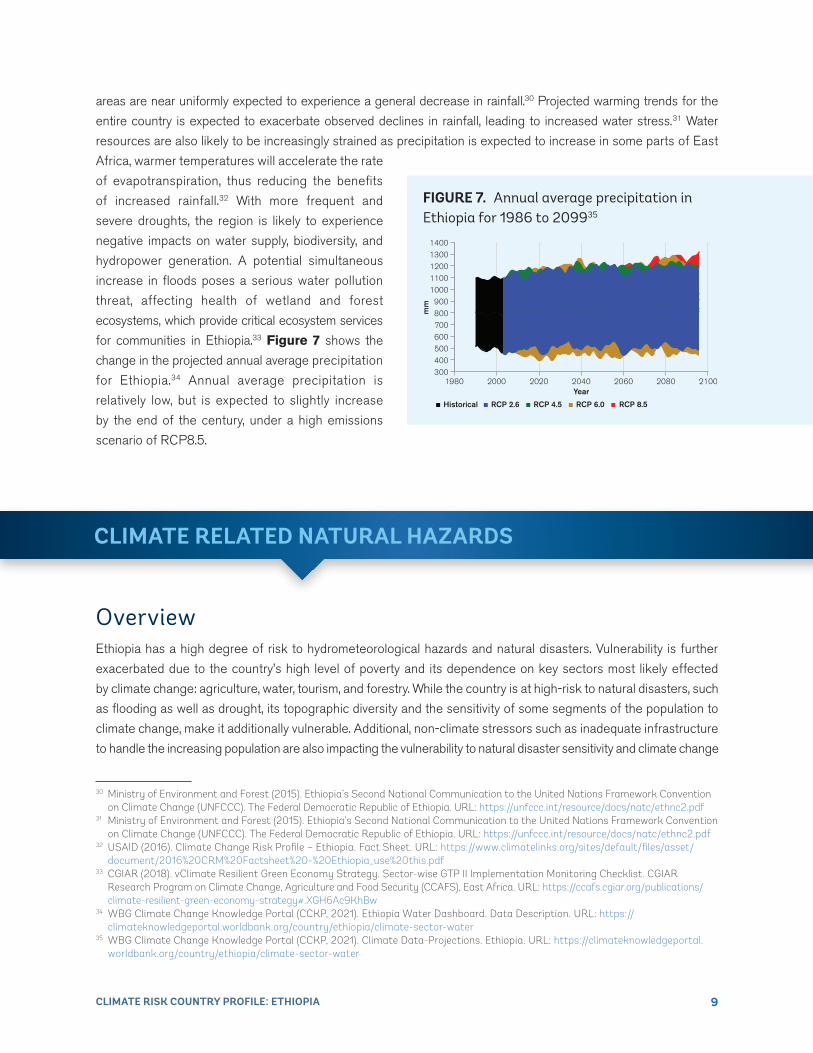
for communities in Ethiopia.33 Figure 7 shows the
change in the projected annual average precipitation
for Ethiopia.34 Annual average precipitation is
relatively low, but is expected to slightly increase
by the end of the century, under a high emissions
scenario of RCP8.5.
30 Ministry of Environment and Forest (2015). Ethiopia’s Second National Communication to the United Nations Framework Convention on Climate Change (UNFCCC). The Federal Democratic Republic of Ethiopia. URL: https://unfccc.int/resource/docs/natc/ethnc2.pdf
31 Ministry of Environment and Forest (2015). Ethiopia’s Second National Communication to the United Nations Framework Convention on Climate Change (UNFCCC). The Federal Democratic Republic of Ethiopia. URL: https://unfccc.int/resource/docs/natc/ethnc2.pdf
32 USAID (2016). Climate Change Risk Profile – Ethiopia. Fact Sheet. URL: https://www.climatelinks.org/sites/default/files/asset/document/2016%20CRM%20Factsheet%20-%20Ethiopia_use%20this.pdf
33 CGIAR (2018). vClimate Resilient Green Economy Strategy. Sector-wise GTP II Implementation Monitoring Checklist. CGIAR Research Program on Climate Change, Agriculture and Food Security (CCAFS), East Africa. URL: https://ccafs.cgiar.org/publications/climate-resilient-green-economy-strategy#.XGH6Ac9KhBw
34 WBG Climate Change Knowledge Portal (CCKP, 2021). Ethiopia Water Dashboard. Data Description. URL: https://climateknowledgeportal.worldbank.org/country/ethiopia/climate-sector-water
35 WBG Climate Change Knowledge Portal (CCKP, 2021). Climate Data-Projections. Ethiopia. URL: https://climateknowledgeportal.worldbank.org/country/ethiopia/climate-sector-water
FIGURE 7 . Annual average precipitation in Ethiopia for 1986 to 209935
300
400
500
600
700
800
900
1000
1100
1200
1300
1400
mm
Year
RCP 8.5
2000 2020 2040 2060 2080 21001980
Historical RCP 2.6 RCP 4.5 RCP 6.0
CLIMATE RELATED NATURAL HAZARDS
OverviewEthiopia has a high degree of risk to hydrometeorological hazards and natural disasters. Vulnerability is further
exacerbated due to the country’s high level of poverty and its dependence on key sectors most likely effected
by climate change: agriculture, water, tourism, and forestry. While the country is at high-risk to natural disasters, such
as flooding as well as drought, its topographic diversity and the sensitivity of some segments of the population to
climate change, make it additionally vulnerable. Additional, non-climate stressors such as inadequate infrastructure
to handle the increasing population are also impacting the vulnerability to natural disaster sensitivity and climate change
10CLIMATE RISK COUNTRY PROFILE: ETHIOPIA
36 GFDRR (2017). Ethiopia. URL: https://www.gfdrr.org/en/ethiopia37 USAID (2016). Climate Change Risk Profile – Ethiopia. Fact Sheet. URL: https://www.climatelinks.org/sites/default/files/asset/
document/2016%20CRM%20Factsheet%20-%20Ethiopia_use%20this.pdf38 CGIAR (2018). Climate Resilient Green Economy Strategy. Sector-wise GTP II Implementation Monitoring Checklist. CGIAR Research
Program on Climate Change, Agriculture and Food Security(CCAFS), East Africa. URL: https://ccafs.cgiar.org/publications/ climate-resilient-green-economy-strategy#.XGH6Ac9KhBw
39 World Bank DataBank (2021). Health Nutrition and Population Statistics: Population estimates and projections – Ethiopia. URL: https://databank.worldbank.org/data/reports.aspx?source=health-nutrition-and-population-statistics:-population-estimates-and-projections
40 World Bank Group (2015). Ethiopia Urbanization Review: Urban Institutions for a Middle-Income Ethiopia. World Bank, Washington, DC. © World Bank. URL: https://openknowledge.worldbank.org/handle/10986/22979 License: CC BY 3.0 IGO.
41 EM-DAT: The Emergency Events Database - Universite catholique de Louvain (UCL) - CRED, D. Guha-Sapir, Brussels, Belgium. http://emdat.be/emdat_db/
vulnerability.36 Climate variability is already negatively impacting livelihoods and this is expected to continue. Drought
is the single most destructive climate-related natural hazard in Ethiopia. Estimates suggest climate change may
reduce Ethiopia’s GDP up to 10% by 2045, largely through drought-induced impacts on agricultural productivity.37
Economic impacts depend largely on the extent of annual weather variability and extremes, however recent major
droughts have reduced the country’s GDP by 1% to 4%, and rain-induced soil erosion has been estimated to reduce
GDP by approximately an additional 1%.38
Increasing amounts of Ethiopia’s population are living in urban areas, putting pressure on existing infrastructure
as well as scarce available land along with a limited natural resource base. As of 2018, 22.3 million people lived in
urban areas (20.8% of the total population). This is projected to increase to 37.5 million (21.7% of total population)
by the 2030s and 74.5 million (39.1% of total population) by the 2050s.39 This is expected to cause increased
pressure on urban infrastructure with increased likelihood of vulnerability for poorer and less-resilient communities.
Economic efforts and the development of industry has put additional pressure on the exploitation of forests,
lake-fisheries, inner-city development, and agriculture lands, which has contributed to deforestation, overfishing,
degradation of agriculture areas and forest environments, as well as the pollution and unsustainable use of
water resources.40
Ethiopia is exposed to numerous hazards including droughts, floods, volcanoes, and earthquakes. Recurring
droughts and floods have the most severe impact on Ethiopia’s population and the country has a long history of
recurring droughts, which have increased in magnitude, frequency, and impact since the 1970s. The 2011 Horn
of Africa drought left more than 4.5 million people in need of food assistance. These food shortages were caused
in part by the widespread death of livestock in the south and south-eastern parts of the country following pasture
failures and water shortages. It is anticipated that due to climate change and additional human-induced factors, areas
affected by drought and desertification are expanding. Flash floods and seasonal river floods are also becoming
more frequent and widespread. Projected trends indicate that through the end of the century there is a likely 20%
increase in extreme high rainfall events.
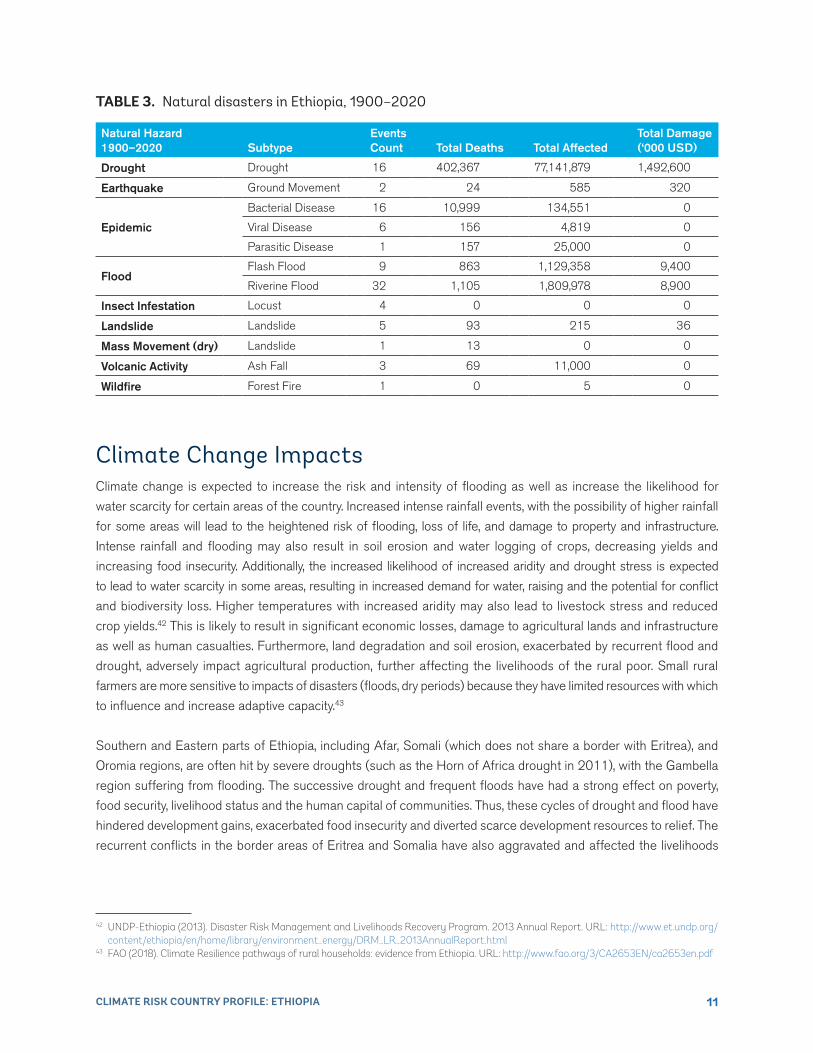
Data from the Emergency Event Database: EM-Dat database,41 presented in Table 3, shows the country has
endured various natural hazards, including floods, landslides, epidemic diseases, and storms.
11CLIMATE RISK COUNTRY PROFILE: ETHIOPIA
TABLE 3 . Natural disasters in Ethiopia, 1900–2020
Natural Hazard 1900–2020 Subtype
Events Count Total Deaths Total Affected
Total Damage (‘000 USD)
Drought Drought 16 402,367 77,141,879 1,492,600
Earthquake Ground Movement 2 24 585 320
Epidemic
Bacterial Disease 16 10,999 134,551 0
Viral Disease 6 156 4,819 0
Parasitic Disease 1 157 25,000 0
FloodFlash Flood 9 863 1,129,358 9,400
Riverine Flood 32 1,105 1,809,978 8,900
Insect Infestation Locust 4 0 0 0
Landslide Landslide 5 93 215 36
Mass Movement (dry) Landslide 1 13 0 0
Volcanic Activity Ash Fall 3 69 11,000 0
Wildfire Forest Fire 1 0 5 0
Climate Change ImpactsClimate change is expected to increase the risk and intensity of flooding as well as increase the likelihood for
water scarcity for certain areas of the country. Increased intense rainfall events, with the possibility of higher rainfall
for some areas will lead to the heightened risk of flooding, loss of life, and damage to property and infrastructure.
Intense rainfall and flooding may also result in soil erosion and water logging of crops, decreasing yields and
increasing food insecurity. Additionally, the increased likelihood of increased aridity and drought stress is expected
to lead to water scarcity in some areas, resulting in increased demand for water, raising and the potential for conflict
and biodiversity loss. Higher temperatures with increased aridity may also lead to livestock stress and reduced
crop yields.42 This is likely to result in significant economic losses, damage to agricultural lands and infrastructure
as well as human casualties. Furthermore, land degradation and soil erosion, exacerbated by recurrent flood and
drought, adversely impact agricultural production, further affecting the livelihoods of the rural poor. Small rural
farmers are more sensitive to impacts of disasters (floods, dry periods) because they have limited resources with which
to influence and increase adaptive capacity.43
Southern and Eastern parts of Ethiopia, including Afar, Somali (which does not share a border with Eritrea), and
Oromia regions, are often hit by severe droughts (such as the Horn of Africa drought in 2011), with the Gambella
region suffering from flooding. The successive drought and frequent floods have had a strong effect on poverty,
food security, livelihood status and the human capital of communities. Thus, these cycles of drought and flood have
hindered development gains, exacerbated food insecurity and diverted scarce development resources to relief. The
recurrent conflicts in the border areas of Eritrea and Somalia have also aggravated and affected the livelihoods
42 UNDP-Ethiopia (2013). Disaster Risk Management and Livelihoods Recovery Program. 2013 Annual Report. URL: http://www.et.undp.org/content/ethiopia/en/home/library/environment_energy/DRM_LR_2013AnnualReport.html
43 FAO (2018). Climate Resilience pathways of rural households: evidence from Ethiopia. URL: http://www.fao.org/3/CA2653EN/ca2653en.pdf
12CLIMATE RISK COUNTRY PROFILE: ETHIOPIA
of the affected communities.44 Changing rainfall patterns are expected to have additional serious implications for
harvests and pastoral rangelands, particularly for Oromia and western Somali regions. Given the country’s history
and climate vulnerability trends, risks to food security remain a high-concern priority.
Disaster risk from increased temperatures is expected to (i)exacerbate existing tensions between agricultural
and livestock needs as well as human population needs for water, especially during the dry season, (ii)alter
the quality of available water from surface water and groundwater, and (iii)increase plant stress resulting in
possible yield reduction. Changing rainfall patterns are expected to play a significant role in agricultural production
and harvest seasons, with later onsets expected to impact the production of cereal yields dependent upon the
April-May rainfall onsets.45 Droughts have remained one of the key drivers of food insecurity for the country,
with droughts resulting in crop damage, loss of pasture and water sources, loss of animals, hunger, disease
outbreaks, asset depletions, malnutrition and migration. Resulting likely sharp reductions in agricultural output
and related productive activity and employment creates a multiplier effect on both regional and national economies.
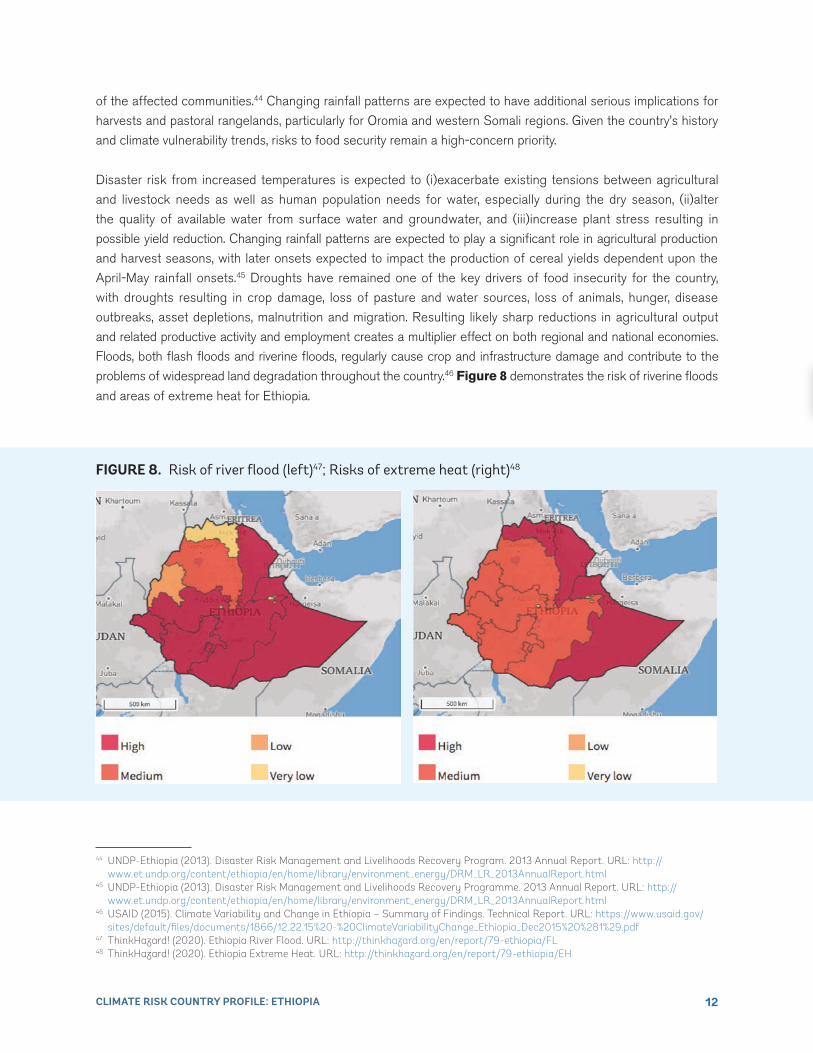
Floods, both flash floods and riverine floods, regularly cause crop and infrastructure damage and contribute to the
problems of widespread land degradation throughout the country.46 Figure 8 demonstrates the risk of riverine floods
and areas of extreme heat for Ethiopia.
44 UNDP-Ethiopia (2013). Disaster Risk Management and Livelihoods Recovery Program. 2013 Annual Report. URL: http:// www.et.undp.org/content/ethiopia/en/home/library/environment_energy/DRM_LR_2013AnnualReport.html
45 UNDP-Ethiopia (2013). Disaster Risk Management and Livelihoods Recovery Programme. 2013 Annual Report. URL: http:// www.et.undp.org/content/ethiopia/en/home/library/environment_energy/DRM_LR_2013AnnualReport.html
46 USAID (2015). Climate Variability and Change in Ethiopia – Summary of Findings. Technical Report. URL: https://www.usaid.gov/sites/default/files/documents/1866/12.22.15%20-%20ClimateVariabilityChange_Ethiopia_Dec2015%20%281%29.pdf
47 ThinkHazard! (2020). Ethiopia River Flood. URL: http://thinkhazard.org/en/report/79-ethiopia/FL48 ThinkHazard! (2020). Ethiopia Extreme Heat. URL: http://thinkhazard.org/en/report/79-ethiopia/EH
FIGURE 8 . Risk of river flood (left)47; Risks of extreme heat (right)48
13CLIMATE RISK COUNTRY PROFILE: ETHIOPIA
Implications for DRMThe Ethiopian Government is focused on combating recurrent droughts and food insecurity through a proactive
and comprehensive approach to disaster risk management (DRM). In 2007, the government created the Disaster
Management and Food Security Sector under the Ministry of Agriculture, designed and approved a National Policy
and Strategy on Disaster Management, and designed a DRM Strategic Program and Investment Framework for
government and donor interventions. To further advance the DRM agenda and to support wider development
aims, priorities include: (i) improving capacity to carry out disaster risk analysis; (ii) enhancing understanding of
disaster risks and related impacts; (iii) developing and strengthening building codes, land-use and urban planning,
contingency planning; and (iv) establishing risk financing mechanisms.49 Capacity building support for disaster
preparedness and management and post-disaster recovery is also being provided by bi-lateral partners.Integration
of DRM criteria into building codes, regulations, and zoning laws is also underway to increase the resilience of
education and health infrastructure.50
49 GFDRR (2016). Ethiopia – Country Profile. URL: https://www.gfdrr.org/sites/default/files/publication/country-profile-2016-ethiopia.pdf50 Ministry of Environment and Forest (2015). Ethiopia’s Second National Communication to the United Nations Framework Convention
on Climate Change (UNFCCC). The Federal Democratic Republic of Ethiopia. URL: https://unfccc.int/resource/docs/natc/ethnc2.pdf51 Ministry of Environment and Forest (2015). Ethiopia’s Second National Communication to the United Nations Framework Convention
on Climate Change (UNFCCC). The Federal Democratic Republic of Ethiopia. URL: https://unfccc.int/resource/docs/natc/ethnc2.pdf52 World Bank Group (2016). Gender Equality, Poverty Reduction, and Inclusive Growth. URL: http://documents1.worldbank.org/
curated/en/820851467992505410/pdf/102114-REVISED-PUBLIC-WBG-Gender-Strategy.pdf
CLIMATE CHANGE IMPACTS TO KEY SECTORS
Ethiopia is highly vulnerable to climate change, particularly in regards to the country’s water, agriculture, infrastructure,
forestry and public health sectors. Impacts of climate change are already being experienced in the region. Water
scarcity and drought conditions are expected to increase risks of food insecurity and may exacerbate conflict
situations over scarce resources and population movements. Heavy rains, flooding, and soil erosion puts both urban
and rural infrastructure at risk, particularly for poor and vulnerable groups. Increased occurrences of drought
conditions and reduced rainfall across much of the country will further impact agriculture, livestock, food security,
and human health. Environmental degradation, impacted water resources, and loss of biodiversity and ecosystem
services constitute serious obstacles to the country’s continued development and poverty reduction efforts, increasing
vulnerability to risks and hazards, increasing the importance for sustainable adaptation and resilience measures.51
GenderAn increasing body of research has shown that climate-related disasters have impacted human populations in many
areas including agricultural production, food security, water management and public health. The level of impacts
and coping strategies of populations depends heavily on their socio-economic status, socio-cultural norms, access
to resources, poverty as well as gender. Research has also provided more evidence that the effects are not gender
neutral, as women and children are among the highest risk groups. Key factors that account for the differences
between women’s and men’s vulnerability to climate change risks include: gender-based differences in time use;
access to assets and credit, treatment by formal institutions, which can constrain women’s opportunities, limited
access to policy discussions and decision making, and a lack of sex-disaggregated data for policy change.52
14CLIMATE RISK COUNTRY PROFILE: ETHIOPIA
Agriculture
OverviewAgriculture is Ethiopia’s sector most vulnerable to the impacts of climate change as it is dominated by small-scale
subsistence farmers who remain heavily dependent on rainfall (1% of all cultivated land is irrigated). The sector
employs low-intensive technologies and has a lack of access to financial or technical services.53 Furthermore, the
agriculture sector plays a major role in Ethiopia’s economy, contributing 34% of GDP.54 As of 2018, smallholder farming
households account for approximately 95% of agricultural production for the country and provide approximately 85%
of all employment.55 The agriculture sector contributes an estimated 75% of Ethiopia’s export commodity value (key
exports such as coffee and livestock).56 Limited water storage capacity further increases vulnerability to climate risks.
The climate impacts of greatest significance for agriculture and food security are likely to be warmer temperatures
and more frequent occurrence of drought. Climate change may affect crop yields, and consequently, nutrition
and health. Increased intensity and frequency of drought can affect food security through direct impacts on food
availability (e.g., reduced crop yields, and changes in the quantity and quality of livestock feed and forage), and
through indirect impacts on livelihoods and income that in turn have consequences for food accessibility.57
Climate Change ImpactsMany of Ethiopia’s small-holder farmers grow slow-maturing, high-yield “long cycle” crops that depend on two rainy
seasons to reach harvest and are thus even more vulnerable to changes in seasonal rainfall. The majority of plots are
less than 1/2 hectare and are insufficient to sustain household food security, much less generate adequate income.
This limits household capacity to invest in improved farming practices that could increase climate resilience. Recurring
drought and increased desertification resulting from land use pressures have resulted in significant losses of arable
land and rendered the country increasingly dependent on food aid. Crop productivity may increase in some areas
(highlands and high-plateaus) in the short term due to warmer temperatures, but continued high temperatures will
result in heat stress and crop failure. It is estimated that Ethiopia will lose more than 6% of each year’s agricultural
output if the current decline in average annual rainfall levels for primary agricultural zones continues to mid-century.58
Rising temperatures and shifting rainfall patterns may increase soil erosion and increase growing difficulties for many
crops as well as shorten growing seasons. These scenarios are likely to also alter the occurrence and distribution of
pests. Primary crops produced in Ethiopia include cereals, pulses, coffee, oilseeds, spices, herbs, vegetables, fruits,
sugarcane, and potatoes. Rising temperatures are expected to increase suitable condition for crop diseases and
pest infestations. Ethiopia also has the largest livestock population in Africa, with 54 million cattle, 25.5 million sheep,
24.1 million goats, 915,000 camels (downward trend) and 50.4 million poultry (2013).59
53 USAID (2016). Climate Change Risk Profile – Ethiopia. URL: https://www.climatelinks.org/sites/default/files/asset/document/2016%20CRM%20Factsheet%20-%20Ethiopia_use%20this.pdf
54 World Bank Open Data (2021). World Development Indicators. Ethiopia URL: https://databank.worldbank.org/data/reports.aspx?source=2&country
55 FAO (2019). FAO Ethiopia Country Page, Agriculture. URL: http://www.fao.org/ethiopia/fao-in-ethiopia/ethiopia-at-a-glance/en/56 CGIAR (2018). Climate Resilient Green Economy Strategy. Sector-wise GTP II Implementation Monitoring Checklist. CGIAR
Research Program on Climate Change, Agriculture and Food Security(CCAFS), East Africa. URL: https://ccafs.cgiar.org/publications/climate-resilient-green-economy-strategy#.XGH6Ac9KhBw
57 USAID (2012). Climate Change Adaptation in Ethiopia. URL: https://www.climatelinks.org/sites/default/files/asset/document/ethiopia_adaptation_fact_sheet_jan2012.pdf
58 USAID (2016). Climate Change Risk Profile – Ethiopia. Fact Sheet. URL: https://www.climatelinks.org/sites/default/files/asset/document/2016%20CRM%20Factsheet%20-%20Ethiopia_use%20this.pdf
59 Ministry of Environment and Forest (2015). Ethiopia’s Second National Communication to the United Nations Framework Convention on Climate Change (UNFCCC). The Federal Democratic Republic of Ethiopia. URL: https://unfccc.int/resource/docs/natc/ethnc2.pdf
15CLIMATE RISK COUNTRY PROFILE: ETHIOPIA
The agriculture sector relies heavily on ground and surface water supply, that is sensitive to localized land use
and likely to experience decreasing recharge and quality due to reduced precipitation in some areas; increasing
evaporation. An expected trend of reduction in rainfall can have consequences for agriculture and water quality,
especially in more arid areas. Increased temperatures and the threat of waterlogging of fields may also result in
an increased presence of pests and diseases harmful to yield production and quality. Changes in seasonality of
precipitation will lead to further soil erosion and loss of soil fertility. By 2050, climate change may increase the rate
of soil erosion by up to 40-70%. The top three affected watersheds are the South Ari, Gelila, and Geze Gofa of the
Southern Nations, Nationalities, and Peoples’ Region.60
Livestock is also likely to be impacted by increased heat conditions, including the effects of radiation, temperature,
and humidity. Under present climate conditions, heat stress makes it difficult for animals to keep up with heat
dissipation, rendering them vulnerable to heat stress during, at least, part of the year. Heat stress has a variety of
detrimental effects on livestock, but can include reductions on milk production and reproduction, particularly for
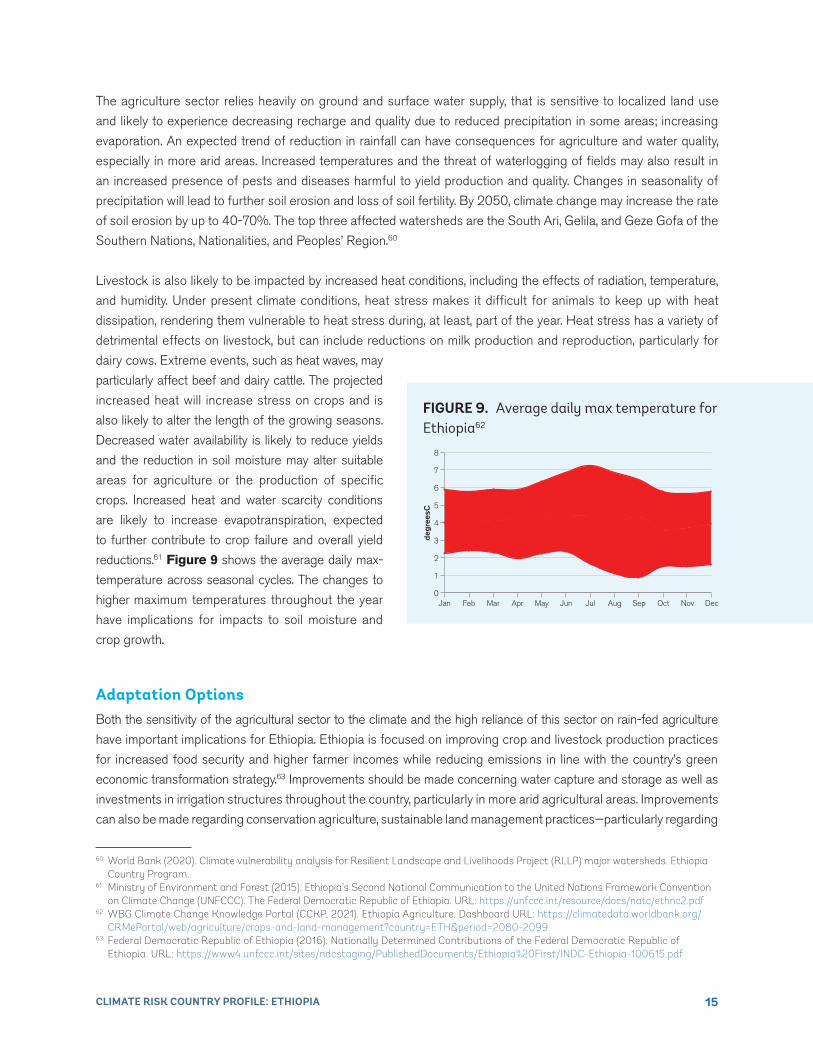
dairy cows. Extreme events, such as heat waves, may
particularly affect beef and dairy cattle. The projected
increased heat will increase stress on crops and is
also likely to alter the length of the growing seasons.
Decreased water availability is likely to reduce yields
and the reduction in soil moisture may alter suitable
areas for agriculture or the production of specific
crops. Increased heat and water scarcity conditions
are likely to increase evapotranspiration, expected
to further contribute to crop failure and overall yield
reductions.61 Figure 9 shows the average daily max-
temperature across seasonal cycles. The changes to
higher maximum temperatures throughout the year
have implications for impacts to soil moisture and
crop growth.
Adaptation OptionsBoth the sensitivity of the agricultural sector to the climate and the high reliance of this sector on rain-fed agriculture
have important implications for Ethiopia. Ethiopia is focused on improving crop and livestock production practices
for increased food security and higher farmer incomes while reducing emissions in line with the country’s green
economic transformation strategy.63 Improvements should be made concerning water capture and storage as well as
investments in irrigation structures throughout the country, particularly in more arid agricultural areas. Improvements
can also be made regarding conservation agriculture, sustainable land management practices—particularly regarding
60 World Bank (2020). Climate vulnerability analysis for Resilient Landscape and Livelihoods Project (RLLP) major watersheds. Ethiopia Country Program.
61 Ministry of Environment and Forest (2015). Ethiopia’s Second National Communication to the United Nations Framework Convention on Climate Change (UNFCCC). The Federal Democratic Republic of Ethiopia. URL: https://unfccc.int/resource/docs/natc/ethnc2.pdf
62 WBG Climate Change Knowledge Portal (CCKP, 2021). Ethiopia Agriculture. Dashboard URL: https://climatedata.worldbank.org/CRMePortal/web/agriculture/crops-and-land-management?country=ETH&period=2080-2099
63 Federal Democratic Republic of Ethiopia (2016). Nationally Determined Contributions of the Federal Democratic Republic of Ethiopia. URL: https://www4.unfccc.int/sites/ndcstaging/PublishedDocuments/Ethiopia%20First/INDC-Ethiopia-100615.pdf
FIGURE 9 . Average daily max temperature for Ethiopia62
0
1
2
3
4
5
7
8
6
degr
eesC
DecNovOctSepAugJulJunMayAprMarFebJan
16CLIMATE RISK COUNTRY PROFILE: ETHIOPIA
64 Ministry of Environment and Forest (2015). Ethiopia’s Second National Communication to the United Nations Framework Convention on Climate Change (UNFCCC). The Federal Democratic Republic of Ethiopia. URL: https://unfccc.int/resource/docs/natc/ethnc2.pdf
65 USAID (2016). Climate Change Risk Profile – Ethiopia. Fact Sheet. URL: https://www.climatelinks.org/sites/default/files/asset/document/2016%20CRM%20Factsheet%20-%20Ethiopia_use%20this.pdf
66 Ministry of Environment and Forest (2015). Ethiopia’s Second National Communication to the United Nations Framework Convention on Climate Change (UNFCCC). The Federal Democratic Republic of Ethiopia. URL: https://unfccc.int/resource/docs/natc/ethnc2.pdf
67 USAID (2012). Climate Change Adaptation in Ethiopia. URL: https://www.climatelinks.org/sites/default/files/asset/document/ethiopia_adaptation_fact_sheet_jan2012.pdf
68 USAID (2012). Climate Change Adaptation in Ethiopia. URL: https://www.climatelinks.org/sites/default/files/asset/document/ethiopia_adaptation_fact_sheet_jan2012.pdf
69 Ministry of Environment and Forest (2015). Ethiopia’s Second National Communication to the United Nations Framework Convention on Climate Change (UNFCCC). The Federal Democratic Republic of Ethiopia. URL: https://unfccc.int/resource/docs/natc/ethnc2.pdf
soil erosion, watershed management, and nutrient and crop management; these improvements can also contribute
to the reduction of sector emissions, while improving soil management and longer-term productivity.64 Additionally,
semi-stabled cattle systems may help to contribute to resilience of the country’s highland agricultural areas.65
Diversification of income away from reliance on farming operations can also be an effective strategy for making
farmers more resilient to climate change risks and more food secure for the future. Financing options for farmers
should also be more accessible as well as the development of insurance schemes for farmers to protect against
climate change.66 Scale of Safety Net Programs and Food Security Initiatives can be expanded to support more
vulnerable populations. Improvements can also be made to the weather monitoring network and associated
weather information systems, including the publication and distribution of agriculture-specific weather forecasts
on a frequent basis (e.g. short-term and seasonal forecasts, monitoring of heavy rainfall, etc.).67
Water
OverviewEthiopia has an abundance of water resources, including 12 river basins with groundwater potential of approximately
2.6 billion cubic meters. However, these are unevenly distributed across the country and much of the country’s
flow-waters flow across borders. To date, only a small proportion of these water resources have been developed
for sectors such as hydropower, agriculture, water supply or sanitation. Projected trends of increased temperatures
and precipitation patterns and intensity is expected to not only increase water stress and fresh water vulnerability, but
also exacerbate existing non-climate stressors and challenge the country’s existing weak water governance.68
Climate Change ImpactsProjected increases in the frequency of droughts, increased evaporation and evapotranspiration, along with changes
in rainfall patterns and runoff, may further reduce availability in water-scarce regions (southern, eastern and
central).69 Rainfall and evaporation changes also impact degrees of surface water infiltration and recharge rates
for groundwater and low-water storage capacity increases the country’s dependence on unreliable rainfall
patterns. Changes in rainfall and evaporation translate directly to changes in surface water infiltration and
groundwater re-charge. This has the potential for further decreased reliability of unimproved groundwater sources
and surface water sources during droughts or prolonged dry seasons. Increased strain on pump mechanisms
17CLIMATE RISK COUNTRY PROFILE: ETHIOPIA
leading to breakdowns if maintenance is neglected and the potential for falling water levels in the immediate
vicinity of wells or boreholes, particularly in areas of high demand.70 Additionally, temperature increases have
the potential to result in increased soil moisture deficits even under conditions of increasing rainfall.
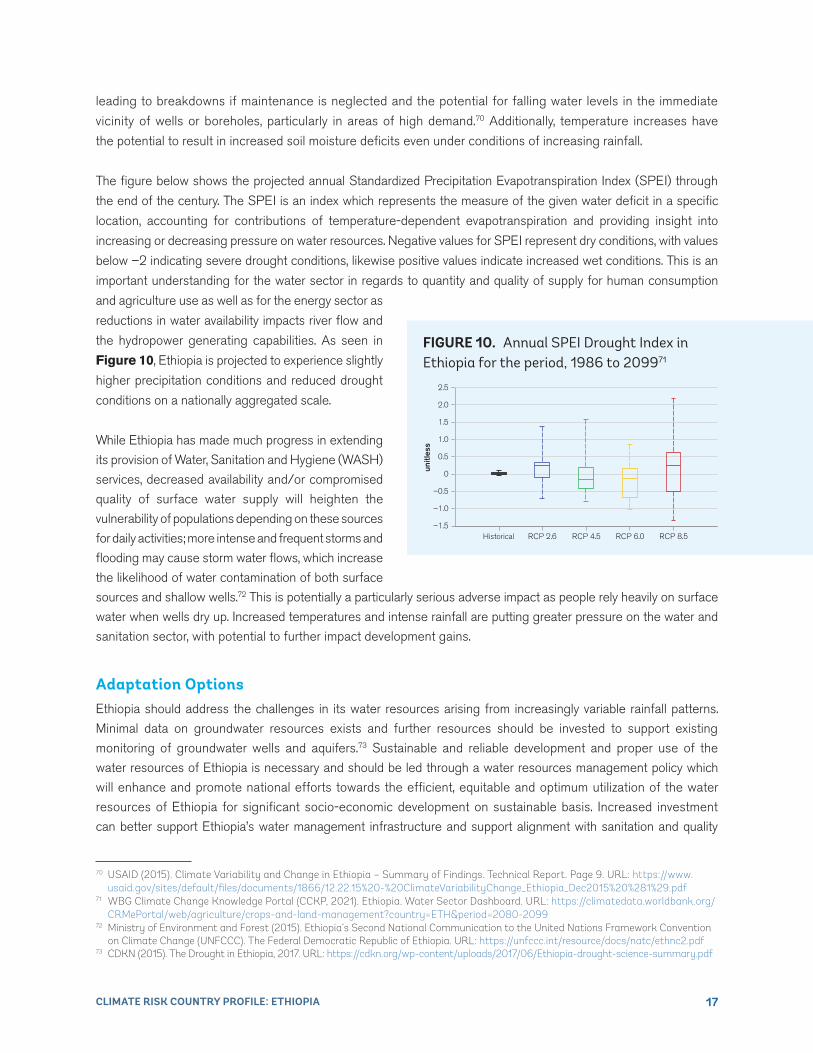
The figure below shows the projected annual Standardized Precipitation Evapotranspiration Index (SPEI) through
the end of the century. The SPEI is an index which represents the measure of the given water deficit in a specific
location, accounting for contributions of temperature-dependent evapotranspiration and providing insight into
increasing or decreasing pressure on water resources. Negative values for SPEI represent dry conditions, with values
below –2 indicating severe drought conditions, likewise positive values indicate increased wet conditions. This is an
important understanding for the water sector in regards to quantity and quality of supply for human consumption
and agriculture use as well as for the energy sector as
reductions in water availability impacts river flow and
the hydropower generating capabilities. As seen in
Figure 10, Ethiopia is projected to experience slightly
higher precipitation conditions and reduced drought
conditions on a nationally aggregated scale.
While Ethiopia has made much progress in extending
its provision of Water, Sanitation and Hygiene (WASH)
services, decreased availability and/or compromised
quality of surface water supply will heighten the
vulnerability of populations depending on these sources
for daily activities; more intense and frequent storms and
flooding may cause storm water flows, which increase
the likelihood of water contamination of both surface
sources and shallow wells.72 This is potentially a particularly serious adverse impact as people rely heavily on surface
water when wells dry up. Increased temperatures and intense rainfall are putting greater pressure on the water and
sanitation sector, with potential to further impact development gains.
Adaptation OptionsEthiopia should address the challenges in its water resources arising from increasingly variable rainfall patterns.
Minimal data on groundwater resources exists and further resources should be invested to support existing
monitoring of groundwater wells and aquifers.73 Sustainable and reliable development and proper use of the
water resources of Ethiopia is necessary and should be led through a water resources management policy which
will enhance and promote national efforts towards the efficient, equitable and optimum utilization of the water
resources of Ethiopia for significant socio-economic development on sustainable basis. Increased investment
can better support Ethiopia’s water management infrastructure and support alignment with sanitation and quality
70 USAID (2015). Climate Variability and Change in Ethiopia – Summary of Findings. Technical Report. Page 9. URL: https://www.usaid.gov/sites/default/files/documents/1866/12.22.15%20-%20ClimateVariabilityChange_Ethiopia_Dec2015%20%281%29.pdf
71 WBG Climate Change Knowledge Portal (CCKP, 2021). Ethiopia. Water Sector Dashboard. URL: https://climatedata.worldbank.org/CRMePortal/web/agriculture/crops-and-land-management?country=ETH&period=2080-2099
72 Ministry of Environment and Forest (2015). Ethiopia’s Second National Communication to the United Nations Framework Convention on Climate Change (UNFCCC). The Federal Democratic Republic of Ethiopia. URL: https://unfccc.int/resource/docs/natc/ethnc2.pdf
73 CDKN (2015). The Drought in Ethiopia, 2017. URL: https://cdkn.org/wp-content/uploads/2017/06/Ethiopia-drought-science-summary.pdf
FIGURE 10 . Annual SPEI Drought Index in Ethiopia for the period, 1986 to 209971
–1.5
–1.0
–0.5
0
0.5
1.0
1.5
2.0
2.5
unitl
ess
Historical RCP 2.6 RCP 4.5 RCP 6.0 RCP 8.5
18CLIMATE RISK COUNTRY PROFILE: ETHIOPIA
drinking water requirements. Development planning for urban expansion should be coordinated through the
country’s climate change adaptation strategies. Planning and adaptation strategies for water resources should
also be included within development strategies for agriculture, infrastructure, and energy sectors.74 Improvements
to the country’s water infrastructure should be a priority.
Energy
OverviewThe Energy sector is key to Ethiopia’s overall development goals, has been identified as a key economic
component in the country’s development plans and is key to the country’s strategies for green economic growth.
Traditional biomass fuels remain the primary source of fuel with firewood, charcoal and agro-residue contributing
approximately 92% of the total energy supply. However, great opportunity for the country exists in harnessing
renewable energy capabilities.75 Ethiopia is seeking to increase national energy generation from various
sources, including hydropower on the Nile. However, hydropower along the Nile river, from source to sea, is
subject to the changing dynamics of rainfall, which can impact on hydrological flows from one year to the next.
Projections suggest a 30% decrease in flow volume on several Nile tributaries by mid-century.76 Ethiopia’s power
sector is heavily reliant on hydropower and very sensitive to climate change with worsening droughts, more frequent
floods and landslides in some areas. Furthermore, the country’s energy infrastructure remains highly vulnerable to
climate variability and climate change impacts. Already, adverse impacts from degraded catchment areas, reduced
river flows, increased siltation, blown transmission and distribution systems continue to occur.77
Climate Change ImpactsA reduction in water availability and river flow threatens potential energy generation for Ethiopia. Projected
trends are expected to increase costs of maintenance and repairing of power and energy infrastructure as well
as disrupt power supply.78 Increased heat is likely to threaten the cooling capacity of power generating stations
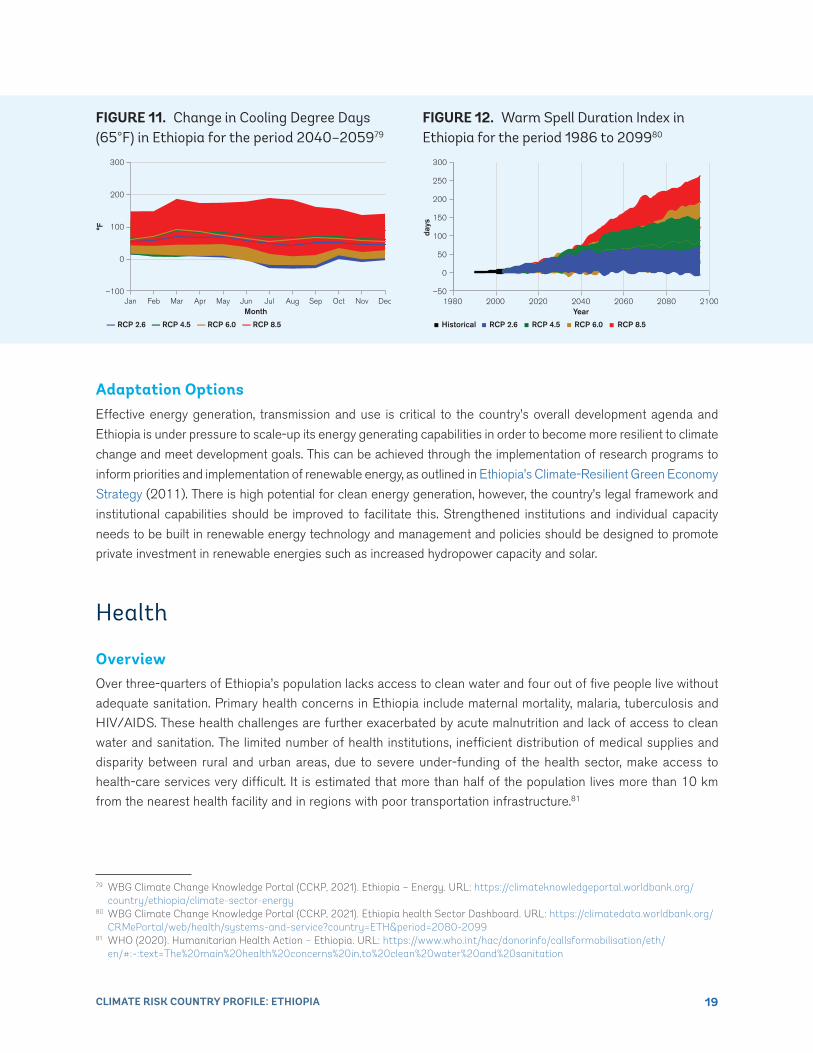
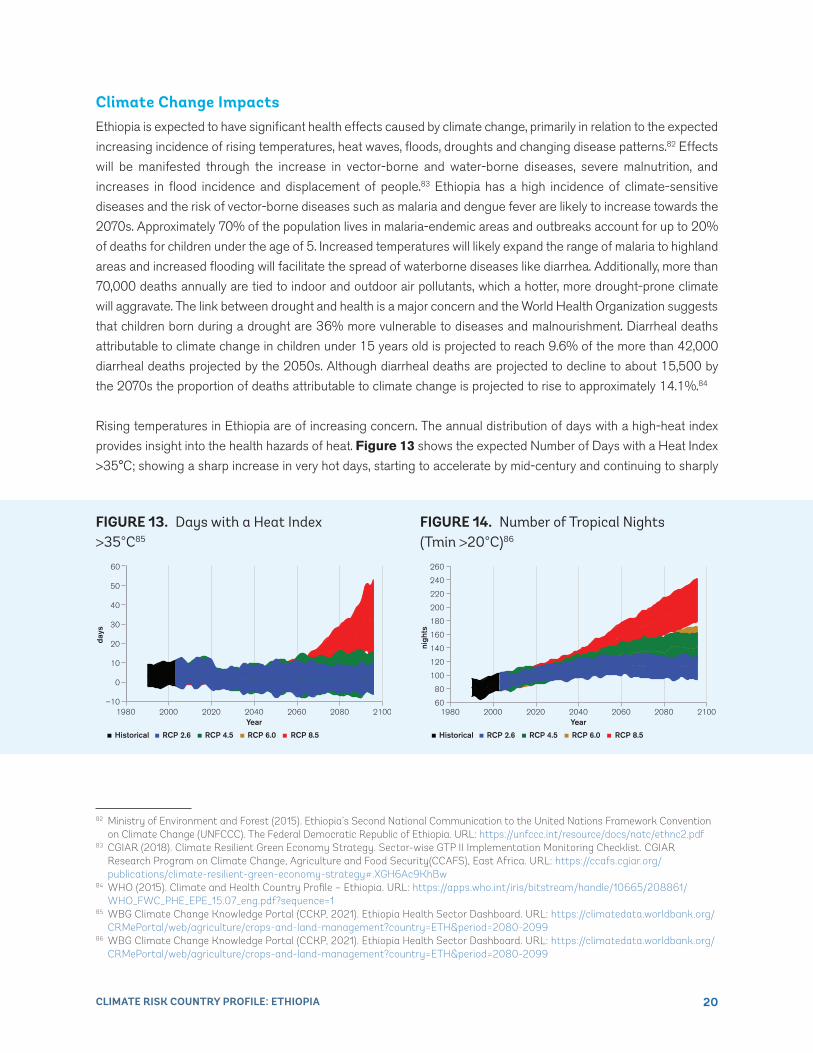
with potential to impact generation as well as transmission. Cooling Degree Days show the relationship between
daily heat and cooling demand, typically sourced through a form of active cooling or an evaporative process.
The change in cooling degree days provides insight into the potential for extended seasons of power demand or
periods in which cooling demand (power demands) might increase. As seen in Figure 11, seasonal increases
for cooling demands are expected to increase throughout the year, under a high emissions scenario (RCP8.5). The
Warm Spell Duration Index (Figure 12) represents the number of days in a sequence of at least six days in which
the daily maximum temperature is greater than the 90th percentile of daily maximum temperature. As shown in the
figure below, warm spells are expected to sharply increase in the second half of the century.
74 CGIAR (2018). Climate Resilient Green Economy Strategy. Sector-wise GTP II Implementation Monitoring Checklist. CGIAR Research Program on Climate Change, Agriculture and Food Security(CCAFS), East Africa. URL: https://ccafs.cgiar.org/publications/climate-resilient-green-economy-strategy#.XGH6Ac9KhBw
75 Ministry of Environment and Forest (2015). Ethiopia’s Second National Communication to the United Nations Framework Convention on Climate Change (UNFCCC). The Federal Democratic Republic of Ethiopia. URL: https://unfccc.int/resource/docs/natc/ethnc2.pdf
76 USAID (2016). Climate Change Risk Profile – Ethiopia. Fact Sheet. URL: https://www.climatelinks.org/sites/default/files/asset/document/2016%20CRM%20Factsheet%20-%20Ethiopia_use%20this.pdf
77 CGIAR (2018). Climate Resilient Green Economy Strategy. Sector-wise GTP II Implementation Monitoring Checklist. CGIAR Research Program on Climate Change, Agriculture and Food Security(CCAFS), East Africa. URL: https://ccafs.cgiar.org/publications/climate-resilient-green-economy-strategy#.XGH6Ac9KhBw
78 The World Bank (2017). Ethiopia – Country Environmental Analysis. Realizing Green Transformation. URL: https://docs.google.com/viewer?url=http://www.efdinitiative.org/sites/default/files/publications/ethiopia_cea_0.pdf
19CLIMATE RISK COUNTRY PROFILE: ETHIOPIA
Adaptation OptionsEffective energy generation, transmission and use is critical to the country’s overall development agenda and
Ethiopia is under pressure to scale-up its energy generating capabilities in order to become more resilient to climate
change and meet development goals. This can be achieved through the implementation of research programs to
inform priorities and implementation of renewable energy, as outlined in Ethiopia’s Climate-Resilient Green Economy
Strategy (2011). There is high potential for clean energy generation, however, the country’s legal framework and
institutional capabilities should be improved to facilitate this. Strengthened institutions and individual capacity
needs to be built in renewable energy technology and management and policies should be designed to promote
private investment in renewable energies such as increased hydropower capacity and solar.
Health
OverviewOver three-quarters of Ethiopia’s population lacks access to clean water and four out of five people live without
adequate sanitation. Primary health concerns in Ethiopia include maternal mortality, malaria, tuberculosis and
HIV/AIDS. These health challenges are further exacerbated by acute malnutrition and lack of access to clean
water and sanitation. The limited number of health institutions, inefficient distribution of medical supplies and
disparity between rural and urban areas, due to severe under-funding of the health sector, make access to
health-care services very difficult. It is estimated that more than half of the population lives more than 10 km
from the nearest health facility and in regions with poor transportation infrastructure.81
79 WBG Climate Change Knowledge Portal (CCKP, 2021). Ethiopia – Energy. URL: https://climateknowledgeportal.worldbank.org/country/ethiopia/climate-sector-energy
80 WBG Climate Change Knowledge Portal (CCKP, 2021). Ethiopia health Sector Dashboard. URL: https://climatedata.worldbank.org/CRMePortal/web/health/systems-and-service?country=ETH&period=2080-2099
81 WHO (2020). Humanitarian Health Action – Ethiopia. URL: https://www.who.int/hac/donorinfo/callsformobilisation/eth/en/#:~:text=The%20main%20health%20concerns%20in,to%20clean%20water%20and%20sanitation
FIGURE 11 . Change in Cooling Degree Days (65°F) in Ethiopia for the period 2040–205979
–100
0
100
300
200
°F
DecNovOctSepAugJulJunMonth
MayAprMarFebJan
RCP 8.5RCP 2.6 RCP 4.5 RCP 6.0
FIGURE 12 . Warm Spell Duration Index in Ethiopia for the period 1986 to 209980
–50
0
50
100
150
200
250
300
days
Year
RCP 8.5
2000 2020 2040 2060 2080 21001980
Historical RCP 2.6 RCP 4.5 RCP 6.0
20CLIMATE RISK COUNTRY PROFILE: ETHIOPIA
Climate Change ImpactsEthiopia is expected to have significant health effects caused by climate change, primarily in relation to the expected
increasing incidence of rising temperatures, heat waves, floods, droughts and changing disease patterns.82 Effects
will be manifested through the increase in vector-borne and water-borne diseases, severe malnutrition, and
increases in flood incidence and displacement of people.83 Ethiopia has a high incidence of climate-sensitive
diseases and the risk of vector-borne diseases such as malaria and dengue fever are likely to increase towards the
2070s. Approximately 70% of the population lives in malaria-endemic areas and outbreaks account for up to 20%
of deaths for children under the age of 5. Increased temperatures will likely expand the range of malaria to highland
areas and increased flooding will facilitate the spread of waterborne diseases like diarrhea. Additionally, more than
70,000 deaths annually are tied to indoor and outdoor air pollutants, which a hotter, more drought-prone climate
will aggravate. The link between drought and health is a major concern and the World Health Organization suggests
that children born during a drought are 36% more vulnerable to diseases and malnourishment. Diarrheal deaths
attributable to climate change in children under 15 years old is projected to reach 9.6% of the more than 42,000
diarrheal deaths projected by the 2050s. Although diarrheal deaths are projected to decline to about 15,500 by
the 2070s the proportion of deaths attributable to climate change is projected to rise to approximately 14.1%.84
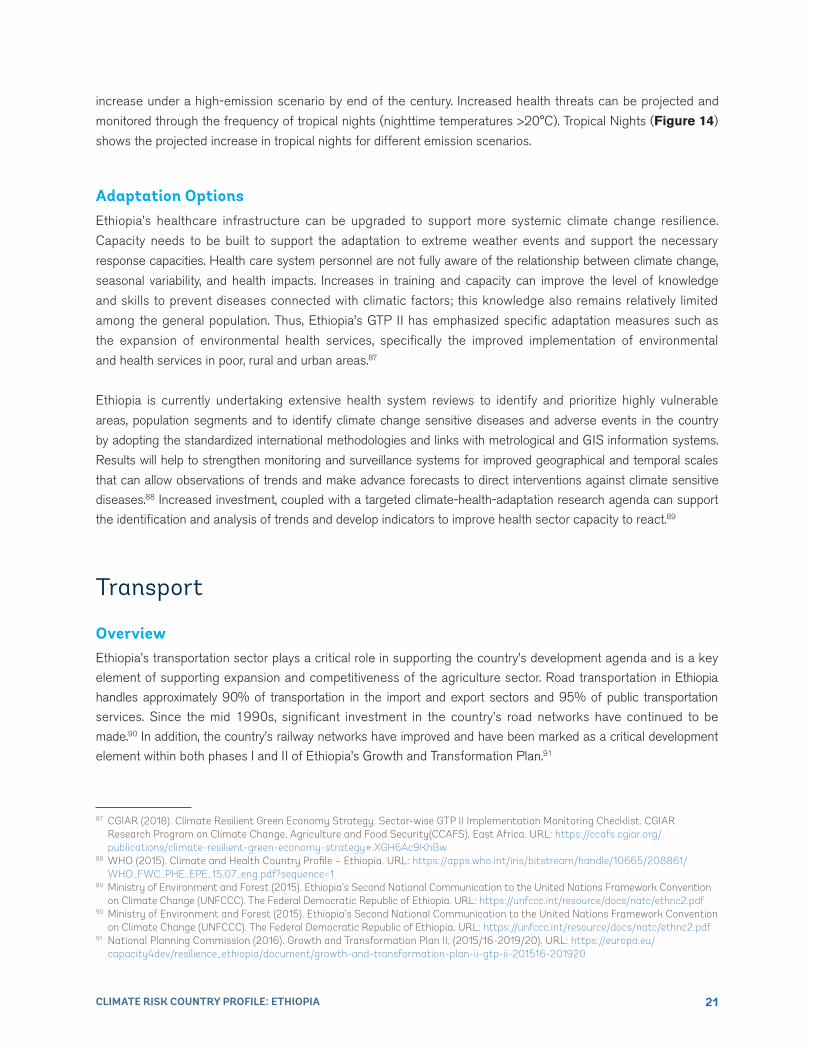
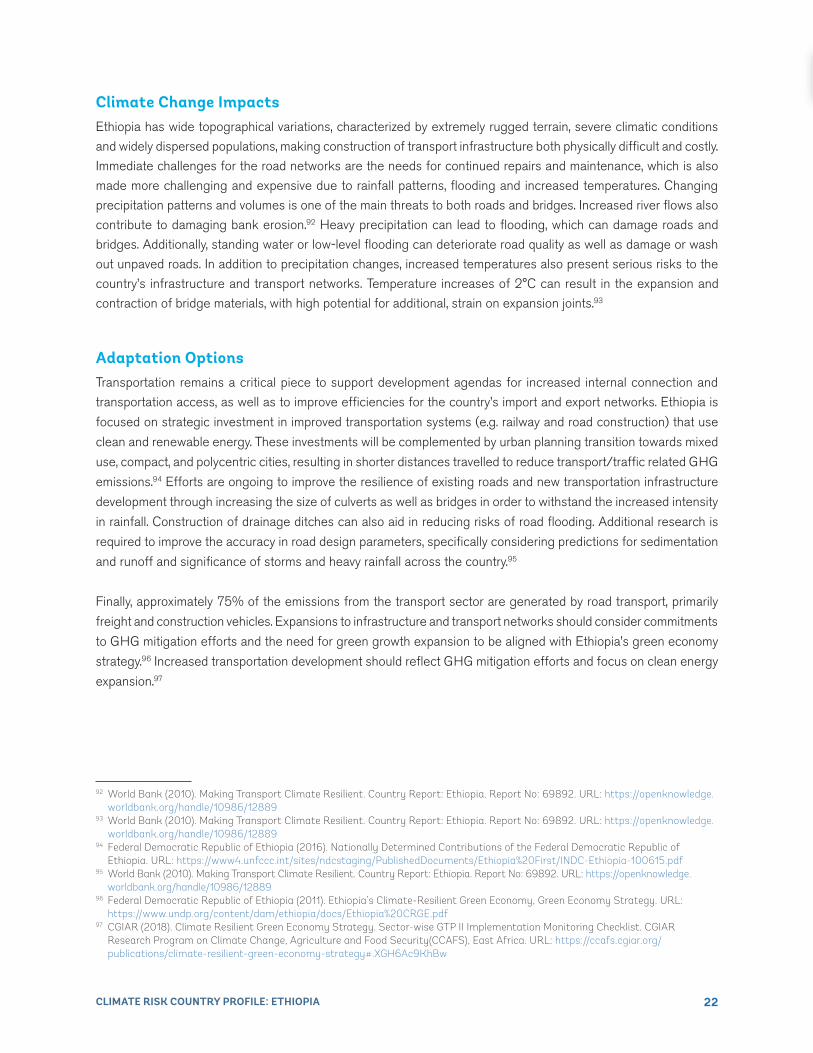
Rising temperatures in Ethiopia are of increasing concern. The annual distribution of days with a high-heat index
provides insight into the health hazards of heat. Figure 13 shows the expected Number of Days with a Heat Index
>35°C; showing a sharp increase in very hot days, starting to accelerate by mid-century and continuing to sharply
82 Ministry of Environment and Forest (2015). Ethiopia’s Second National Communication to the United Nations Framework Convention on Climate Change (UNFCCC). The Federal Democratic Republic of Ethiopia. URL: https://unfccc.int/resource/docs/natc/ethnc2.pdf
83 CGIAR (2018). Climate Resilient Green Economy Strategy. Sector-wise GTP II Implementation Monitoring Checklist. CGIAR Research Program on Climate Change, Agriculture and Food Security(CCAFS), East Africa. URL: https://ccafs.cgiar.org/publications/climate-resilient-green-economy-strategy#.XGH6Ac9KhBw
84 WHO (2015). Climate and Health Country Profile – Ethiopia. URL: https://apps.who.int/iris/bitstream/handle/10665/208861/ WHO_FWC_PHE_EPE_15.07_eng.pdf?sequence=1
85 WBG Climate Change Knowledge Portal (CCKP, 2021). Ethiopia Health Sector Dashboard. URL: https://climatedata.worldbank.org/CRMePortal/web/agriculture/crops-and-land-management?country=ETH&period=2080-2099
86 WBG Climate Change Knowledge Portal (CCKP, 2021). Ethiopia Health Sector Dashboard. URL: https://climatedata.worldbank.org/CRMePortal/web/agriculture/crops-and-land-management?country=ETH&period=2080-2099
FIGURE 13 . Days with a Heat Index >35°C85
–10
0
10
30
40
20
50
60
days
Year
RCP 8.5
2000 2020 2040 2060 2080 21001980
Historical RCP 2.6 RCP 4.5 RCP 6.0
60
80
100
140
160
120
180
200
220
240
260
Year
RCP 8.5
2000 2020 2040 2060 2080 21001980
Historical RCP 2.6 RCP 4.5 RCP 6.0
nigh
ts
FIGURE 14 . Number of Tropical Nights (Tmin >20°C)86
21CLIMATE RISK COUNTRY PROFILE: ETHIOPIA
increase under a high-emission scenario by end of the century. Increased health threats can be projected and
monitored through the frequency of tropical nights (nighttime temperatures >20°C). Tropical Nights (Figure 14)
shows the projected increase in tropical nights for different emission scenarios.
Adaptation OptionsEthiopia’s healthcare infrastructure can be upgraded to support more systemic climate change resilience.
Capacity needs to be built to support the adaptation to extreme weather events and support the necessary
response capacities. Health care system personnel are not fully aware of the relationship between climate change,
seasonal variability, and health impacts. Increases in training and capacity can improve the level of knowledge
and skills to prevent diseases connected with climatic factors; this knowledge also remains relatively limited
among the general population. Thus, Ethiopia’s GTP II has emphasized specific adaptation measures such as
the expansion of environmental health services, specifically the improved implementation of environmental
and health services in poor, rural and urban areas.87
Ethiopia is currently undertaking extensive health system reviews to identify and prioritize highly vulnerable
areas, population segments and to identify climate change sensitive diseases and adverse events in the country
by adopting the standardized international methodologies and links with metrological and GIS information systems.
Results will help to strengthen monitoring and surveillance systems for improved geographical and temporal scales
that can allow observations of trends and make advance forecasts to direct interventions against climate sensitive
diseases.88 Increased investment, coupled with a targeted climate-health-adaptation research agenda can support
the identification and analysis of trends and develop indicators to improve health sector capacity to react.89
Transport
OverviewEthiopia’s transportation sector plays a critical role in supporting the country’s development agenda and is a key
element of supporting expansion and competitiveness of the agriculture sector. Road transportation in Ethiopia
handles approximately 90% of transportation in the import and export sectors and 95% of public transportation
services. Since the mid 1990s, significant investment in the country’s road networks have continued to be
made.90 In addition, the country’s railway networks have improved and have been marked as a critical development
element within both phases I and II of Ethiopia’s Growth and Transformation Plan.91
87 CGIAR (2018). Climate Resilient Green Economy Strategy. Sector-wise GTP II Implementation Monitoring Checklist. CGIAR Research Program on Climate Change, Agriculture and Food Security(CCAFS), East Africa. URL: https://ccafs.cgiar.org/publications/climate-resilient-green-economy-strategy#.XGH6Ac9KhBw
88 WHO (2015). Climate and Health Country Profile – Ethiopia. URL: https://apps.who.int/iris/bitstream/handle/10665/208861/ WHO_FWC_PHE_EPE_15.07_eng.pdf?sequence=1
89 Ministry of Environment and Forest (2015). Ethiopia’s Second National Communication to the United Nations Framework Convention on Climate Change (UNFCCC). The Federal Democratic Republic of Ethiopia. URL: https://unfccc.int/resource/docs/natc/ethnc2.pdf
90 Ministry of Environment and Forest (2015). Ethiopia’s Second National Communication to the United Nations Framework Convention on Climate Change (UNFCCC). The Federal Democratic Republic of Ethiopia. URL: https://unfccc.int/resource/docs/natc/ethnc2.pdf
91 National Planning Commission (2016). Growth and Transformation Plan II, (2015/16-2019/20). URL: https://europa.eu/capacity4dev/resilience_ethiopia/document/growth-and-transformation-plan-ii-gtp-ii-201516-201920
22CLIMATE RISK COUNTRY PROFILE: ETHIOPIA
Climate Change ImpactsEthiopia has wide topographical variations, characterized by extremely rugged terrain, severe climatic conditions
and widely dispersed populations, making construction of transport infrastructure both physically difficult and costly.
Immediate challenges for the road networks are the needs for continued repairs and maintenance, which is also
made more challenging and expensive due to rainfall patterns, flooding and increased temperatures. Changing
precipitation patterns and volumes is one of the main threats to both roads and bridges. Increased river flows also
contribute to damaging bank erosion.92 Heavy precipitation can lead to flooding, which can damage roads and
bridges. Additionally, standing water or low-level flooding can deteriorate road quality as well as damage or wash
out unpaved roads. In addition to precipitation changes, increased temperatures also present serious risks to the
country’s infrastructure and transport networks. Temperature increases of 2°C can result in the expansion and
contraction of bridge materials, with high potential for additional, strain on expansion joints.93
Adaptation OptionsTransportation remains a critical piece to support development agendas for increased internal connection and
transportation access, as well as to improve efficiencies for the country’s import and export networks. Ethiopia is
focused on strategic investment in improved transportation systems (e.g. railway and road construction) that use
clean and renewable energy. These investments will be complemented by urban planning transition towards mixed
use, compact, and polycentric cities, resulting in shorter distances travelled to reduce transport/traffic related GHG
emissions.94 Efforts are ongoing to improve the resilience of existing roads and new transportation infrastructure
development through increasing the size of culverts as well as bridges in order to withstand the increased intensity
in rainfall. Construction of drainage ditches can also aid in reducing risks of road flooding. Additional research is
required to improve the accuracy in road design parameters, specifically considering predictions for sedimentation
and runoff and significance of storms and heavy rainfall across the country.95
Finally, approximately 75% of the emissions from the transport sector are generated by road transport, primarily
freight and construction vehicles. Expansions to infrastructure and transport networks should consider commitments
to GHG mitigation efforts and the need for green growth expansion to be aligned with Ethiopia’s green economy
strategy.96 Increased transportation development should reflect GHG mitigation efforts and focus on clean energy
expansion.97
92 World Bank (2010). Making Transport Climate Resilient. Country Report: Ethiopia. Report No: 69892. URL: https://openknowledge.worldbank.org/handle/10986/12889
93 World Bank (2010). Making Transport Climate Resilient. Country Report: Ethiopia. Report No: 69892. URL: https://openknowledge.worldbank.org/handle/10986/12889
94 Federal Democratic Republic of Ethiopia (2016). Nationally Determined Contributions of the Federal Democratic Republic of Ethiopia. URL: https://www4.unfccc.int/sites/ndcstaging/PublishedDocuments/Ethiopia%20First/INDC-Ethiopia-100615.pdf
95 World Bank (2010). Making Transport Climate Resilient. Country Report: Ethiopia. Report No: 69892. URL: https://openknowledge.worldbank.org/handle/10986/12889
96 Federal Democratic Republic of Ethiopia (2011). Ethiopia’s Climate-Resilient Green Economy, Green Economy Strategy. URL: https://www.undp.org/content/dam/ethiopia/docs/Ethiopia%20CRGE.pdf
97 CGIAR (2018). Climate Resilient Green Economy Strategy. Sector-wise GTP II Implementation Monitoring Checklist. CGIAR Research Program on Climate Change, Agriculture and Food Security(CCAFS), East Africa. URL: https://ccafs.cgiar.org/publications/climate-resilient-green-economy-strategy#.XGH6Ac9KhBw
23CLIMATE RISK COUNTRY PROFILE: ETHIOPIA
Institutional Framework for AdaptationEthiopia’s Commission of Environment, Forest and Climate Change and the Ministry of Finance and Economic
Cooperation, develop standardized guidance and provide ad-hoc, sector-specific support in regards to Ethiopia’s
climate change adaptation and resilience strategies. Efforts are led by the Climate Resilient Green Economy
(CGRE) Secretariat. The CGRE manages climate finance flows from international and domestic public sources
and channels funding to CRGE line ministries to implement the strategy. CRGE line ministries include the Ministry
of Agriculture and Natural Resources, Ministry of Industry, Ministry of Mines, Petroleum and Natural Gas, Ministry
of Transport, Ministry of Urban Development, Housing and Construction, and Ministry of Water, Irrigation and
Electricity.98
Policy Framework for AdaptationEthiopia submitted its Nationally-Determined Contributions to the UNFCCC in 2016, which provides the platform
for the country to integrate responsible environmental management and climate change adaptation strategies,
that also account for the country’s social and economic development targets, as set out in its Growth and
Transformation Plan I and II. The country submitted its Second National Communication to the UNFCCC
in 2015.These strategies focus on the preparation and strengthening of institutional frameworks for improved
management of climate change effects and to make available the necessary resources to support strategic
adaptation activities and to advance low emission and climate resilient development. The CGRE and strategy
aims to enhance various national policies, initiatives and sectoral programs to address climate change and food
security priorities.99
National Frameworks and Plans
• Updated Nationally-Determined Contribution (2020)
• Multi Sector Investment Plan for Climate Resilient Agriculture and Forest Development 2017–2030 (2017)
• Growth and Transformation Plan II (2016)
• Nationally-Determined Contributions (2016)
• Second National Communication (2015)
• Climate Resilient Green Economy Strategy (2011)
• Climate Change National Adaptation Program of Action (2007)
98 USAID (2016). Climate Change Risk Profile – Ethiopia. Fact Sheet. URL: https://www.climatelinks.org/sites/default/files/asset/document/2016%20CRM%20Factsheet%20-%20Ethiopia_use%20this.pdf
99 Ministry of Environment and Forest (2015). Ethiopia’s Second National Communication to the United Nations Framework Convention on Climate Change (UNFCCC). The Federal Democratic Republic of Ethiopia. URL: https://unfccc.int/resource/docs/natc/ethnc2.pdf
ADAPTATION
24CLIMATE RISK COUNTRY PROFILE: ETHIOPIA
Recommendations
Research Gaps• Gain a better understanding of the timing and magnitude of incidence of several important indicators of
climate change in the future, as well as the key vulnerabilities, development impacts, and possible adaptation
responses
• Widen the participation of the public, scientific institutions, women and local communities in planning and
management, accounting for approaches and methods of gender equity100
• Strengthen environmental monitoring capabilities for strengthened and more effective environmental
management
• Enhance Ethiopia’s adaptive capacity through continuing investment in weather stations and expanding the
country’s national hydro-meteorological monitoring system and improved networking for the measurement
of climate parameters101
• Strengthen the of technical capacity to integrate climate-smart agriculture and climate change risk management
into farmer’s and the wider agricultural sector102
• Improve the accuracy of the design parameters in predicting sedimentation and runoff for changing Ethiopian
landscape, land use change, and precipitation patterns103
• Support understanding of sustainable land management practices and the impact of soil erosion on watersheds.
Data and Information Gaps• Improve observational data through the addition of weather stations and hydro-meteorological instrumentation
• Improve technical capacity to analyze hydro-meteorological data and project impacts across sectors
• Establish institutional capacity for providing timely early warning systems
• Development of early warning systems about dangerous hydrometeorological phenomena and climate risk
management
Institutional Gaps• Ensure the integration of National Environmental Strategy goals are developed within sectoral and regional plans
• Implement cross-sectoral climate-smart solutions at national and subnational levels104
• Integrate climate change concerns into relevant policies and planning processes at the state and national levels
100 Ministry of Environment and Forest (2015). Ethiopia’s Second National Communication to the United Nations Framework Convention on Climate Change (UNFCCC). The Federal Democratic Republic of Ethiopia. URL: https://unfccc.int/resource/docs/natc/ethnc2.pdf
101 UNDP (2011). Ethiopia’s Climate Resilient Green Economy. URL: https://www.undp.org/content/dam/ethiopia/docs/ Ethiopia%20CRGE.pdf
102 National Planning Commission (2016). Growth and Transformation Plan II, (2015/16-2019/20). URL: https://europa.eu/capacity4dev/resilience_ethiopia/document/growth-and-transformation-plan-ii-gtp-ii-201516-201920
103 World Bank (2010). Making Transport Climate Resilient. Country Report: Ethiopia. Report No: 69892. URL: https://openknowledge.worldbank.org/handle/10986/12889
104 Ministry of Environment and Forest (2015). Ethiopia’s Second National Communication to the United Nations Framework Convention on Climate Change (UNFCCC). The Federal Democratic Republic of Ethiopia. URL: https://unfccc.int/resource/docs/natc/ethnc2.pdf