Embed Size (px)
Citation preview
EthiopiaAssessment of Food Security and Nutrition Situation
Bart MintenIFPRI Country Program Leader in Ethiopia
Roundtable DiscussionMarch 28, 2016 | Addis Ababa
Ethiopia Roundtable Discussion, March 2016
0
10
20
30
40
50
0
10
20
30
40
50
60
70
80
199
0-9
2
199
2-9
4
199
4-9
6
199
6-9
8
199
8-0
0
200
0-0
2
200
2-0
4
200
4-0
6
200
6-0
8
200
8-1
0
201
0-1
2
20
12
-14
*
20
14
-16
*
Mill
ion
s
Perc
ent
Prevalence (%)Number of undernourished (Millions)
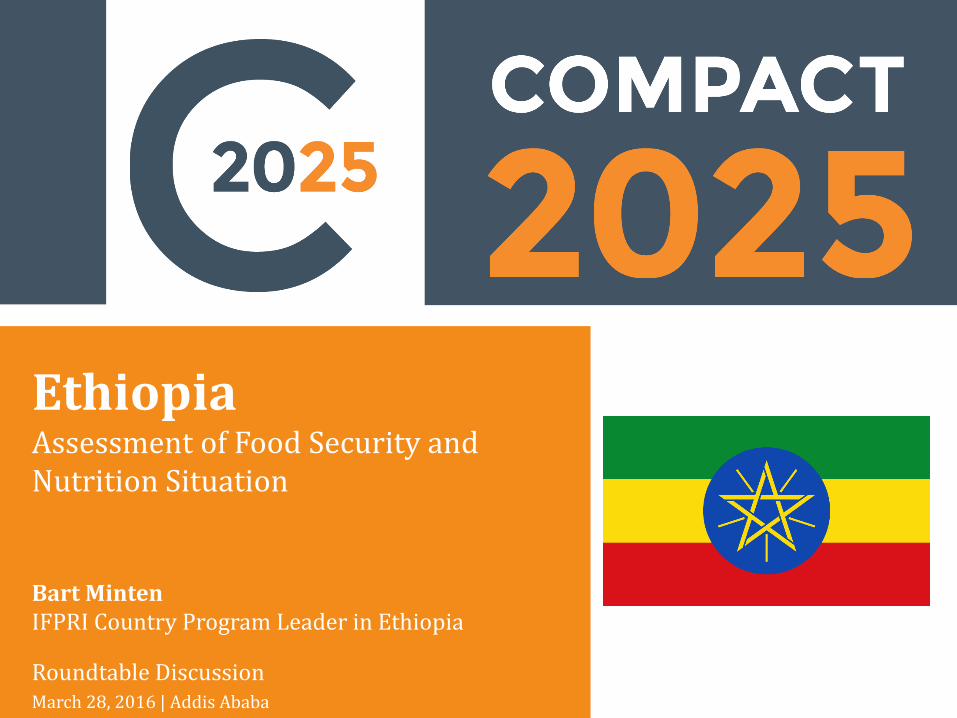
Progress in reducing hunger, but more to
be done
• Hunger fell from 75% to 32% (1990-2015)
– Yet no. of hungry people only fell from 37 to 32 million in same period
• Ethiopia food deficit: 236 kcal/day
• Poor spend 55% of income on food
Undernourishment in Ethiopia
Sources: FAO 2015, Hassen et al. forthcoming
2
Ethiopia Roundtable Discussion, March 2016
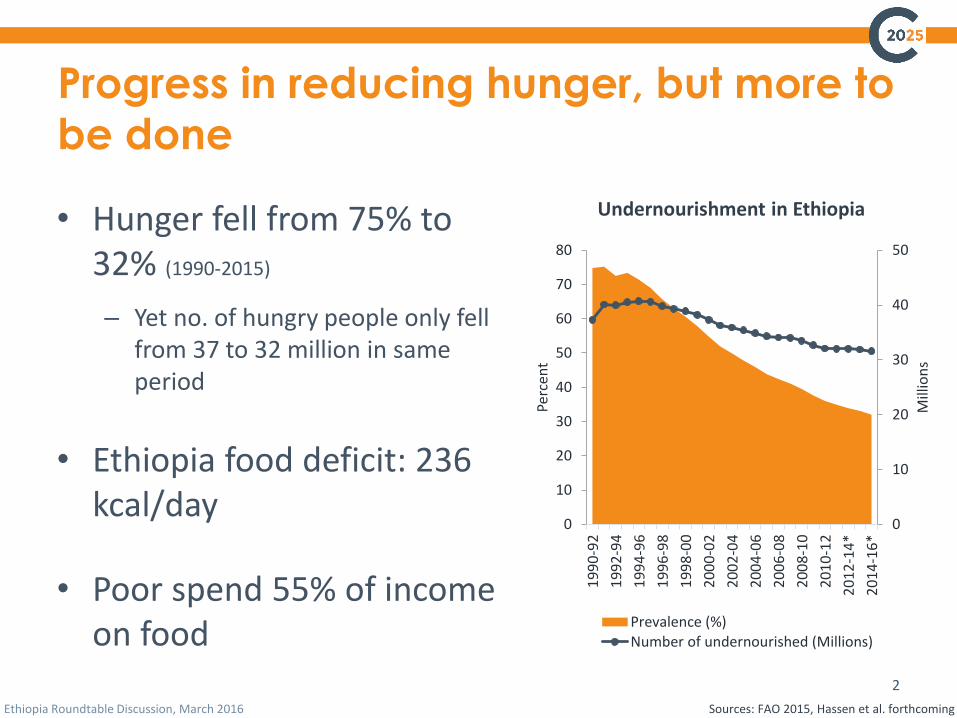
Poverty persists despite strong economic
growth
• Low income country with impressive GDP growth
– 9.6% average growth from 2000-2014
• Poverty greatly reduced, but 34% live below $1.90/day (2010)
• Majority of poor live in rural areas, where poverty and hunger are highest
GDP per capita (ppp, current international dollar) and poverty headcount ratio at $1.90 a day (2011 ppp, % of
population)
3
67.9
55.3
36.3 33.5
0
20
40
60
80
100
0
200
400
600
800
1000
1200
1400
1600
19
90
19
92
19
94
19
96
19
98
20
00
20
02
20
04
20
06
20
08
20
10
20
12
20
14
Pove
rty
hea
dco
un
t ra
tio
(%
)
GD
P (
PP
P)
per
cap
ita
Co
nst
ant
20
11
Intl
$
GDP per capita
Poverty headcount ratio
Ethiopia Roundtable Discussion, March 2016
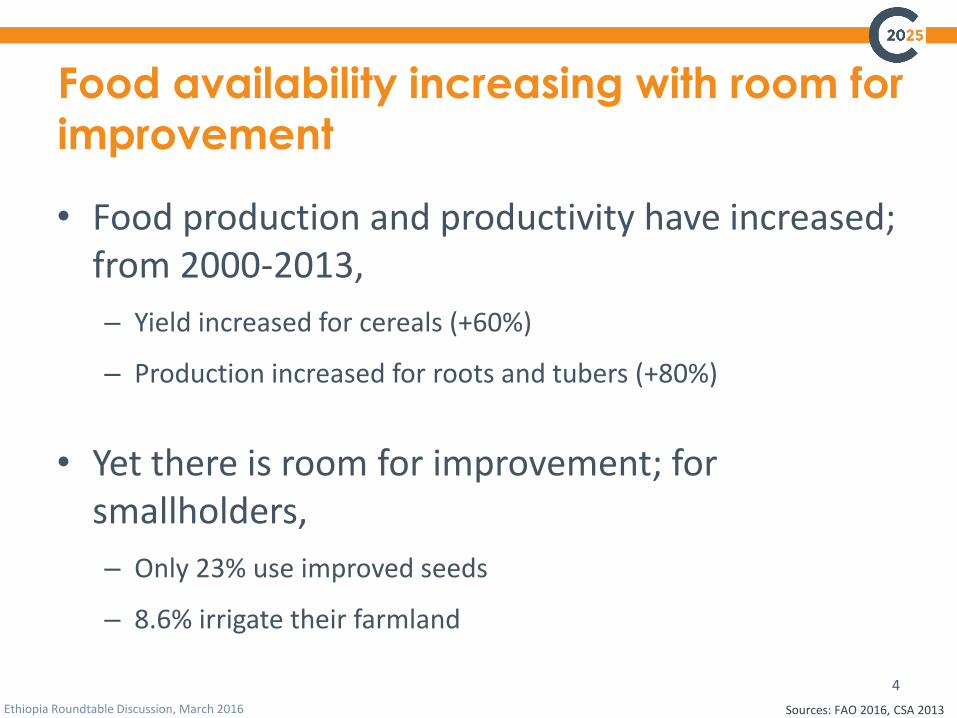
Food availability increasing with room for
improvement
• Food production and productivity have increased; from 2000-2013,
– Yield increased for cereals (+60%)
– Production increased for roots and tubers (+80%)
• Yet there is room for improvement; for smallholders,
– Only 23% use improved seeds
– 8.6% irrigate their farmland
Sources: FAO 2016, CSA 2013
4
Ethiopia Roundtable Discussion, March 2016
67
57
51
4440
1992 2000 2005 2011 2014
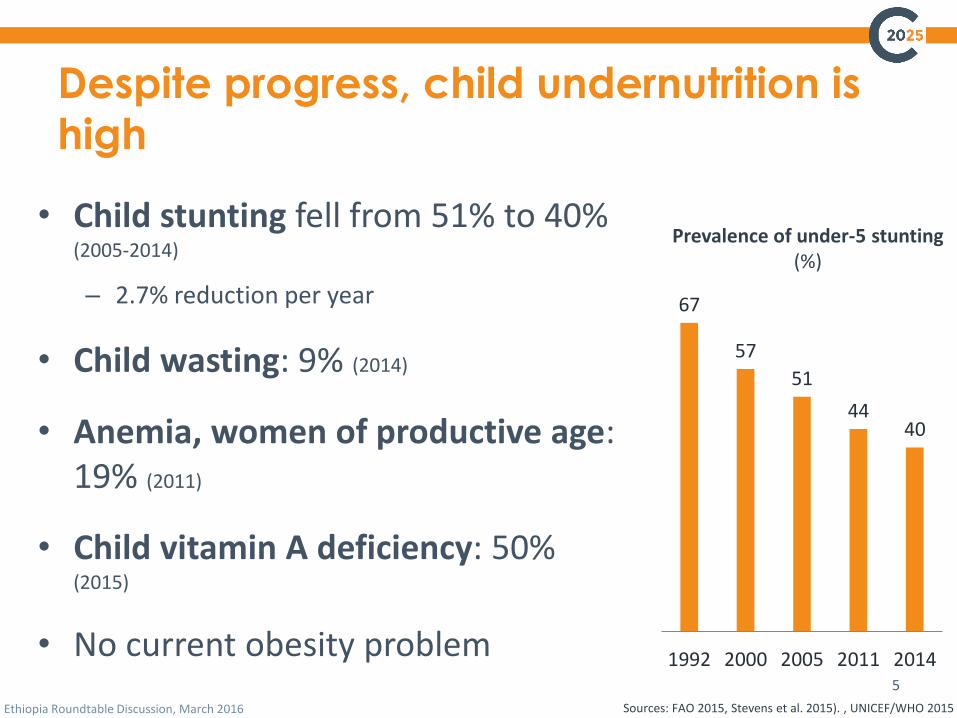
Despite progress, child undernutrition is
high
• Child stunting fell from 51% to 40% (2005-2014)
– 2.7% reduction per year
• Child wasting: 9% (2014)
• Anemia, women of productive age: 19% (2011)
• Child vitamin A deficiency: 50% (2015)
• No current obesity problem
Prevalence of under-5 stunting (%)
Sources: FAO 2015, Stevens et al. 2015). , UNICEF/WHO 2015
5
Ethiopia Roundtable Discussion, March 2016
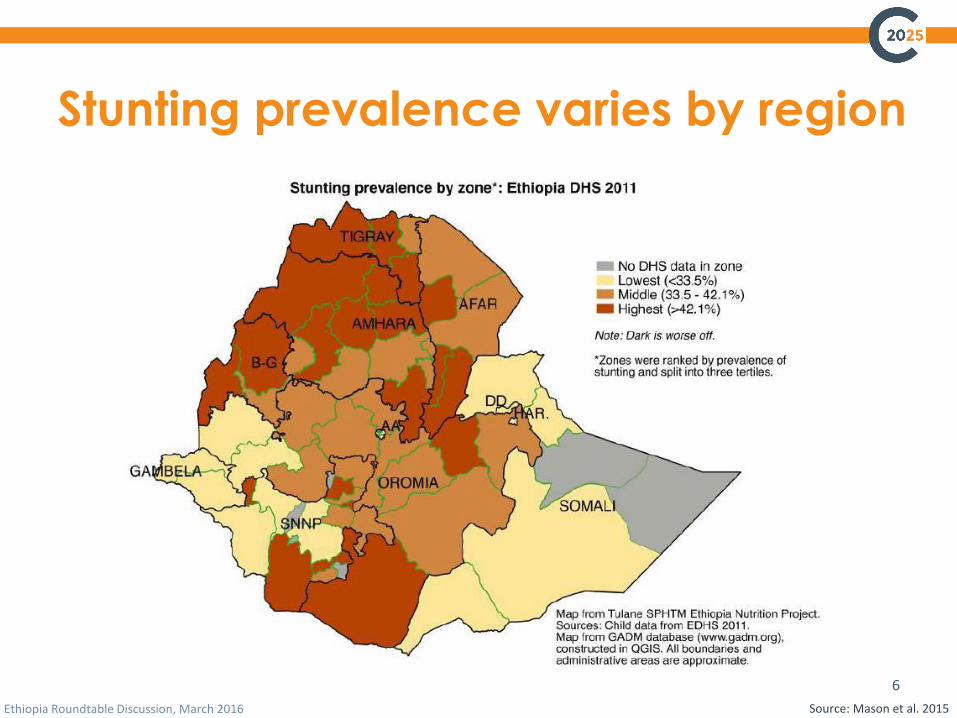
Stunting prevalence varies by region
Source: Mason et al. 2015
6
Ethiopia Roundtable Discussion, March 2016
Selected determinates of nutrition
• Diet diversity: Ethiopia average proportion of calories from non-staple crops from 1991 to 2011 : 25% (Africa average: 37%)
• Water, Sanitation, & Hygiene (WASH): Increased coverage from 1990 to 2013
– Safe drinking water: 13% to 57%
– Improved sanitation coverage: 7% to 42%
• Women empowerment is shown to improve nutritional outcomes in Ethiopia
– Ranks 126 of 146 countries in the WEF Global Gender Gap Index (2015)
Source: WHO/UNICEF JMP 2015, Yimer and Tadesse 2015, WEF 2015
7
Ethiopia Roundtable Discussion, March 2016
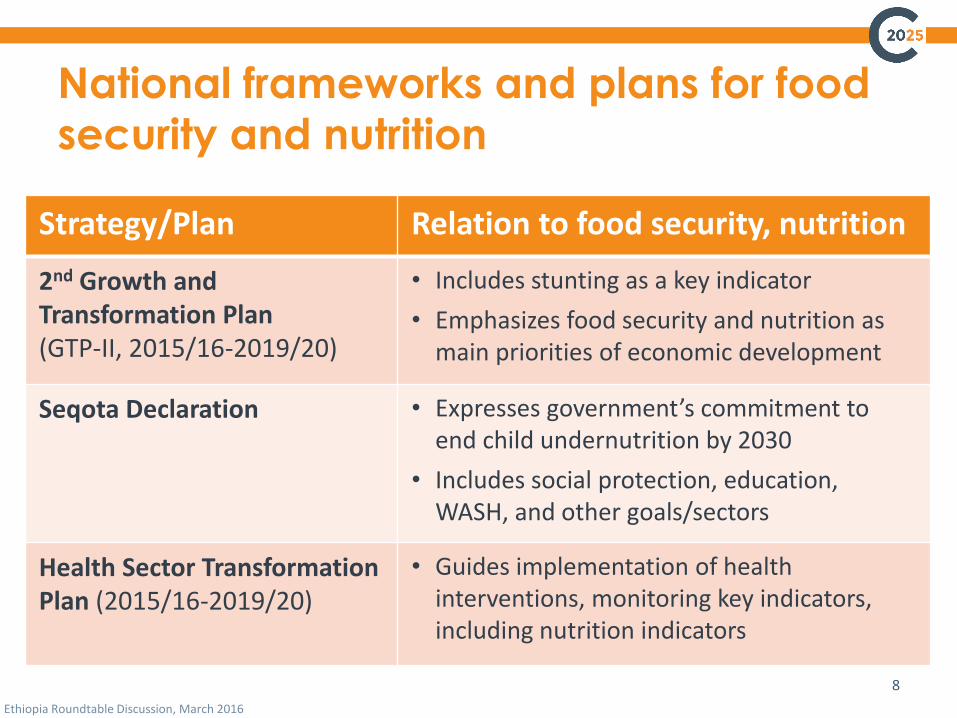
National frameworks and plans for food
security and nutrition
Strategy/Plan Relation to food security, nutrition
2nd Growth and Transformation Plan (GTP-II, 2015/16-2019/20)
• Includes stunting as a key indicator
• Emphasizes food security and nutrition as main priorities of economic development
Seqota Declaration • Expresses government’s commitment to end child undernutrition by 2030
• Includes social protection, education, WASH, and other goals/sectors
Health Sector Transformation Plan (2015/16-2019/20)
• Guides implementation of health interventions, monitoring key indicators, including nutrition indicators
8
Ethiopia Roundtable Discussion, March 2016
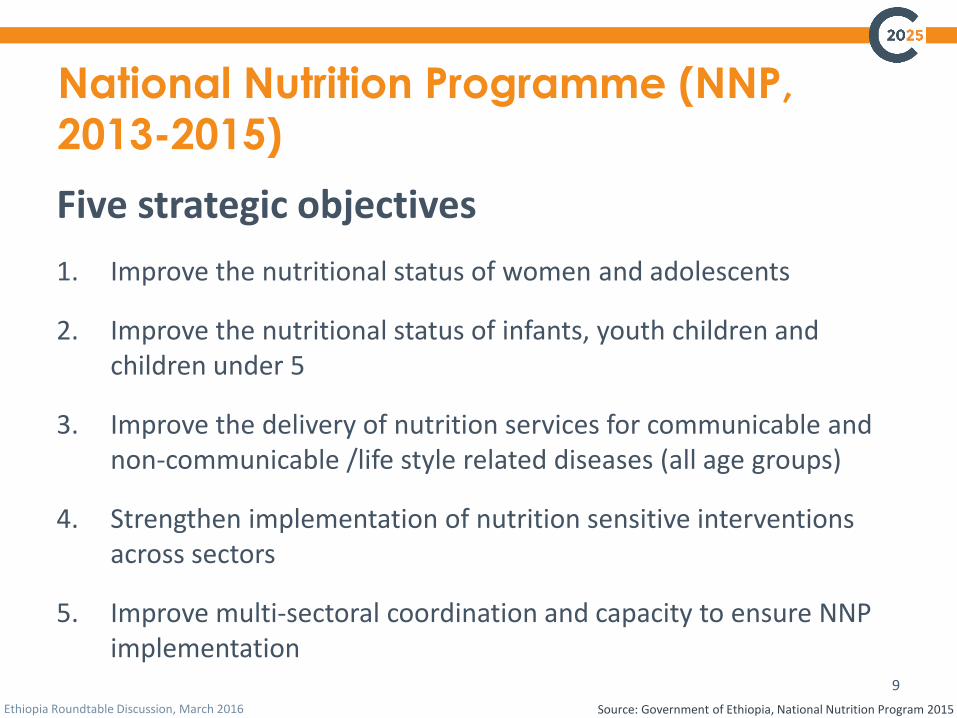
National Nutrition Programme (NNP,
2013-2015)
Five strategic objectives
1. Improve the nutritional status of women and adolescents
2. Improve the nutritional status of infants, youth children and children under 5
3. Improve the delivery of nutrition services for communicable and non-communicable /life style related diseases (all age groups)
4. Strengthen implementation of nutrition sensitive interventions across sectors
5. Improve multi-sectoral coordination and capacity to ensure NNP implementation
9
Source: Government of Ethiopia, National Nutrition Program 2015
Ethiopia Roundtable Discussion, March 2016
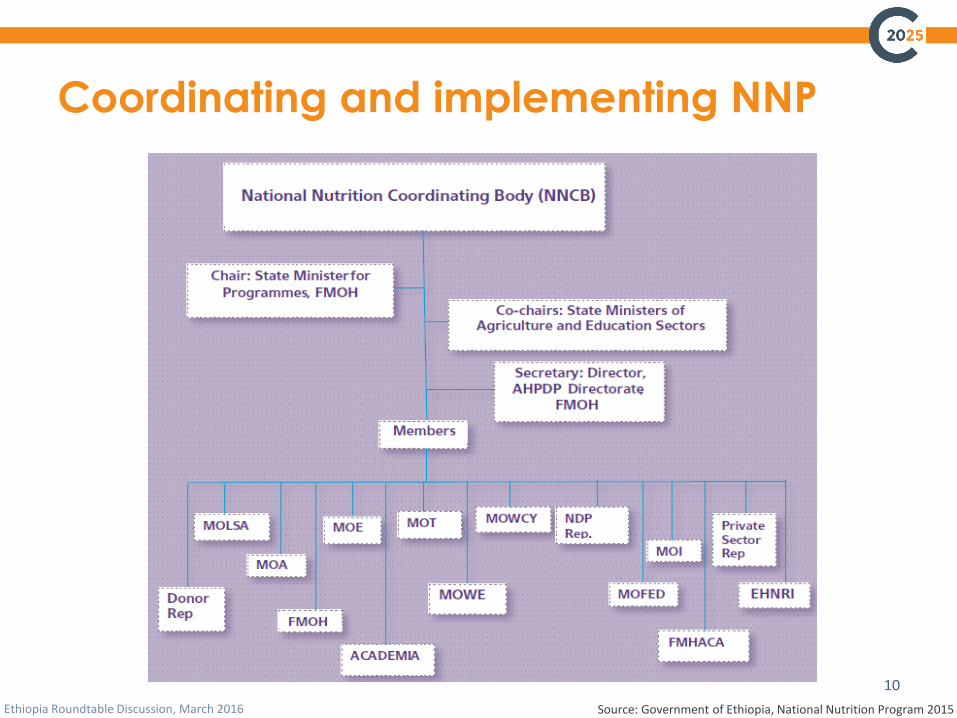
Coordinating and implementing NNP
10
Source: Government of Ethiopia, National Nutrition Program 2015
Ethiopia Roundtable Discussion, March 2016
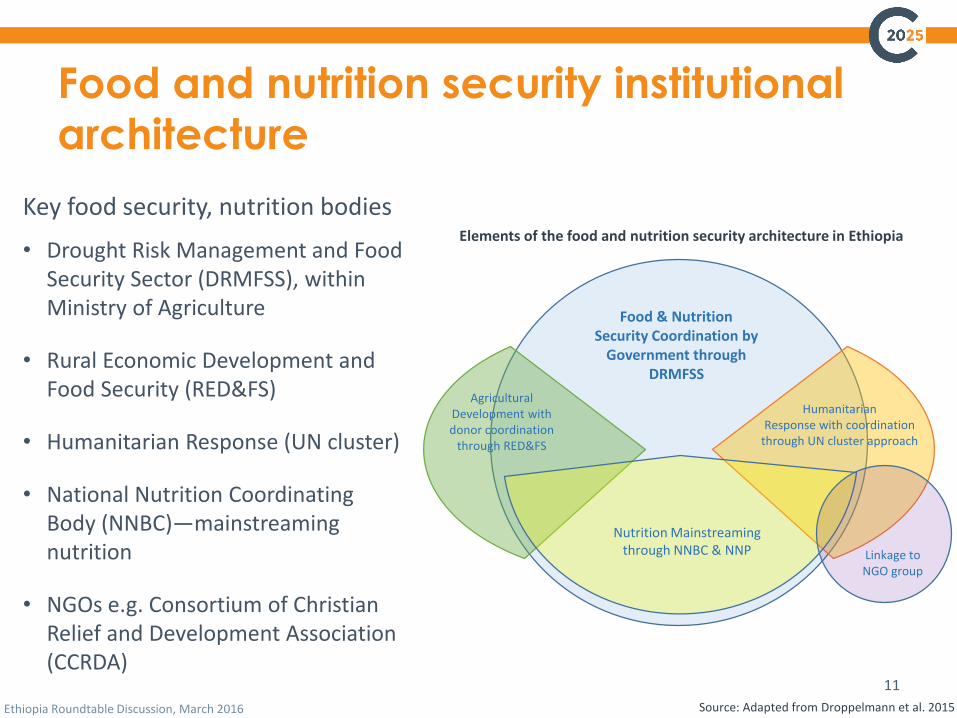
Food and nutrition security institutional
architecture
Source: Adapted from Droppelmann et al. 2015
11
Food & Nutrition Security Coordination by
Government through DRMFSS
HumanitarianResponse with coordination
through UN cluster approach
Agricultural Development with donor coordination
through RED&FS
Nutrition Mainstreaming through NNBC & NNP Linkage to
NGO group
Elements of the food and nutrition security architecture in Ethiopia
Key food security, nutrition bodies
• Drought Risk Management and Food Security Sector (DRMFSS), within Ministry of Agriculture
• Rural Economic Development and Food Security (RED&FS)
• Humanitarian Response (UN cluster)
• National Nutrition Coordinating Body (NNBC)—mainstreaming nutrition
• NGOs e.g. Consortium of Christian Relief and Development Association (CCRDA)
Ethiopia Roundtable Discussion, March 2016
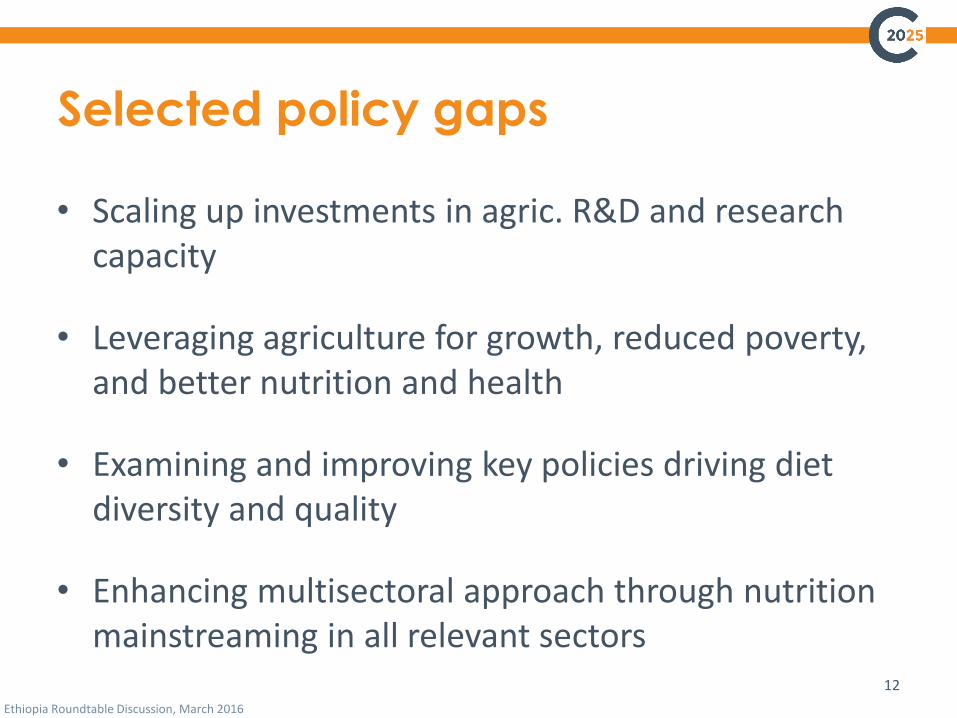
Selected policy gaps
• Scaling up investments in agric. R&D and research capacity
• Leveraging agriculture for growth, reduced poverty, and better nutrition and health
• Examining and improving key policies driving diet diversity and quality
• Enhancing multisectoral approach through nutrition mainstreaming in all relevant sectors
12
Ethiopia Roundtable Discussion, March 2016
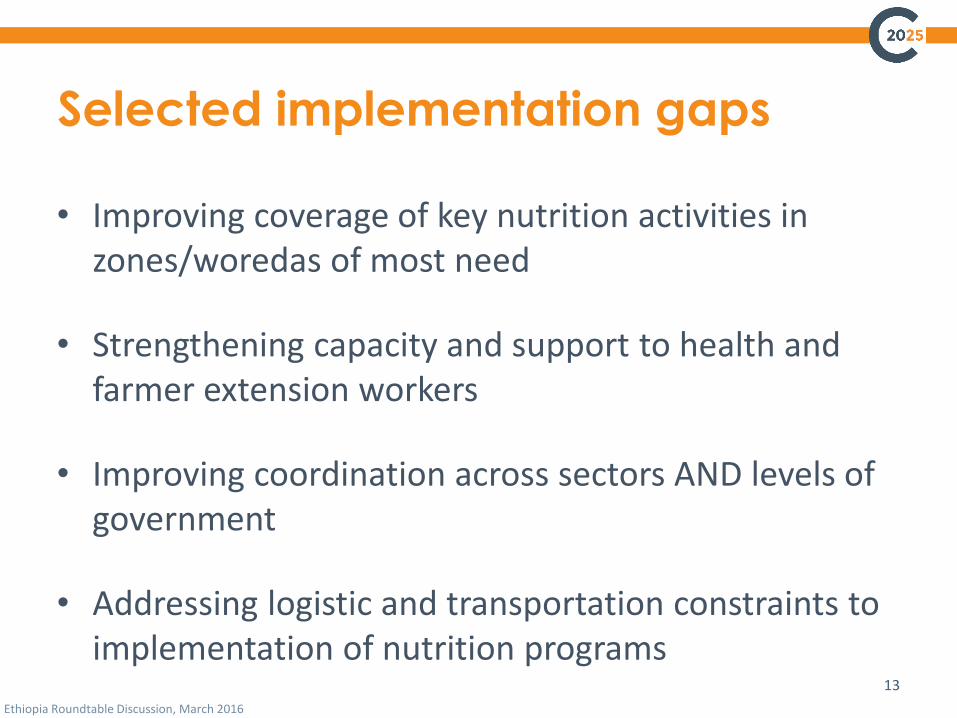
Selected implementation gaps
• Improving coverage of key nutrition activities in zones/woredas of most need
• Strengthening capacity and support to health and farmer extension workers
• Improving coordination across sectors AND levels of government
• Addressing logistic and transportation constraints to implementation of nutrition programs
13
Ethiopia Roundtable Discussion, March 2016
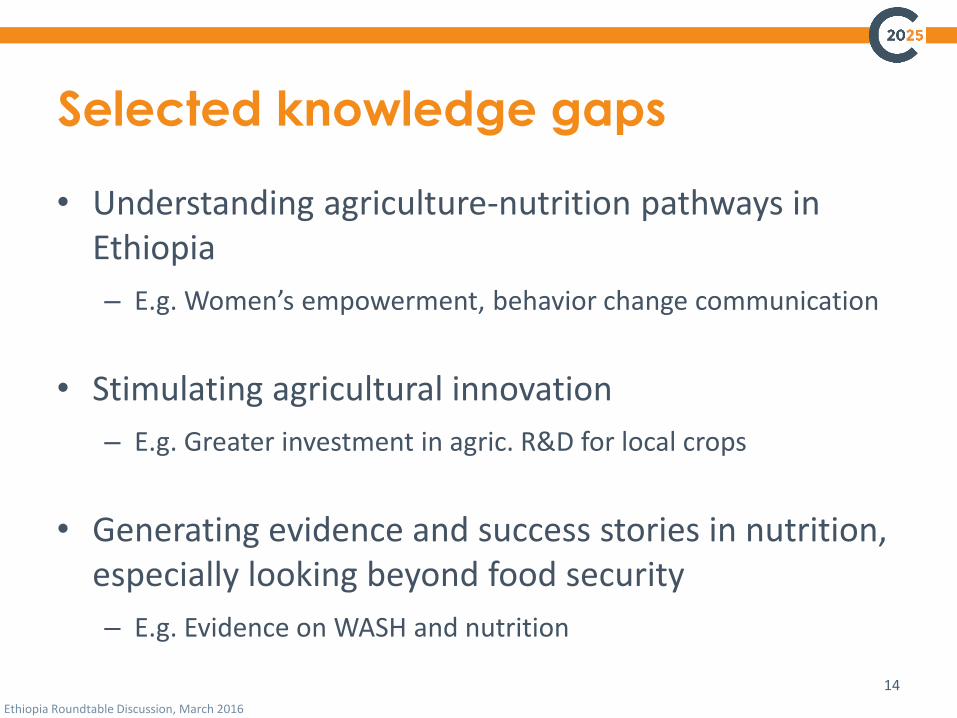
Selected knowledge gaps
• Understanding agriculture-nutrition pathways in Ethiopia
– E.g. Women’s empowerment, behavior change communication
• Stimulating agricultural innovation
– E.g. Greater investment in agric. R&D for local crops
• Generating evidence and success stories in nutrition, especially looking beyond food security
– E.g. Evidence on WASH and nutrition
14
Ethiopia Roundtable Discussion, March 2016
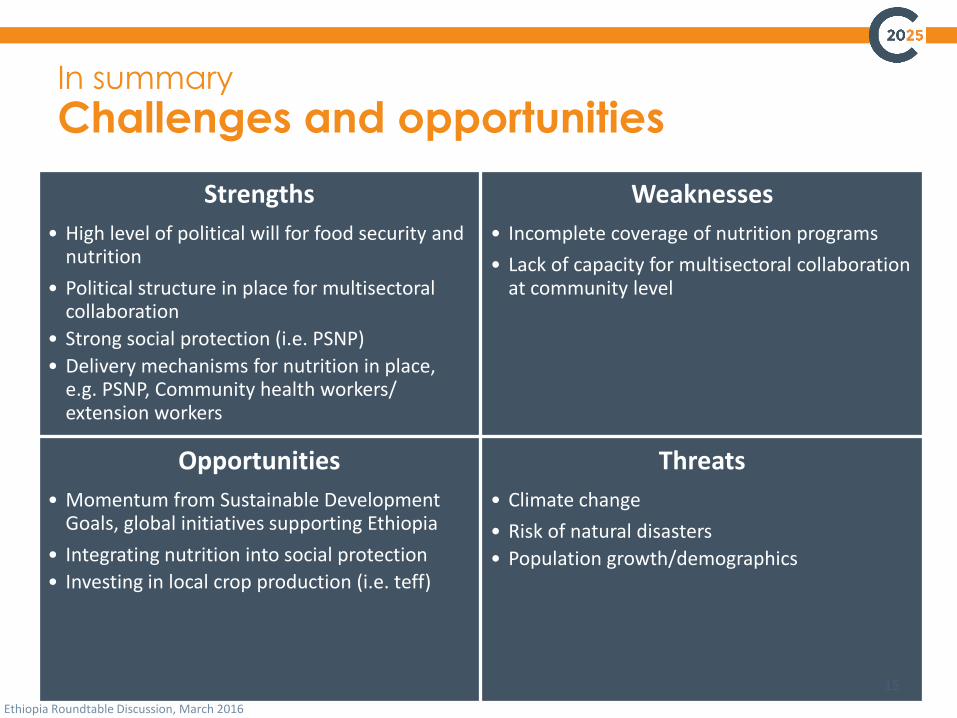
In summary
Challenges and opportunities
Strengths
• High level of political will for food security and nutrition
• Political structure in place for multisectoral collaboration
• Strong social protection (i.e. PSNP)
• Delivery mechanisms for nutrition in place, e.g. PSNP, Community health workers/ extension workers
Weaknesses
• Incomplete coverage of nutrition programs
• Lack of capacity for multisectoral collaboration at community level
Opportunities
• Momentum from Sustainable Development Goals, global initiatives supporting Ethiopia
• Integrating nutrition into social protection
• Investing in local crop production (i.e. teff)
Threats
• Climate change
• Risk of natural disasters
• Population growth/demographics
15