Embed Size (px)
Citation preview
Product Evaluation Guide
N E T W O R K S U P E R V I S I O N
EtherScope™ Series IINetwork Assistant
EtherScope™ Series IINetwork Assistant
EtherScope™ Series IINetwork Assistant
Product Evaluation Guide
Contents page
LAN Analysis
LAN connection . . . . . . . . . . . . . . . . . . . . . . . . . . . . . . . . . . . . . . . . . . . . . . . . . . . . .1
Front page . . . . . . . . . . . . . . . . . . . . . . . . . . . . . . . . . . . . . . . . . . . . . . . . . . . . . . . . .2
Configure 802 .1X security . . . . . . . . . . . . . . . . . . . . . . . . . . . . . . . . . . . . . . . . . . . .3
Configure an IP address . . . . . . . . . . . . . . . . . . . . . . . . . . . . . . . . . . . . . . . . . . . . . .4
Set your Community Strings . . . . . . . . . . . . . . . . . . . . . . . . . . . . . . . . . . . . . . . . . . .5
Find out who and what is on your network . . . . . . . . . . . . . . . . . . . . . . . . . . . . . .6
Find out who is using your bandwidth . . . . . . . . . . . . . . . . . . . . . . . . . . . . . . . . . .7
Find device and network configuration problems . . . . . . . . . . . . . . . . . . . . . . . . .8
How are your switches performing? . . . . . . . . . . . . . . . . . . . . . . . . . . . . . . . . . . . .9
What about your VLAN configurations? . . . . . . . . . . . . . . . . . . . . . . . . . . . . . . . . 13
How is your network performing? . . . . . . . . . . . . . . . . . . . . . . . . . . . . . . . . . . . . 14
How good is your network documentation? . . . . . . . . . . . . . . . . . . . . . . . . . . . . 16
Finally, discover many more features on your own . . . . . . . . . . . . . . . . . . . . . . . 17
Wireless LAN Analysis
Front page . . . . . . . . . . . . . . . . . . . . . . . . . . . . . . . . . . . . . . . . . . . . . . . . . . . . . . . . 18
Configure EtherScope for your network . . . . . . . . . . . . . . . . . . . . . . . . . . . . . . . . 19
Find active networks . . . . . . . . . . . . . . . . . . . . . . . . . . . . . . . . . . . . . . . . . . . . . . . . 20
Discover who is using your WLAN . . . . . . . . . . . . . . . . . . . . . . . . . . . . . . . . . . . . . 22
How is your network performing? . . . . . . . . . . . . . . . . . . . . . . . . . . . . . . . . . . . . 23
Identify and locate unauthorized “rogue” devices . . . . . . . . . . . . . . . . . . . . . . . 25
Resolve login issues . . . . . . . . . . . . . . . . . . . . . . . . . . . . . . . . . . . . . . . . . . . . . . . . . 28
Product Evaluation Guide 1
N E T W O R K S U P E R V I S I O N
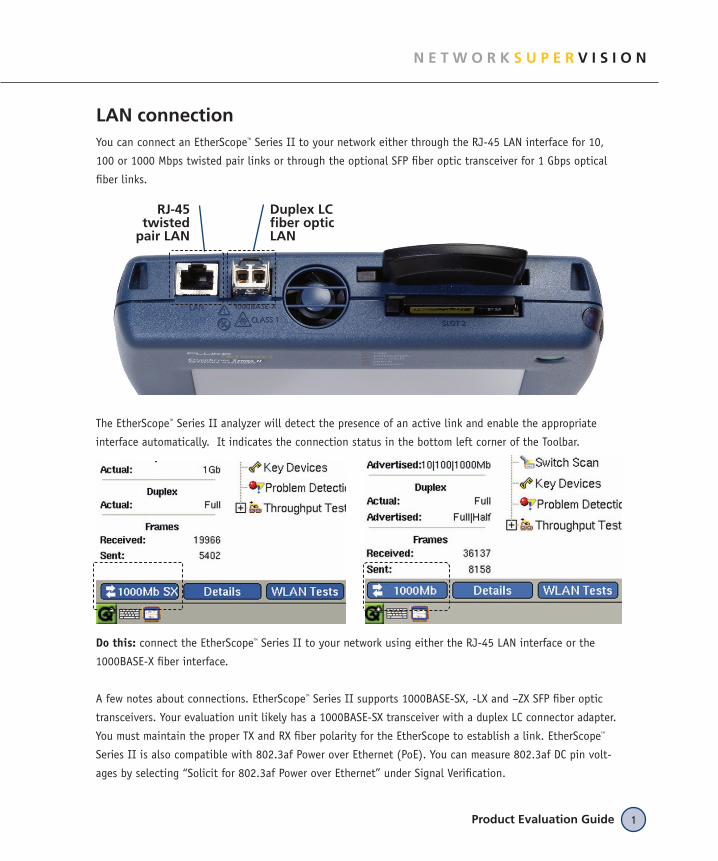
LAN connectionYou can connect an EtherScopeTM Series II to your network either through the RJ-45 LAN interface for 10,
100 or 1000 Mbps twisted pair links or through the optional SFP fiber optic transceiver for 1 Gbps optical
fiber links.
The EtherScopeTM Series II analyzer will detect the presence of an active link and enable the appropriate
interface automatically. It indicates the connection status in the bottom left corner of the Toolbar.
Do this: connect the EtherScopeTM Series II to your network using either the RJ-45 LAN interface or the
1000BASE-X fiber interface.
A few notes about connections. EtherScopeTM Series II supports 1000BASE-SX, -LX and –ZX SFP fiber optic
transceivers. Your evaluation unit likely has a 1000BASE-SX transceiver with a duplex LC connector adapter.
You must maintain the proper TX and RX fiber polarity for the EtherScope to establish a link. EtherScopeTM
Series II is also compatible with 802.3af Power over Ethernet (PoE). You can measure 802.3af DC pin volt-
ages by selecting “Solicit for 802.3af Power over Ethernet” under Signal Verification.
RJ-45 twisted
pair LAN
Duplex LC fiber optic LAN
EtherScope™ Series II Network Assistant2
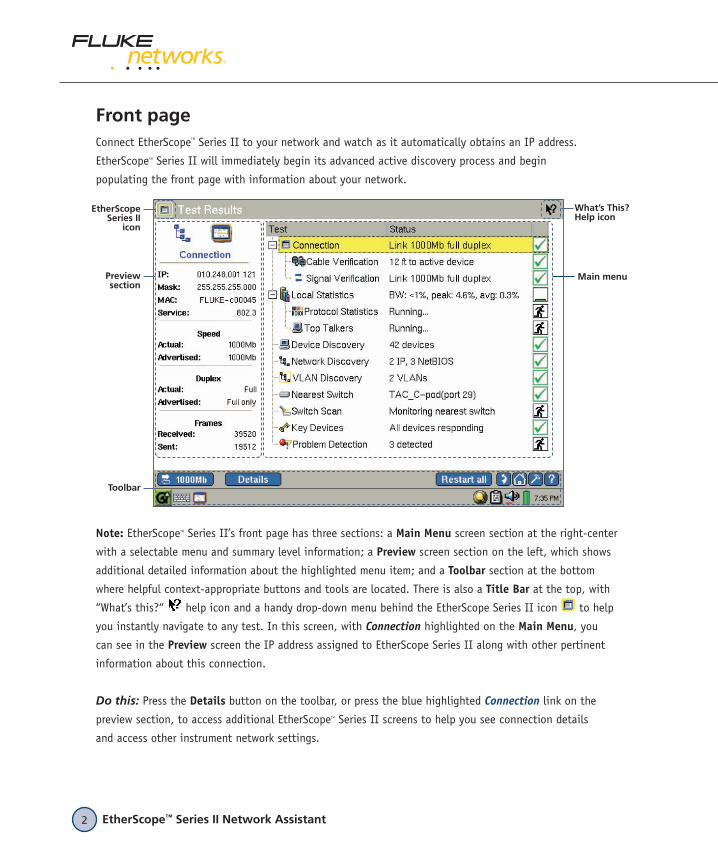
Front pageConnect EtherScopeTM Series II to your network and watch as it automatically obtains an IP address.
EtherScopeTM Series II will immediately begin its advanced active discovery process and begin
populating the front page with information about your network.
Note: EtherScopeTM Series II’s front page has three sections: a Main Menu screen section at the right-center
with a selectable menu and summary level information; a Preview screen section on the left, which shows
additional detailed information about the highlighted menu item; and a Toolbar section at the bottom
where helpful context-appropriate buttons and tools are located. There is also a Title Bar at the top, with
“What’s this?“ help icon and a handy drop-down menu behind the EtherScope Series II icon to help
you instantly navigate to any test. In this screen, with Connection highlighted on the Main Menu, you
can see in the Preview screen the IP address assigned to EtherScope Series II along with other pertinent
information about this connection.
Do this: Press the Details button on the toolbar, or press the blue highlighted Connection link on the
preview section, to access additional EtherScopeTM Series II screens to help you see connection details
and access other instrument network settings.
Preview section
Main menu
Toolbar
What’s This? Help icon
EtherScope Series II
icon
Product Evaluation Guide 3
N E T W O R K S U P E R V I S I O N
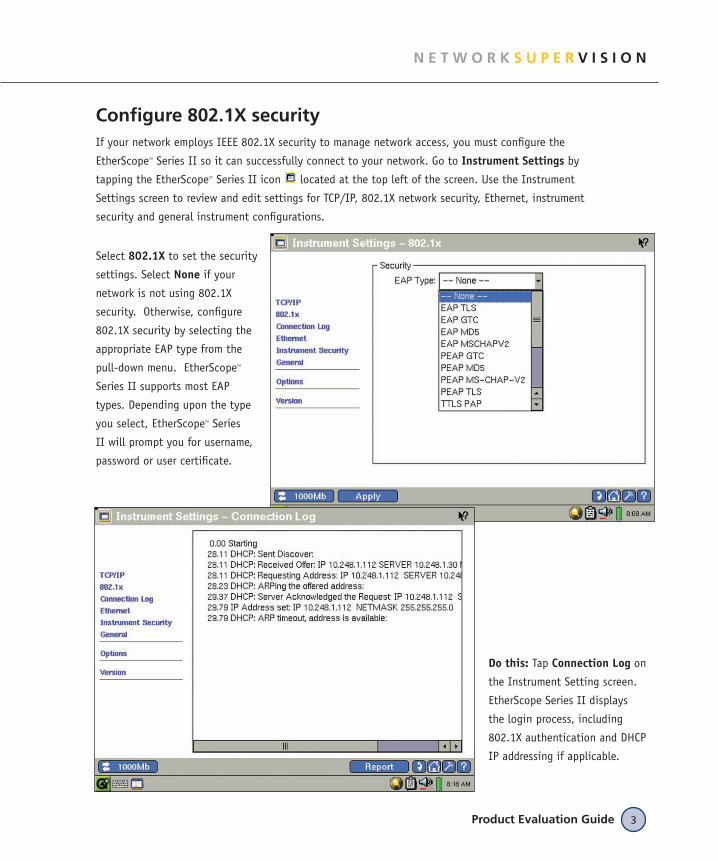
Configure 802.1X securityIf your network employs IEEE 802.1X security to manage network access, you must configure the
EtherScopeTM Series II so it can successfully connect to your network. Go to Instrument Settings by
tapping the EtherScopeTM Series II icon located at the top left of the screen. Use the Instrument
Settings screen to review and edit settings for TCP/IP, 802.1X network security, Ethernet, instrument
security and general instrument configurations.
Do this: Tap Connection Log on
the Instrument Setting screen.
EtherScope Series II displays
the login process, including
802.1X authentication and DHCP
IP addressing if applicable.
Select 802.1X to set the security
settings. Select None if your
network is not using 802.1X
security. Otherwise, configure
802.1X security by selecting the
appropriate EAP type from the
pull-down menu. EtherScopeTM
Series II supports most EAP
types. Depending upon the type
you select, EtherScopeTM Series
II will prompt you for username,
password or user certificate.
EtherScope™ Series II Network Assistant4
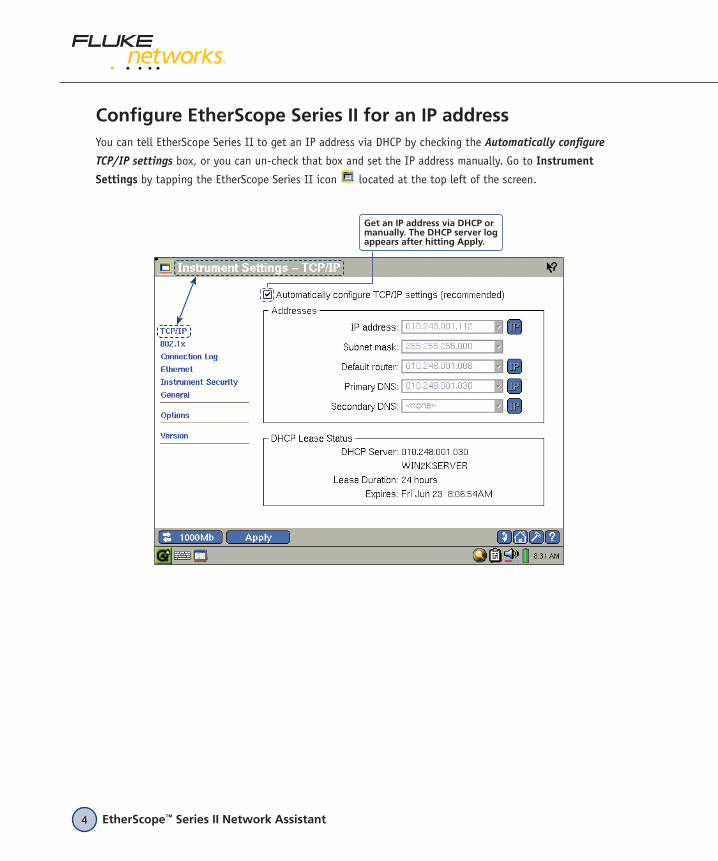
Configure EtherScope Series II for an IP addressYou can tell EtherScope Series II to get an IP address via DHCP by checking the Automatically configure
TCP/IP settings box, or you can un-check that box and set the IP address manually. Go to Instrument
Settings by tapping the EtherScope Series II icon located at the top left of the screen.
Get an IP address via DHCP or manually. The DHCP server log appears after hitting Apply.
Product Evaluation Guide 5
N E T W O R K S U P E R V I S I O N
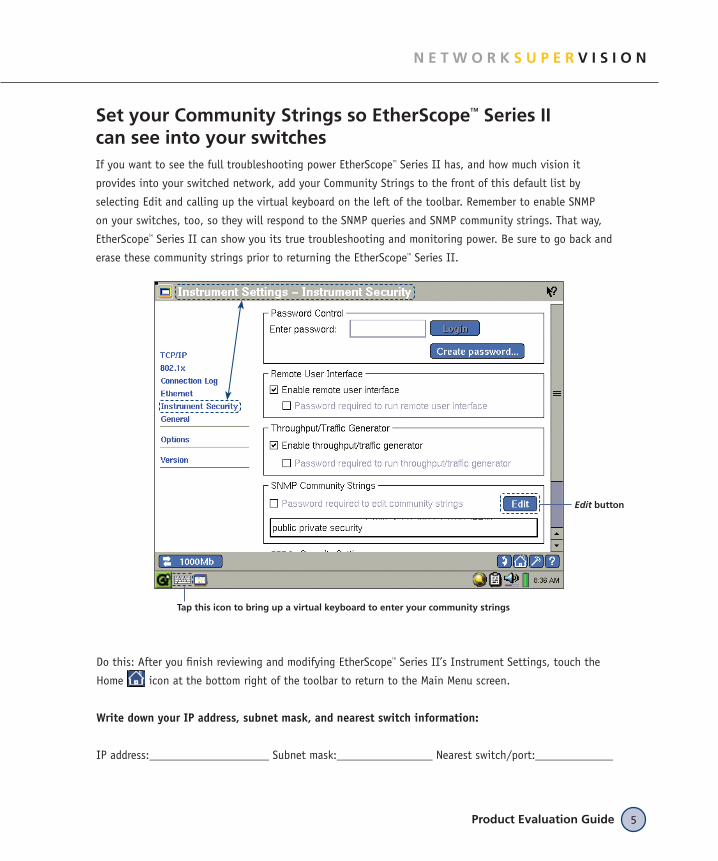
Set your Community Strings so EtherScopeTM Series II can see into your switchesIf you want to see the full troubleshooting power EtherScopeTM Series II has, and how much vision it
provides into your switched network, add your Community Strings to the front of this default list by
selecting Edit and calling up the virtual keyboard on the left of the toolbar. Remember to enable SNMP
on your switches, too, so they will respond to the SNMP queries and SNMP community strings. That way,
EtherScopeTM Series II can show you its true troubleshooting and monitoring power. Be sure to go back and
erase these community strings prior to returning the EtherScopeTM Series II.
Do this: After you finish reviewing and modifying EtherScopeTM Series II’s Instrument Settings, touch the
Home icon at the bottom right of the toolbar to return to the Main Menu screen.
Write down your IP address, subnet mask, and nearest switch information:
IP address:____________________ Subnet mask:________________ Nearest switch/port:_____________
Edit button
Tap this icon to bring up a virtual keyboard to enter your community strings
EtherScope™ Series II Network Assistant6
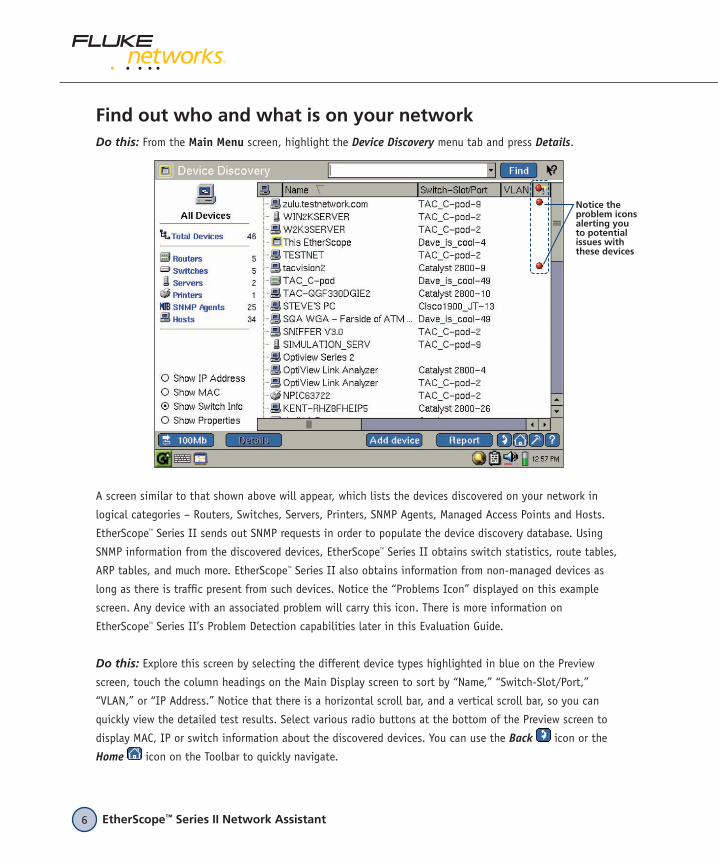
Find out who and what is on your networkDo this: From the Main Menu screen, highlight the Device Discovery menu tab and press Details.
A screen similar to that shown above will appear, which lists the devices discovered on your network in
logical categories – Routers, Switches, Servers, Printers, SNMP Agents, Managed Access Points and Hosts.
EtherScopeTM Series II sends out SNMP requests in order to populate the device discovery database. Using
SNMP information from the discovered devices, EtherScopeTM Series II obtains switch statistics, route tables,
ARP tables, and much more. EtherScopeTM Series II also obtains information from non-managed devices as
long as there is traffic present from such devices. Notice the “Problems Icon” displayed on this example
screen. Any device with an associated problem will carry this icon. There is more information on
EtherScopeTM Series II’s Problem Detection capabilities later in this Evaluation Guide.
Do this: Explore this screen by selecting the different device types highlighted in blue on the Preview
screen, touch the column headings on the Main Display screen to sort by “Name,” “Switch-Slot/Port,”
“VLAN,” or “IP Address.” Notice that there is a horizontal scroll bar, and a vertical scroll bar, so you can
quickly view the detailed test results. Select various radio buttons at the bottom of the Preview screen to
display MAC, IP or switch information about the discovered devices. You can use the Back icon or the
Home icon on the Toolbar to quickly navigate.
Notice the problem icons alerting you to potential issues with these devices
Product Evaluation Guide 7
N E T W O R K S U P E R V I S I O N
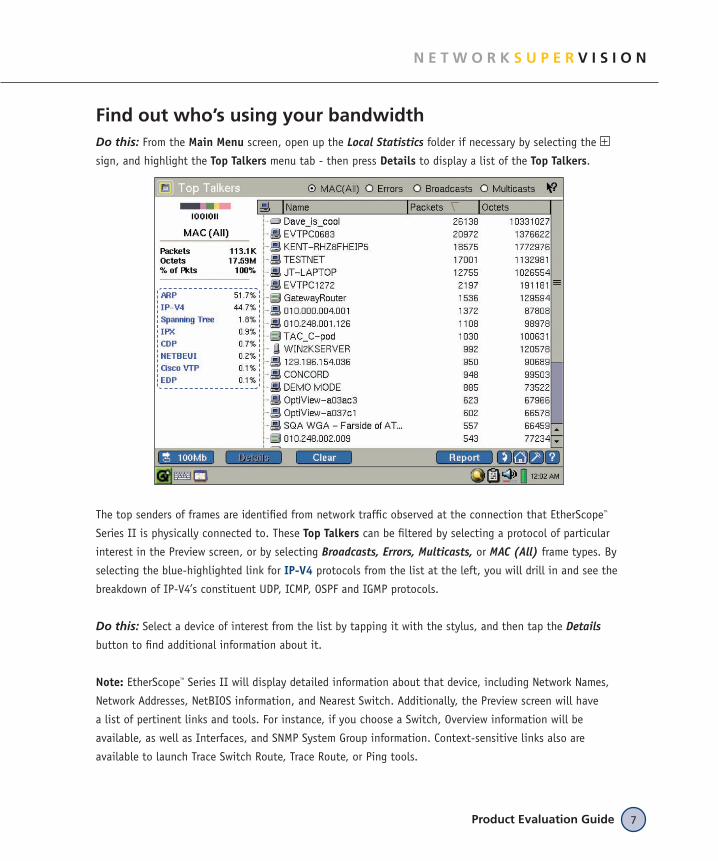
Find out who’s using your bandwidthDo this: From the Main Menu screen, open up the Local Statistics folder if necessary by selecting the
sign, and highlight the Top Talkers menu tab - then press Details to display a list of the Top Talkers.
The top senders of frames are identified from network traffic observed at the connection that EtherScopeTM
Series II is physically connected to. These Top Talkers can be filtered by selecting a protocol of particular
interest in the Preview screen, or by selecting Broadcasts, Errors, Multicasts, or MAC (All) frame types. By
selecting the blue-highlighted link for IP-V4 protocols from the list at the left, you will drill in and see the
breakdown of IP-V4’s constituent UDP, ICMP, OSPF and IGMP protocols.
Do this: Select a device of interest from the list by tapping it with the stylus, and then tap the Details
button to find additional information about it.
Note: EtherScopeTM Series II will display detailed information about that device, including Network Names,
Network Addresses, NetBIOS information, and Nearest Switch. Additionally, the Preview screen will have
a list of pertinent links and tools. For instance, if you choose a Switch, Overview information will be
available, as well as Interfaces, and SNMP System Group information. Context-sensitive links also are
available to launch Trace Switch Route, Trace Route, or Ping tools.
EtherScope™ Series II Network Assistant8
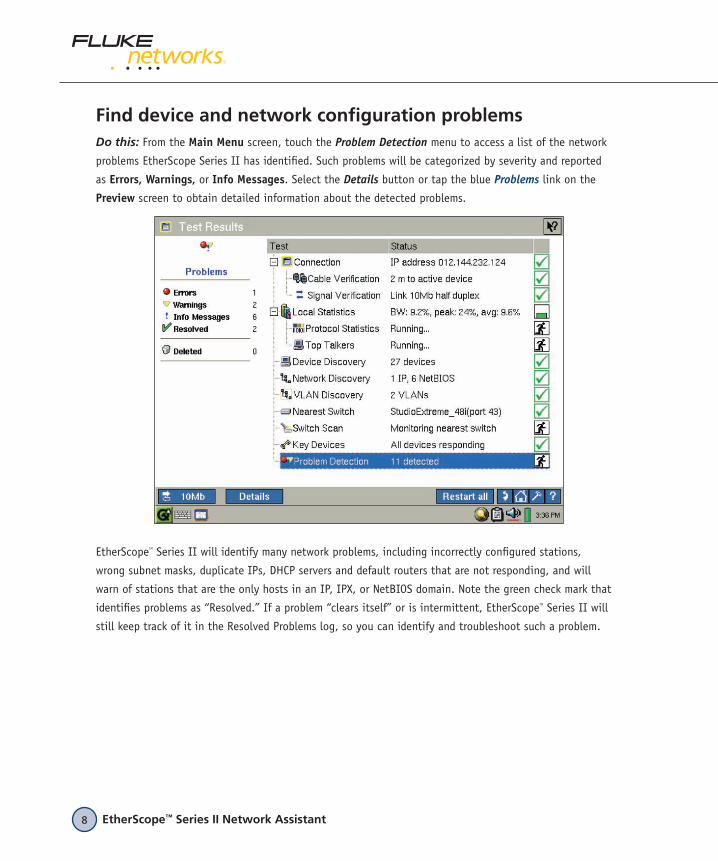
Find device and network configuration problemsDo this: From the Main Menu screen, touch the Problem Detection menu to access a list of the network
problems EtherScope Series II has identified. Such problems will be categorized by severity and reported
as Errors, Warnings, or Info Messages. Select the Details button or tap the blue Problems link on the
Preview screen to obtain detailed information about the detected problems.
EtherScopeTM Series II will identify many network problems, including incorrectly configured stations,
wrong subnet masks, duplicate IPs, DHCP servers and default routers that are not responding, and will
warn of stations that are the only hosts in an IP, IPX, or NetBIOS domain. Note the green check mark that
identifies problems as “Resolved.” If a problem “clears itself” or is intermittent, EtherScopeTM Series II will
still keep track of it in the Resolved Problems log, so you can identify and troubleshoot such a problem.
Product Evaluation Guide 9
N E T W O R K S U P E R V I S I O N
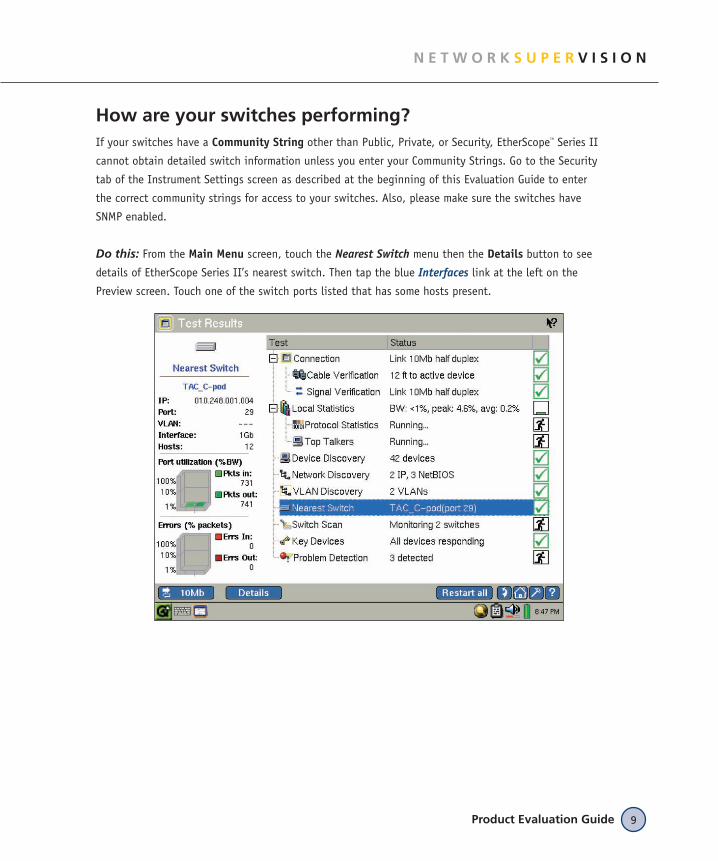
How are your switches performing?If your switches have a Community String other than Public, Private, or Security, EtherScopeTM Series II
cannot obtain detailed switch information unless you enter your Community Strings. Go to the Security
tab of the Instrument Settings screen as described at the beginning of this Evaluation Guide to enter
the correct community strings for access to your switches. Also, please make sure the switches have
SNMP enabled.
Do this: From the Main Menu screen, touch the Nearest Switch menu then the Details button to see
details of EtherScope Series II’s nearest switch. Then tap the blue Interfaces link at the left on the
Preview screen. Touch one of the switch ports listed that has some hosts present.
EtherScope™ Series II Network Assistant10
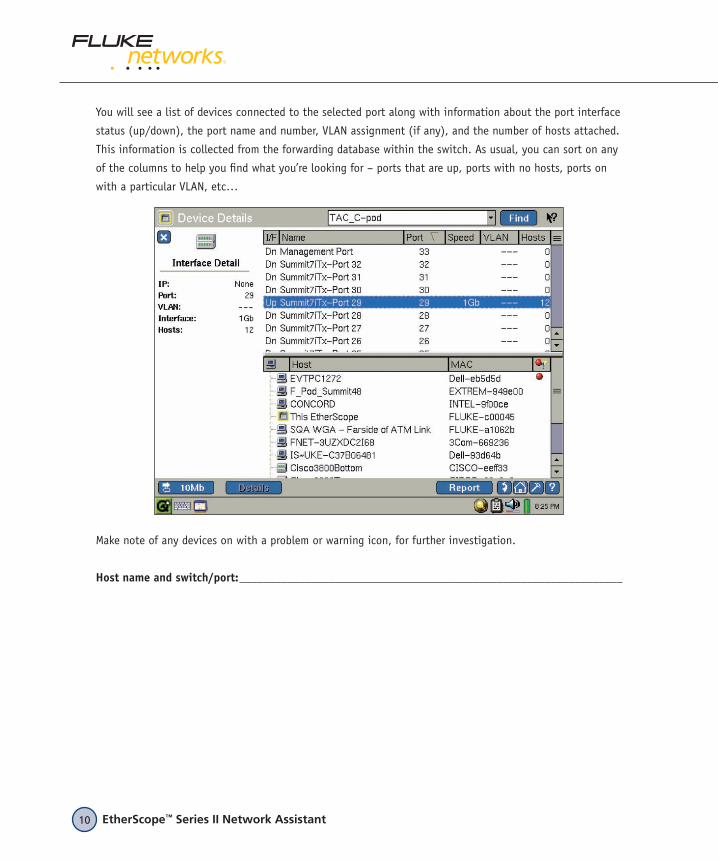
You will see a list of devices connected to the selected port along with information about the port interface
status (up/down), the port name and number, VLAN assignment (if any), and the number of hosts attached.
This information is collected from the forwarding database within the switch. As usual, you can sort on any
of the columns to help you find what you’re looking for – ports that are up, ports with no hosts, ports on
with a particular VLAN, etc…
Make note of any devices on with a problem or warning icon, for further investigation.
Host name and switch/port: ________________________________________________________________
Product Evaluation Guide 11
N E T W O R K S U P E R V I S I O N
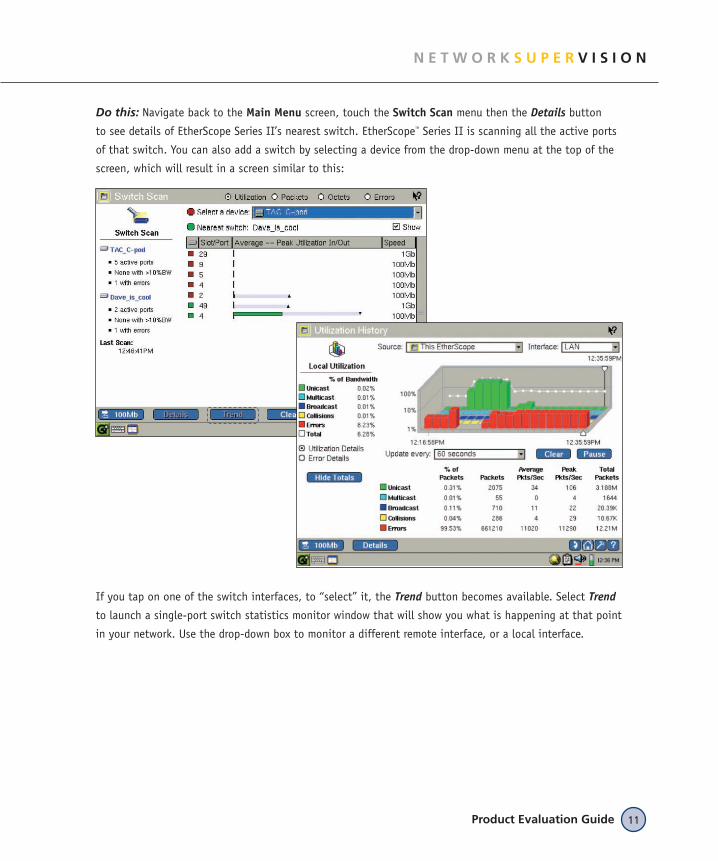
Do this: Navigate back to the Main Menu screen, touch the Switch Scan menu then the Details button
to see details of EtherScope Series II’s nearest switch. EtherScopeTM Series II is scanning all the active ports
of that switch. You can also add a switch by selecting a device from the drop-down menu at the top of the
screen, which will result in a screen similar to this:
If you tap on one of the switch interfaces, to “select” it, the Trend button becomes available. Select Trend
to launch a single-port switch statistics monitor window that will show you what is happening at that point
in your network. Use the drop-down box to monitor a different remote interface, or a local interface.
EtherScope™ Series II Network Assistant12
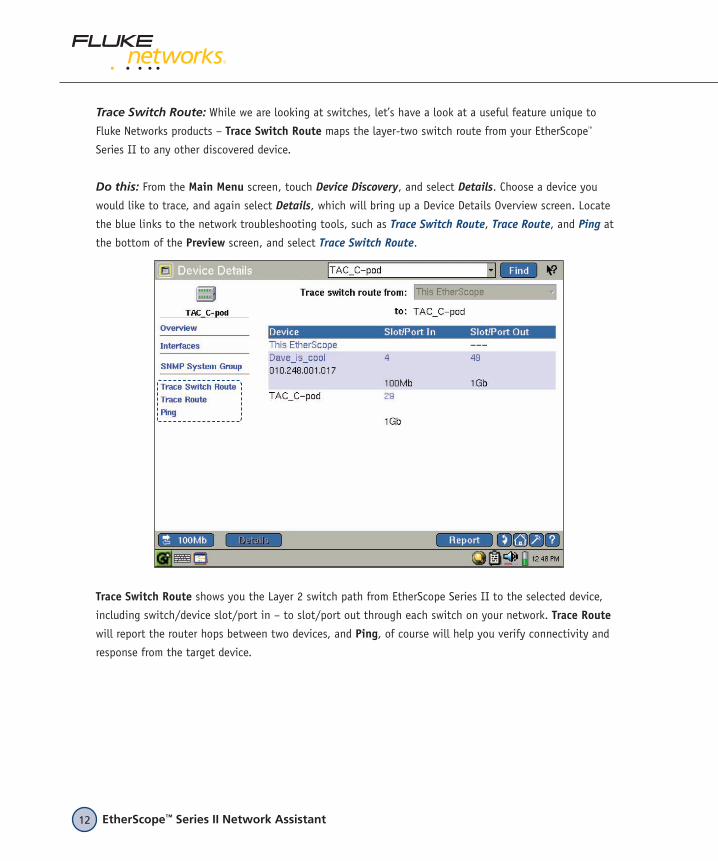
Trace Switch Route: While we are looking at switches, let’s have a look at a useful feature unique to
Fluke Networks products – Trace Switch Route maps the layer-two switch route from your EtherScopeTM
Series II to any other discovered device.
Do this: From the Main Menu screen, touch Device Discovery, and select Details. Choose a device you
would like to trace, and again select Details, which will bring up a Device Details Overview screen. Locate
the blue links to the network troubleshooting tools, such as Trace Switch Route, Trace Route, and Ping at
the bottom of the Preview screen, and select Trace Switch Route.
Trace Switch Route shows you the Layer 2 switch path from EtherScope Series II to the selected device,
including switch/device slot/port in – to slot/port out through each switch on your network. Trace Route
will report the router hops between two devices, and Ping, of course will help you verify connectivity and
response from the target device.
Product Evaluation Guide 13
N E T W O R K S U P E R V I S I O N
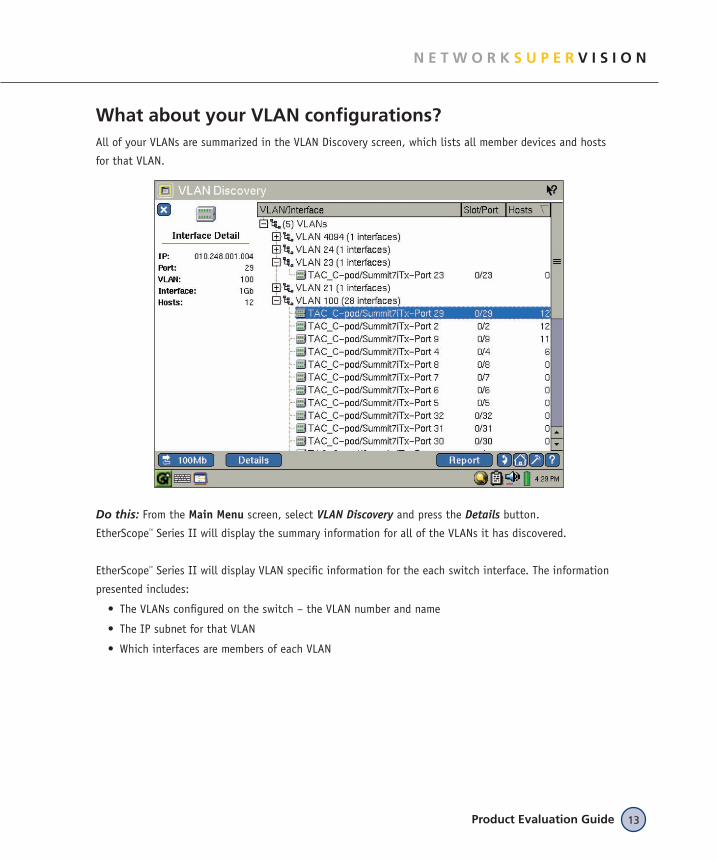
What about your VLAN configurations?All of your VLANs are summarized in the VLAN Discovery screen, which lists all member devices and hosts
for that VLAN.
Do this: From the Main Menu screen, select VLAN Discovery and press the Details button.
EtherScopeTM Series II will display the summary information for all of the VLANs it has discovered.
EtherScopeTM Series II will display VLAN specific information for the each switch interface. The information
presented includes:
The VLANs configured on the switch – the VLAN number and name
The IP subnet for that VLAN
Which interfaces are members of each VLAN
•
•
•
EtherScope™ Series II Network Assistant14
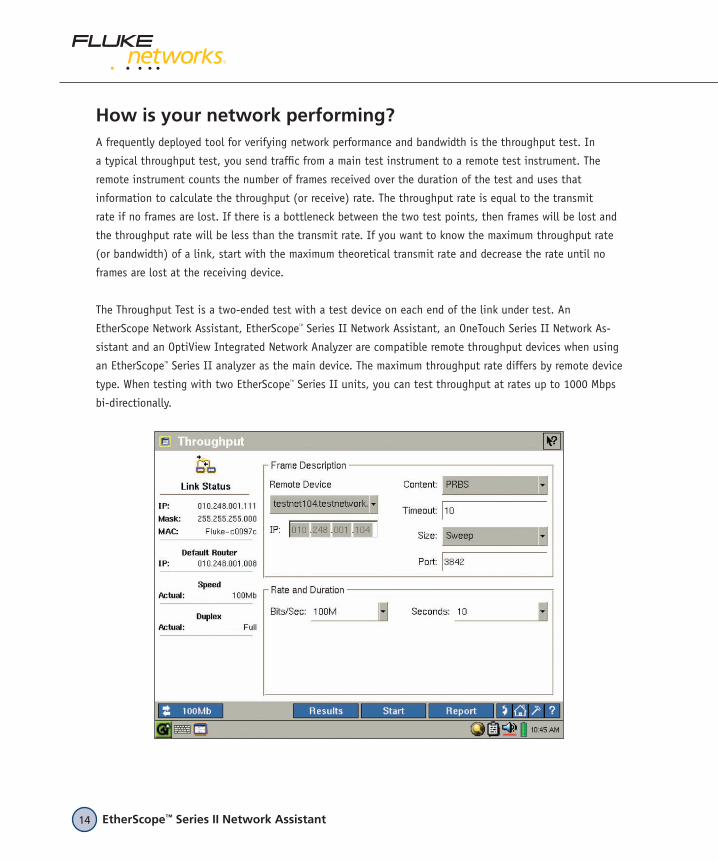
How is your network performing?A frequently deployed tool for verifying network performance and bandwidth is the throughput test. In
a typical throughput test, you send traffic from a main test instrument to a remote test instrument. The
remote instrument counts the number of frames received over the duration of the test and uses that
information to calculate the throughput (or receive) rate. The throughput rate is equal to the transmit
rate if no frames are lost. If there is a bottleneck between the two test points, then frames will be lost and
the throughput rate will be less than the transmit rate. If you want to know the maximum throughput rate
(or bandwidth) of a link, start with the maximum theoretical transmit rate and decrease the rate until no
frames are lost at the receiving device.
The Throughput Test is a two-ended test with a test device on each end of the link under test. An
EtherScope Network Assistant, EtherScopeTM Series II Network Assistant, an OneTouch Series II Network As-
sistant and an OptiView Integrated Network Analyzer are compatible remote throughput devices when using
an EtherScopeTM Series II analyzer as the main device. The maximum throughput rate differs by remote device
type. When testing with two EtherScopeTM Series II units, you can test throughput at rates up to 1000 Mbps
bi-directionally.
Product Evaluation Guide 15
N E T W O R K S U P E R V I S I O N
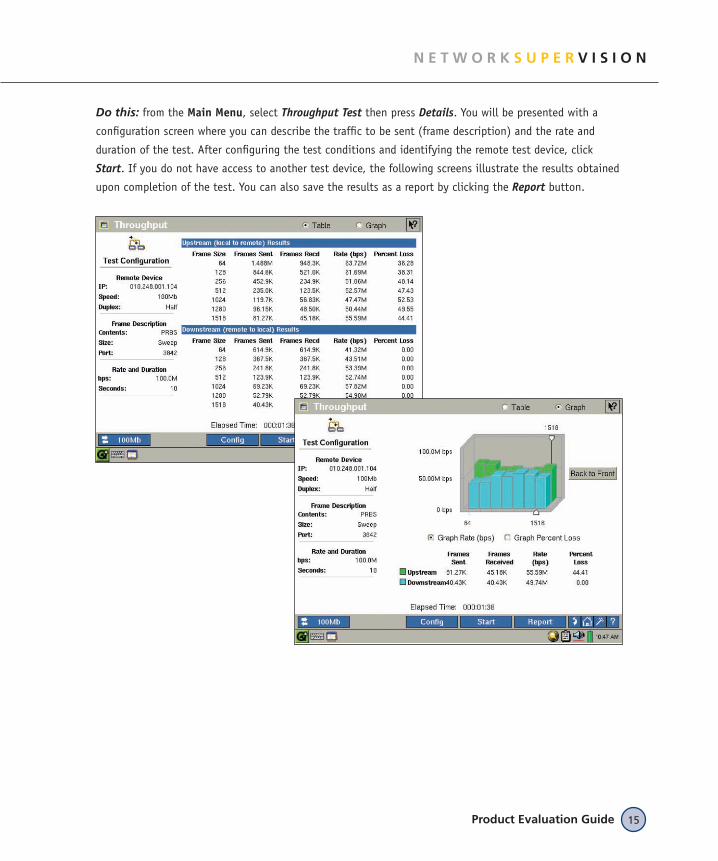
Do this: from the Main Menu, select Throughput Test then press Details. You will be presented with a
configuration screen where you can describe the traffic to be sent (frame description) and the rate and
duration of the test. After configuring the test conditions and identifying the remote test device, click
Start. If you do not have access to another test device, the following screens illustrate the results obtained
upon completion of the test. You can also save the results as a report by clicking the Report button.
EtherScope™ Series II Network Assistant16
How good is your network documentation?You will find a number of useful reporting features on EtherScopeTM Series II. For example, you can
generate an XML report of all the discovered devices simply by selecting the Device Discovery screen
then touching the Reports button at the bottom of the screen. These reports help you document traffic
information, devices on the network, protocol mix, problems, and specific host information on the network.
You can also view Real-Time reports directly from EtherScopeTM Series II via your PC web browser.
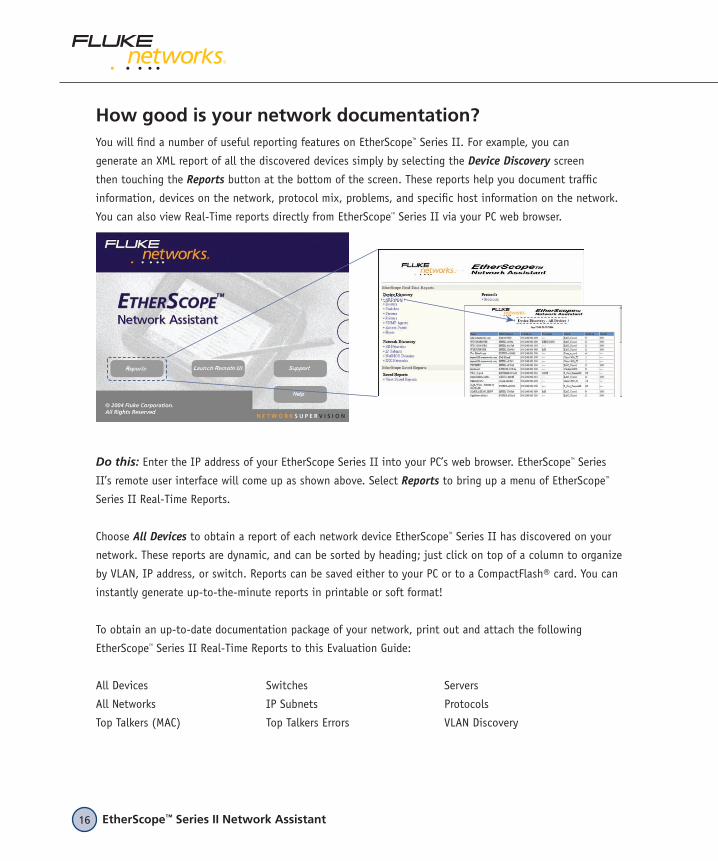
Do this: Enter the IP address of your EtherScope Series II into your PC’s web browser. EtherScopeTM Series
II’s remote user interface will come up as shown above. Select Reports to bring up a menu of EtherScopeTM
Series II Real-Time Reports.
Choose All Devices to obtain a report of each network device EtherScopeTM Series II has discovered on your
network. These reports are dynamic, and can be sorted by heading; just click on top of a column to organize
by VLAN, IP address, or switch. Reports can be saved either to your PC or to a CompactFlash® card. You can
instantly generate up-to-the-minute reports in printable or soft format!
To obtain an up-to-date documentation package of your network, print out and attach the following
EtherScopeTM Series II Real-Time Reports to this Evaluation Guide:
All Devices Switches Servers
All Networks IP Subnets Protocols
Top Talkers (MAC) Top Talkers Errors VLAN Discovery
Product Evaluation Guide 17
N E T W O R K S U P E R V I S I O N
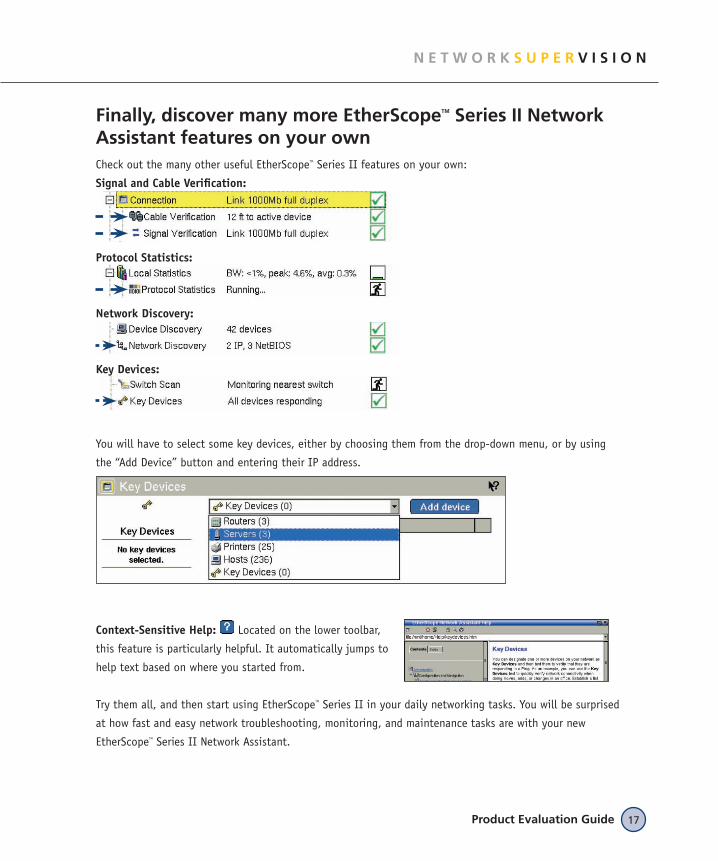
Finally, discover many more EtherScopeTM Series II Network Assistant features on your ownCheck out the many other useful EtherScopeTM Series II features on your own:
Signal and Cable Verification:
Protocol Statistics:
Network Discovery:
Key Devices:
You will have to select some key devices, either by choosing them from the drop-down menu, or by using
the “Add Device” button and entering their IP address.
Context-Sensitive Help: Located on the lower toolbar,
this feature is particularly helpful. It automatically jumps to
help text based on where you started from.
Try them all, and then start using EtherScopeTM Series II in your daily networking tasks. You will be surprised
at how fast and easy network troubleshooting, monitoring, and maintenance tasks are with your new
EtherScopeTM Series II Network Assistant.
EtherScope™ Series II Network Assistant18
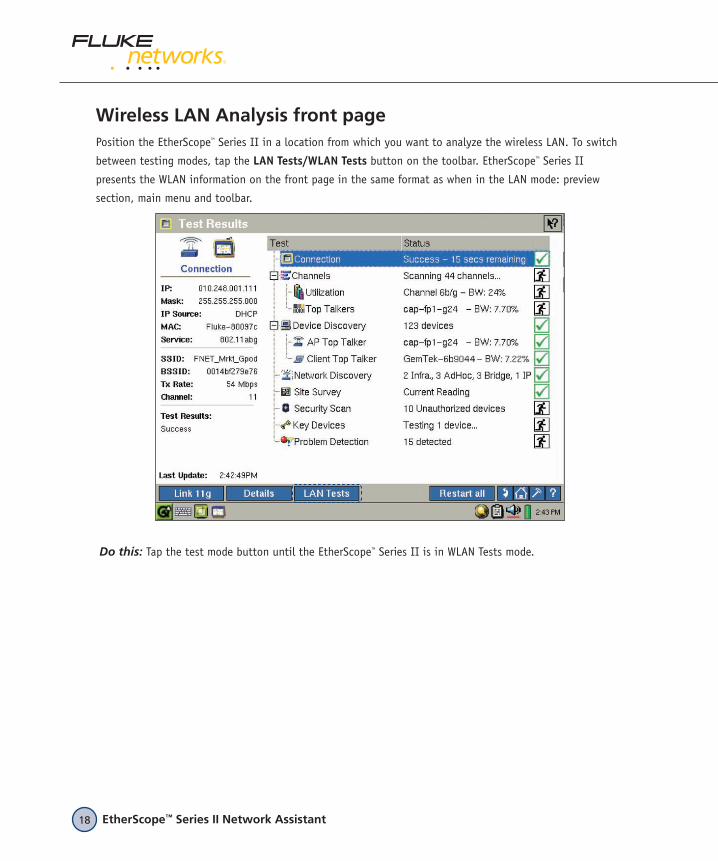
Wireless LAN Analysis front pagePosition the EtherScopeTM Series II in a location from which you want to analyze the wireless LAN. To switch
between testing modes, tap the LAN Tests/WLAN Tests button on the toolbar. EtherScopeTM Series II
presents the WLAN information on the front page in the same format as when in the LAN mode: preview
section, main menu and toolbar.
Do this: Tap the test mode button until the EtherScopeTM Series II is in WLAN Tests mode.
Product Evaluation Guide 19
N E T W O R K S U P E R V I S I O N
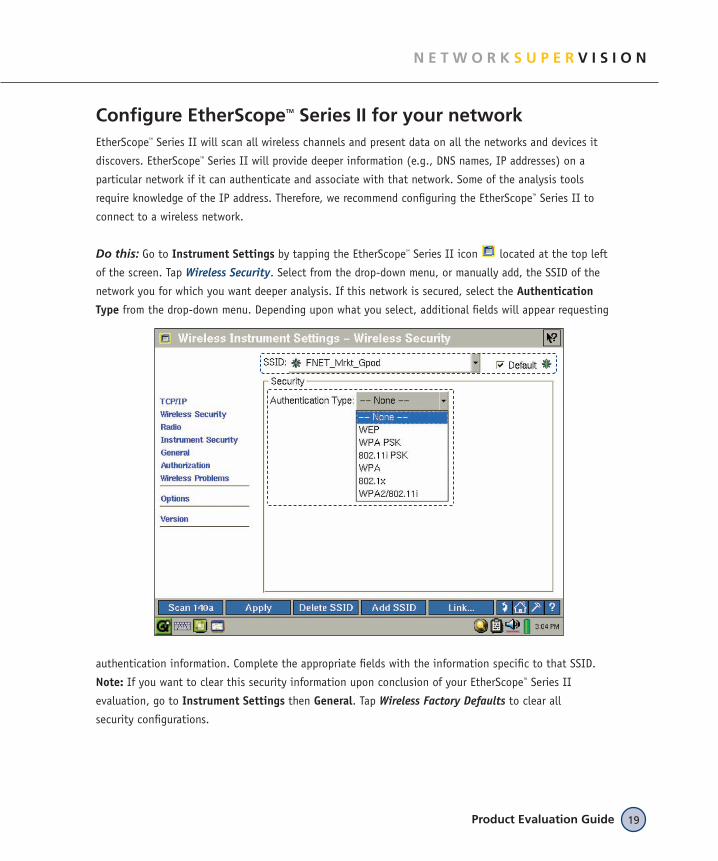
Configure EtherScopeTM Series II for your networkEtherScopeTM Series II will scan all wireless channels and present data on all the networks and devices it
discovers. EtherScopeTM Series II will provide deeper information (e.g., DNS names, IP addresses) on a
particular network if it can authenticate and associate with that network. Some of the analysis tools
require knowledge of the IP address. Therefore, we recommend configuring the EtherScopeTM Series II to
connect to a wireless network.
Do this: Go to Instrument Settings by tapping the EtherScopeTM Series II icon located at the top left
of the screen. Tap Wireless Security. Select from the drop-down menu, or manually add, the SSID of the
network you for which you want deeper analysis. If this network is secured, select the Authentication
Type from the drop-down menu. Depending upon what you select, additional fields will appear requesting
authentication information. Complete the appropriate fields with the information specific to that SSID.
Note: If you want to clear this security information upon conclusion of your EtherScopeTM Series II
evaluation, go to Instrument Settings then General. Tap Wireless Factory Defaults to clear all
security configurations.
EtherScope™ Series II Network Assistant20
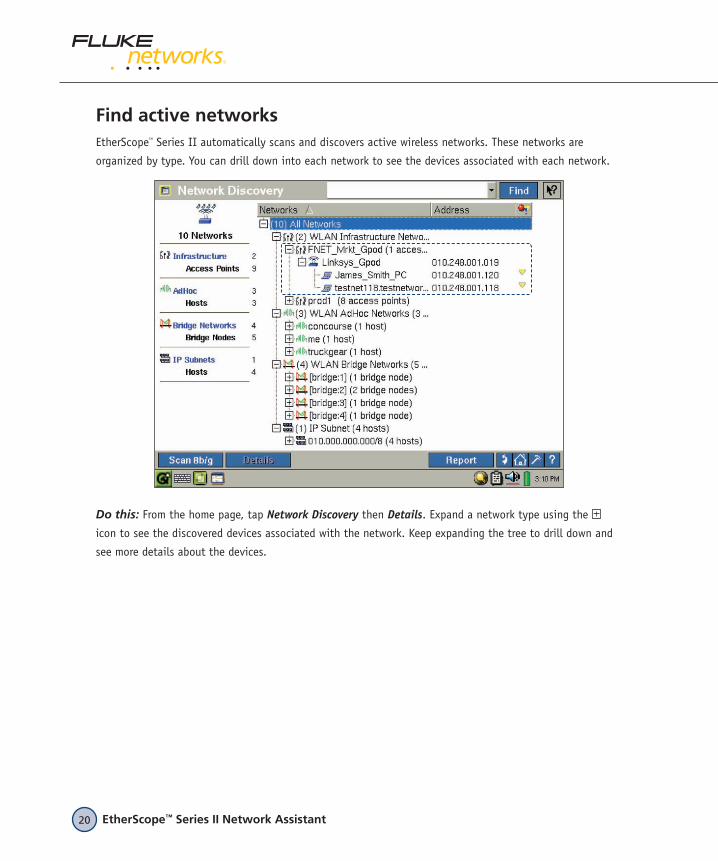
Find active networksEtherScopeTM Series II automatically scans and discovers active wireless networks. These networks are
organized by type. You can drill down into each network to see the devices associated with each network.
Do this: From the home page, tap Network Discovery then Details. Expand a network type using the
icon to see the discovered devices associated with the network. Keep expanding the tree to drill down and
see more details about the devices.
Product Evaluation Guide 21
N E T W O R K S U P E R V I S I O N
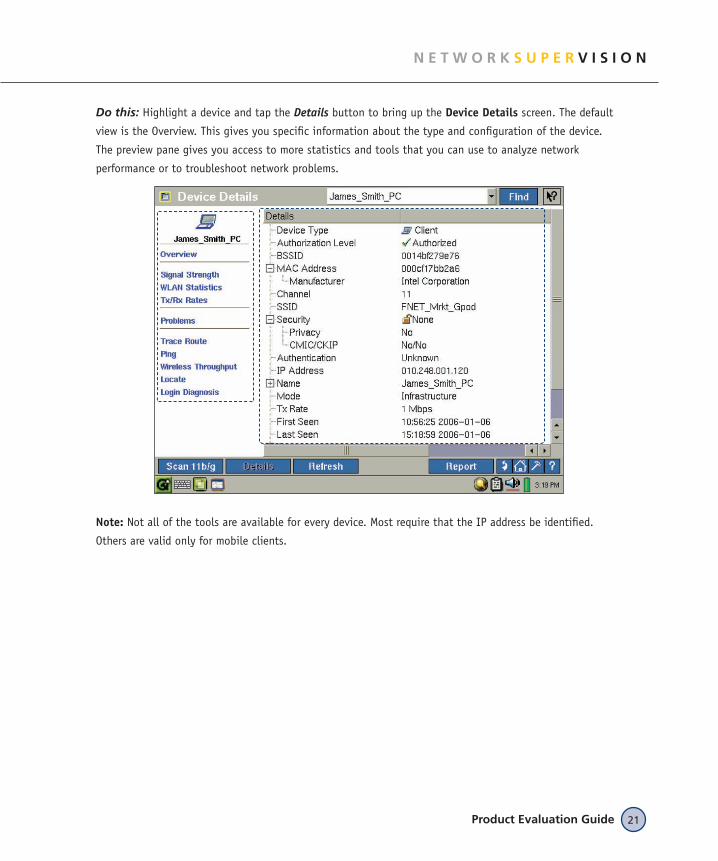
Do this: Highlight a device and tap the Details button to bring up the Device Details screen. The default
view is the Overview. This gives you specific information about the type and configuration of the device.
The preview pane gives you access to more statistics and tools that you can use to analyze network
performance or to troubleshoot network problems.
Note: Not all of the tools are available for every device. Most require that the IP address be identified.
Others are valid only for mobile clients.
EtherScope™ Series II Network Assistant22
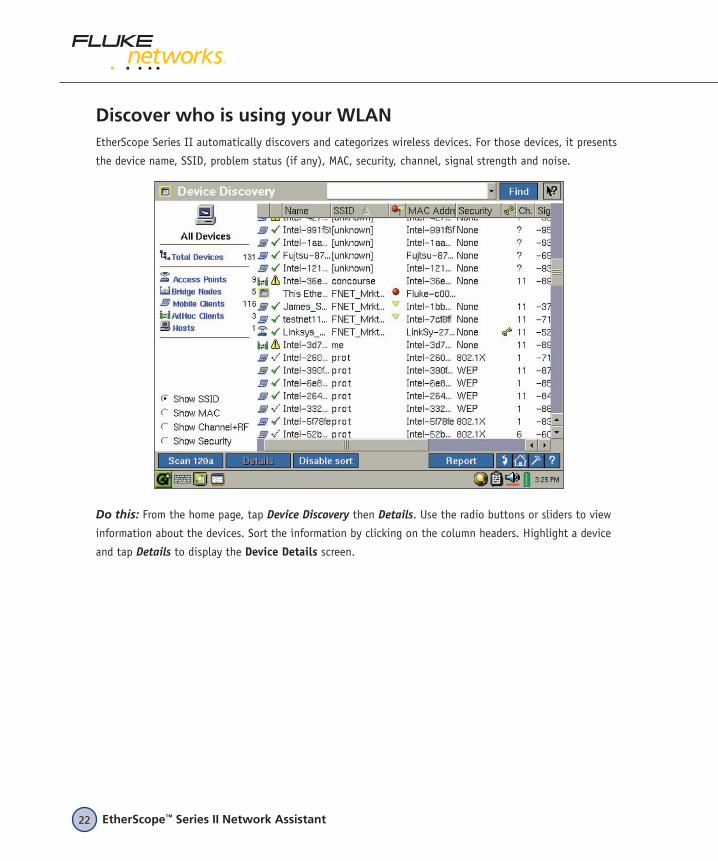
Discover who is using your WLANEtherScope Series II automatically discovers and categorizes wireless devices. For those devices, it presents
the device name, SSID, problem status (if any), MAC, security, channel, signal strength and noise.
Do this: From the home page, tap Device Discovery then Details. Use the radio buttons or sliders to view
information about the devices. Sort the information by clicking on the column headers. Highlight a device
and tap Details to display the Device Details screen.
Product Evaluation Guide 23
N E T W O R K S U P E R V I S I O N
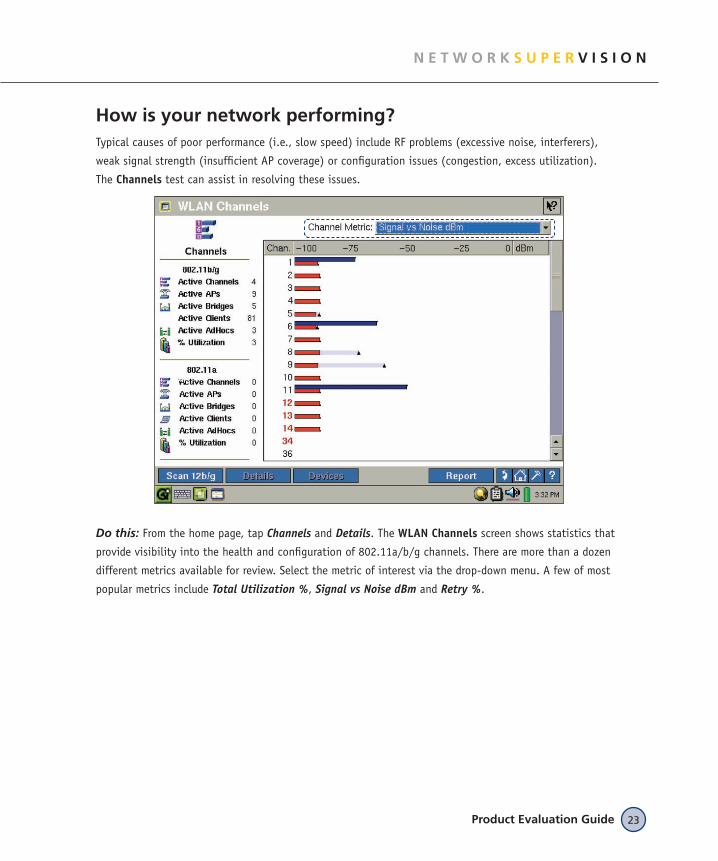
How is your network performing?Typical causes of poor performance (i.e., slow speed) include RF problems (excessive noise, interferers),
weak signal strength (insufficient AP coverage) or configuration issues (congestion, excess utilization).
The Channels test can assist in resolving these issues.
Do this: From the home page, tap Channels and Details. The WLAN Channels screen shows statistics that
provide visibility into the health and configuration of 802.11a/b/g channels. There are more than a dozen
different metrics available for review. Select the metric of interest via the drop-down menu. A few of most
popular metrics include Total Utilization %, Signal vs Noise dBm and Retry %.
EtherScope™ Series II Network Assistant24
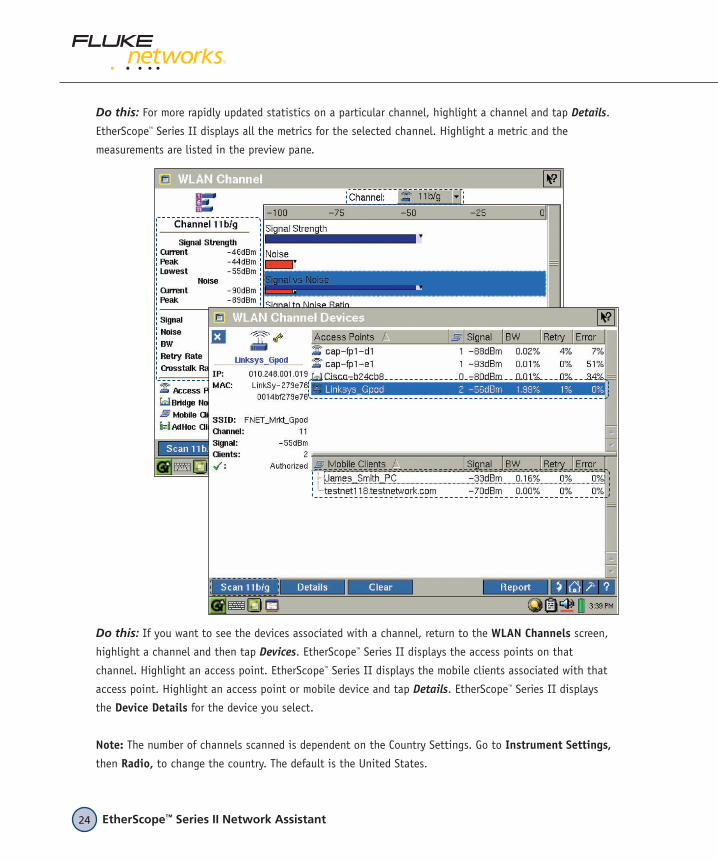
Do this: For more rapidly updated statistics on a particular channel, highlight a channel and tap Details.
EtherScopeTM Series II displays all the metrics for the selected channel. Highlight a metric and the
measurements are listed in the preview pane.
Do this: If you want to see the devices associated with a channel, return to the WLAN Channels screen,
highlight a channel and then tap Devices. EtherScopeTM Series II displays the access points on that
channel. Highlight an access point. EtherScopeTM Series II displays the mobile clients associated with that
access point. Highlight an access point or mobile device and tap Details. EtherScopeTM Series II displays
the Device Details for the device you select.
Note: The number of channels scanned is dependent on the Country Settings. Go to Instrument Settings,
then Radio, to change the country. The default is the United States.
Product Evaluation Guide 25
N E T W O R K S U P E R V I S I O N
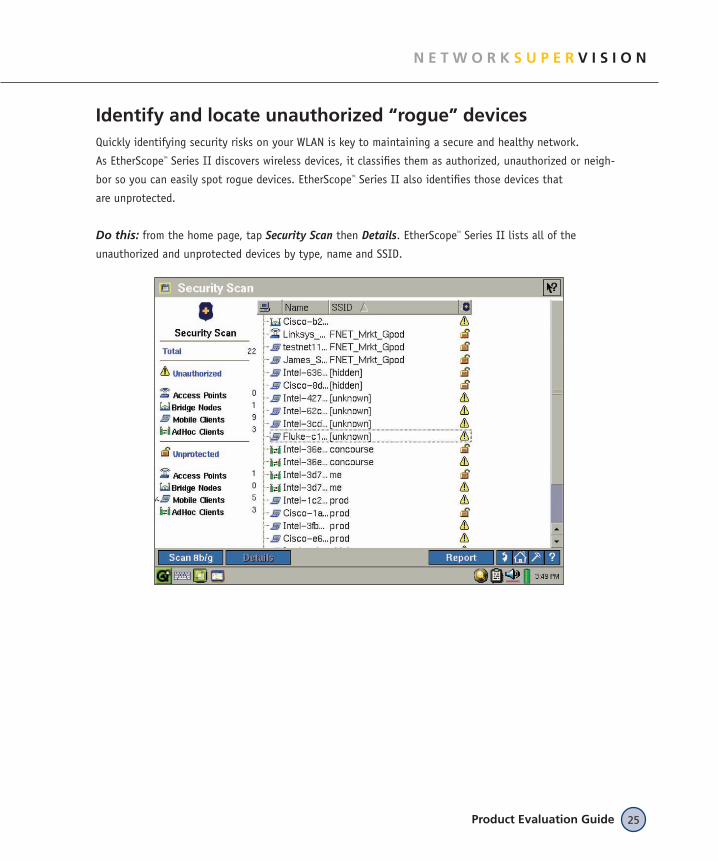
Identify and locate unauthorized “rogue” devicesQuickly identifying security risks on your WLAN is key to maintaining a secure and healthy network.
As EtherScopeTM Series II discovers wireless devices, it classifies them as authorized, unauthorized or neigh-
bor so you can easily spot rogue devices. EtherScopeTM Series II also identifies those devices that
are unprotected.
Do this: from the home page, tap Security Scan then Details. EtherScopeTM Series II lists all of the
unauthorized and unprotected devices by type, name and SSID.
EtherScope™ Series II Network Assistant26
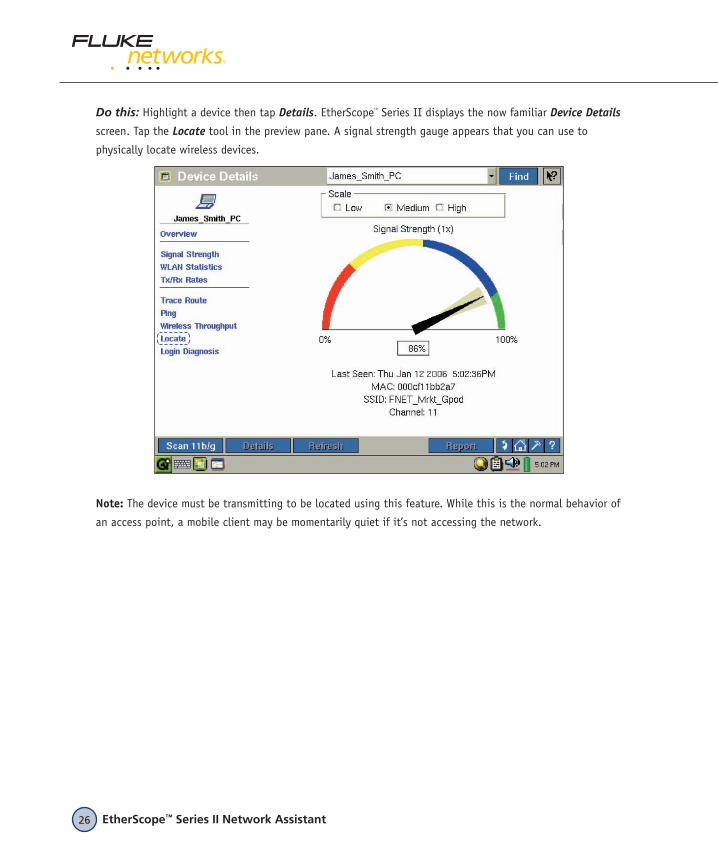
Do this: Highlight a device then tap Details. EtherScopeTM Series II displays the now familiar Device Details
screen. Tap the Locate tool in the preview pane. A signal strength gauge appears that you can use to
physically locate wireless devices.
Note: The device must be transmitting to be located using this feature. While this is the normal behavior of
an access point, a mobile client may be momentarily quiet if it’s not accessing the network.
Product Evaluation Guide 27
N E T W O R K S U P E R V I S I O N
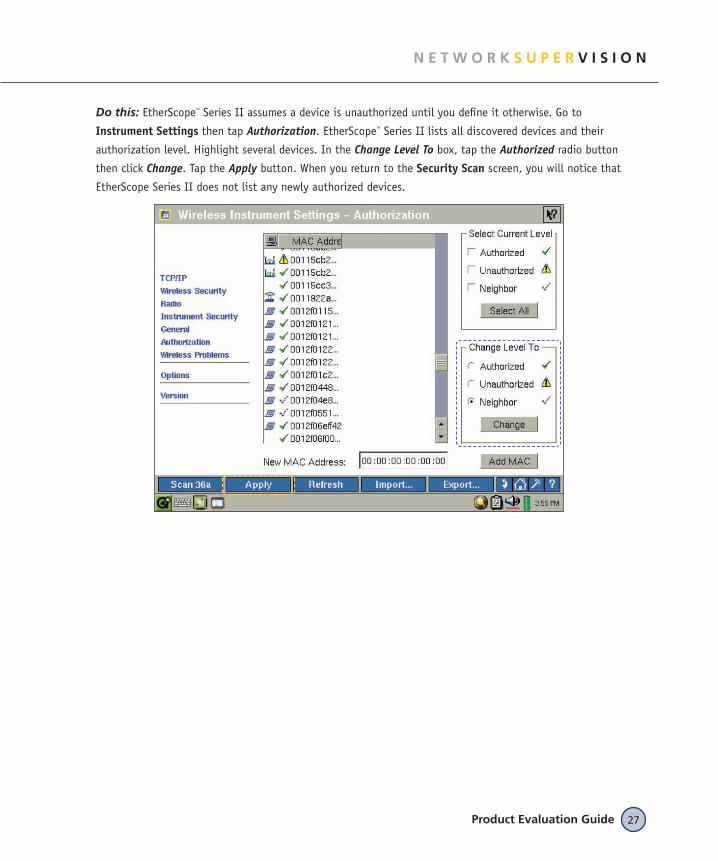
Do this: EtherScopeTM Series II assumes a device is unauthorized until you define it otherwise. Go to
Instrument Settings then tap Authorization. EtherScopeTM Series II lists all discovered devices and their
authorization level. Highlight several devices. In the Change Level To box, tap the Authorized radio button
then click Change. Tap the Apply button. When you return to the Security Scan screen, you will notice that
EtherScope Series II does not list any newly authorized devices.
EtherScope™ Series II Network Assistant28
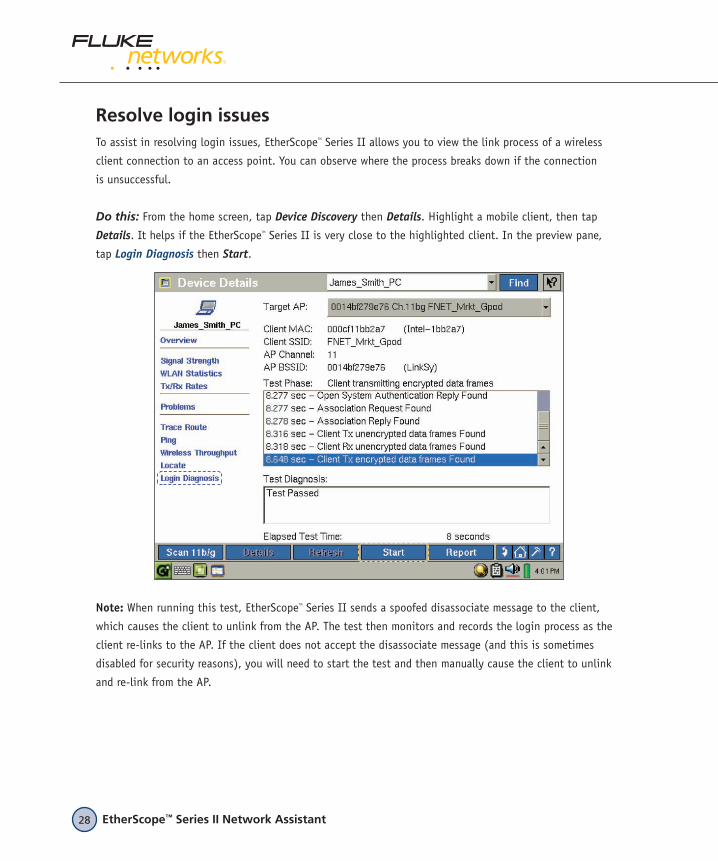
Resolve login issuesTo assist in resolving login issues, EtherScopeTM Series II allows you to view the link process of a wireless
client connection to an access point. You can observe where the process breaks down if the connection
is unsuccessful.
Do this: From the home screen, tap Device Discovery then Details. Highlight a mobile client, then tap
Details. It helps if the EtherScopeTM Series II is very close to the highlighted client. In the preview pane,
tap Login Diagnosis then Start.
Note: When running this test, EtherScopeTM Series II sends a spoofed disassociate message to the client,
which causes the client to unlink from the AP. The test then monitors and records the login process as the
client re-links to the AP. If the client does not accept the disassociate message (and this is sometimes
disabled for security reasons), you will need to start the test and then manually cause the client to unlink
and re-link from the AP.
Product Evaluation Guide 29
N E T W O R K S U P E R V I S I O N
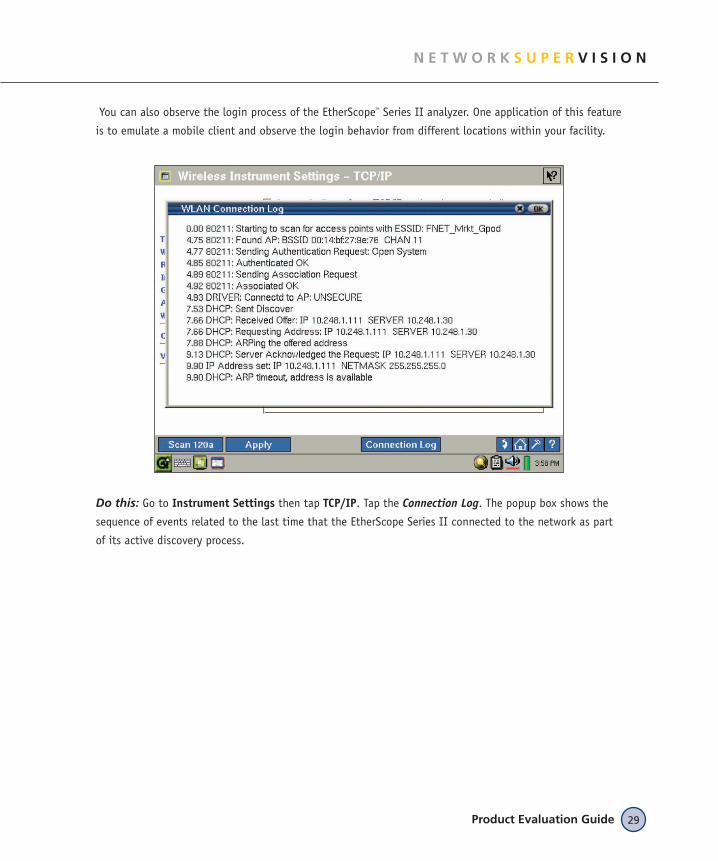
You can also observe the login process of the EtherScopeTM Series II analyzer. One application of this feature
is to emulate a mobile client and observe the login behavior from different locations within your facility.
Do this: Go to Instrument Settings then tap TCP/IP. Tap the Connection Log. The popup box shows the
sequence of events related to the last time that the EtherScope Series II connected to the network as part
of its active discovery process.

N E T W O R K S U P E R V I S I O N
Fluke NetworksP.O. Box 777, Everett, WA USA 98206-0777
Fluke Networks operates in more than 50 countries worldwide. To find your local office contact details, go to www.flukenetworks.com/contact.
©2006 Fluke Corporation. All rights reserved. Printed in U.S.A. 7/2006 2442617 D-ENG-N Rev C