Embed Size (px)
Citation preview

eThekwini Economic Review
2006 2007/

eThekwini Municipality Economic Review 2006/2007
Published by eThekwini MunicipalityEconomic Development Department
Research conducted by
Researchers:James Dray, Andrew McGill, Graham Muller,
Kay Muller, Dayne Skinner
Copyright © 2006eThekwini Municipality
Economic Develoment Department
PO Box 5856Durban 4000
KwaZulu-NatalSouth Africa
Telephone: +27 (31) 311 3824Website: www.durban.gov.za
E-mail: [email protected]
It should be noted that any opinions expressed are those of the researchers and not of the eThekwini Economic Development Department or the eThekwini Municipality

Contents
Chapter 1 - eThekwini Economyin Context PG 1
1.0 Introduction1.1 Global Economic Outlook1.1.1 Growth1.1.2 Non-oil Commodity Prices1.1.3 Oil Prices
1.2 An Overview of South African Economy1.2.1 Economic Growth1.2.2 Macro-economic Stability1.2.3 Infl ation 1.2.4 The Exchange Rate1.2.5 The Current Account1.2.6 The Property Market1.2.7 The Equity Market1.2.8 Savings and Investment1.2.9 Foreign Direct Investment1.2.10 Forecasts for the South African Economy
1.3 The eThekwini Municipality in a National Context1.3.1 Population1.3.2 Contribution to National Output
Chapter 2 - Performance and Outlook PG 8
2.0 Introduction
2.1 The Role of the Municipality
2.2 Major Health Issues
2.3 Meeting Infrastructural Challenges
2.4 Crime, Housing and Education
2.5 The Port of Durban: A Matchless Opportunity
2.6 Unique Climate and Culture
2.7 An Effi cient Municipality
2.8 Key Investment Areas
2.9 The International Convention Centre (ICC)
2.10 The Film Industry
2.11 Conclusion
Chapter 3 - eThekwini Municipality ina Provincial and National Context PG 13
3.0 Introduction
3.1 eThekwini Municipality in a Provincial and National Context 3.2 Climate
3.3 Land Use
3.4 Demographics
3.5 Employment and Unemployment
3.6 Education in eThekwini3.6.1 Primary and Secondary Schooling3.6.2 Higher Education
3.7 An Assessment of Poverty and Inequality in eThekwini3.7.1 Measuring Poverty3.7.2 Income Inequality
3.8 Health 3.8.1 HIV/AIDS3.8.2 Tuberculosis (TB)3.8.3 Pollution3.8.4 Health Care
3.9 Crime
3.10 Conclusion
Chapter 4 - Structure of the MetropolitanEconomy, Sectoral and Spatial PG 29
4.0 Introduction
4.1 Growth Analysis
4.2 Manufacturing in the eThekwini Municipality4.2.1 The Recent Performance of the Manufactur ing Industry4.2.2 Petroleum Products, Chemicals, Rubber and Plastic4.2.3 Food, Beverages and Tobacco4.2.4 Automotive Industry4.2.5 Wood and Paper; Publishing and Printing4.2.6 Clothing and Textiles
4.3 The Service Sector4.3.1 Real Estate 4.3.1.1 Overview of the Durban Real Estate Market 4.3.1.2 Residential Property Market4.3.1.3 Commercial Property Market4.3.1.4 Building Plans Passed4.3.2 Transport Sector. 4.3.3 Tourism4.3.3.1 The eThekwini Municipality Foreign Tourism Market4.3.3.2 The eThekwini Municipality Domestic Tourism Market4.3.3.3 The Durban Hotel Market
4.4 The Informal Sector4.4.1 The Response4.4.2 Future Challenges
4.5 Conclusion
Chapter 5 - Economic Nodes, Nodal andInfrastructural Development and Investment PG 46
5.0 Overview
5.1 Area Based Management and Development Programmes (ABM Programmes)
5.1.1 Cato Manor ABM5.1.2 South Durban Basin5.1.3 iTrump Inner City Regeneration5.1.4 Inanda, Ntuzuma and KwaMashu (INK)5.1.5 Rural Area Based Management
5.2 Key Spatial Development Initiatives5.2.1 Port of Durban 5.2.2 Dube Tradeport and King Shaka International Airport5.2.3 Riverhorse Valley5.2.4 Durban Point Waterfront5.2.5 King Senzangakhona Stadium
5.3 Widespread Infrastructural Programmes
Chapter 6 - Services and Delivery PG 56
6.0 Distribution of Facilities
6.1 Dwelling Types
6.2 Quality of Life Survey
6.3 Meeting the needs of it residents
Chapter 7 - Conclusions PG 61
7.0 Realising Goals
7.1 A Mixed Outlook for the Major Sectors
7.2 Unemployment, Poverty and Health Concerns
7.3 Future Developments
Figures PG 64
References PG 66

eThekwini Economy in Context
CHAPTER 1
ETHEKWINIMUNICIPALITY1

1.0 Introduction
The economy of the eThekwini Municipality is centred on the transport and logistics activities of the Port of Durban, domestic and export-oriented manufacturing and tourism. As a result, the performance of the metropolitan economy is closely linked to trends in both the global and national economies. In an attempt to position the metropolitan economy within its broader context, this chapter begins with a review of the aspects of the global economy in 2005/06 that are most likely to shape the economic prospects of the metropolitan area. The analysis is subsequently extended to the performance of the national economy with a focus on gross domestic product (GDP) growth, employment, fixed investment, inflation and interest rates, the balance of payments and the exchange rate. The chapter concludes with a high-level assessment of the metropolitan area’s contribution to the South African economy.
1.1 Global Economic Outlook 1.1.1 Growth
According to the International Monetary Fund (IMF) World Economic Outlook (2006) global economic growth averaged a buoyant 4.8% during the second half of 2005 and is expected to maintain this level of performance during 2006 and 2007, driven largely by strong economic expansion in China and sustained growth in the United States. This robust level of growth was achieved despite generally rising short-term interest rates, a high oil price and natural disasters including avian flu and the tsunami in southern Asia.
Across emerging markets, including South Africa, GDP growth exceeded expectations. The resilience of emerging economies, to date, in the face of potentially adverse conditions such as rising interest rates and higher oil and lower non-oil commodity prices is noteworthy. The benign influence of globalisation on inflation rates throughout the world will continue to moderate these impacts. Furthermore, emerging markets (along with corporations) remain – highly unusually – large net savers and this will contribute to low long-term interest rates and to a general flattening of the interest rate curve throughout the world, enhancing future growth prospects generally.
1.1.2 Non-oil Commodity Prices
After a lengthy period of decline, the index of non-oil commodity prices has risen consistently since 2002. The reversal of the long-term downward trend was supported by the widespread global economic recovery, but in particular by industrial expansion in China, which significantly boosted the global demand for raw materials (UN, 2005). Higher prices in turn, boosted export revenue and GDP in countries with positive net exports of non-oil commodities. This has certainly been the case in South Africa where exports of commodities (mining and agriculture) accounted for 36% of the total value of exports in 2005 and exceeded the value of commodity imports (including oil) by R62.6 billion in the same year. South Africa has benefited particularly from the surge in coal (energy) and metal prices, since gold and uranium, platinum group metals, coal and diamonds constitute the vast majority of the country’s commodity exports. Increases in agricultural commodity prices have been moderate relative to those in metals and energy commodities. It is expected that continued global economic expansion and in particular the robust industrial growth in China will continue to support most non-oil commodity prices in 2006. However, the price of agricultural commodities may fall due to favourable harvests and demand for metals is expected to weaken in response to the recent hike in metal prices (IMF, 2005),which may lead to a weakening of some metal prices.
2

1.1.3 Oil Prices
Oil prices surged by 30% in 2004, by 50% in 2005 and by a further 20% during the first half of 2006 due to robust global demand for crude oil, temporary supply shocks and limited spare capacity among producers. In South Africa, the adverse impact of higher oil prices was largely absorbed by the strengthening rand in 2004. In April 2005 however, consumer inflation accelerated after the price of Brent crude oil surged to a new nominal high of US$58 a barrel in March and as the rand depreciated after an interest rate cut in mid-April 2005. Since then a combination of rising oil prices, reaching US$78 a barrel in August 2006, and a generally weaker rand has led to a steady rise in fuel prices in South Africa. Continued oil price volatility is expected in 2006/7 and remains a risk to both global and South African growth and to South Africa’s current account payments balance.
1.2 An Overview of the South African Economy
Recent and current optimism about the future prospects of the South African economy is based on the sound fiscal discipline of the South African Reserve Bank and government over the last ten years. The South African government believes that the attraction of foreign direct investment into the country is a key tool in sustaining a successful long-term growth path. South Africa’s ranking in international credit ratings has improved in light of the success of the inflation targeting strategy of the Reserve Bank and the reduction in the budget deficit as a percentage of GDP. This has created conditions that are favourable for the attracting of foreign direct investment (FDI). The government’s policy of extensive trade liberalisation in the 1990s and a general depreciation of the currency over the past decade have increased South Africa’s global competitiveness and increased the export base of the country. Despite the increase in interest rates in mid-2006, rates remain close to the lowest levels seen in 25 years. Low interest rates and wage rate moderation have lowered production costs in the economy. The historically low level of interest rates has led to strong growth in domestic demand in the South African economy.
1.2.1 Economic Growth
South Africa has recovered well from the global slowdown in 2001. The ten years of sustained growth following the 1994 elections and excellent growth rates during the years following the East-Asian Crisis in the late 1990s have led to a rising tide of positive sentiment towards the South African economy, which is currently experiencing the longest period of sustained economic growth in the entire modern history of the economy. The years 2004 and 2005 have seen buoyant domestic demand and expenditure. Evidence from Statistics South Africa retail sales data suggests that the economy is currently slowing down from its breakneck speed of recent years. Some feel that the initial wave of momentum in domestic expenditure created by declining interest rates, tax relief and lower inflation has largely passed.
1.2.2 Macro-economic Stability
According to the government report ‘Towards a Ten Year Review’ (The Presidency, 2004), South Africa has achieved levels of economic stability “not seen in the country for forty years.” The sound fiscal discipline is most evident when considering the budget deficit as a percentage of GDP. This has declined from 9.5% in 1993 to small surplus in 2005. This reduction has been largely achieved through strong tax revenue growth and improvements in the monitoring of government expenditure (IMF, 2002). The recent relaxing of fiscal discipline though increased government expenditure and tax relief has not had a detrimental effect on the size of the budget deficit as a percentage of GDP.
3

1.2.3 Inflation
Despite rising fuel costs, soaring domestic demand and a mid-2006 surge in producer price inflation, Consumer Price Index (CPI) headline inflation has remained comfortably within the target range of 3% to 6% per annum. The South African Reserve Bank has been increasingly successful at lowering the inflation expectations of business and labour in South Africa. After the recovery of the rand in late 2002, the rate of inflation declined rapidly throughout 2003. In 2004, due mainly to the appreciation of the rand, overall CPI inflation fell to its lowest level in forty years at 1.4% and remained at low levels until interest rate cuts in August 2004 and April 2005 fuelled domestic expenditure which, along with continued oil price pressure, resulted in a steady rise in CPI inflation from late 2004. For June 2006, the CPI reflected an increase of 4.9% over the same month a year ago. The Bureau for Economic Research (2006) expects CPIX (consumer inflation excluding home mortgage costs) to breach the upper end of the target range during the first quarter of 2007 “in a one-off spike” before declining back to around 5% by the end of 2007. The recent rise in the PPI inflation rate can partly be explained by the decline of the rand relative to the dollar following the recent period of low interest rate levels and the continued pressure of high oil prices as well as a rise in imported basic metal prices. Despite the soaring domestic demand in the economy during 2005, the government’s attempt at lowering the inflation expectations of business and individuals has been largely successful.
1.2.4 The Exchange Rate
The rand experienced continued gains against the major currencies through 2004 and 2005 supported by strong commodity prices and investor interest in South Africa. Speculation about an increase in FDI in South Africa and the upgrade in South Africa’s rating by Fitch Ratings led to gains through late 2004 and early 2005. The Reserve Bank’s decision to decrease the repo rate (the rate at which the SARB lends money to commercial banks) in April 2005 was followed by a significant depreciation in the rand due to capital outflows. The interest rate cut was welcomed by labour unions and the mining and manufacturing sectors of the economy as the decline in the value of the currency aided the competitiveness of South African manufacturers and exporters and reduced the risk of job losses in these sectors. The rand depreciated further in the beginning of June 2005 as the US dollar strengthened against major currencies. During the first half of 2006 the currency stabilized, weakening initially but then strengthening again in mid-year, fluctuating in a band between R5.95 = $1 and R7.45 = $1, and averaging R6.45 = $1.
1.2.5 The Current Account
The high levels of domestic expenditure and the relative strength of the rand since 2004 resulted in a surge in imports and a considerable increase in the current account deficit. In the first quarter of 2006 the current account deficit as a percentage of GDP grew to 6.4% while the cumulative deficit on the current account for the year to June 2006 reached R28 billion. However, the position change on the capital account offset the current account deficit and allowed the Reserve Bank to continue accumulating foreign exchange reserves at a moderate pace throughout 2004, 2005 and 2006. The reasons for this are that the strong growth outlook for the economy and the favourable yields offered by South African capital markets resulted in large inflows of investment capital which emerged as the most significant contributor to foreign exchange reserves in recent years. Dollar denominated foreign exchange reserves stood at US$21.5 billion in June 2006, an increase of 27% over the level in June 2005. The substantial increase in the reserves over this period can be attributed largely to the purchase of a share of ABSA Bank by Barclays Bank (United Kingdom). A further accumulation of foreign reserves as a result of FDI transactions can be expected to continue for the remainder of 2006.
4

1.2.6 The Property Market
Local property markets depend to a large extent on national trends and the Durban market is no exception. The South African property market continues to retain some buoyancy with low vacancy rates in industrial and office property and strong rentals inflation underlining the growth. However, several indicators point to a less positive outlook for the property market in the coming year and suggest that prices have stabilised following a period of exceptional growth. The ABSA House Price Index (ABSA, 5 July 2006) noted that while nominal house prices rose 13.6% year on year to end June 2006 and 14.3% to end May 2006, these are the lowest nominal increases since January 2002. Similarly, year-on-year prices rose by 10% in real terms in May 2006, the lowest increase since March 2003. Real month on month growth was marginal at 0.1%. When this data is examined in the context of continued expected interest rate hikes, ABSA predicts that house prices will rise by 12% in nominal terms this year (ABSA, 5 July 2006). In spite of the lower house price increases, Trafalgar Property Management reports that housing in 2005 was still less affordable then it was in 2004 (Property24, 7 July 2005), with the qualifying gross monthly income for a bond 15.4% higher in June 2005 then it was in June, though the growth in qualifying gross monthly income has declined since it peaked at 26.8% in December 2004. Further signs of an imminent slowdown in the residential housing market emerge when one examines the Building Statistics for the first quarter of 2006 (ABSA, 22 May 2006). While the real value of plans passed for new residential buildings is up 26% year on year, it was down 3% quarter on quarter. Similarly, the real value of buildings completed was up 37.3% year on year, but down 12.6% quarter on quarter. A slowdown in the residential property market need not be long-term however, and in light of the decline in the rate of increase of building costs to 6.2% in the first half of 2006 from 17.5% in 2005 (BER, 18 July 2006), as well as increased Government expenditure on infrastructure ahead of the 2010 FIFA World Cup, the predicted strength of the industrial market in 2006 and office sector in 2007 (JHI, 2006), there may well be cause for cautious optimism.
1.2.7 The Equity Market
During 2005, the JSE all share index realised a return of 43%, following a 20% return in 2004. In the first half of 2006, a weakening rand relative to the US dollar has given new life to export-reliant stocks on the JSE and the index has advanced by a further 10%. The combination of the depreciated rand, positive economic forecasting for South Africa and strong domestic demand has buoyed the stock exchange to record highs during the first half of 2006. Whilst the devaluation of the rand had the expected effect on export-reliant stocks, retail and financial services, which typically lose value with a devaluation of the rand have suffered few ill effects. This is a demonstration of the confidence shareholders currently maintain in the economy.
1.2.8 Savings and Investment
The South African economy has typically suffered from low levels of domestic savings. There was a steady decline in savings as a percentage of GDP throughout the 1980s and whilst net savings has increased though the 1990s, it has up until now remained at between 13% and 18% of GDP. The South African Savings Institute (2005) believes that a savings rate of 20% of GDP is necessary for sustained growth of about 3%. Savings, especially household savings, are seen as a crucial prerequisite to fostering a more developed economy. That said, saving just for the sake of saving will not necessarily help sustain growth in South Africa, and domestic savings need to be directed into productive investments such as plants and machinery. If investment demand cannot be met locally, then investors are forced to obtain capital from overseas sources, raising the cost of capital for new projects.
5

Savings amongst households in the South African economy averages only 3% of GDP and a mere 0.5% of household disposable income (South African Savings Institute, 2005). The increase in the dependency ratio in households in South Africa due to the spread of HIV/AIDS will place further pressure on the ability of households to save as the amount of disposable income per household declines.
1.2.9 Foreign Direct Investment
The recent influx of FDI in South Africa is hopefully a sustainable change from the historically low levels of FDI experienced through the 1980s and 1990s. Major investments from General Motors (GM), Barclays Bank and Sander International Textiles have been seen as a major vote of confidence in the South African economy by large multinationals.
1.2.10 Forecasts for the South African Economy The Bureau for Economic Research (BER) forecasts that GDP growth for 2006 will be 4.3%, declining to 4.1% for 2007. Domestic spending is not expected to contract, but will merely decelerate from recent levels of between 6% and 7% to around 4%. Leading role players in business believe that South Africa now has to take advantage of its strong financial position to promote long-term growth. Infrastructural investment spending, addressing the skills shortage and the inflexible labour market were seen by business as the key shortcomings for government to address in order to achieve sustainable growth and employment.
1.3 The eThekwini Municipality in a National Context 1.3.1 Population
According to 2004 estimates, the eThekwini Municipality is home to approximately 3.13 million people and has a 7% share of the total South African population, making the metropolitan area the second most populous municipality in the country. The metropolitan area is consequently one of the more significant regional contributors to the South African labour force. It is estimated that 7% of the 30 million working age adults in the country and 6% of South Africa’s strictly defined labour force2 of 16 million participants live in the eThekwini Municipality. More detailed analysis of the population and workforce is to be found in chapter 3, section 3.2.
1.3.2 Contribution to National Output
The eThekwini Municipality plays a major role in the South African economy. The metropolitan is the economic hub of KwaZulu-Natal, contributing just under 75% of its output in 2005. The GDP generated by eThekwini in 2005 amounted to R135 billion. In national terms, eThekwini is the third largest economic centre and accounts for 10% of South Africa’s economic output. The economy of the eThekwini Municipality is centred on the transport and logistics activities of the Port of Durban. The metropolitan area contributes to the South African economy a greater share of the transport and communication sector (15.6%) when compared to the share contributed to any of the other officially recognised sectors. The metropolitan economy also has a strong manufacturing base; manufacturing industries generated 24.4% of the metropolitan’s GDP in 2005 and this sector contributed 13.6% of South Africa’s total manufacturing value added.
6

% sectoral contribution of eThekwini Municipality to total South African GDP
15.6%
13.8%
10.9%
9.8%
9.6%
8.5%
8.1%
7.1%
5.5%
0.6%
0.0% 2.0% 4.0% 6.0% 8.0% 10.0% 12.0% 14.0% 16.0% 18.0%
Transport and communication
Manufacturing
Wholesale and retail trade; cateringand accomodation
Community social and other personalservices
Finance and business services
Construction
Electricity and water
Central government services
Agriculture, forestry and fishing
Mining
Figure 1.1: Sectoral shares of national GDP, 2004
The above graph presents the percentage contribution to the South African economy of the metropolitan economy in respect of each of the ten officially recognised economic sectors.
Tourism, centred on the Durban beachfront, is the third major component of the metropolitan economy. Tourism is not recognised in the national statistics as a separate economic sector and is split across several sectors including the wholesale and retail trade; catering and accommodation sector and the transport and communication sector. A detailed analysis of the tourism industry in the metropolitan area is included in chapter 4. More detailed general analysis of the metropolitan economy is to be found in chapter 3, section 3.1. 1.4 Conclusion The general prospects for the South African remain good, with the global commodities market set to experience continued if not spectacular demand for non-agricultural commodities, which would benefit eThekwini directly via the activities of the port. It remains the case however, that continued oil price volatility could play havoc with growth opportunities. This chapter has further shown that the eThekwini economy is a substantial contributor to both provincial and national GDP, and the following chapters will provide detailed analysis of the state of this economic powerhouse.
7

Performance and Outlook
CHAPTER 2
ETHEKWINIMUNICIPALITY8

2.0 Introduction
Durban has the potential to be the showcase city of Africa. It has the climate, the history, the cosmopolitan cultural mix, the coastal location, wildlife, scenic landscapes, adventure, sport infrastructure and the basic tourism infrastructure to build on. In a recent Reader’s Digest survey of six South African cities, Durban was found to be the friendliest and had it been in the global survey its score would have placed it amongst the top ten friendliest cities surveyed worldwide. This chapter will provide a broad synopsis of some of the major challenges and opportunities facing the eThekwini Municipality, and will outline the key responses necessary.
2.1 The Role of the Municipality
The eThekwini Municipality, in its Purpose Statement, sees its role as being to
“facilitate and ensure the provision of infrastructure, services and support, thereby creating an enabling environment for all citizens to utilise their full potential, and access opportunities that will enable them to contribute towards a vibrant and sustainable economy with full employment, and thus create a better quality of life for all.”
It has also drafted an ambitious Vision Statement, with the aim that
”By 2020 the eThekwini Municipality will enjoy the reputation of being Africa's most liveable city, where all citizens live in harmony. This vision will be achieved by growing its economy and meeting people’s needs so that all citizens enjoy a high quality of life with equal opportunities, in a city that they are truly proud of.”
Significant challenges remain in the pursuit of this worthy vision, however, and a significant proportion of the municipality’s citizens remain caught in a poverty trap.
2.2 Major Health Issues Pollution – air, water and street litter – remains a serious challenge in many parts of the metropolitan area, and health problems abound. The population remains trapped by the scourge of tuberculosis, HIV / AIDS, respiratory illnesses and other poverty and pollution related diseases. Perhaps the biggest challenge facing the eThekwini Municipality during the first half of the 21st century is the reality of the HIV / AIDS epidemic. Enormous resources are being ploughed into meeting this challenge. However, the social cost of the disease cannot be measured in financial terms. The worst impact is on the lives of the afflicted, on those who depend on them (and especially on children who are orphaned as a result) and on the lives of all who care for and support HIV / AIDS sufferers. Sadly the die is largely cast in this regard and the ultimate triumph of the eThekwini community over this disease will stand one day as a tribute to the spirit of “ubuntu” for which the people of KwaZulu-Natal are renowned. Section 3.8 will analyse the current state of the epidemic.
2.3 Meeting Infrastructural Challenges Traffic, for the most part flows relatively well in Durban, compared to most cities of a comparable size around the world, although strains have begun to show in the areas of the municipality where extensive development has recently taken place such as Mount Edgecombe, Umhlanga Rocks, Ballito, Hillcrest, Westville, Umhlatuzana, Chatsworth, Clairwood, Bayhead and Prospecton. Certain suburbs such as Amanzimtoti, Umlazi, Chatsworth, the Old Main Line suburbs and Kwa Mashu are relatively well served with commuter rail infrastructure and buses, complemented by the ubiquitous mini-bus taxis which provide cheap and reasonably convenient commuter transport. There are, unfortunately, two glaring gaps in the present transport infrastructure in the metropolitan area. One is the lack of an unconstrained international airport capable of serving wide-bodied airliners with maximum payloads. The other is in the inner city. There is no safe, comfortable,
9

reliable and frequent system of mass public transport linking the main tourism and recreational attractions in and around the Durban central business district and beachfront. The announcement in August 2006 that work will commence immediately on construction of the Dube Tradeport and King Shaka International Airport at La Mercy will address the first gap. A plan is now needed to develop a transport system linking the Durban Point area, the Beachfront, the Kings Park Sports precinct, Blue Lagoon, Florida Road, Mitchell Park, Bulwer Park, The Botanic Gardens, Warwick Triangle, the Victoria Street Market, Grey Street, Wilson’s Wharf, the Yacht Mole, the City Hall precinct, the BAT Centre and the Durban International Convention Centre. It is hoped that the municipality’s recently announced plans for a new tram system, which is in the process of being planned with the specific aim of moving tourists between the main attractions, will address the second problem. Pedestrian walks and cycle tracks to allow the exploration of Durban at leisure are also being planned (Aarde, 2006).
2.4 Crime, Housing and Education Another area of concern is the high incidence of muggings and petty theft in Durban’s streets. Personal safety is non-negotiable in any serious international tourist destination, and Durban currently fails on this score, with incidents of theft even occurring frequently within supposedly secured areas. Durban has to aspire to achieving safety on its streets 24 hours a day and 365 days a year if it is to attract the global tourism market that potentially exists. In order to address this, the municipality has recently announced that safety and security will be improved by targeting “bad buildings” where criminals take refuge (Aarde, 2006). A more detailed breakdown of crime in the metropolitan area is provided in Section 3.9 of chapter 3. Another basic need that remains to be addressed in its entirety is the housing shortage. Rural to urban migration continues at a relentless pace as young people, seeking to escape the lack of employment opportunities in the rural areas of South Africa and elsewhere in Africa, are attracted to move to the relative sophistication and opportunities offered by a city such as Durban. The impact on the population pyramid of the eThekwini Municipality is dramatic and will be discussed section 3.5 of chapter 3. The education and skill level of the population of the eThekwini Municipality is far above the provincial and national average and this is a major strength of the region. The challenge in this regard is primarily in respect of affording immigrants to the metropolitan area access to skills training and employment opportunities. Section 3.6 will look at the status of education in the metropolitan area.
2.5 The Port of Durban: A Matchless Opportunity The Port of Durban is a major asset to the country and a vital transport link between the economic centre of South Africa and the rest of the world. The first harbour master at the port was appointed in 1839 and the port currently handles more than 4,000 commercial vessels per annum at its 57 berths. Initially developed with imports in mind, the port has since become an important link in South Africa’s export chain. The port is the busiest in Africa and has the largest container carrying capacity. As such, the port is an important employer and source of income for the city and its contribution towards growth in the cities transport sector, as well as its ability to offer the city a competitive advantage in the important manufacturing sector cannot be underestimated. The Port of Durban dominates the maritime economy of the south-west Indian Ocean. However, the port suffers from its success, with serious congestion occurring on both the water and land sides of the overall port operation. Plans are in place to address the waterside constraints with an ambitious project to double the width of the harbour entrance to permit simultaneous entry and exit of shipping. Construction work on this project is already underway. The landside constraints are a much bigger challenge. The releasing by the South African Navy of Salisbury Island for harbour activities will temporarily ease the shortage of quays and the construction of the Kangela Bridge will improve access to the Bayhead area for trucks carrying freight containers, but more imaginative solutions will be required long-term if the Port of Durban is not going to be smothered by its own success (National Ports Authority).
10

A major strength of the metropolitan area is its geographic location. The coastal location and its status as the main port to Johannesburg and Gauteng as with the good rail and road links to the hinterland ensures the city will always play an important strategic part in South Africa’s international trade links.
2.6 Unique Climate and Culture The subtropical climate of the metropolitan area with its pleasant winters and humid summers is a major draw card for tourists and residents alike. The pleasant weather offers residents and tourists the ability to enjoy a range of outdoor activities, not the least of these being the miles of sandy beaches and the warm Indian Ocean waters. With temperatures seldom falling below ten degrees and reaching summer peaks of around 35 degrees, the climate is perfect for sporting and cultural events and festivals. With its fascinating history of immigrants from a variety of continents and its strong African heritage linked to the Zulu nation, the city is often described as a cultural melting pot. Since the arrival of the first Europeans and the indentured Indian labourers, the city has been developing a style and feel that is unique. The metropolitan has the largest Indian population outside of India and their presence can be felt through their unique culture and influence on enterprise, fashion and cuisine.
2.7 An Efficient Municipality The eThekwini Municipality incorporates a large area of land that was allocated to various groups and peoples under the previous regime, and it includes tribal, agricultural and urban areas. The current municipal structure has had to incorporate many previously unaligned areas into one managed area. Whilst the difficulties involved are immense and backlogs in service delivery exist, the metropolitan has an advantage in that the old Durban Municipality brought with it a strong well managed system. With expertise and locally managed water and electricity services the metropolitan government can boast some of the best municipal services in the country. According to the office of the Deputy Mayor, eThekwini is the best run municipality on the African continent, with the best credit rating (AA) in South Africa and it is one of the few debt-free cities in South Africa.
2.8 Key Investment Areas The eThekwini Municipality is intent on attracting call centre and business process outsourcing to the city. The advantages are the skilled workforce and new initiatives like Smart Xchange – a state of the art communications infrastructure. The case for business process outsourcing is a strong one and the eThekwini metropolitan area enjoys clear advantages over what is perceived as its main competitor – India. Firstly, the metropolitan area falls into the same general time zone as Europe. Secondly, the metropolitan area offers an abundance of skilled labour readily trainable in call centre work, and given its historically strong British ties a solid pool of European language skills. Government is committed to training call centre staff, and given South Africa’s existing local call centre network, management skills are available. Thirdly, the local infrastructure in information technology is world class and there exist excellent local information technology companies of a world class standard. Finally, businesses based in the eThekwini Municipality can deliver call centre services at approximately half the cost of European and North American centres. Local government has identified the information technology and communication (ICT) sector as another area where eThekwini has a competitive advantage. Given the available pool of 1200 ICT graduates from the province’s main universities, plus hundreds of diploma graduates entering the job market every year, and the fact that wages are typically 20-30% below that of Gauteng, let alone the discount on global remuneration levels, significant opportunity exists for ICT investment and development. Most large South African IT companies have offices in the eThekwini Municipality and local government has formed an ICT cluster to enhance skills sharing.
2.9 The International Convention Centre (ICC) The Durban International Convention Centre (ICC) is a major asset for the city and since its completion in 2000 has hosted over 140 major conferences, exhibitions and events; not to mention
11

the hundreds of smaller functions. Amongst the major highlights have been the 14th Non-Aligned Movement (NAM) Ministerial Conference, the Southern African AIDS Conference and the recent International Sociological Association Congress. As the annual host of the South African Tourism Indaba it is a major draw card to tourist and business travellers alike, and with the completion of the 10,000 seat auditorium, the ICC is set to play an even bigger role as a catalyst to tourism and investment in the city. The total cost of the additions to the ICC are in excess of R460 million and reflect both the initial success of the conference facility and faith in its ability to continue to hold major international conferences. In addition through 2005 and 2006 the ICC has hosted more than 110 major conferences, concerts and other events including:
• The International Sociological Association Congress (3000 delegates) • SA Institute of Environmental Health (400 delegates) • The International Transport Workers Federation 41st Congress (1200 delegates) • The Water Institute of SA Congress (800 delegates) • SAPOA 2006 Convention (1000 delegates) • The Economy Summit (400 delegates) • Wild Talk Africa Conference (400 delegates) • 8th World Conference on Injury Prevention and Safety Promotion (2000 delegates) • The Presidents Emergency Plan for AIDS Relief Annual Meeting (1000 delegates) • South African AIDS Conference (4000 delegates) • International Conference on Nutrition (3000 delegates) • World Conference on Physics and Sustainable Development (500 delegates) • Indaba 2005 and 2006 (2000 delegates) • KORA All Africa Music Awards (3500 delegates)
2.10 The Film Industry The film industry in eThekwini Municipality and in KwaZulu-Natal as a whole is generally underdeveloped and opportunities for local film industry workers as well as foreign film crews exist. Durban and the province possess a variety of landscapes in a small area for a variety of film locations. The advanced infrastructure and skilled workforce are draw cards for international film crews. With locations which can replicate European and North American environments, low production costs and unspoilt natural landscapes, KwaZulu-Natal with Durban as its base has the potential to become a choice location for the film industry. Since its inception in late 2003 as a special purpose vehicle of the eThekwini Municipality, the Durban Film Office has facilitated over 230 commercial and feature productions both in the city and the province. By supporting the local film industry, the municipality aims to position Durban as a globally competitive film city, and thereby reaping the benefits of increased tourism, job creation and the development of core skills and SMME’s. The strategic aim is to increase Durban's global film making share to 3% by 2008. Most recently the Durban Film Office has been involved in facilitating two film major productions, Dhoom 2 and The Blood Diamond, both shooting on location in KwaZulu-Natal.
2.11 Conclusion Health, infrastructure, crime, education and poverty are amongst the key challenges for the municipality outlined in this chapter, while the continued strength of the port and emerging business opportunities show that prospects remain optimistic on many fronts. The next chapter will take an extensive, in depth look at the key indicators that have been referred to here, while chapter 4 will further break down the economy into its major components, identifying key areas for growth and investment.
12

eThekwini Municipality in a Provincial and National Context
CHAPTER 3
ETHEKWINIMUNICIPALITY13

3.0 Introduction
The eThekwini Municipality is blessed with a vibrant economy which is amongst the largest and most important in South Africa. This chapter begins with a broad assessment of the position of the metropolitan area in relation to the province, other cities and the country at large and an introduction to its unique rural-urban mix. Thereafter the metropolitan’s demographic and employment statistics will be discussed, and the chapter will end with a focus on education, poverty, health and crime, all of which are key challenges for the future development of the metropolitan area.
3.1 eThekwini Municipality in a Provincial and National Context
The eThekwini metropolitan area boasts a vibrant economy with a diverse range of economic activity. The municipality is the economic hub of KwaZulu-Natal, contributing just under 75% of its output in 2005. The gross domestic product (GDP) generated by metropolitan area in 2005 amounted to R135 billion. In national terms, the municipality is the economic hub of the county’s second biggest province, and accounts for 10% of South Africa’s economic output. The national contribution of metropolitan area in 2004 compared favourably with that of Johannesburg (15%) (figure 3.1) It is also clear from figure 3.1 that overall the contribution of metropolitan areas to the South African economy is very significant, over half (54%) of national economic output (GDP) is generated in these large urban areas (figure 3.1)
Nelson Mandela(Port Elizabeth)
3%City of Cape Town
11%
Ekurhuleni Metropolitan Municipality(East Rand)
8%
City of Johannesburg Metropolitan Municipality
15%Ethekwini Municipality
(Durban)10%
Non-metropolitan(Other)
46%
City of Tshwane Metropolitan Municipality
(Pretoria)7%
Figure 3.1: The contribution of metropolitan areas to South African GDP, 2004
The economy of the eThekwini Municipality has a strong manufacturing base with manufacturing industries generating 24.4% of the metropolitan GDP in 2005. Figure 3.2 depicts the changes in the composition of the metropolitan economy over the past decade (1995-2005). While manufacturing remains a large contributor, the relative importance of the sector in the metropolitan area has declined over the past decade. By contrast the services sectors, more specifically finance, business and real estate; wholesale and retail trade and transport and communication have grown in relative importance. There was a particularly notable leap in the contribution of transport and communication services to the metropolitan economy, from 12.7% in 1995 to 15.9% in 2005; this is not surprising given that the Port of Durban is South Africa’s dominant general cargo port and that the Durban – Johannesburg freight corridor is the busiest in the country. The relative contribution of the general government service sector declined quite markedly from 13.1% in 1995 to 9.4% in 2005.
14

26.7 24.4
19.1 21.5
14.5 16.6
12.715.9
6.2 5.53.3 3.0
13.19.4
2.02.71.31.2
0%
20%
40%
60%
80%
100%
1995 2005Year
% o
f tot
al eT
hekw
ini G
DP
Mining and quarrying
Agriculture, hunting, forestry andfishingElectricity, gas and water supply
Construction
Community, social and personalservicesGeneral government services
Transport, storage andcommunicationWholesale and retail trade
Financial, insurance, real estate andbusiness servicesManufacturing
Figure 3.2: The changing composition of the economy of the eThekwini Municipality, 1995 vs. 2005
The absolute contributions of the three largest metropolitan areas to different sub-sectors of the national economy are compared in figure 3.3 The eThekwini Municipality reflects the largest share of the national transport and communication industry of any single metropolitan area in South Africa – 15.6% of total GDP compared to around 12% in Johannesburg and Cape Town. The contribution of the eThekwini Municipality to manufacturing, community, social and personal services and agriculture, forestry and fishing also compares favourably to that of the two other major metropolitan’s in South Africa. The municipality lags behind Johannesburg and Cape Town with respect to wholesale and retail trade, finance and business services and construction.
0.6
5.5
7.1
8.1
8.5
9.6
9.8
10.9
13.8
15.6
0.3
6.1
7.5
8.1
14.1
17.4
9.6
12.4
11.0
12.2
3.3
1.5
13.8
16.5
17.6
24.1
10.8
17.0
14.8
12.4
0 5 10 15 20 25
Mining
Agriculture, forestry andfishing
General government services
Electricity and water
Construction
Finance and businessservices
Community, social and otherpersonal services
Wholesale & retail tradecatering and accommodation
Manufacturing
Transport and communication
Percentage of total South African GDP
City of JohannesburgMetropolitan
City of Cape TownMetropolitan
eThekwini Metropolitan
Figure 3.3: Sectoral shares of national GDP by major metropolitan areas, 2004
15

3.2 Climate
The eThekwini metropolitan area can be typically described as humid sub-tropical with a warm winter and an extremely humid summer period around January and February. Temperatures seldom fall below 10 degrees centigrade in the winter. Summer temperatures move into the lower thirties and humidity is typically between 55% and 75%. During the winter months Durban receives 60-70% of possible sunshine, declining in summer as cloud clover and summer showers increase. However due to the metropolitan area’s size and extreme variance in topography, weather conditions vary greatly with the coastal areas associated with central Durban not subject to the greater extremes of temperature experienced in the outlying regions.
3.3 Land Use Map 3.1: Land Use in the eThekwini Municipality
The eThekwini Municipality is unique amongst major urban centres in that only 35% of the metropolitan area is predominantly urban, with over 60 000 households living in traditional rural style dwellings. The municipality stretches along the coast from Umkomaas in the South, to Tongaat in the North, and stretches inland to Cato Ridge. It incorporates vast swathes of rural hinterland in the northwest and southwest of the city, including tribal areas in Ndwedwe as well as in Umbumbulu on the South Coast. The eThekwini Municipality has an area of 2297 square kilometres, of which 36% is rural and a further 29% is peri-urban (SA Cities Network).
Urban core
Urban periphery
Peri Urban
Rural
Peri Urban
Rural
Peri Urban
16

Table 3.1: Land Use in the eThekwini Municipality Urban Urban Periphery Peri-Urban Rural Area (ha) 33400 45200 65700 85500 Area (%) 15% 20% 29% 36% Density (people/ha) 24 38 5 2 Population 27% 56% 11% 6%
3.4 Demographics
The eThekwini Municipality has the second-largest population of any municipality in South Africa. In 2004 there were an estimated 3.13 million people living in the metropolitan area, a population almost as great as that of the country’s largest city Johannesburg, which is home to approximately 3.22 million people1.
Figure 3.4 Ethekwini Municipality and KwaZulu-Natal Population Pyramids, 2004. The population pyramids in figure 3.4 provide a comparison of the age and sex profiles of eThekwini Municipality and the province as a whole in 2004. The basic demographic profile of the metropolitan area differs quite dramatically from the KwaZulu-Natal profile; the metropolitan profile does not follow the typical pyramid shape but is swollen in the middle by a larger proportional representation of men and women aged 20 to 34. The most likely explanation for the disproportionate number of persons aged 20 to 34 living in the metropolitan area is that these working age adults migrate to the metropolitan, the economic hub of the province, in search of work. As a result the metropolitan area has more than 1.5 million people between the ages of 15 and 39, representing nearly half the total inhabitants of the municipality. In addition, it would appear that more men migrate to the metropolitan area in search of employment than women because the male population between the ages of 20 and 34 exceeds the corresponding female population by approximately 37000 people (figure 3.4). By contrast the female population exceeds the male population in every cohort of people aged 40 and older.
Figure 3.5 Demographic breakdown of largest metropolitan areas by ethnic group, 2004
1 According to estimates from the Quantec Standardised Regional Demographic Series
17

Each of South Africa’s three largest cities has a distinct cultural and ethnic composition. In the eThekwini Municipality the majority of the population is black (68%) with the metropolitan also being home to South Africa’s largest Indian population who represent 20% of the city’s total population.
3.5 The Labour Market
In 2005, South Africa had a working age population of 29.5 million and a substantial 8.2% of the working age population was living in the eThekwini Municipality.2 Of the 2.6 million working age adults living in the metropolitan area, 1.56 million are part of the strict labour force3, which encompasses both employed and unemployed individuals. The labour force participation rate4 in the metropolitan area was therefore approximately 60% in 2005 and while this exceeded the participation rate in KwaZulu-Natal as a whole (52%) it was lower than the rates in most of the other metropolitan areas such as Johannesburg (69%), Cape Town (65%) and Tshwane (63%). The reasons for the relatively low labour force participation rate in the metropolitan area are not clear as an individual’s decision to enter the labour force (and look for work) is influenced by a variety of factors which range from the prevailing market conditions (i.e. employment prospects), their household income, level of education, the number of breadwinners in his or her household, etc (Dias, 2005: Casale and Posel, 2001). Table 3.2 Comparing employment and unemployment in major metropolitan areas, 2005
% Contribution toNational
EmploymentStrict Unemployment
Rate
City of Johannesburg Metropolitan 11.8% 20.2%City of Cape Town Metropolitan 9.5% 20.7%Ethekwini Municipality (Durban) 8.2% 34.4%Ekurhuleni Metropolitan (East Rand) 6.9% 27.5%City of Tshwane Metropolitan (Pretoria) 6.2% 19.9%Nelson Mandela Metropolitan (Port Elizabeth) 2.6% 30.8%Non-Metropolitan Areas 54.8% 27.5%
Unemployment is one of the greatest challenges facing the municipality - the metropolitan area suffers from the highest unemployment rate of any metropolitan area in the country. According to Statistics South Africa’s labour force survey estimates, there were 1 029 342 persons employed within the municipality in 2005 while the remaining 538 610 members of the labour force were unemployed. It follows that the strict unemployment rate in the eThekwini Municipality in 2005 was 34.35%. This figure compares unfavourably with the significantly lower unemployment rates experienced in Johannesburg (20%) and Cape Town (21%) (table 3.2).
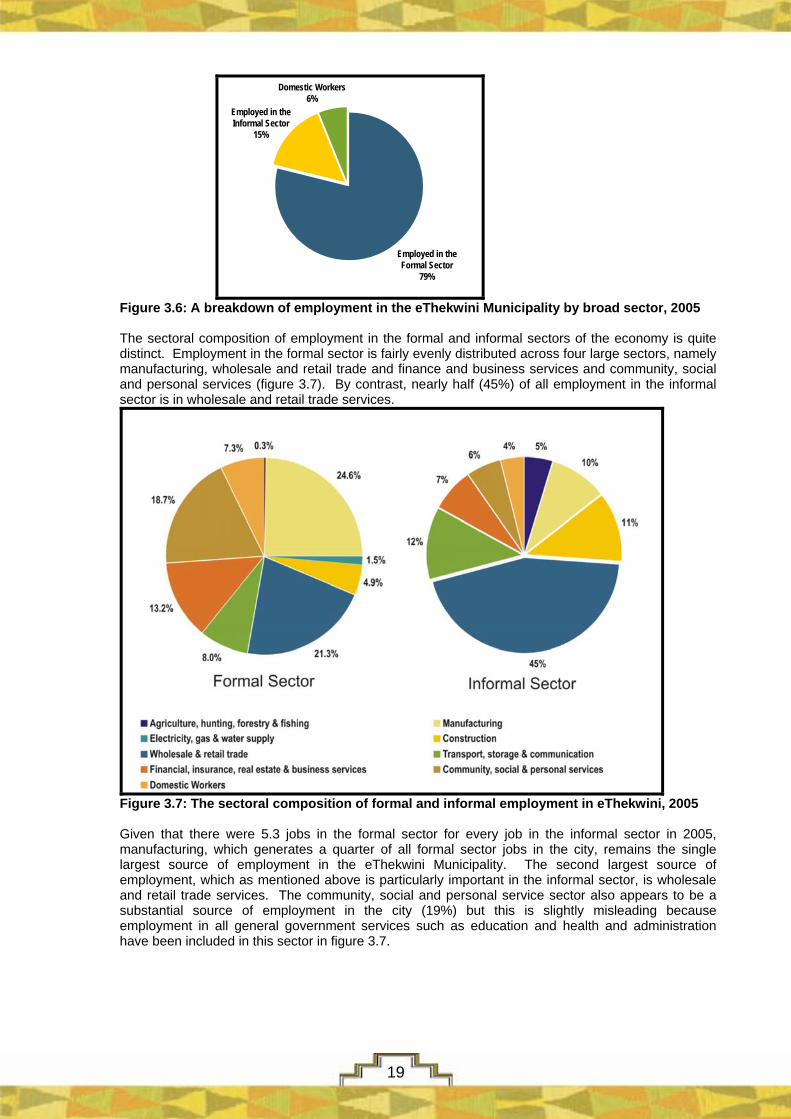
The metropolitan area nevertheless makes an important contribution to employment at both a provincial and national level (Table 3.2). The eThekwini metropolitan economy generates 8.2% of all employment in South Africa and nearly half of total employment in KwaZulu-Natal (47.4%). eThekwini ranks as the third largest metropolitan in terms of its contribution to national employment, behind only Cape Town and Johannesburg (table 3.2). From figure 3.6 it is clear that the vast majority of employment in eThekwini, nearly 80%, lies in the formal sector of the economy, but that the informal sector contributes a substantial 15% to employment in eThekwini. This can be compared with an 18% contribution by the informal sector to employment in Johannesburg and 11% in Cape Town. Employment in domestic work alone accounts for 6% of total employment in the city.
2 Estimates from the Statistics South Africa Labour Force Survey, 2005 3 The strict labour force consists of all individuals who are employed or who are actively seeking employment. It does not include individuals who are willing to work but have become disillusioned with the job search and are no longer actively looking for employment. 4 The labour force participation rate is the percentage of the total labour force divided by the total working age population.
18
Employed in the Informal Sector
15%
Domestic Workers6%
Employed in theFormal Sector
79%
Figure 3.6: A breakdown of employment in the eThekwini Municipality by broad sector, 2005
The sectoral composition of employment in the formal and informal sectors of the economy is quite distinct. Employment in the formal sector is fairly evenly distributed across four large sectors, namely manufacturing, wholesale and retail trade and finance and business services and community, social and personal services (figure 3.7). By contrast, nearly half (45%) of all employment in the informal sector is in wholesale and retail trade services.
Figure 3.7: The sectoral composition of formal and informal employment in eThekwini, 2005
Given that there were 5.3 jobs in the formal sector for every job in the informal sector in 2005, manufacturing, which generates a quarter of all formal sector jobs in the city, remains the single largest source of employment in the eThekwini Municipality. The second largest source of employment, which as mentioned above is particularly important in the informal sector, is wholesale and retail trade services. The community, social and personal service sector also appears to be a substantial source of employment in the city (19%) but this is slightly misleading because employment in all general government services such as education and health and administration have been included in this sector in figure 3.7.
19

3.6 Education in the eThekwini Municipality
Educational attainment and skills development are widely believed to be one of the most critical elements of sustainable economic growth and human development. Investment in quality education is imperative in the context of an increasingly globalised and service driven world economy that has become progressively more skills-intensive. “Education - in particular, primary and lower-secondary education - is critical for economic growth and reduction of poverty, especially at a time when, as a result of technological change and economic reform, labour market structures are shifting dramatically.” (World Bank, 1995:17)
The eThekwini Municipality, along with all other municipalities in South Africa faces an enormous challenge in addressing the historical inequalities in access to education. While substantial progress has been made in increasing enrolment in primary and secondary education, historical differences in the quality of education provided across schools in South Africa and within the metropolitan area remain. Several recently published studies suggest that it is not education per se but quality schooling that produces clear benefits in terms of economic development and growth “[S]chool quality… has a remarkable impact on differences in economic growth” (Hanushek, 2005), and in 2005, the Ministry of Education stated that the provision of a better quality education had been identified as a national priority.
The salient features of education in the metropolitan area are summarised in figure 3.8 which graphs the population by the highest level of education obtained by individuals between the ages of 20 and 64 in 2005. It reveals that 5% of the working age5 residents of eThekwini have no schooling, 8% had some level of primary school education and further 46% had incomplete secondary education. Taken together, these statistics suggest over 40% of the working age population of the eThekwini Municipality have a secondary or tertiary education.
Senior Certificate (matric)
31%
No schooling 5%
Post-matric diplomas/ certificates
6.3%
Fully or partially completed primary
8%
Partially completed secondary
45.5%
Bachelors Degree
3%
Honours, masters or doctorate 1.5%
Figure 3.8 Education profile of persons aged 20-64 in eThekwini, 2005
Figure 3.8 also shows that only a fraction of the working age population of the metropolitan area hold a university degree; 3% have completed an undergraduate degree while only 1.5% have a post-graduate qualification.
5 The Working age population was approximated by restricting the sample to all those individuals that were between the ages of 20 and 64in 2005.
20

0%
5%
10%
15%
20%
25%
30%
35%
40%
45%
50%
No schooling Fully or partiallycompleted primary
Partially completedsecondary
Senior Certificate(matric)
post-matricdiplomas/certificates
Bachelors Degree Higher Degree(honours, masters or
doctorate)
Highest Level of Education Obtained
Popu
lation
aged
20-6
4Cape Town
Ethekwini
Johannesburg
Figure 3.9: A comparison of the education profiles of three major metropolitan areas, 2005
In figure 3.9 it is possible to draw a comparison between the education profiles of South Africa’s three largest metropolitan areas. At a broad level the education profiles of Johannesburg, Cape Town and eThekwini appear to follow the same distribution - roughly 50-60% of the population has incomplete schooling, 30% have obtained a senior certificate and the remaining 10-15% have some form of higher education. However on closer inspection, it becomes apparent that the populations of Johannesburg and particularly Cape Town have achieved levels of education that are consistently higher than that of the eThekwini Municipality across the full education spectrum. A larger proportion of the population of the eThekwini Municipality have no schooling, primary schooling and incomplete secondary schooling and the city’s population is noticeably under-represented in the tertiary education categories. One explanation for the relative scarcity of individuals with the highest levels of education in the metropolitan area is that the Johannesburg metropolitan area is the economic hub of South Africa and it is therefore able to attract and retain large numbers of university graduates from across the country.
Within the metropolitan area population (aged 20-64) historical differences in the level of educational attainment between races groups persist and these are particularly noticeable at the two extremes of the education spectrum. Estimates from the Statistics South Africa labour force survey (September 2004) suggest that 49% of the white population of the metropolitan area has some form of higher education compared to 10% of the Indian population and only 5% of the black population. By contrast, 4.7% of the metropolitan area’s black population and 1.7% of the Indian population have no schooling while the number amongst the city’s white population is negligible.
3.6.1 Primary and Secondary Schooling
The eThekwini Municipality has the largest school going population of any metropolitan area in South Africa, with 7% of all learners in the country attending schools in the municipality. There are 1451 primary and secondary schools in the metropolitan area, of these 74 schools (5%) are independent schools (privately funded) while 95% are public schools (DoE, 2006). A total of 830 789 learners were enrolled in schools in the metropolitan area in 2004; 60% of these were enrolled in primary schools while the remaining 40% were enrolled in secondary schools (DoE, 2006).
The number of learners per educator in combined, primary and secondary schools in the eThekwini Municipality is graphed in figure 3.10 for the years 2004 and 2006. The learner-educator ratio provides one with a rough indication of whether schools in the city are, on average, adequately staffed. It is also interesting to distinguish between total educators and state-paid educators as this gives one a sense of whether schools would be adequately staffed in the absence of parent-funded educators (governing-body positions). It is encouraging to note that all learner-educator ratios in the
21

metropolitan area’s schools improved (fell) between 2004 and 2006 (figure 3.10). However, it is also clear that state funding for educators is limited, because the class sizes in the absence of parent-body funded educators would be unmanageable, particularly in the case of combined and primary schools where in 2006, the learner-to-state paid educator ratios were 39 and 56 respectively. The governing-body funded educator posts reduce the total learner-to-educator ratio to 34 for primary schools and 31 for secondary schools and these figures are roughly in-line with the national averages.
Figure 3.10 Learner-to-educator ratios in eThekwini Municipality schools, 2004 and 2006 Promotion, repeater and dropout rates can be used to detect inefficiencies in the schooling system (Muller, McGill and Skinner, 2006). In primary schools in the eThekwini Municipality, 96.5% of learners pass grades 1 to 7 and are promoted while 2.7% repeat and 0.7% drop out of school. Promotion, repeater and dropout rates are fairly consistent throughout the primary schools years with the exception of grade 1, which has an above average repeater rate of 5.4%. Dropout and repetition rates increase substantially in the late secondary schooling years. According to data from the KwaZulu-Natal Education Information Management System, a startling 12% of the metropolitan’s grade 10 learners and 13% of the grade 11 learners are repeating their 2005 school year in 2006. In addition the previous year’s statistics suggest that a further 3% of both grade 10 and 11 learners are likely to drop out of school in 2006.
The Senior Certificate Examination (SCE) results are one of the few sources of data by which differences in the quality of education provided in South Africa can be assessed. The senior certificate results for the metropolitan area and for KwaZulu-Natal as a whole can be compared in figure 3.11 for 2003 and 2004. The average pass rate for candidates sitting the senior certificate exams in the metropolitan area fell consistently between 2003 and 2005. While the proportion of candidates who obtained passes without endorsement remained constant at roughly 53%, the number of candidates who obtained passes with endorsement fell from 30% in 2003 to 25% in 2005 as the failure rate increased. Since a pass with endorsement is a prerequisite for university entrance, the fairly serious implication of a decline in the number of candidates who achieved passes with endorsement is that a large and increasing number of senior certificate graduates in the metropolitan area will not have the opportunity to go on to higher education.
Nevertheless, the metropolitan area continues to outperform KwaZulu-Natal in the senior certificate examinations, the metropolitan achieved a higher overall pass rate and a significantly higher proportion of passes with endorsement in both 2003 and 2004. While the SCE results for other metropolitan areas in South Africa were not readily available, the metropolitan area’s results for 2004 compare favourably with those in the Western Cape which achieved the highest pass rate (85%) and the highest number of endorsements (27%) of any province in the country.
22

Figure 3.11 Senior Certificate Examination results in the eThekwini Municipality and KwaZulu-Natal 2003-20056
3.6.2 Higher Education
Higher education (HE) plays a critical role in the development of the skills-intensive labour force and in driving a country’s technological advancement. eThekwini is the centre of higher learning in KwaZulu-Natal with two large public institutions that provide higher education in the city; the recently merged University of KwaZulu-Natal, which has four different campuses within the city and a campus in Pietermaritzburg, and the Durban University of Technology which was previously known as the Durban Institute of Technology. In 2004 the University of KwaZulu-Natal had 37 171 students enrolled in on-site or contact education programmes and a further 8 171 students enrolled in distance learning programmes. In terms of the number of students enrolled in contact learning programmes, the university is the second largest in the country after the University of Pretoria which has roughly 39 424 contact students. The Durban University of Technology had a student complement of roughly 21 887. Despite the relatively large enrolment numbers in eThekwini’s universities the participation in higher education in KwaZulu-Natal is well below the national average. In 2001 only 7% of the provinces total population of 20-24 year olds were enrolled in a higher education institution compared to the national average of 15.6% (Muller, McGill and Skinner, 2006).
In 2004 34% of all graduates and from the metropolitan area’s public higher education institutions graduated with a qualification in Business and Management (BM) while a further 30% graduated with a qualification in Science, Engineering and Technology (SET). The proportion of SET and BM graduates is higher than the national average graduation rates which were 27% in SET and 25% in BM (DOE, 2006).
3.7 An Assessment of Poverty and Inequality in eThekwini Municipality Poverty is without a doubt a major problem in the eThekwini Municipality, and according to a Quality of Life survey commissioned by the eThekwini Municipality, the residents of the metropolitan area rank poverty as their greatest concern followed by unemployment and crime, which are also closely related to poverty (Coetzee et al., 2005).
The term poverty is used to describe a state of deprivation which arises from the complex interaction of several factors which typically include the lack of a minimum amount of resources that are required to meet an individuals basic needs, insufficient quantities of basic foodstuffs, inadequate access to social services and the inability to participate fully in society in either an economic, political or social sense (Muller, McGill and Skinner, 2006). In practice this turns out to be a very difficult phenomenon to measure, and a great deal of controversy surrounds the various measurement techniques.
6 SCE results for KwaZulu-Natal were not readily available at the time that this data was compiled and have therefore been omitted.
23

3.7.1 Measuring Poverty
Despite its many limitations, the headcount method remains the most simple and frequently used measure of poverty. After establishing the income necessary for a minimum standard of living necessary to subsist - a poverty line; the number of people living below that line are estimated, giving the proportion of people living in poverty. Foremost amongst the problems inherent in this method are that it does not include unearned income, such as social grants and subsistence agriculture which are usually particularly important sources of sustenance for the poor (Vermaak, 2005); and that the results of the estimations often have more to do with the choice of poverty line then the underlying situation. To help overcome this problem we have included data based on two different poverty lines. The first is that used by the Global Insight Database, which is based on the UNISA Bureau for Market Research’s Minimum Living Level. This line is described as the minimum income necessary for an average family to maintain their health and have acceptable hygiene and clothing. It currently stands at R1 950, which, given that the average minimum wage in Construction is R1 779, is a rather high level. The second line used is the international poverty line of $2 a day which is used by most international organisations. The first thing that is immediately apparent from either measure in figure 3.12, is that the eThekwini Municipality has much lower levels of poverty in percentage terms then either the National or Provincial Averages, which is not surprising given that urban dwellers are generally better off in terms of access to employment than their rural counterparts. What is surprising and worrying is the evidence of an increase in poverty levels in eThekwini akin to the increases that have occurred at a National and Provincial Level. According to the Global Insight Database Line the percentage of people living in poverty in the Ethekwini metropolitan area has increased from 27.2% in 1996 to 31.4% in 2004, while the percentage of people living on less then $2 a day almost doubled from 5.5% to 9.3% in 2004. This increase could be attributed to a number of factors, most notably, increased urbanisation. When we break down this data further and look at the spatial distribution of poverty in the metropolitan area in figure 3.13, overleaf, we see that the rural and semi-rural areas of the city are indeed the worst hit by poverty, and are the cause of much of the inflation in poverty in eThekwini. In Camperdown 54.1% of the population fall below the poverty line, while in Umbumbulu almost 64% are poverty stricken. It is clear that these areas need major attention to alleviate poverty, and that this must be where much of the Local Government’s attention must continue to be directed.
0.00%
10.00%
20.00%
30.00%
40.00%
50.00%
60.00%
National KwaZulu-Natal Durban (eThekwini)
% p
opul
atio
n liv
ing
in p
ov
Global Insight Database Line 1996 Global Insight Database Line, 2004International < $2 per day, 1996 International < $2 per day, 2004
Figure 3.12: A comparison of the percentage of the population living below two given poverty lines, 1996 and 2004
24

Figure 3.13: The Figure 3.13: Spatial and Racial Distribution of poverty in eThekwini, 2004
Figure 3.13 also shows that poverty continues to affect black Africans the most, a continuing legacy of the apartheid system and the systematic exclusion of this group from the mainstream economy. In spite of hopes to the contrary, the situation for many of the poorest of the black population has deteriorated in income generation terms. While 39.9% of the black African population lived below the poverty line in 1996, that proportion increased to 44.2% in 2004, with over 56% of the black Africans in Camperdown living below the poverty line. The white population has the lowest levels of poverty (2.7%), lower then the provincial and national averages for whites, while the level of poverty amongst Indians in the eThekwini Municipality is 7.1%.
Another method of assessing poverty is to use the poverty gap measure which measures the total amount of money necessary to lift all of those in poverty out of it to a minimum standard level (Cameron, 2005). This measure gives an indication of the scale of the task faced by the eThekwini municipal government as the poverty gap has risen from R766 million in 1996 to over R1.5 billion in 2004 (Global Insight Database, 2006), and the National Spatial Development Report indicates that eThekwini Municipality has the biggest poverty gap in KwaZulu-Natal, due predominantly to its large population (The Presidency, 2003).
3.7.2 Income Inequality
South Africa and KwaZulu-Natal both have very unequal income distributions, and these have worsened since 1996, with income inequality within the African population increasing at a particularly pronounced rate (Muller, McGill and Skinner, 2006). In eThekwini the Gini coefficient, a measure of inequality which varies between 0 and 1, where 0 is perfect equality and 1 is perfect inequality, has steadily increased. In 1996 it stood at 0.56, but by 2004 had reached 0.60. The biggest increase in inequality was recorded amongst black Africans where the Gini coefficient rose from 0.51 in 1996 to 0.61 in 2004 (Global Insight Database). This is particularly worrying given that the Gini coefficient hardly ever exceeds 0.7. Overall however, it is clear that poverty levels in eThekwini are substantially lower then the Provincial and National averages, and that much of the poverty that does exist is concentrated in the newly incorporated rural areas which are yet to benefit fully from the superior organisation of the Municipality.
3.8 Health and Health care7 3.8.1 HIV/AIDS The primary health concern in the eThekwini Municipality remains HIV / AIDS, and the Municipality and local Health Officials are making progress in terms of their response to the epidemic. At 89%, the eThekwini
7 All figures are for 2004 and sourced from the District Health Barometer unless noted otherwise in the text.
0.0%10.0%20.0%30.0%40.0%50.0%60.0%70.0%
Durban Inanda Pinetown Chatsworth Umlazi Camperdown Umbumbulu
% p
opul
atio
n be
low
pov
erty
line
Black White Coloured Indian Total
25

Municipality is approaching the target of 100% testing of antenatal clinic attendees, the second highest rate of testing of any metropolitan area after Cape Town, one significantly higher then the National Average of 48.9%. It also has a very high Nevirapine uptake rate by pregnant women of 71%, also higher then the national average of 28.68%. The recorded number of people on the antiretroviral treatment (ART) programme in KwaZulu-Natal currently stands at over 54 000 making it the highest in the country, if not in the World and hospital in the metropolitan are a crucial part of the ART programme. In spite of this, the province had an estimated 1.8 million people living with HIV / AIDS in 2004, and the eThekwini Municipality has the highest HIV prevalence amongst antenatal clinic attendees of any health district in the country, with a 39% infection rate in 2004/5, compared to a provincial prevalence of 32.24% and a national rate of 25.29%. Given the immense scale of this problem, the fact that the metropolitan area lags significantly behind Cape Town in terms of the number of condoms distributed per male per year, 7.8 in Durban as opposed to 20.3 in Cape Town, is worrying. That said, the rate of condom distribution in Durban is higher then both the national and provincial averages of 7.45 and 6.44 respectively.
05
1015202530354045
Perc
ent
Cape Town Ekurhuleni eThekwini Johannesburg Nelson Mandela Metro Tshwane South Africa KZN
Figure 3.14: HIV prevalence among antenatal clinic attendees 2004/5
3.8.2 Tuberculosis (TB)
Tuberculosis (TB) is a very serious problem in South Africa and in the eThekwini Municipality, with 12 700 cases reported in 2004 (Cullinan, 2006), and the worst cure rate of any district in the country according to data from the National TB register. The TB smear conversion rate, which measures whether an individual is still infectious after 2 months, is 45.7%, which is below the provincial average of 49.5%, the National rate of 60.9% and rates of 73.6% in Cape Town and 71.3% in Johannesburg. The Department of Health’s target cure rate, a measure of whether a patient is no longer infected after 6 months, is 65%; more then double the rate of 30.1% in the city. This is exacerbated by the fact that the number of multi-drug resistant (MDR) TB cases at King George V hospital, the referral hospital for MDR TB, has more then doubled from 202 cases in 2000 to 435 in 2003. MDR TB is a serious strain on health care facilities, treatment costs up to 100 times more then ordinary TB and takes over 16 months, and the mortality rate is very high.
Other health related concerns include that the eThekwini Municipality has the second lowest rate of immunisations of any metropolitan area in South Africa (79.8%) and a high immunisation drop out rate of 8%, double that of Tshwane. It also has an extremely high number of Diarrhoea cases, 270 cases per 1000 children under 5; double that of the metropolitan area with the second highest rate. The latter is a major problem linked to poor sanitation and lack of clean water and is one of the biggest causes of death in Developing countries. The metropolitan area has responded to this problem with a number of innovative projects, including the construction of 32 ablution blocks in informal settlements with another 20 planned for the remainder of 2006 (Cullinan, 2006).
3.8.3 Pollution
26

Pollution is a major cause of health problems in the eThekwini Municipality, specifically in the South Durban Area where 280,000 people live in close proximity to two major oil refineries, a paper mill and dozens of other chemical and manufacturing plants (Clark 2004). Investigations into lead pollution at the end of the last decade found high levels of lead and other pollutants (Nraigu, 1996; Liggans and Nriagu 1998) and the Settlers Primary Health Study in 2002 found that 52% of the children in the study had some sort of asthma, the highest recorded rate in any scientific study worldwide. The 2006 South Durban Health Study also found that students in South Durban had a much greater chance of getting asthma than their counterparts in North Durban.
To help deal with pollution in South Durban, the Durban Multi-Point Plan was launched by local, provincial and national government which has led to a reported 40% drop in SO2 levels. Following the passing of the Air Quality Act of 2004 the area has also been formally recognised as a pollution "hot spot" under the act (Ensor, 2006) and Engen, owner of one of the two major oil refineries in the area, claims that it has reduced SO2 emissions from 65 tons per day in 1995, to less then 20 tonnes per day in 2006.
3.8.4 Health Care
In terms of capacity, the per capita expenditure on primary health in the eThekwini Municipality was R179 in 2001 which was higher than the national average of R168. It does not compare favourably with other metropolitan areas such as Ekurhuleni (R389) or Cape Town (R357) however. That said, the city’s 19 hospitals, including the new state of the art R4.5bn Inkosi Albert Luthuli Central hospital, provide 2.6 beds per 1000 population (KZN Health), which compares favourably with WHO statistics for the United Arab Emirates (2.2), Singapore (2.8) and Brazil (2.6), and while it was reported in 2004 that the province was short of 6000 nurses and 2000 doctors (Cullinan, 2004), the metropolitan area clinics do not face any staffing problems. Nurses in the metropolitan area see an average of 47.7 patients a day, the highest workload in any of the metropolitan areas except Cape Town and substantially higher then the national average of 41.53 and target of 35. This overload is even higher in the metropolitan area run clinics, where professional nurses at the clinics see between 50 and 80 patients a day (Cullinan, 2006).
3.9 Safety and Security
Crime remains a major problem in the eThekwini Municipality, as it is in the rest of South Africa. The eThekwini Municipality Quality of Life Survey found that the city’s inhabitants regarded crime as being one of their 3 most pressing concerns, while the IDP review of 2005 found that it was the most pressing concern (Coetzee, C: 2005).
0
5000
10000
15000
20000
2001/2 2002/3 2003/4 2004/5
Num
ber R
epor
ted
Common AssaultRobbery with Aggravating CircumstancesCommon Robbery
Figure 3.15: Number of Crimes reported in Durban, 1997/8-2004/5
27

Figure 3.15 shows that the numbers of reported cases of assault and robbery, while high, have remained fairly constant over the past few years, with a slight increase in the levels of aggravated robbery, and a slight decrease in levels of common robbery. Unfortunately crime statistics are notoriously inaccurate around the world due to high levels of under-reporting. In a survey conducted in 2005, 71% of victims of burglary and 45% of victims of assault did not report the crime (Altbeker, A. 2005), and this makes it very difficult to analyse such information. One statistic that does stand up to some scrutiny is that of the number of murders reported, which does not face the same problems of underreporting. Figure 3.16 shows that the number of murders in the eThekwini Municipality has declined steadily from 1997/8 to 2003/4, with Durban South showing a marked drop in the number of murders between 2002/3 and 2004/5. As the murder rate can be regarded as a better indicator then robbery or assault, this would appear to indicate that crime is decreasing somewhat. Much of the recognition for any decrease in the crime rate must go to the Durban Metropolitan Police Service (DMPS) which operates motorised, mounted and foot patrols and which has a notable presence in all areas of the city. The eThekwini Municipality was the first city to have a metropolitan area police service, and its predecessor, the Durban City Police, served as a model for the legislation now in place at a national level. The DMPS’s close cooperation with other metropolitan area services has resulted in continued high levels of service.
900
1000
1100
1200
1300
1400
1997/8 1998/9 1999/2000 2000/1 2001/2 2002/3 2003/4 2004/5
Num
ber o
f Mur
ders
Murder - Dbn S Murder - Dbn N
Figure 3.16: Number of Murders in Durban, 1997/8-2004/5 3.10 Conclusion
By looking at the economic and demographic profile of eThekwini Municipality this chapter has drawn attention to, and provided extensive data on some of the major developmental issues that are present in the metropolitan area, while noting the achievements of the municipality in addressing them. What is clear is that some considerable improvements have been made in the fight against crime and disease, and that considerable attention is being paid to the fight against poverty and to job creation.
28

Structure of the Metropolitan Economy – Sectoral and Spatial Perspective
CHAPTER 4
ETHEKWINIMUNICIPALITY29

4.0 Introduction
In the previous chapter we looked at the status of key indicators in the eThekwini Municipality. Beginning with a broad comparison with other metropolitan areas, this chapter will look at the growth and size of the various components of the economy of the eThekwini Municipality, with particular focus on manufacturing and the sub-sectors that make it up. Thereafter there will be an analysis of three components of the service sector, and the chapter will end with a discussion of the informal sector and its role and composition.
4.1 Growth Analysis
The economy of the eThekwini Municipality is the driving force behind economic growth in the region and gross domestic product (GDP) in the metropolitan economy has grown at an average annual rate of 3.65 % over the period from 1995-2005. This compares favourably with the rest of KwaZulu-Natal province, which grew at a rate of 2.3% for the period from 1995 to 2004. The combined rate of GDP growth for the province from 1995-2004 was 2.9%. The metropolitan area has consistently shown strong positive GDP growth over the last ten years at a level which has been fairly similar to the growth experienced in Cape Town (3.52 %) and the City of Tswane (3.23 %) but somewhat lagging behind GDP growth for Johannesburg which has averaged 4.29% since 1996. More recent growth trends suggest that eThekwini metropolitan area has been lagging in GDP growth with the other three cities mentioned experiencing growth at 4% or higher for the 2001- 2004 period and the eThekwini metropolitan area averaging a more modest 3.15% over the same period.
1%0%
25%
2%
3%
17%16%
21%
15%Agriculture, hunting, forestry andfishingMining and quarrying
Manufacturing
Electricity, gas and water supply
Construction
Wholesale and retail trade
Transport, storage andcommunicationFinancial, insurance, real estate andbusiness servicesCommunity, social and personalservices
Figure 4.1 Contribution to total GDP by Sector for 2005
The single largest contributor to GDP in the eThekwini metropolitan area is the manufacturing sector which contributes to a quarter of total GDP. The importance of this sector in the metropolitan area and the province as a whole cannot be understated as its total contribution to provincial GDP in 2004 was nearly 15%. After manufacturing the next largest sector is finance and business services, and 72% of the contribution to the provincial finance and business services sector’s GDP is generated in the metropolitan area.
30

0
5000000
10000000
15000000
20000000
25000000
1995 1996 1997 1998 1999 2000 2001 2002 2003 2004 2005
Agriculture, hunting,forestry and fishing
Mining and quarrying
Manufacturing
Electricity, gas andwater supply
Construction
Wholesale and retailtrade
Transport, storageand communication
Financial, insurance,real estate andbusiness services
Community, socialand personalservices
Figure 4.2: Total GDP per sector for eThekwini metropolitan area (1995-2005)
Transport and communication is also a significant contributor to the economy in the eThekwini metropolitan area. This is unsurprising given that the metropolitan area is home to the Port of Durban, Africa’s busiest port and a major transportation hub. The transport and communication sector is the fastest growing sector in the municipality, recording average annual growth of 6.45 % for the 2001-2005 period. The other two large sectors showing strong growth of above 4.5% per annum for the same period were the finance and business services sector and the wholesale and retail; catering and accommodation sector. The manufacturing sector saw more modest growth by comparison, recording just 2.75 % average growth per annum for the ten years between 1995 and 2004, and 2.49% growth per annum for 2001-2005. This growth rate was boosted by a strong 2005 where growth exceeded 4 %. The agricultural sector, whilst small in comparison to many other sectors has revealed strong GDP growth of 4.75% per annum for the 10 year period under consideration, and reached new highs of over 5% in 2004/5.
31

-4% -2% 0% 2% 4% 6% 8% 10%
Agriculture, hunting, forestry and fishing
Mining and quarrying
Manufacturing
Electricity, gas and water supply
Construction
Wholesale and retail trade
Transport, storage and communication
Financial, insurance, real estate and businessservices
Community, social and personal services
1995-2005 2001-2005 2004-2005
Figure 4.3: Average annual growth by sector for the eThekwini metropolitan area
4.2.1 The Recent Performance of the Manufacturing Industry
A more detailed view of the performance of manufacturing industries in the eThekwini metropolitan area is presented in figure 4.4, overleaf. The size of each industry in terms of GDP generated in 2005 is plotted on the horizontal axis while the average annual growth of each of the industries over the past five years (2001-2005) is plotted on the vertical axis. Each industry is represented by a ‘bubble’ in figure 4.4, the larger the bubble the larger the relative size of the industry in 2005.
The four largest manufacturing industries in the eThekwini metropolitan area in 2005 were petroleum and chemical products, food beverages and tobacco, transport equipment (including automotives), and metals and related products. Together these four largest industries accounted for over 60% of total manufacturing GDP in the metropolitan area in 2005. Of these four large industries, metal and machinery and related products experienced the fastest average annual growth, 4.5% over the period 2001-2005. Strong growth was also achieved by the Transport equipment industry, and specifically the automotive industry, which grew at an average annual rate of 3.7%. By contrast, growth in the metropolitan area’s largest industry – petroleum and related products has been stagnant over the past five years. The wood, paper and printing industry also experienced low growth of just under 1% per year.
32

4.2 Manufacturing in the eThekwini Municipality
Food, beverages & tobacco, 2.0%
Textiles, clothing & leather goods, 3.5%
Petroleum products, chemicals, rubber & plastic, 0.2%
Wood & paper; publishing & printing, 0.9%
Other non-metal mineral products, 6.0%
Electrical machinery & apparatus -1.2%
Furniture & other manufacturing, 3.3%
Metals, metal products, machinery & equipment, 4.5%
Transport equipment, 3.7%
-4.0%
-2.0%
0.0%
2.0%
4.0%
6.0%
8.0%
10.0%
0 1 2 3 4 5 6
GDP in 2005 (Rands billion, 2000 prices)
Aver
age a
nnua
l gro
wth
(200
1-20
05)
Radios, TV, instruments, watches & clocks 8.4%
Figure 4.4: Performance and size of manufacturing industries in eThekwini metropolitan area 2001-2005 The radio, TV, instruments, watches and clocks industry and the other non-metal mineral products industry are among the metropolitan’s smallest manufacturing industries and grew quickly off a small base demonstrating average annual growth rates of 8.4% and 6% respectively over the five year period.
A more retrospective view of trends in the manufacturing sector reveals that there were far greater variations in industry output prior to 2001 (figure 4.5, overleaf). In figures 4.5 and 4.6 trends in output and employment in Durban’s top six manufacturing industries can be compared over the period 1995-2005. With respect to output, the most striking growth within the past decade was experienced in the petroleum and chemical products industry which grew by 50% in the seven years between 1995 and 2001. The transport equipment industry while smaller in absolute terms, grew by a similar magnitude, 52% in the seven years between 1999 and 2005.
The ten-year historical perspective in figure 4.5 also reveals that the 3.5% average annual growth in output in the clothing and textiles industry reported in figure 4.4, above, is somewhat misleading; output in the industry only finally recovered to 1995 levels in 2005 having suffered consistent declines from 1995 to 2001. The difficulties that have been experienced in the clothing and textiles sub-sector are most apparent from the startling collapse in the industry employment numbers. Approximately 17000 jobs in clothing and textiles were lost between 1995 and 2004 (see figure 4.5, overleaf).
33

1.5
2
2.5
3
3.5
4
4.5
5
5.5
6
1995 1996 1997 1998 1999 2000 2001 2002 2003 2004 2005Year
GDP
(Ran
dsbi
llion
s,co
nstant
2000
prices
)
`
Food, beverages & tobacco
Textiles, clothing & leather goods
Wood & paper; publishing & printing Petroleum products, chemicals,rubber & plastic
Metals, metal products, machinery& equipment
Transport equipment
Figure 4.5: A comparison of output trends in selected manufacturing industries
10
15
20
25
30
35
40
45
50
55
1995 1996 1997 1998 1999 2000 2001 2002 2003 2004
Year
Perso
nsEm
ploye
d(tho
usan
ds)
Food, beverages & tobacco
Textiles, clothing & leather goods
Wood & paper; publishing & printing Petroleum products, chemicals,rubber & plastic
Metals, metal products, machinery& equipment
Transport equipment
Figure 4.6: A comparison of employment trends in selected manufacturing industries Overall the employment picture for the manufacturing sector is somewhat discouraging; with the exception of the metal and metal products industry which has experienced average annual employment growth of 1.1% over the past decade, all the major manufacturing industries have shed jobs. The job losses are particularly surprising given that five out the six top industries have posted significant gains in output. Overall these output and employment trends together are indicative of the phenomenon of ‘jobless growth’.
In order to more fully understand the continuing size and status of the manufacturing industry, we shall now look at some of the major sub-sectors which make up this crucial industry in more detail.
34

4.2.2 Petroleum Products, Chemicals, Rubber and Plastic Contributing over R5.8 billion to the local economy in 2005 (at 2000 prices) and making up 23% of all local manufacturing, this sub-sector is the largest and arguably most important part of the manufacturing sector in eThekwini. While it grew at an average of a mere 0.2% per annum in the period 2001-2005, these figures hide the fact that the sub-sector grew an average of a massive 8.3% a year in real terms from 1996-2000, some of the fastest growth rates recorded by any part of the manufacturing sector over the past 10 years.
While it is also true that the massive growth in the contribution of this sector to manufacturing in the city has not been matched by a similar increase in employment, petroleum products, chemicals, rubber and plastic industries continue to employ just under 25 000 people, as they did in 1997, making this sub-sector the second biggest employer in the manufacturing sector, after clothing and textiles. The fact that there has not been a significant shedding of jobs is significant given the trend in the rest of the manufacturing industry and, given the problems in the textiles sub-sector, this sub-sector could well become the most strategically important part of manufacturing in eThekwini in employment terms by the year 2010.
On the basis of levy contributions, the plastic and chemicals industries make up 45% and 35% of turnover in this sub-sector respectively (Coetzee, C et al:2005), with the chemicals industry growing an average of 10% a year from 1995-2000, and 4% a year from 2000-2004 at a provincial level. Some of the companies that operate in eThekwini include Plastimid, the largest compounder and supplier of engineering polymers in Southern Africa; SA paper Chemicals, the biggest speciality chemical supplier in Southern Africa (both subsidiaries of AECI, one of the 3 major chemical manufacturers in South Africa); and Protea Chemicals-KZN, which operates a plant in Jacobs. Other chemicals manufactured include some benzene and other aromatics at the Engen refinery, and propylene at the SAPREF refinery in Durban where a splitter owned by Safripol is in operation. On the rubber front, Dunlop tyres is based in Durban where it manufactures it’s truck tyres.
Two of the four oil refineries in South Africa, Engen and SAPREF are based in South Durban. Engen is the second largest integrated oil company in Southern Africa and produces 105 000 barrels per day. SAPREF, a 50/50 joint venture between BP and Shell is southern Africa’s largest crude oil refinery producing 180 000 barrels per day, 35 percent of the country’s refining capacity. It has 590 permanent staff, employs more than 500 contractors on average and spent R473.2 million on capital expenditure in 2005. The site also has a base oil refinery with a capacity of 155,000 mt/yr and produces asphalt, propylene feedstock, aliphatic hydrocarbon solvents, industrial processing oils and sulphur.
4.2.3 Food, Beverages and Tobacco
The food, beverages and tobacco sub-sector is the second biggest manufacturing sub-sector in eThekwini in terms of value added, making up 15.4% of all manufacturing, contributing over R3.8 billion to the local economy, and maintaining a growth rate of 2% a year in the period 2001-2005 (figure 4.5). This growth rate is a substantial improvement on the average of 0.4% per annum recorded in the period 1996-2000, but it has not resulted in an increase in employment. In fact, employment in this sub-sector has steadily declined from 1995 and the sub-sector has slipped from being the third biggest employer in the manufacturing sector in 1995, to being the fifth largest employer in 2004, as shown in figure 4.4.
According to levy data, the food industry makes the largest contribution to this sub-sector and it remains very important to the local economy (Coetzee, C et al, 2005), in spite of strong international competition (Muller, McGill and Skinner, 2006). With the liberalisation of trade barriers many South African food and beverage companies have been taken over by international firms, and along with the low profit margins that typically exist in this sector this has resulted in low fixed investment levels. That said, while the food and beverage industry remains heavily reliant on local demand, exports have been growing and possibilities for future exports are good (Muller, McGill and Skinner, 2006).
The food industry is underpinned by the presence of major companies such as Unilever, headquartered in Durban, which produces brands such as Knorr, Robertsons, Flora, Lipton and Joko, and employs 4000 people, most of whom work in the province. Unilever’s confidence in the city is underlined by it’s proposed purchase of Bromor Foods, a company with a turnover of over R850 million a year who produce Oros, Energade and Halls and have a production facility in Durban. Other examples of major investors include Clover which has a large dairy in Northdene and Tiger Brands
35
has a major Beacon chocolates plant in Jacobs, and in 2004 completed the R61.5 million acquisition of a steri fruit factory in Durban. National Brands has a biscuit factory in Westmead. The metropolitan area is also home to a number of important Beverage factories including 2 ABI bottling plants and the SAB Prospecton brewery which produces over 5.3 million hectolitres a year (SAB). The Prospecton Brewery is the third largest of the SABMiller breweries in South Africa, employing over 400 people, and has invested in electrode boilers, replacing coal-fired boilers, which has resulted in a positive environmental impact.
4.2.4 Automotive Industry
The automotive industry in the metropolitan area and in the province of KwaZulu-Natal is mainly based around the output of the Toyota SA plant in Prospecton. Toyota South Africa is the country’s biggest car producer with the largest domestic market share. Transport equipment has grown at an average annual rate of 3.7% over the last five years and now contributes more than R3 billion (2000 prices) in GDP to the metropolitan economy annually. Strong domestic demand, especially in new vehicle sales sector has contributed to growth in this sector. Alongside this increase in domestic sales, Toyota has rolled out an export programme which has boosted output at the Prospecton facility and Toyota is aiming to export 120 000 units per annum from South Africa by 2007.The boom in new cars sales continues with the National Association of Automobile Manufacturers of South Africa (NAAMSA) announcing another strong month for July 2006, up 21% on July 2005. The boom has resulted in Toyota taking on an additional 1100 employees. Toyota Motor Corporation’s purchase of the majority share in Toyota South Africa has resulted in the inclusion of the local plant and its suppliers into the global supply chain of a company aiming to produce 10 million cars annually.
In 2005, automotive component manufacturers in the Durban area spent more than R500 million on new capital investment. Capital expenditure totalled 7% of sales, significantly higher than in the other automotive hub areas in the Eastern Cape (4.1%) and Gauteng (3.3%). According to B&M Analyst Douglas Comrie, automotive component manufacturers within KwaZulu-Natal had sales of more than R7 billion and total sales when Toyota is included was approximately R20 billion and now employs 17 000 people. Sales have increased in real terms by 27% between 2002 when the Durban automotive cluster was established and 2005. Currently the cluster has 43 member firms and focuses on logistics, procurement, training and skills development in order to increase the global competitiveness of local firms (Enslin, 2006).
The KwaZulu-Natal government, the municipality and Toyota South Africa recently announced a public-private partnership in order to establish an automotive parts supplier’s park in the eThekwini Municipality. The park will be situated close to Toyota’s assembly plant in the South Durban Industrial Basin and a third of the park will be occupied by various Toyota owned facilities. There has been significant interest by potential investors in the park, with 13 initial parts suppliers having committed to taking up space. Research by the Municipality's Economic Development Department include a cost benefit- and macroeconomic analysis showing that the projected direct employment from the Supplier Park exceeds 2000 jobs. Currently the Toyota plant relies heavily on component manufacturers in the Eastern Cape and Gauteng and the park will provide more timely and cost effective options for part sourcing. The successful operation of the park and its relationship with Toyota can help increase Toyota’s SA production capabilities and its contribution to the eThekwini Municipality’s economy (Cockayne, 2005). The capabilities and competitiveness of the local motor industry will be further boosted with the construction of another car terminal the Port of Durban in the near future. Further good news to the local automotives industry was the extension of the Motor Industry Development Programme (MIDP) until 2012. The MIDP seeks to assist the development of the local motor and components industry by offering investment incentives and import rebate certificates which can be earned through the export of motor vehicles.
4.2.5 Wood and Paper; Publishing and Printing
This R2.6 billion sub-sector makes up 10% of all manufacturing in the metropolitan area, and is the fourth largest employer in the manufacturing sector. It grew by a mere 0.9% a year from 2001-2005, a somewhat worrying underperformance given its importance in terms of both employment and contribution to GDP.
A major investor in the paper manufacturing industry in the eThekwini Municipality is Mondi, a wholly owned subsidiary of Anglo-American, and one of the two big paper producers in South Africa. It has a
36

major pulp mill in Merebank, South Durban, producing 220 000 tons of thermo-mechanical pulp and 66 000 tons of groundwork pulp, which together contributed more then 10% of all the pulp produced in South Africa in 2001. Mondi also has a major paper mill in Durban, supplying 230 000 tons of newsprint, 100 000 tons of SC mechanical paper, 220 000 tons of uncoated fine paper and 10 000 tons of other grades of paper a year (Naledi: 2004). Mondi’s confidence in the province and the metro was exemplified by the decision to invest R4 billion to upgrade it’s plants in Durban and Richards Bay. Other major paper producers include Nampak which produces 10 000 tons of crepe tissue a year at its River View Mill in Verulam; Rafalo, which produces 11 000 tons of tissue a year; and SA Paper Mills which produce 15 000 tons a year.
Printing and publishing is a major part of this sub-sector, and in spite of pressure on printers costs due to the tightening of paper markets (PIFSA), a number of major investments have been made in this area. These include the founding of Printability, a company started in 2002 with a current turnover of over R200 million; a 3 year, R39 million investment in new equipment by Ferroprint, which operates a 5000 square metre premise in Durban; and a R16 million investment by Pinetown Printers, who’s factory in Durban has increased from 150 square metres in 1993 to 4000 square metres in 2005 (Inggs, M. 2005). Durban is also home to the Universal Print Group (Pty) Ltd, which describes itself as the largest producer of self-adhesive and flexible labels in the country, the largest supplier of temporary point-of-sale material in South Africa, and also one of the largest suppliers of business forms and continuous stationery in South Africa.
Wood, cork and straw products make up 26.3% of the levy contributions in this sub-sector (Coetzee, C et al: 2005), and a major investment in this industry was made by NCT Forestry Ltd when Durban’s first woodchip facility became operational in July 2004. It is one of only four wood chip export facilities in South Africa, producing 360 000 air-dry tons a year, most of which is exported to Japan, where the demand for South African woodchips has steadily increased from under 100 000 BDMT in 1990 to over 3 million BDMT in 2004 (NCT Forestry Ltd).
4.2.6 Clothing and Textiles
Few industries have undergone the large scale reconstruction and upheaval experienced by the South African clothing and textile industry in recent years. The result of lower tariffs and barriers to imported goods, the restructuring of the industry has seen employment decline significantly as imported goods replace more expensive local garments. The manufacturing sector has been particularly hard hit by South Africa’s trade liberalisation policy as employment has declined by 22 000 jobs over the period from 1996 to 2004. Total employment in the sector went from 65 004 to 43 349 jobs – a 33% decline. The industry as a whole has shed some 60 000 jobs in the previous three years throughout South Africa. Despite the declining number of jobs, the Clothing and Textiles sector is still the leading employer in the manufacturing sector in the eThekwini Municipality and its role as a source of employment should not be underemphasised. The industry has continued to grow steadily over the last five years as more competitive forms of production are sought out.
The eThekwini metropolitan area has 416 clothing firms and approximately 320 of these are involved in cut, make and trim (CMT). Few manufacturers are successful exporters however, and most businesses are medium sized (200-500 employees) with a large amount of small, medium and micro enterprise subcontracting work from larger businesses. Large clothing manufacturers such as Ninian & Lester have restructured their businesses to focus on areas where they have a competitive or qualitative advantage, in the case of Ninian & Lester – quality undergarments.
The municipality, along with provincial government has established a clothing and textiles cluster partnership with business to boost the competitiveness of local production. Major partners in this cluster include the Mr Price Group and Edcon. Whilst local production battles to compete with Eastern imports, buying locally has some advantages for retailers. These include quality and turnaround times.
The cluster partnership currently has four main schemes:
• World-class manufacturing (WCM): firm-level benchmarking, the sharing of best practices between participating firms and the provision of WCM training for executives and managers.
• Value chain alignment: strategic and operational alignment of retail buyers and clothing and textile manufacturers, including value chain benchmarking and supply chain management training.
37

• Human resource development: technical skills development and team leader training in WCM, and
• Stakeholder interface: proactive resolution of broader environmental challenges impacting on the competitiveness of the industries, such as under-invoiced imports, utility costs, transport deficiencies and investment support.
4.3 The Service Sector
The service sector is the source of much of the eThekwini metropolitan area’s growth, with the financial, insurance, real estate and business services sector growing at over 6% in 2004/5, and the transport, storage and communications sector achieving consistent 6% per annum growth for the period 2001-2005. This section will look at real estate, transport and tourism in order to provide a more detailed analysis of this crucial sector.
4.3.1 Real Estate
According to the JHI Group’s 2006 Property Report “Durban, in particular, will be the biggest beneficiary of massive infrastructure development, making it South Africa’s most liveable city by 2020” (Pillay, 2006). The metropolitan area will receive R2 billion to upgrade its transport system, R1.6 billion to build the new King Senzangakhona Stadium, R1.8 billion for the iDube Tradeport and King Shaka International Airport and R3 billion for new hotels. The spin off of all this investment will be massive property development. The JHI SA Property Reports states “The building of the tradeport and the airport could change the geopolitical face of the city. The Durban airport site is a strategic piece of land. There is talk of all sorts of projects.”
4.3.1.1 Overview of the Durban Real Estate Market
The Durban property market has been experiencing boom conditions since 2004, with the development of the R750 million uShaka Marine World acting as a catalyst for development in the Durban Point area, for example. R1billion has already been committed to new infrastructure and building complexes at the Point, and 75% of the 900 residential units on sale have already been sold, fetching prices of between R12 000 and R18 000 a square metre. At the other end of the market, Durban offers some of the most reasonably priced properties in South Africa, and the average house price is cheaper than that in Port Elizabeth, Bloemfontein or Greater Johannesburg (Coetzee, C et al. 2005). The municipality has also created an urban development zone with tax incentives for inner city redevelopment. The good infrastructure, Port and planned new airport at La Mercy all point to a property market with a great deal of future growth potential. According to the Property Market Review the metropolitan area can be broken up into 5 main areas, the first of which is the Durban beachfront and the central business district (CBD), which still provides most of Durban’s office space and remains a strong, accessible retail node. The creation of the urban development zone has resulted in reduced vacancy rates, and confidence in the CBD has grown with ABSA relocating its operations to the CBD. The land around Sibaya Casino and Entertainment Kingdom has been earmarked to attract around R4 billion in investments for boutique hotels, luxury apartment, housing estates, a shopping centre and offices (Pillay, 2006). The inner west node contains the Berea and Musgrave Areas. This is a stable commercial and upper income residential node, with office vacancy generally below 10%, and office rentals peaking at R75 a square metre. The area is home to the Musgrave Shopping Centre (32 122 square metres).
The outer west node contains mixed residential and dispersed commercial areas such as Westville and Pinetown, as well as industrial areas like New Germany and Mahogany Ridge. The 100 000 square metre Westville Pavilion Shopping Centre is the main shopping centre in the region, and along with commercial property it competes directly with Umhlanga. Prices of Industrial property in the area have doubled in the last 5 years.
The northern node, which includes Umhlanga Rocks La Lucia Ridge, Mount Edgcombe and Springfield Park, has been one of the fastest growing office nodes in South Africa since the late 1990’s, with prime office rentals now regularly exceeding R80 a square metre, and occupants including Deloitte & Touche, Alexander Forbes, Ernst and Young, Cell C and Unilever. The Gateway
38

Theatre of Shopping is the fourth largest shopping centre in South Africa, and the Industrial Property market is also strong with rentals reaching R25-R30 a square metre in Springfield Park.
The Southern Node, which includes Amanzimtoti and the South Durban Basin contains the main industrial centre in the city. The Port of Durban and heavy industry dominate the area, and major occupants include Toyota and Engen. While land values tend to be lower then in the rest of the city, the general rentals trend is upward, especially for small factories where rents reach between R28 and R30 a square metre. (Viruly Consulting, 2005)
4.3.1.2 Residential Property Market
The outlook for the Durban residential property market in the medium to long-term is generally good, with demand generally outstripping supply, and strong growth in emergent areas such as uMlazi and KwaMashu, fuelled by improved service delivery (Hayter, R. 2005). Moreover, Durban performed better in terms of rates of increase in prices then the other metros in 2002/3, and while this has slowed, Durban / Pinetown property prices have continued to track that of Greater Johannesburg for the past three years.
The graph below shows that the Durban property market has had sustained quarterly growth at a relatively constant rate since September 2002, but that this has not continued in the second quarter of 2006. For the first time since June 2002 there was a 2.8% drop in the average purchase price of middle class houses in Durban, from R843 950 in March 2006, to R819 985 in June 2006. This was fuelled mainly by a 4.4% year on year decline in the average purchase price in the small house segment, the only sector in a major metro to suffer year on year decline in nominal prices. It is too soon to say whether this downturn will be sustained, but this is a worrying situation, especially in light of the forecast rises in interest rates.
200 000 300 000
400 000 500 000 600 000 700 000
800 000 900 000
Mar-01
Sep-01Mar-
02Sep-02
Mar-03
Sep-03Mar-
04Sep-04
Mar-05
Sep-05Mar-
06
Smoo
thed
Ran
d
Durban Unicity KwaZulu/Natal
Figure 4.7: Middle class houses - All sizes - Purchase Price (Unit: Smoothed Rand)
In terms of the letting side of the market, Trafalgar reported in 2005 that Durban had the fastest rate of year on year rentals inflation of any major city in South Africa, touching 15.8% in June, compared to Johannesburg’s 14.3%. Durban and Port Elizabeth were reported as being the best performers in terms of flat rentals over the periods 2003-2005 and 2001-2005. Further Indications from the Trafalgar Inner City Report of 2005 are that a shortage of supply and strong demand, especially for family and student accommodation in the CBD and high end apartments in the North Beach and Point Areas, should continue to push up rental prices.
4.3.1.3 Commercial Property Market
The commercial property sector in Durban is performing well, especially in the office sector where FNB reports that there is a significant scarcity of quality office space, resulting in a surge in returns
39

from 10.5% in 2004 to 29.6% in 2005, easily more then those available in Gauteng and only marginally less then the returns of 31.7% in the Western Cape. The Office Vacancy Surveys show that office vacancies remained lower in Durban then in Johannesburg from 2003-2005, and that while there was a general increase in vacancy rates in all areas of Durban in the second half of 2004, these rates levelled off in the first half of 2005.
Table 4.1 Average Monthly increase in Commercial space in Durban (m²) Office and Banking space Retail space Industrial space
Average 2003 395 956 3313 Average 2004 943 925 4744 Average 2005 1144 4266 8465 FNB predicts that heightened constraints with regards to office vacancy figures will result in Durban surpassing the returns available to investors in Cape Town or Johannesburg by the year 2007. A sharp increase in demand has led to rents of up to R300 a square metre being demanded in the CBD, levels akin to those asked for suburban rentals in greater Durban. (JHI: 2005)
Confidence in the commercial property sector is further evidenced by the sustained, substantial increase in the average monthly increase in the total area in square metres of office space indicated in Table 4.1. Figure 4.8 shows that office space continues to be located primarily in the CBD, but that a substantial portion of A-grade office space is located in Umhlanga/La Lucia.
0100000200000300000400000500000600000700000800000
Durban CBD Berea Westville uMhlanga/La Lucia
m2
P-grade A-grade B-grade C-grade Total
Figure 4.8: Size and Geographic Distribution of the Durban Office Market 4.3.1.4 Building Plans Passed
The statistics for building plans passed are a significant indicator of future growth, both in the property sector and in the economy as a whole. As can be seen from figure 4.9 building plans passed more then doubled in square metre terms for the industrial, retail and office sectors from 2003 to 2005, with the industrial sector rising by 91%, retail by 234% and the office sector by 119% according to the eThekwini Property Market Review 2006/7. The average Rand value of building permits approved per month for the first two quarters rose from R129m in 2004 to R228m in 2005 (Coetzee, C et al: 2005) and it would appear that investors are targeting big projects, and that there may still be room for growth if building costs remain on a downward trajectory.
40

Figure 4.9 Total Building Plans Passed for non residential projects in Durban (sqm)
4.3.2 Transport Sector.
In 2004 transport was the second largest service industry in the province. The transport sector in eThekwini grew by 7.66% over the 2004-2005 period, continuing its strong growth path. The industry, buoyed by strong domestic demand and rising export figures has grown by an average of 6.71% over the 2001-2005 five year period.
80000
90000
100000
110000
120000
130000
140000
150000
160000
170000
180000
Jan-02 Jul-02 Jan-03 Jul-03 Jan-04 Jul-04 Jan-05 Jul-05
Tota
l TEU
's
Figure 4.10 Total Number of TEU’s per month for the Port of Durban January 2002 – July 2005 At the centre of the transport industry in the eThekwini Municipality is the Port of Durban. The busiest port in Africa and South Africa’s leading container port, the Port of Durban has seen a steady
41

increase in container traffic in recent times. Durban is a vital link in one of the two largest freight corridors in South Africa, linking Gauteng with the rest of the world.
The Port of Durban is South Africa’s only general cargo port in terms of standard containerised units TEU’s (twenty-foot equivalent units). 64% of total container traffic went through the Port of Durban in 2004 (1.68 million TEU’s). The increase in container traffic shown in figure 4.10 reveals how container traffic has nearly doubled in recent years, mostly driven by increased imports of goods.
4.3.3 Tourism
Building on Durban’s natural advantages of climate, scenery, history, culture and the built infrastructure of hotels, beaches, sports facilities and conference venues the eThekwini Municipality is planning a number of top events over the next few years to attract tourists and put Durban on the international map. According to the Strategic Projects Department of eThekwini, these include the:
A1 Grand Prix – February 2007 Tennis Championships - 2007 FIFA Beach Soccer African qualifiers – September 2007 Around-the-World Clipper Race – 2007 / 8 Various international rugby events Zulu Rally and World Rally Championships – 2007/8 FIFA Beach Soccer World Cup – 2009 Confederations Cup Soccer - 2009 Soccer World Cup - 2010 FINA World Swimming Championships – 2011
In addition to these projects, possible bids for the Commonwealth Games in 2014 and the Olympic Games in 2020 are being contemplated. The municipality is also currently preparing a business plan detailing the R6,5 billion investment required to be put in place by national government, the province and the municipality to prepare for Soccer World Cup 2010. (Aarde, 2006)
4.3.3.1 The Foreign Tourism Market
In 2004, the eThekwini Municipality was visited by 1.1 million foreign tourists (equivalent to 78% of foreign tourists to KwaZulu-Natal or 16% of foreign tourists to South Africa). The most popular attraction among foreign tourists to KwaZulu-Natal was the Durban beachfront, which was visited by around 875,000 foreign tourists (64% of foreign tourists to KZN). (SA Tourism, 2005)
The municipality’s most significant source markets are from Africa (56%) and Europe (33%). Figure 4.12 presents Durban’s top ten foreign tourist source markets. Five of the top ten are South Africa’s neighbours (Swaziland, Lesotho, Zimbabwe, Botswana and Mozambique); four are from Europe (UK, Germany, France and the Netherlands); and the remaining country is the USA. (SA Tourism, 2005)
6%5%
56%
33% AFRICA & MIDDLE EAST AMERICAS ASIA & AUSTRALASIA EUROPE
Figure 4.11: Source of Durban’s Foreign Tourists
42

025,00050,00075,000
100,000125,000150,000175,000
Swaziland
UK
Lesot
ho
Zimbab
we
Germany
Botswana
USA
France
Netherla
nds
Mozambiqu
e
Figure 4.12: Durban’s Top 10 Source Markets
The primary difference between the African and overseas tourist markets is the purpose of visiting. 72% of overseas tourists to KwaZulu-Natal come for a holiday compared with just 39% of African tourists. 33% of African tourists who come to KwaZulu-Natal come to shop. This does not diminish the value of the African tourist market as the average amount spent in South Africa by African and overseas tourists is roughly the same, around R10,000 in 2004. (SA Tourism, 2005)
In 2004, the value of foreign tourism to KwaZulu-Natal was R 6.9 billion (SA Tourism, 2005). The KwaZulu-Natal Tourism Association’s (KZNTA, 2002) analysis of the value of KwaZulu-Natal’s regional tourism markets concluded that Durban captures around 33% of foreign consumer spending in the province. This suggests that the value of Durban’s foreign tourism market in 2004 was in the region of R 2.3 billion.
4.3.3.2 The Domestic Tourism Market
In 2004, the eThekwini Municipality was visited by 1.9 million domestic tourists, equivalent to 28% of domestic tourists to KwaZulu-Natal (KZNTA, 2005). The primary source of domestic tourists to KwaZulu-Natal is from within KwaZulu-Natal itself, followed by travellers from Gauteng. 71% of domestic tourists to KwaZulu-Natal come to visit friends and relatives and 15% come for a holiday. 66% of domestic holiday tourists to KwaZulu-Natal visited the beach. (SA Tourism, 2004)
KZNTA estimate that the value of domestic tourism spending in KwaZulu-Natal in 2004 was in the region of R 6 billion (KZNTA, 2005). KZNTA’s (2002) analysis of the value of KwaZulu-Natal’s regional tourism markets concluded that Durban captures around 38% of domestic consumer spending in the province. This suggests that the value of Durban’s domestic tourism market in 2004 was in the region of R 2.3 billion.
4.3.3.3 The Durban Hotel Market
The Durban hotel market is the third most important in South Africa after Cape Town and Johannesburg. The Durban municipality has 65 hotels (representing 6.5% of the estimated total hotel supply (establishments) in South Africa), with 5,897 rooms (almost 10% of total estimated hotel room supply in South Africa). (Grant Thornton, 2004)
Durban hotels achieve much higher occupancies than South African hotels as a whole (72% vs. 58%, 2003), and even outstrip the global average (75% vs. 69%, 2002). Conversely, Durban hotels achieve lower average room rates than South African hotels as a whole (R348 vs. R359, 2003), as well as the global average (US$37 vs. US$92, 2002). Although Durban average rates are lower, on a “revenue per available room” basis (occupancy x average room rate), Durban performs well compared to Johannesburg, but weaker compared to Cape Town. (Grant Thornton, 2004)
43

4.4 The Informal Sector
The informal sector in South Africa is an increasingly important source of employment, poverty alleviation and economic development. According to the Labour Force Survey, the proportion of the employed who work in the informal sector has increased from 17.8% in September 2001 to 20% in September 2005 (LFS, Sep 05), and in the trade sector this proportion increases to over 50% (LFS, Feb 00). Other sources indicate that underreporting in the LFS may mean that as many as 25-30% of the employed work in the informal sector (Skinner, C & Lund, F. 2006).
In Durban, deregulation in the 1990s led to a massive increase in the number of informal traders. It was estimated that there were between 19 000 (Skinner, C. 2005) and 20 000 (Durban Informal Economic Policy. October 2000) street traders in 1996/7, of which over 60% were women. The muthi trade alone created 14 000 jobs and in 1998 black householders spent over R500 million in informal sector outlets. As an indication of the scale of this market over 28 tons of cooked mielies were sold a day in peak season, over 10 000 tons a year (Skinner, C. 2005), and this trend has continued. Current estimates in the City’s Draft Itinerant Traders Policy indicate that there are as many as 150 000 informal traders operating in the Metro (Development Praxis. Nd), and employment growth in the informal sector was somewhere between 11 and 19.5% between 1996 and 1999, as opposed to 1.4% in the formal sector (Skinner, C. 2005).
Many people tend to imagine that the informal sector is composed entirely of individuals who engage in retail trade on the streets, but this is in fact not a true reflection of the sector at all. Informal sector business and entrepreneurs in the metropolitan are active in industries ranging from metal work, child care, construction, shebeens, hairdressers, traditional crafts, muthi, clothing and spaza shops, and only 11.8% of those surveyed in a 2005 study of the informal sector operated on the street (figure 4.13). Over 50% operated from their homes or buildings adjacent to their homes. Moreover, 54.6% of those interviewed employed at least 1 other person, and more then 70% had been operating their business for more then 4 years (Skinner, C. 2005). Given that the average capital cost per job created is significantly lower then in the formal sector, job creation is significantly more affordable and likely in this sector (Development Praxis: Nd).
Figure 4.13 : Location of Informal Business’s in Durban 4.4.1 The Response
The eThekwini Municipality, unlike many other municipalities in South Africa, has recognised this trend and seen the growth of informal business as a possible opportunity rather then a threat, seeing it as a critical sector for economic development and not just poverty alleviation (Xaba, J et al. 2002). As such the municipality is recognised as having the most innovative and integrated approach to
35%
14%11%11%
9%
6%4% 3% 2% 5%
Inside Home Outside Building On Property Other Building StreetFixed Stall in market DMU unit Temporary Structure Mobile Construction Site Other
44

informal trading and business, and adopted a unique Informal Economic Policy in 2000 (Skinner, C. 2000 & 2005). This policy, which is currently under review, along with the draft itinerant traders policy, recognises that the informal and formal sectors can be complimentary, and that local government has an important role to play in fostering this relationship (Skinner and Valodia: 2001).
This groundbreaking approach is clear when one compares Durban to Johannesburg. Whereas the Johannesburg municipality banned traders from the entire inner city, banishing them to markets which only accommodated a small fraction of the 10 000 traders, and creating significant animosity between the traders and the city; the Durban authorities established street trading sites throughout the inner city and worked to integrate traders more fully into the economy (Skinner, C and Lund, F: 2006). Over the period 1997 to 2000 Durban spent approximately R45 million on infrastructure for informal traders, building new markets, upgrading others, and providing shelters for street traders. Other projects included a dedicated market with shelter, storage, water and toilet facilities for traditional medicine traders; and the Warwick Junction Urban Renewal Project, servicing almost 12 000 informal traders (Hemson, D: 2003).
4.4.2 Future Challenges
As proactive as the local government has been, there remain significant challenge ahead for informal sector workers, foremost amongst these being access to credit. Of the 507 informal traders interviewed in the city in a recent research report, only 72 had tried to access credit, and only 3.9% had been successful in obtaining credit. While it is recognised that it is not the role of local government to provide financial services, 71% of those surveyed thought it was one of the three most important areas that the Metro should get involved in (Skinner, C. 2005). In light of this, and the importance of this area, it has been argued that local government could get more involved in facilitating the dissemination of information about access to credit, and in creating links between informal sector workers and major financial institutions.
4.5 Conclusion
This chapter has presented the relative sizes, growth paths and contributions to employment of the various components of the economy of the eThekwini municipality. While manufacturing remains a large and vital part of the economy, with some industries performing particularly well over the past 10 years, it is clear that various elements of the service sector are increasing in importance. What also emerges is that while the informal sector remains a great deal smaller then the formal sector, it is nonetheless an extremely important source of jobs and income for many of the inhabitants of the metropolitan area.
45

Economic Nodes, Nodal and Infrastructural Development and Investment
CHAPTER 5
ETHEKWINIMUNICIPALITY46

5.0 Introduction
Infrastructural Investment and Development are key prerequisites for growth, and this chapter will describe the key initiatives piloted by Local Government in eThekwini. The five Area Based Management Plans located in key development areas will be discussed, and their current achievement and planned future initiatives will be outlined. Thereafter, the major spatial initiatives will be presented, and the key development and infrastructure planned for the city will be looked at.
5.1 Overview
The spatial distribution of economic activity in the municipality is heavily skewed towards the Durban City Centre, the Durban South Basin (including Jacobs, Mobeni, Coedmore, Isipingo and Prospecton), the Port of Durban and the Pinetown, New Germany, Queensburgh, Chatsworth and Umhlatuzana areas. Around 400 000 jobs are located in these core areas. Table 5.1 details the spatial spread of jobs and key activities in the city.
Table 5.1 The spread of employment across eThekwini by type and number of jobs, 2001
Main Approximate Key Activities Economic Total Nodal in each Nodes: Employment: Node: Durban Central 137000 Retail, Services, Offices, Conferences, Education, Tourism
Jacobs / Mobeni 73400 Mature industrial (Chemicals, Plastics, Confectionery, Textiles, Footwear, Packaging, Engineering)
Port of Durban / Maydon Wharf 35000 Tourism, Freight Logistics and Transport Manufacturing, Engineering, Recreation
Pinetown / New Germany 52200 Mature industrial (Textiles, Earthmoving, Beverages, Footwear Components, Electronics, Medical Goods)
Chatsworth 25100 Retail, Services
Isipingo / Prospecton 21000 Automotive, Food, Plastics, Carpets, Chemicals, Beverages, Transport, Distribution
Coedmore 14200 Stone Quarry and Cement
Queensburgh / Umhlatuzana 11800 Small light to medium industrial - growth potential
Springfield Park 12000 Light industrial, Retail
Waterfall Park 10400 Fresh Produce, Retail, Services
Glen Anil / Avoca 10000 Light Industrial (Building materials, White Goods Distr., Plastics, Furniture)
Amanzimtoti 9300 Retail and Tourism
Reunion 8800 Airport, Petroleum Refineries, Paper, Synthetic Fibres, Chemicals
Umhlanga Rocks 8000 Retail, Services, Offices, Tourism
Westmead 7600 Light Industrial
Tongaat / Maidstone 5100 Medium Industrial (Textiles, Clothing, Sugar, Animal Feeds)
Verulam / Canelands 5000 Medium Industrial (Textiles, Clothing, Agric., Chemicals, Furniture)
Effingham / Avoca 5000 Industrial/Agricultural (Bricks, Roof Tiles, Sugar Cane)
Kingsburgh 4700 Tourism
Kwamashu 5000 Small Commercial
Phoenix Industrial 4500 Medium Industrial (Clothing, Wood Products, Beverages, Plastics)
Westville / Pavilion 4000 Retail, Services, Offices
La Lucia 3500 Retail, Services, Offices
Hillcrest 3500 Retail, Services, Offices
Umbogintwini 1900 Chemical Industrial Park, Light Industrial Park
Mt Edgecombe 3000 Light industry (Engineering, Furniture, Manufacturing, Distribution and Warehousing), Offices, Golf Course
Cato Manor 2000 Commercial, SMME, Light Industrial
Glenwood 490 Education, Research, Innovation & Experimentation
Harrison Flats 480 Heavy industry
Hammarsdale 230 Textiles, Clothing, Chicken
Berea Ridge N/A Health, Retail, Offices
Beachfront N/A Retail, Tourism
Point N/A Retail, Tourism
Bluff N/A Retail, Tourism
Victoria Embankment N/A Sport (Sailing, Boating), Tourism
Greyville N/A Sport (Horse Racing, Golf), Tourism, Offices, Publishing
King's Park N/A Sport (Rugby, Golf, Swimming, Soccer), Tourism
Umdloti N/A Tourism
N/A = Not Available
47

In an effort both to bolster and strengthen existing core areas of economic activity and employment generation as well as to spread economic activity and job creation more evenly throughout the metropolitan area the municipality is supporting a number of spatially focused nodal and infrastructural development programmes in various parts of the city. These are depicted in the map on the following page and include:
1) Cato Manor ABM 2) Durban Inner City (iTRUMP) ABM 3) Durban South Basin ABM 4) Inanda, Ntuzuma and KwaMashu (INK) ABM 5) Rural ABM (covering four distinct localities) 6) The expansion of the Port of Durban 7) The iDube Tradeport 8) Riverhorse Valley 9) Durban Point Waterfront
The first five of these programmes are styled area based management and development programmes and are managed in a distinct manner as described in more detail in the next section of this chapter. The Cato Manor, INK and Rural ABMs are development programmes whilst the Durban South Basin and iTRUMP ABMs are renewal programmes.
5.1 Area Based Management and Development Programmes (ABM Programmes)
The ABM programmes have been established to address the challenge of creating a strong base of good governance on which the three components of economic development, social enlistment and ecological sustainability can be built. Five strategically important areas have been identified in which teams of professionals have been placed to drive area based management and development. These teams work with municipal line function departments to add value to the work they are doing in each area.
5.1.1 Cato Manor ABM
An inner-city residential area which was the focus of the forced removal of over 150 000 people during the 1950s and 1960s and more recently it has been the beneficiary of a major Presidential Lead Programme of infrastructural projects over the past ten years. Now the focus is on economic and social development.
Cato Manor covers a geographical area of 1800 ha. It is situated approximately 10km from Durban's city centre and is home to an estimated 93 000 people who settled in the area through mass invasions in the late 1980's and early 1990's. Cato Manor had been left vacant since the 1950's and 1960's following apartheid forced removals of an estimated 150 000 people. Today, Cato Manor residents include some of the poorest of the urban poor, despite the successes of the first phase of the Cato Manor Development Programme (CMDA).
The CMDA has been the lead agency in redeveloping the Cato Manor area of Durban. This project dates back to 1993, but formal on-the-ground operations started in 1997 when funds were sourced from the European Union. Various partnerships were formed with government and community representatives, and with expert volunteers to secure and improve delivery. This project aimed to reverse a legacy of apartheid-era planning and subsequent unplanned settlement, as well as addressing poverty. Prior to the CMDA intervention, unemployment in the area was 39%, and about 80% of all households had no access to basic services like water, sanitation or electricity. Since the implementation of this project, unemployment has decreased and basic services have been provided for the targeted group
The major innovation of the CMDA, made against a background of community insecurity and violence, was to bring together community representatives, government resources and non-government organisational expertise in a single programme. The objective was to deliver public services and economic opportunity.
48

Map 5.1 Map of Spatially Focused Development Programmes Approximately 30 new enterprise development projects have been completed to date.
49

The Cato Manor programme lists the following amongst its achievements: • Skills training has been provided to 7000 persons. • Homes have been delivered to tens of thousands of poor people. • Fourteen kilometres of roads have been built. • 24 projects involving bulk services and drainage infrastructure have been completed. • Twelve schools, 8 sports fields and parks have been established, as well as 3 community
halls, 3 libraries and 2 health centres.
Although the area remains characterised by a high unemployment rate and social fragmentation, Cato Manor residents are increasingly taking the initiative in the development of the area and there is a high level of community organisation, citizen action and participation. The Cato Manor Area Based Management (ABM) programme seeks to work with these strengths and build on the existing platform of social engagement. The ABM concentrates its efforts on post-infrastructure development and consolidation processes such as social upliftment, responsibility and cohesion; community planning and participation; economic development and skills development.
5.1.2 South Durban Basin
This is an area containing South Africa's largest manufacturing enterprises in the midst of communities of relatively poor residents. Here the aim is to regenerate the industrial base, creating cleaner and greener industries, whilst improving the residential conditions of people in the area.
The South Durban Basin (SDB) stretches from the Port of Durban in the north to Umbongintwini in the south and inland as far as the South Coast Road corridor. The eastern boundary of the SDB is bordered by an environmentally sensitive coastal strip. The SDB is a key manufacturing and industrial zone of the city, contributing some 30% of the Durban’s Gross Domestic Product. In fact, it is the second biggest industrial complex in South Africa and provides 10% of the country’s manufacturing jobs.
At the same time, the area is home to approximately 100 000 people and is also an important residential node. The historical legacy which juxtaposed polluting industries and residential areas has given rise to a tense relationship between residents and big business. As such, one of the biggest challenges is to improve lines of communication between the city, organised stakeholder groups, big business, community organisations and environmental groups. In addition, the SDB ABM programme aims to improve resident’s access to social, recreational, economic and environmental facilities in the area.
The strategic objective of the South Durban Basin ABM is to restore business confidence, consolidate existing enterprise and stimulate new development, facilitate renewed socio-economic investment and improve the quality of life by tackling environmental problems, addressing operational deficiencies and improving the built environment in a sustainable manner.
5.1.3 iTrump Inner City Regeneration
The Inner eThekwini Regeneration and Urban Management Programme (iTrump) programme drives regeneration and urban management in the Durban inner city. A complex range of issues from stemming the tide of office flight to suburbs to dealing with the urban poor, informal trading and the like, require new innovative and interdisciplinary programmes. The inner city area extends from the Mngeni River in the north, the Beachfront and Point to the East, Victoria Embankment to the South and Warwick Avenue, Umgeni Road to the west.
The iTrump ABM was established as a response to the urgent need to prioritise the regeneration of the inner city. iTrump places the strategic value of the inner city at the core of its business and seeks to maximise its multiple opportunities. It focuses on six key outcomes, namely:
• increasing economic activity; • reducing poverty and social isolation; • making the inner city more viable; • effective and sustainable urban management; • improving safety and security and • developing institutional capacity.
50

iTrump strives to be proactive rather than reactive, working to stimulate private sector interest while fulfilling the needs of individuals that use public spaces.
5.1.4 Inanda, Ntuzuma and KwaMashu (INK)
The Inanda, Ntuzuma and KwaMashu (INK) area comprises a mix of formal residential townships and informal settlements which are home to approximately 510 000 residents. The area is the second largest black African township settlement in the country – a mix of developed and underdeveloped areas with many areas experiencing high levels of unemployment, social dislocation, poverty and crime, exacerbated by inadequate physical infrastructure and severe degradation. Located some 30 kilometres north of the CBD the area offers almost no economic opportunities or even tertiary education facilities to serve the residents. In 2001, INK was identified by the President of South Africa as a critical development node. The INK ABM is accorded presidential programme status and is about generating economic activity as well as revitalising residential and community areas.
The INK ABM is intended to co-ordinate, facilitate and align development delivery as rapidly as possible. Key to this mission is the need to turn around resident’s perception of delivery so that they become key agents in the process to deliver a better quality of life. The INK ABM has brought to the fore the issue of co-operative governance, integration and alignment in an effort to avoid duplication and enhance synergies.
The INK ABM has identified the need to enhance human capacity and improved conditions via an intensive consultative process inclusive of all stakeholders, including over 400 community based organisations. A number of high impact projects, have already been initiated based on this highly participatory model. One of these is the KwaMashu Town Centre. The centre serves the nearby population of 160 000 residents and provides the catalyst towards turning KwaMashu into a thriving urban centre with its own economic and social vitality. The Town Centre with its anchor tenant, Spar, aims to provide an upmarket centre right on the doorstep of people who previously had to travel into other parts of eThekwini to receive the same standard of shopping experience.
5.1.5 Rural Area Based Management
Over two-thirds of the land area of the municipality is rural in nature, containing less than 5% of the population, most of whom live on communal land (eThekwini, 2005) The focus here is on addressing poverty and bringing integrated development into areas which historically received very little support from government. Approximately 600 000 people live in the 1500 km sq area surrounding the city which includes both rural and peri-urban areas.
It comprises 67% of the city’s spatial footprint and falls beyond the ‘urban edge’ or sustainability line (eThekwini, 2005). It is largely defined by its geo-spatial features such as hilly, rugged terrain, dispersed settlement patterns in traditional dwellings, and communal landholding under the Ngonyama Trust.
The area is also characterised by severe poverty and unemployment with many households reliant on localized social assets such as community networks and organizations. Another challenge is the environmental vulnerability of the area due to heavy reliance by households on the natural resource base. The situation is exacerbated by fragmented services delivery, unresolved land tenure, a shortage of substantive information, and a legacy of lack of planning.
The ABM aims to develop alternative approaches to the delivery of basic services; develop effective institutional arrangements and development processes; and expand the range of income generating opportunities for the people of the area. These interventions aim to facilitate access to basic services, enhance economic livelihoods and improve systems of governance in the rural areas.
The Rural ABM Programme is to facilitate and co-ordinate the development and management of rural areas that are fully integrated within the metropolitan context. Focus is on four nodes: Verulam Town Centre, KwaXimba, Umbumbula and Umgababa.
The programme is currently establishing rural investment nodes for the four specific areas. These nodes will be used to provide ABM level activities and services for their specific areas. These include
51

support for business, agriculture and tourism issues. Alongside this support the nodes will support opportunities for local economic development and transport amenities. Local Service Nodes for the communities surrounding these four main investment nodes are being developed in order to provide a level of local service for social and economic activities as well as traditional structures.
The sort of infrastructure envisaged for the rural investment nodes include such public facilities as municipal offices, sports fields, squares, community health centres, libraries and multipurpose centres. Alongside this are plans for facilitating private investment in the nodes.
5.2 Key Spatial Development Initiatives
In addition to the ABM programmes there are several other more specific spatial development initiatives which the municipality is providing with significant support. The four most important are the development of the iDube Tradeport, the development of the Riverhorse Valley Business Park, the expansion of the Port of Durban and the redevelopment of the Durban Point Waterfront. The first two are development projects and the latter two are renewal projects. Each of these initiatives is described in more detail below.
5.2.1 Port of Durban
The need for the current expansion at the Port of Durban has been precipitated by prolonged congestion at the port arising from a capacity crisis in virtually every aspect of port operations from the harbour entrance to wharf space, storage space, access roads and cranes. Steady and accelerating economic growth and the lowering of the barriers to international trade since the advent of democracy have resulted in increasing volumes of seaborne traffic to the port. A dramatic increase in exports and imports has put pressure on cargo handling facilities, in particular at the car terminal, at the off-shore petroleum facility and at the container terminal. The National Port Authority has, in co-operation with the city, developed a comprehensive port expansion plan which includes the purchase of additional straddle carriers and gantry cranes (including eight more super post-Panamax Liebherr cranes to add to the three already operating in the harbour), the building of a new access bridge, the Kangela Bridge, at a cost of R70 million, the reconstruction of Pier No. 1 to serve as an additional container terminal, the widening and deepening of the harbour entrance (including the construction of a new underwater tunnel), the relocation of the car terminal from Cato Creek to Salisbury Island and the relocation of the multi-purpose terminal. Work on the widening of the harbour mouth is expected to start at the end of 2007, take four years to complete and cost approximately R1.7billion. The entrance will be widened by nearly 100m and increase the draft from 12,8m to 16m. This will enable the harbour to handle 6500 TEU container vessels up from the current limit of 4700. Alongside this widening will be deepening of existing berths to handle bigger vessels. Alongside the existing car terminal an additional car terminal is planned at Salisbury Island. This 12 500 car capacity terminal will address the surge in demand for automobile imports and exports are expected to cost in the region of R1.6 billion. The existing car terminal cannot be expanded due to its location adjacent to the city centre.
5.2.2 Dube Tradeport and King Shaka International Airport
The Dube Tradeport will incorporate a new international airport, trade zone, cyberport, perishables facility, inter-modal freight transfer facility and other commercial and retail opportunities. The tradeport will be sited at La Mercy and is located 28 kilometres north of Durban’s city centre in close proximity to the Indian Ocean. The noise contours and the site topography enable the creation of high quality residential and commercial developments to the east of the site. This is facilitated by the existing ridge between the runway and the location of the residential and commercial developments. The site location will be designed to provide an attractive work, home and resort or recreation environment. Construction is due to start in March 2007 and to be completed by late 2009, with the airport scheduled to commence operations during the first quarter of 2010. The airport will be able to accommodate larger aircraft than the existing international airport as it will have a longer runway. Initially the terminal will be able to handle 7 million passengers per year but this capacity will be increased.
In 2005 the KwaZulu-Natal provincial government set aside R100 million for acquiring land and providing fencing and to contribute to the development of road interchanges. The eThekwini
52

Municipality has pledged more than R170 million to provide water, electricity and sewerage infrastructure for the area. It is anticipated that the new airport and tradeport will be a catalyst for future developments in agriculture and agro-processing for time-sensitive produce in the area.
In the base case scenario the contribution to KwaZulu-Natal GDP is expected to be R8.1 billion per annum and it is anticipated that the development will provide an additional R130 million to the annual rates revenues.
5.2.3 River Horse Valley Business Estate
River Horse Valley Business Estate is a joint venture between Moreland and the eThekweni Municipality and spans 302ha on either side of the N2 in the Effingham / Avoca area. 75ha of land available for commercial use is sold and an additional 35ha of land is being made available for sale.
Riverhorse is being developed as 15 separately identified mixed-use business parks, residential parks and two direct access service stations. There are development areas for retail, office development, hi-tech industry, light/service industry and warehousing, as well as a proposed medical park. About 3 500 construction jobs and 13 500 permanent jobs will be created. Total development costs will be around R230-million. New investment in building alone will amount to some R1.5 billion. This excludes plant and equipment, which could easily double the figure.
Negotiations to develop a private hospital within the proposed medical park are at an advanced stage. Total South Africa has developed two major petrol station complexes at a cost of about R60-million on the northbound and southbound carriageways of the N2. A new interchange and link roads being built in the area would make for easy access to the estate and would also ease congestion on the N2 and improve access from KwaMashu and future development nodes at Phoenix South.
The development is named River Horse because less than 100 years ago hippos - and elephants - freely roamed the area, which later became known as Sea Cow Lake, being translated from the Afrikaans "seekoei". River Horse is the direct translation from the Greek "hippopotamus".
There will be about 140 hectare of green, open space within the estate. As the estate grows, the vegetation and wetlands around the Umhlangane River would be restored, and the river itself enhanced to attract the original bird and animal life back into the area.
5.2.4 Durban Point Waterfront
Located at the entrance to the busiest port in Africa, the Durban Point Waterfront is one of South Africa's most significant and exciting property development and investment projects.
Durban Point is one of Durban's most historic and significant urban quarters. It has a superb location and enjoys access to a range of modes of movement including pedestrian, road, rail and sea and therefore has local, national and international connections.
Over the years Durban Point has been subject to creeping blight that has left it largely abandoned and vacant. Paradoxically it represents one of the most under-utilised assets within the city.
Intentions to revitalise the area have been mooted for several decades and it is only recently that significant redevelopment has occurred. Much of the renewed impetus for this initiative has been the implementation of the uShaka Marine World project. This "must-see-must-do" attraction was consciously targeted at creating a development impetus for the city, and Durban Point in particular, and is regarded as the catalytic project for the 55ha Durban Point site.
The trigger for the development of Durban Point can be found in the water reticulation and purification system for uShaka Marine World and the need to return that water to the sea via a canal. This led to the idea of creating a unique "waterfront city within a city" in which a system of canals forms the central spine of urban redevelopment and where the economic benefits of water frontage extend throughout the area.
The Durban Point initiative is therefore not just an attempt to extend the city fabric in a banal way nor is it intended to transform the area into an extended theme park or tourist resort. Rather Durban Point will become an important, well-defined and exciting addition to the city and a sought after place to live,
53

work and play. It is envisaged that a range of activities will be accommodated in a mixed-use environment containing a host of urban functions and reflecting a true urban place with 24-hour activity.
Destined to become one of Durban's most prestigious addresses, and a key tourist attraction, the Durban Point Waterfront is rapidly transforming from a previously run down precinct into a multi billion Rand property showcase. The current development includes 900 apartments which account for 77% of the areas available space and the remainder a blend of retail, office and hotel space. The percentage of retail space will increase with the completion of a 30 000sqm shopping centre. 28% of the total development has been sold.
5.2.5 King Senzangakhona Stadium
The 70 000 seat King Senzangakhona Stadium due for completion at the end of 2008 will be the anchor development around which the ‘central park of Africa’ will be established. The stadium will cost R1.6 billion and is being constructed on the old Kings Park Soccer stadium site, which has been demolished. This is the first project of this size and magnitude to be undertaken in KwaZulu-Natal. It is expected that the new venue will host a world cup semi-final and will be central to Durban’s ambitions of hosting future Commonwealth and Olympic Games.
Artist’s impression of the proposed King Senzangakhona Stadium Source: www.durban.gov.za 5.3 Widespread Infrastructural Programmes
An extensive and widespread programme of extending and upgrading roadworks is planned for the city. These are not spatially focused but are spread throughout the city. Individual projects include:
54

• Western freeway (N3) into Durban to be widened to four lanes and resurfaced. Total cost: R90-million.
• Bayhead Road to be extended, via Khangela Bridge, to make it the main access for Durban
Container Terminal, linking Bayhead to M7 and Edwin Swales VC Drive. The new link bypass will cross the southern freeway to Edwin Swales. Cost: R70-million.
• A new MR577 road, connecting Duffs Road to Pinetown, to be built, creating a direct link
between Pinetown and the north. Cost: R450-million
• Continuation of one-way Point Road and Shepstone Road improvements, to keep abreast of Point development. Cost: R135-million.
• A separated interchange at Stanger Street and Argyle Road. Cost: R55-million
• Hillcrest roads to be upgraded, including improvements to Old Main Road and Inanda Road.
An extra east-facing ramp on to M13 to be built to assist entrance into Hillcrest. Cost: R60-million.
• Improved link, using existing roads connecting Bellair and Jan Smuts Highway, is in the
planning stage. Cost: R120-million over five years. Depends on fund availability.
• Edwin Swales VC Drive widened to three lanes each way, from South Coast Road to N2, to deal with harbour and industrial traffic.
• Cato Manor Road to be widened, with new link to bypass Bellair Road. It will take five years to
complete. Cost: R120-million.
• North Coast Road in the final stages of significant improvements. 5.4 Conclusion This chapter has described the key economic nodes and areas of development identified by the eThekwini Municipality and the range of investments and developments made therein. By paying attention to both rural and inner city areas, the municipality has managed to prioritise poverty alleviation and job creation without sacrificing economic growth. We have also seen attention has been paid to some the key challenges that were identified in chapter 2, such as the development of the new international airport and the measures being taken to alleviate congestion in the port. Along with other key infrastructural development programmes and the new King Senzangakhona stadium, it is clear that the city is in the process of a period of heightened investment which should impact positively on the local economy.
55

Services and Delivery
CHAPTER 6
ETHEKWINIMUNICIPALITY56

6.0 Introduction
The eThekwini Municipality comprises both rural and urban areas as well as a wide spread of income groups. Due to this variation in living environments the metropolitan area has a large number of households who currently do not have access to some of the services and facilities enjoyed by many of its other residents. These include basic services such as electricity, water, ablution facilities and access to telephones. The Labour Force Survey conducted by Statistics SA includes data from 33 000 households surveyed nationally to determine, inter alia, access to these type of facilities. This chapter will begin by assessing the service delivery status quo, and will then look at current projects and proposals that are in place to address the shortfalls.
6.1 Distribution of Facilities
The vast majority of households in the metropolitan area have nearby access to running water and most do not have to travel to acquire water. However, roughly 10% of households do have to travel to collect water. For the majority of these households the walk is less than 15 minutes, but for some 3.3% of households the nearest source of water is more than 15 minutes away. This represents 36 000 households, 12 000 of whom have to walk more than 60 minutes to collect water. The majority of households in the metropolitan area have access to electricity. Some 894 000 of the 1.06 million households use electricity as their means of cooking. A very small portion utilise gas as a means of cooking, whilst a significant portion still rely on paraffin for their cooking fuel. More than 13% of the total, some 140 000 households utilise paraffin, Wood was still used as a cooking fuel in more than 22 000 households in 2004. Landline telephones are not common household items in the metropolitan area with only 30 % of households having access to such facilities. Much has been said about the growing digital divide in South Africa and addressing this lack of infrastructure would go a long way to improving access to information for the average household. The municipality recently announced plans to afford all households free telephone connectivity through the electricity cable network, but this proposed solution faces regulatory obstacles. The percentage of households with no access to toilet facilities is very small, at 1.1%. However, more than 12 700 households currently do not even have access to basic pit latrines. Whilst 55 % of households utilise flush toilets within their dwellings, the remaining 45 % have to access toilet facilities outside of their dwelling. A further 18.5 % of households access a flush or chemical toilet on their property, but outside of the dwelling house. Pit latrine usage is fairly high with more than 247 000 households making use of this form of toilet. This represents 23% of the total households in the district. Only 30 % of these pit latrines are ventilated. The bucket system is utilised by more than 13 000 households in the municipality.
6.2 Dwelling Types Nearly half of households in the eThekwini Municipality live in formal freestanding dwellings. An additional 203 000 households are in apartments or flats and cluster developments such as retirement villages and estates account for a further 15 500 households. Whilst the vast majority of the inhabitants of the metropolitan area are housed in conventional dwellings, 257 000 households are considered to be living in informal housing or shacks. These households are mostly located within 540 recognised informal settlements within the eThekwini municipal boundaries. The official municipal estimates are that these settlements are home to 155 000 families. Labour Force Survey data suggests, however that the housing shortage in the eThekwini Municipality is larger than is suggested by the extent of the informal settlements. The municipality has a total backlog of 205 000 housing units when one considers overcrowding as well as housing in informal settlements. Furthermore, this would not address those traditional dwellings and conventional homes which require significant reconstruction to achieve satisfactory living environments. At the current rate of funding the backlog would only be addressed in the year 2022 given the current municipal allocation from the Department of Housing of 16 000 subsidies per annum. Since 1994 more than 170 000 subsidies have been approved within the municipality and 100 000 of those homes are complete.
57

Figure 6.1: Dwelling Types Source Statistics South Africa Labour Force Survey
6.3 Quality of Life Survey The Quality of Life Survey conducted by the municipality has assisted in ascertaining those needs listed by eThekwini residents as necessary to a good quality of life. These include higher levels of personal health, sufficient income, good family life, security and happiness. Furthermore the African sub-sector placed importance on increasing leisure activities, welfare services and reducing the developmental backlogs. Typically those public services listed as being of most importance to residents were:
• Health services • Police services • Education facilities • Public transport • Libraries • Parks and recreational areas
Not surprisingly those residents from the under-invested townships where large-scale informal settlements exist were seen to have the highest number of additional needs to upgrade their quality of life.
6.4 Meeting the needs of residents In order to address the backlogs in service delivery and improve access by residents to basic services and facilities the municipality has laid out a strategic plan to multi-functional social, cultural and recreational services and facilities in its Integrated Development Plan. The plan has eight programmes aimed at addressing these needs. • Programme 1: Rental housing strategy - The aim is to have fully serviced, well maintained,
quality living environments to meet the needs of the citizens of eThekwini. • Programme 2: New housing development – the housing delivery programme is adopted to
ensure that all who live in the municipality are adequately accommodated. This housing
Traditional Dwellings4%
Conventional Housing72%
Informal Housing24%
58

programme makes provision for associated services such as water, electricity, roads, storm water, sanitation, leisure and road naming to be delivered in an integrated manner.
• Programme 3: Address service backlogs - Services that are to be targeted include water,
electricity, solid waste, sanitation, roads, and the programme for the greening of the municipality through planting of street trees and landscaping in key areas. Special attention is to be given to the project to provide street addresses to all houses in the eThekwini Municipality.
• Programme 4: Infrastructure asset management - It is intended to establish an
infrastructure asset management system that will assist with the development of an infrastructure maintenance policy, including maintenance, refurbishment and replacement of strategic assets to ensure their longevity and sustainability.
• Programme 5: Infrastructure development - The municipality is preparing an infrastructure
development policy and a bulk platform infrastructure plan to meet its social and economic development needs.
• Programme 6: Sustainable supply of community facilities - A policy for the multi-use of
facilities by identifying and evaluating options, and a policy for sustainable management of facilities including community participation in facilities management, are to be undertaken.
• Programme 7: Sustainable public spaces - A number of greening projects ranging from
nodal street landscaping, urban renewal upgrading, people mover stops and heritage trails are planned and will be implemented throughout the metropolitan area and rural ABM nodal developments.
• Programme 8: Implement an effective public transport system - The overall goal for
transport in eThekwini is to implement an effective, efficient, sustainable, safe and secure public transport plan to promote public transport over private transport and to develop a public transport system with services which are customer-focused and needs-driven in both urban and rural areas.
Addressing service backlogs is not just a case of installing infrastructure, however. It takes decisions on what level of infrastructure is acceptable for an area. Is installing a water point within 200m of a household seen as completing the municipality obligation to provide water to its citizens, or is this just a stopgap measure to service delivery? In terms of service delivery, great strides have been made. The municipality has delivered 15 000 houses per annum to persons unable to finance houses themselves. Alongside this achievement, thousands of kilometres of water lines, roads and other services have been installed. The municipality currently believes that there are 140 000 urban and 65 000 rural households who do not have access to adequate services such as quality housing, water, electricity and sanitation. In order to meet the developmental needs of the community whilst maintaining its existing infrastructure and service level to already developed areas, the municipal budget takes some degree of careful balancing. Refuse removal and the electricity grid now cover the entire metropolitan area and it is expected that water services will do so in the coming two years. However this does not mean that all have access to these services as formalizing the access to these services is as important as providing the network for their availability.
6.5 Conclusion
In this chapter we have seen that vast strides have been made by the municipality in addressing the service delivery backlog that it inherited. It is also clear, however, that there are many challenges that remain, challenges that are in some ways created by the city’s very success in addressing the basic needs of its inhabitants. The inherent problem with this level of service delivery and the nature of the metropolitan area as the economic hub of KwaZulu-Natal is that it will always attract new people seeking work and requiring additional housing and access to services. This is well indicated by the skewed population pyramid in chapter 3 where the proportion of young working age people
59

living in the municipality relative to the number living in the province is quite high. Ironically, by providing better access to jobs, services and housing as compared with its more rural neighbouring districts, the municipality is placing additional pressure on itself as people come to live in its suburbs.
60

Conclusions
CHAPTER 7
ETHEKWINIMUNICIPALITY61

7.0 Introduction
The eThekwini Municipality is on a mission. From the ever present signs of construction and development currently present in what were once decaying, neglected areas of Durban; to the innovative approaches instigated by local government to combating poverty and disease; and the array of new sporting events and infrastructure, from the A1 and Formula 1 Master’s Grand Prix to the new King Senzangakhona Stadium; it is clear that in spite of enormous challenges the metropolitan government is willing to tackle opportunities head on. This proactive approach is the eThekwini Municipality’s key strength, attested to by various awards including the 2004 Vuna Award for the Best Achieving Municipality in South Africa, awarded by the Department of Provincial and Local Government and the 1999 Global Achievement Award for being one of the world’s ten best international cities – the only recipient on the African continent. The municipality governs one of the few debt-free cities in South Africa and has the best credit rating (AA).
7.1 A Mixed Outlook for the Major Sectors
This report has shown that the eThekwini metropolitan area is the third biggest contributor to South African economic output, generating R135 billion in 2005, 10% of national GDP. While the growth rate of 3.15% between 2001 and 2004 has not been as fast as that of Cape Town or Johannesburg, there are sectors that have experienced strong and sustained growth.
The transport, storage and communication sector has grown by over 6% per annum from 2001-2004 and the Port of Durban handled an estimated total of over 69 million tonnes of cargo and containers in 2004/5, with 61% of all South Africa’s containerised cargo, and 54% of the breakbulk cargo moving through the port (National Ports Authority, 2006). With the massive increases in the global volume of seaborne traffic, and the strategic location of the port in relation to the industrial hinterland, eThekwini Municipality is uniquely poised to capitalise on its unique asset. However, increasing delays and infrastructural constraints mean that the significant investments that have been made in the port will need to be increased if the Port of Durban is to retain its position in the face of competition from other East Coast ports like Richards Bay, Port Elizabeth and Maputo.
We have also found that the retail, construction, and financial, insurance, real estate and business services sectors all grew at a very strong rate of over 6% in the 2004/5 period, and the importance of tourism to the region was reaffirmed by the finding that foreign tourists alone spent over R2.3 billion in 2004. As such, it is clear that the service sector as a whole is extremely important for the metropolitan area, and that it has shown remarkable growth in some sectors. Iin spite of national trends, manufacturing remains the largest contributor to the local economy, employing 24% of all formal sector workers, and while the industry as a whole grew at a mere 2.75% from 1995-2005, the petroleum and chemical products industry experienced phenomenal growth, increasing in size by over 50% in the seven years from 1995-2001. This growth has unfortunately not been matched by an increase in employment, and the phenomenon of jobless growth has hit the manufacturing sector particularly hard.
7.2 Unemployment, Poverty and Health Concerns
Employment is a major issue in eThekwini metropolitan area, as evidenced by the fact that 34.4% of the population of the eThekwini Municipality is unemployed according to the strict definition of unemployment, the highest rate for any metropolitan area in South Africa, and this has had a knock on effect in relation to the other major problems faced by the city. With the number of people living on under US$2 a day increasing from 5.5% in 1996 to over 9.3% in 2004, 24% of the population in shacks and the amount of money needed to lift all those in poverty out of poverty now standing at R1.5 billion, the municipality faces a truly Herculean task, exacerbated by the competing demands of its rural and urban inhabitants. These current inhabitants are constantly being joined by waves of job-seekers from outside the Metro, as shown by the population pyramid in chapter 3, and they will put added pressure on local
62

service delivery. In addition, the metropolitan area has the highest HIV/AIDS prevalence rates of any health district in the country, and the lowest cure rate for tuberculosis in the country.
The scale and extent of these problems cannot be underestimated, and HIV/AIDS and poverty in particular cannot but impact negatively on the future economic development of the metropolitan area on a level that cannot immediately be comprehended. This is particularly true when, as pointed out in this report, one looks at the impact on the families of the affected and the resultant disruption to support structures and education. The report has also pointed to the many strides that have been made in terms of service delivery. Education levels in eThekwini are far above provincial levels, and the city has 7% of South Africa’s students. Apart from delivering over 15 000 houses a year, the metropolitan government has lowered the proportion of people with no access to sanitation to 1.1% and has a launched a number of innovative projects to address this challenge. It has also laid thousands of kilometers of water lines and roads, and the majority of its residents now have access to electricity. The health department is fully staffed, and the metropolitan police service continues to provide high levels of service.
7.3 Future Developments
This high level of service delivery that has characterised the metropolitan area is complemented by the area based management programmes and key spatial development programmes detailed in Chapter 5. With the development of the iDube Tradeport which includes a new international airport, the expansion of the Port of Durban and the redevelopment of the Durban Point Waterfront amongst other projects, the metropolitan government has shown it’s commitment to developing the infrastructure of the city and large scale private investment has followed, with over R1 billion already committed to new infrastructure and building complexes at the Durban Point for example. Further evidence of this investor confidence is revealed in the phenomenal increases in building plans, a significant indicator of future economic activity, passed by the eThekwini Municipality, which more than doubled in square metre terms between 2003 and 2005. One area that does still need to be addressed however, is the lack of an affordable, efficient and safe public transport system.
7.4 Conclusion
The eThekwini Municipality boasts an economy that inspires a great deal of confidence, in spite of the challenges that it faces, and with the benefits of a sub-tropical climate, effective local government and strong infrastructure investment, it looks set to continue on a stable upward growth trajectory.
63

Maps Map 3.1 Land Use in the eThekwini Municipality Source: Office of the City Manager: Corporate Policy Unit. 12 Sep 2005. “eThekwini’s City Strategy 2005/6: Brown Bag Seminar, UKZN” Map 5.1 Map of Spatially Focused Development Programmes Source: www.durban.gov.za/eThekwini/Municipality/abm/maps Tables Table 3.1 Land Use in the eThekwini Municipality Source: Office of the City Manager: Corporate Policy Unit. 12 Sep 2005. “eThekwini’s City Strategy 2005/6: Brown Bag Seminar, UKZN” Table 3.2 Comparing employment and unemployment in major metropolitan areas, 2005 Source: Own calculations, based on labour force survey estimates September 2005 Table 4.1 Average Monthly increase in Commercial space in Durban Source: Coetzee, C et al. 2005. Economic and Business report – Durban and eThekwini Metropolitan Area 2005
Table 5.1 The spread of employment across eThekwini by type and number of jobs, 2001 Source: Durban Investment Promotion Agency (DIPA) website based on estimations by Jon Van Coller and national census data (2001) Figures and Graphs Figure1.1 Sectoral shares of national GDP, 2004 Source: this study, based on data from the Quantec regional database Figure 3.2 The contribution of metropolitan areas to South African GDP, 2004 Source: This study, based on Quantec standardised regional series, 2004 Figure 3.3 The changing composition of the economy of the eThekwini Municipality, 1995 vs. 2005 Source: This Study, based on Quantec regional database estimates. Figure 3.4 Sectoral shares of national GDP by major metropolitan areas, 2004 Source: this Study, based on data from the Quantec regional database Figure 3.4 Ethekwini Municipality and KwaZulu-Natal Population Pyramids, 2004. Source: This Study, based on estimates from the Global Insight Regional Economic Focus database Figure 3.5 Demographic breakdown of largest metropolitan areas by ethnic group, 2004 Source: This Study, based on Quantec standardised demographic series Figure 3.6 A breakdown of employment in the eThekwini Municipality by broad sector, 2005 Source: This Study based on estimates from StatsSA Labour Force Survey Sept 2005 Figure 3.7 The sectoral composition of formal and informal employment in eThekwini, 2005 Source: This study, based on estimates from the Statssa labour force survey 2005. Figure 3.8 Education profile of persons aged 20-64 in eThekwini, 2005 Source: This Study, based on Statssa labour force survey estimates 2005 Figure 3.9 A comparison of the education profiles of three major metropolitan areas, 2005 Source: This study, based on Statssa labour force survey estimates September 2005 Figure 3.10 Learner-to-educator ratios in eThekwini Municipality schools, 2004 and 2006
64

Source: This study based on data obtained from the DoE’s KwaZulu-Natal EMIS Figure 3.11 Senior Certificate Examination results in the eThekwini Municipality and KwaZulu-Natal 2003-2005 Source: This study, based on data from the DoE examinations office in eThekwini and DoE(2006) Figure 3.12 A comparison of the percentage of the population living below two given poverty lines, 1996 and 2004 Source: Global Insight Database Figure 3.13 Spatial and Racial Distribution of poverty in eThekwini, 2004 Source: Global Insight Database Figure 3.14 HIV prevalence among antenatal clinic attendees 2004/5 Source: This study, based on data from the District Health Barometer 2006 Figure 3.15 Number of Crimes reported in Durban, 1997/8-2004/5 Source: This study based on data from the SAPS Figure 3.16 Number of Murders in Durban, 1997/8-2004/5 Source: This study based on data from the SAPS. Figure 4.1 Contribution to total GDP by Sector for 2005 Source: This study using data from Quantec Standardised Industry Database Figure 4.2 Total GDP per sector for eThekwini metropolitan area (1995-2005) Source: This study from Quantec Standardised Industry Database Figure 4.3 Average annual growth by sector for the eThekwini metropolitan area Source: This study from the Quantec Standardised Industry Database Figure 4.4 Performance and size of manufacturing industries in eThekwini metropolitan area 2001-2005 Source: This Study, based on Quantec Regional database estimates, 2000 prices Figure 4.5 A comparison of output trends in selected manufacturing industries Source: This study, based on data from the Quantec standardised industry series. Figure 4.6 A comparison of employment trends in selected manufacturing industries Source: This study, based on data from the Quantec standardised industry series Figure 4.7 Middle class houses - All sizes - Purchase Price (Unit: Smoothed Rand) Source: This study based on data supplied by ABSA Figure 4.8 Size and Geographic Distribution of the Durban Office Market Source: This Study is based on Table 5 in Viruly Consulting.2005. “Property Market Review 2006/7” Figure 4.9 Total Building Plans Passed for non residential projects in Durban (sqm) Source: eThekwini Economic Development Unit, copied from Graph 2, “Property Market Review 2006/7” Prepared by Viruly Consulting (Pty) Ltd for the eThekwini Municipality Economic Development Unit Figure 4.10 Total Number of TEU’s per month for the Port of Durban January 2002 – July 2005 Source: This Study from National Ports Authority Statistics. Figure 4.11 Source of Durban’s Foreign Tourists Source: Based on SA Tourism, 2005 Figure 4.12 Durban’s Top 10 Source Markets Source: Based on SA Tourism, 2005 Figure 4.13 Location of Informal Business’s in Durban Source: This study based on data from a survey of 507 Informal Traders in Durban, reported in Skinner C, 2005:26 Figure 6.1 Dwelling Types Source Statistics South Africa Labour Force Survey
65

References ABI website. Available from http://www.engineeringnews.co.za/eng/features/food/?show=19450 [Accessed on 24 July 2006] ABSA (2006) Property Trends: Residential Building Statistics 22 May 2006 ABSA (2006). Quarterly residential property perspective. 3rd Quarter 2006. ABSA (2006) House Price index 5 July 2006 AECI website. Available from http://www.mbendi.co.za/indy/chem/af/p0005.htm [Accessed on 21 July 2006] Altbeker, A (2005) “Positive Trends, The 2004/5 Crime Statstics” in SA Crime Quarterly: No 14, December 2005 Arde, G (2006) “R5.6 Billion Investment boom for KZN” in The Mercury, 14 August 2006. Barron, P et al (2005) District Health Barometer. Durban: Health Systems Trust Bureau for Economic Research (2005) Economic prospects April 2005. Bureau for Economic Research (online). Available from www.ber.sun.ac.za [Accessed on 24 June 2005] Business Day Reporter (2006) “New SA Property Boom Coming?”. Business Day. 12 July 2006 Cameron (2005) Spatial Economic Analysis: On the need for sub-national economic models and data in South Africa. Journal of Development Perspectives 1(1),pp.146-163. Casale, D. and Posel, D (2004) “A Review of the Labour Market in KwaZulu-Natal, 1995-2003.” Economics. University of KwaZulu-Natal City of Durban-SAPOA. “Durban ain’t what you remember it to be”. Eprop 19 April 2006. Available from http://www.eprop.co.za/news/article.aspx?idArticle=7149 [Accessed on 3 August 2006] Clark, G. (1994) “Durban’s poor fight for clean air” 13 December 2004. Available from http://news.bbc.co.uk/1/hi/sci/tech/4091535.stm [Accessed on 3 August 2006] Coetzee, C et al (2005) Economic and Business report – Durban and eThekwini Metroploitan Area 2005 Cokayne, R (2005) “Toyota and government join up for KZN automotive suppliers' park” Business Report, 19 October 2005 Cullinan, K (2004) "KwaZulu-Natal struggling to keep up" 17.05.2004. Available from www.healthe.org.za [Accessed on 3 August 2006] Cullinan,K & Reid,L (2005) "Hospital slashes babies’ HIV infection rate" 17.08.2005. Available from www.healthe.org.za [Accessed on 3 August 2006] Cullinan, K. (2006) “Shacklands pose biggest challenge to eThekwini metro” 28.02.2006. Available from www.health-e.org.za/ [Accessed on 3 August 2006] Department of Education (2006) Senior Certificate Examination (SCE) results Development Praxis (Nd) “First Draft Policy framework for improved management and control of itinerant traders” Dunlop website. Available from http://www.dunlop.co.za/ [Accessed on 21 July 2006] Durban Investment Promotion Agency (DIPA) website. Available from: www.dipa.co.za/Economic_Nodes78.aspx [Accessed 11th August 2006] Durban Informal Economic Policy, October 2000 Durban Metro (1999) “Weather” Available from http://ceroi.net/reports/durban/drivers/Climate/index.htm [Accessed on 3 August 2006]
66

Eedes, J. (2004) “Durban Property on the Rise” FDI Magazine 2 June 04. Available from www.fdimagazine.com/news/categoryfront.php/id/76/SOUTH_AFRICA.html [Accessed on 3 August 2006] Engen website. Available from http://www.engen.co.za/home/server/refinery/default.asp [Accessed on 21 July 2006] Enslin, S (2006) “Group Five, Grinaker front runners for airport deal”. Business Report. 28 April 2006. Enslin, S (2006) “KZN makers of car parts outstrip other regions in capex” Business Report, 11 May 2006 Ensor, L. (2006)“Winds of change gusts through SA’s Air”. Business Day, June 20, 2006. eThekwini Economic Development Unit (2005) “Property Market Review 2006/7” Prepared by Viruly Consulting (Pty) Ltd for the eThekweni Municipality Economic Development Unit eThekwini Municipality (2005) Rural Investment and Local Service Nodes- Ensuring appropriate integration of services, opportunities and activities. Information brochure produced by the Area Based Management Programme. eThekwini Municipality official website, Available from: www.durban.gov.za/eThekwini/Municipality/abm/maps [Accessed 11th August 2005] eThekwini website “Purpose Statement” Available from http://www.durban.gov.za/eThekwini/Council/about/vision [Accessed on 1 August 2006] eThekwini websitee “Vision” Available from http://www.durban.gov.za/eThekwini/Council/about/vision [Accessed on 1 August 2006] Faniso, M (2006) “ACSA agrees to new Durban airport”, Business Report, 11 August 2006 Ferroprint website. Available from http://www.ferroprint.co.za/origins.htm [Accessed on 20 July 2006] Frost, S.(2006) “Durban’s ugly duckling emerges as SA’s new swan.” Eprop 8 March 2006. Available from www.eprop.co.za/news/article.aspx?idArticle=7007 [Accessed on 3 August 2006] Hanushek, E (2005) “Why Quality Matters in Education” in Finance and Development. June 2005, Vol 2, No 2 Hayter, R. (2005) “Property market buoyant in Umlazi and KwaMashu” 22 September 2005. Available from www.rodneyhayter.com/catstory.php?category=Secondary%20market [Accessed on 3 August 2006] Hemson, D (2003) “CBD Durban with special emphasis on Warwick Junction” Available from http://www.sapref.com/people.htm, and http://www.sarpn.org.za/documents/d0000875/docs/CBD%20DurbanWithSpecialEmphasisOnWarwickJunction.pdf [Accessed on 3 August 2006] IMF (2005) World Economic Outlook – Globalisation and External Imbalances. International Monetary Find (online). Available from www.imf.org [Accessed on 24 May 2005] I-Net Bridge (2006) “Tiger Brands goes drinks shopping”. I-africa.com 4 April 2006. Available from http://business.iafrica.com/news/168602.htm [Accessed on 24 July 2006] Inggs, M (2005) “Pinetown Printers aims to double turnover with a R16m upgrade” Business Report, 12 September 2005 Inggs, M (2006) “Ferroprint’s investment pays off” Business Report, 19 July 2006 Inggs, M (2006) “Mr Price joins cluster to boost competition” Business Report 6 July 2006 Inggs, M (2006) “Ninian and Lester thriving” Business Report 19 June 2006 JHI Group. (2006) 2006 SA Property Report
67

JHI Real Estate. 2006. “National Retailers Demanding space in Durban CBD.” Eprop 9 May 2006. Available from http://www.eprop.co.za/news/article.aspx?idArticle=7221 [Accessed on 3 August 2006] Khumalo, G (2006) “New Billing System is Paying Off” Available from http://www.sacities.net/2006/feb20_billing.stm [Accessed on 11 August 2006] KZN Health Website. “Health Statistics available for KwaZulu-Natal”. Available from www.kznhealth.gov.za/italian.htm [Accessed on 3 August 2006] Liggans G and Nriagu J. (1998) “Lead poisoning of children in Africa, IV: Exposure to dust lead in primary schools in south-central Durban, South Africa” in The Science of the Total Environment 221 (1998) 117-126 Loos, J. 2006.Office Property Market Update. FNB. 10 July 2006 Mboto, S (2006) “Durban to net R100m from A1 Grand Prix” Available from http://www.sacities.net/2005/dec9_ethekwini.stm [Accessed on 11 August 2006] Mercury Reporter (2006) “New airport ready by 2010, says Radebe”, The Mercury 11 August 2006 Meth, C. and Dias, R. (2003) Increases in poverty in South Africa. Development Southern Africa.21(1), pp. 59-61. Muller, McGill and Skinner (2006) KwaZulu-Natal Economic Review 2005. Bishopsgate: KwaZulu-Natal Department of Economic Development Naidoo R et al. 2006. “South Durban Health Study”. Naledi (2004) “Pulp and Paper Products Resource Book”. Available from http://www.naledi.org.za/docs/pulppaperSJS.pdf [Accessed on 20 July 2006] Nampak website. Available from http://www.nampak.co.za/scripts/divisions/showdivision.asp?di_code=tissue [Accessed on 20 July 2006] National Ports Authority (nd) “Durban” Available from http://www.npa.co.za/Ports/Durban/Index.htm [Accessed on 10 August 2006] National Ports Authority website (2006) Available from http://www.npa.co.za/Ports/Durban/Index.htm [Accessed on 11 August 2006] NCT Forestry Ltd website. Available from http://www.nctforest.com/showpage.asp?id=21&contentid=258&catid=19 [Accessed on 20 July 2006] Ndebele, S. (2006) Speech by KwaZulu-Natal Premier Sibusiso Ndebele at Growth Coalition breakfast meeting 11 August 2006 Available from http://www.info.gov.za/speeches/2006/06081115151002.htm [Accessed on 13 August 2006] Njobeni, S.(2006). “Building costs to level off this year.” Eprop 18 Jul 2006 Available from http://www.eprop.co.za/news/article.aspx?idArticle=7542[Accessed on 3 August 2006] Nriagu, J et al. (1996) “Atmospheric Lead pollution in KwaZulu/Natal, South Africa” in The Science of the Total Environment 191 (1996) 69 – 76 Office of the City Manager: Corporate Policy Unit. (2005). “eThekwini’s City Strategy 2005/6: Brown Bag Seminar, UKZN” PIFSA website. Available from http://www.pifsa.org/ [Accessed on 20 July 2006] Pillay, T(2006). “Durban set to become Africa’s most liveable city after 2010” in The Sunday Times Extra, 13 August 2006 Plastamid website. Available from http://www.plastamid.co.za [Accessed on 21 July 2006] Printability website. Available from http://www.printability.co.za/ [Accessed on 20 July 2006] Property24. (2005). “Rents rising fastest in Durban”. 7 July 2005. Available from www.property24.com/Property24/Hub/Rental_Full.asp?articleid=2464[Accessed on 3 August 2006]
68

Protea Chemicals-KZN website. Available from http://www.proteachemicalskzn.co.za/ [Accessed on 21 July 2006] SA Paper Chemicals website. Available from http://www.sapc.co.za/ [Accessed on 21 July 2006] SA Paper Mills website. Available from http://www.sapaper.co.za/co_profile.htm [Accessed on 20 July 2006] SAB website. Available from http://www.sablimited.co.za/SABLtd/Primary/ExploreSAB/Breweries/Default [Accessed on 24 July 2006] SAPREF website. Available from http://www.sapref.com/ecocon.htm, http://www.sapref.com/profile.htm, Shipping News (nd) “Port of Durban” Available from http://www.ports.co.za/durban-harbour.php [Accessed on 10 August 2006] Skinner, C (2005) “Constraints to Growth and Employment in Durban: Evidence from the Informal Economy”. SDS Research Report No. 65
Skinner, C and Lund, F (2006) “Local Government Innovations for the Informal Economy: Creating a Positive Investment Climate” in Development Outreach, February 2006. Skinner, C. (2000). Getting institutions right?: local government and street traders in four South African cities. Urban Forum, 11(1), 51-71. South African Cities Network (2004) “State of the cities Report :Chapter 2“ Available from http://www.sacities.net/2004/Chapter2b.pdf [Accessed on 5 August 2006] South African Forestry, Pulp and Paper Industries (2004) Draft Background Information. South African Police Services Website. “2005 Crime Statistics” Available from http://www.saps.gov.za/statistics/reports/crimestats/2005/crime_stats.htm. [Accessed on 1 August 2006] South African Savings Institute (2005) The Savings Barometer Q4/2004. South African Savings Institute (online). Available from http://www.savingsinstitute.co.za/ipac.html. [Accessed on 5 June 2005] Statistics South Africa (2005) Labour Force Survey September 2000 to March 2005, Historical series of revised estimates. Available from www.statssa.gov.za [Accessed on 29 September 2005] Statistics South Africa (2005) “Labour Force Survey, September 2005” Available from www.statssa.gov.za [Accessed on 29 July 2006] Statistics South Africa (2006) “Selected building statistics of the private sector as reported by local government institutions, 2005.” Available from www.statssa.gov.za [Accessed on 29 July 2006] The Presidency (2003) Towards a Ten Year Review: Synthesis report on implementation of government programmes. Policy Coordination and Advisory Services (PCAS) Tiger Brands (2004) “Annual Report”. Trade and Investment KZN website. “Clothing and Textiles” Available from http://www.tikzn.co.za/sectors/clothing/index.jsp [Accessed on 3 August 2006] UN (2005) World Economic Situation and prospects 2005. New York: United Nations Unilever website. Available from http://www.unilever.co.za/company_foods.asp[Accessed on 24 July 2006] Vermaak, C (2005) Trends in Income distribution, inequality and poverty in South Africa and the effects on poor whites: an analysis of the household survey data, 1995-2001. Paper to the biennial conference of the Economic Society of South Africa. Durban. 7-9 September 2005. World Bank for Reconstruction and Development (1995) Priorities and Strategies for Education. Washington DC: World Bank
69

World Health Organisation. “WHO statistics”. Available from http://www.who.int/whosis/whostat2006/en/index.html [Accessed on 3 August 2006] Xaba, J et al (2002) “The informal sector in Sub-Saharan Africa”
70