Embed Size (px)
Citation preview
ABSTRACTAdvances in engine technology including Gasoline Directinjection (GDi), Dual Independent Cam Phasing (DICP),advanced valvetrain and boosting have allowed thesimultaneous reductions of fuel consumption and emissionswith increased engine power density. The utilization of fuelscontaining ethanol provides additional improvements inpower density and potential for lower emissions due to thehigh octane rating and evaporative cooling of ethanol in thefuel. In this paper results are presented from a flexible fuelengine capable of operating with blends from E0-E85. Theincreased geometric compression ratio, (from 9.2 to 11.85)can be reduced to a lower effective compression ratio usingadvanced valvetrain operating on an Early Intake ValveClosing (EIVC) or Late Intake Valve Closing (LIVC)strategy. DICP with a high authority intake phaser is used toenable compression ratio management. The advancedvalvetrain also provides significantly reduced throttling lossesby efficient control of intake air and residuals. Increasedethanol blends provide improvements in power density due toknock resistance. Knock resistance also provides a significantpotential for reduced NOx since higher dilution withoutknock is enabled at moderate loads typical of normal driving.E85 also shows significant advantages for particulateemissions that enable broader authority in selection ofoptimal injection timings for improving efficiency. Anincrease in the ethanol content improves low end torqueproviding an addition opportunity for improved fuel economyby using down-speeding for more efficient vehicle operation
INTRODUCTION
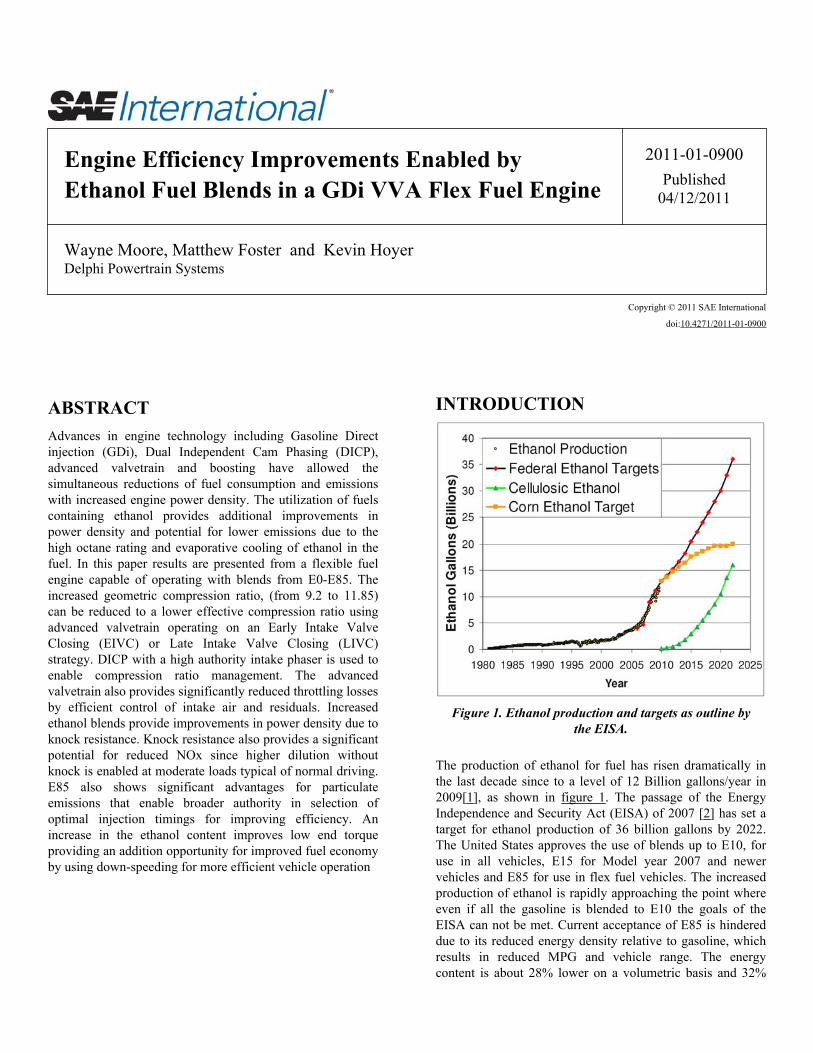
Figure 1. Ethanol production and targets as outline bythe EISA.
The production of ethanol for fuel has risen dramatically inthe last decade since to a level of 12 Billion gallons/year in2009[1], as shown in figure 1. The passage of the EnergyIndependence and Security Act (EISA) of 2007 [2] has set atarget for ethanol production of 36 billion gallons by 2022.The United States approves the use of blends up to E10, foruse in all vehicles, E15 for Model year 2007 and newervehicles and E85 for use in flex fuel vehicles. The increasedproduction of ethanol is rapidly approaching the point whereeven if all the gasoline is blended to E10 the goals of theEISA can not be met. Current acceptance of E85 is hindereddue to its reduced energy density relative to gasoline, whichresults in reduced MPG and vehicle range. The energycontent is about 28% lower on a volumetric basis and 32%
Engine Efficiency Improvements Enabled byEthanol Fuel Blends in a GDi VVA Flex Fuel Engine
2011-01-0900Published
04/12/2011
Wayne Moore, Matthew Foster and Kevin HoyerDelphi Powertrain Systems
Copyright © 2011 SAE International
doi:10.4271/2011-01-0900
lower on a mass basis. Despite its lower energy densityethanol blends offer significant benefits with respect toincreased power density due to its high octane rating andlatent heat of vaporization. E85 can operate more efficientlyand produces lower warmed up exhaust emissions.Difficulties include cold starting, primarily at low ambienttemperatures due to poor vaporization. Corrosion andcompatibility with materials are also critical such that flexfuel vehicles must be specifically designed and calibrated tooperate on E85 and intermediate blends. These designedmodifications are well outlined in [3,4,5] and include issuesof pump flow capability, injector flow capability anddynamic range, injector deposits, valve seat, ring, liner andpiston durability. Ethanol usage in other markets is alsodriving development including E85 in Sweden and E100 inBrazil [5].
The investigation of ethanol as a fuel to leverage its ability toincrease power density due to its high octane and latent heatof vaporization has been studied in various platforms.Evaluation on a CFR engine was able increase the knocklimited Compression Ratio (CR) to 16.5:1 at 900 RPM withE85 [6]. Evaluation with a port injected engine with the CRincreased to 13 showed demonstrated knock free operationabove E50 blends but low end torque suffered withconventional gasoline and E10-20 blends[7]. Researchersinvestigated the effect of valvetrain modifications forimproving cold start ability by using Late Intake ValveOpening (LIVO) with closing near Bottom Dead Center(BDC) to increase mixing and maximize compression heating[7,8]. These evaluations were able to reduce cold starttemperatures to −35 C with a 10.5 CR port fueled engine.Ethanol blends up to E85 were evaluated in a Direct Injection(DI) Engine with Variable Valve Actuation (VVA) withcompression ratios up to 12.87. E50 and E85 blends were notknock limited [9]. The electro-hydraulic VVA was used toevaluate EIVC and LIVC strategies to reduce thecompression ratio when operating on gasoline or low ethanolblends. This reduced the knocking tendency but with reducedoutput due to lower displacement. A naturally aspirated DIFlex Fuel application with CR increased to 11.9 showedimprovement in specific power, even over knock freegasoline reaching 13 Bar BMEP on E85 at 4000 RPM[3].
The use of ethanol blends with boosted engines providessignificant opportunity for increased power density andefficiency. High ethanol blends such as E85 can provideknock free operation at high loads. Cooler exhausttemperatures also reduce the need for Power Enrichment (PE)to limit turbine inlet temperatures. Work to optimize for E85and Flex fuel operation cover a spectrum of technologiesincluding calibration optimization and algorithmdevelopment of a boosted MPFI [5] and of a boosted DIengine with DICP [10]. Research results [4,10] conclude thatpower density using E85 could be further increased if theengine was designed to allow peak cylinder pressures of
140-150 Bar. An evaluation to determine the relative benefitsof the increased RON and the latent heat of evaporation hasbeen documented showing the RON provides 70% of theknock resistance at 1000 RPM but only 40% at 3000 RPM[11].
Technical approaches to address the inherent power densitydiscrepancy between E85 and gasoline operation have beeninvestigated to develop strategies to reduce the knockingtendency with gasoline. This enables some of the powerdensity and efficiency losses from spark retard and PE to bereduced. These include cooled EGR, [12,13] cooled EGRwith hydrogen addition to improve dilution tolerance [14] andthe use of an Atkinson cycle (LIVC) to reduce the effectivecompression ratio to limit knock [15]. Lean boosted systemshave also been evaluated with E85 to improve efficiency[15]. The use of a duel fuel system with gasoline Port FuelInjection (PFI) and DI E85 has demonstrated the ability toleverage E85 for high load efficient operation whileproviding increased efficiency with gasoline at low loads [4].The 12:1 CR boosted engine uses the required quantity ofE85 to limit knock as load increases effectively providing therequired ethanol “blend”. This application did not requireexclusive E85 operation since peak cylinder pressures limitsrequired spark retard which reduced the octane requirement.They concluded the development of engines permittingincreased peak cylinder temperatures would enable increasedpower densities with E85 without the need for spark retard orPE.
CONCEPT DESCRIPTIONTo leverage the high octane potential of ethanol aturbocharged GDi Engine with DICP was chosen. Enginesimulation was carried out previously [16] to identifystrategies for improved engine efficiency and allow operationas a flex fuel vehicle with gasoline to E85 blends. To improveengine efficiency the CR was increased from 9.2 to 11.85 bychanging out the pistons. The valvetrain was also modified toaccept a 2 step VVA system that employed both EIVC andLIVC strategies to control the effective displacement andcompression ratio of the engine. The phasing authority of theintake phaser was increased to 80 crank angle degrees (cad)based on results of the engine simulation. Table 1 outlines thebase engine specifications and calls out the modifications thattook place.
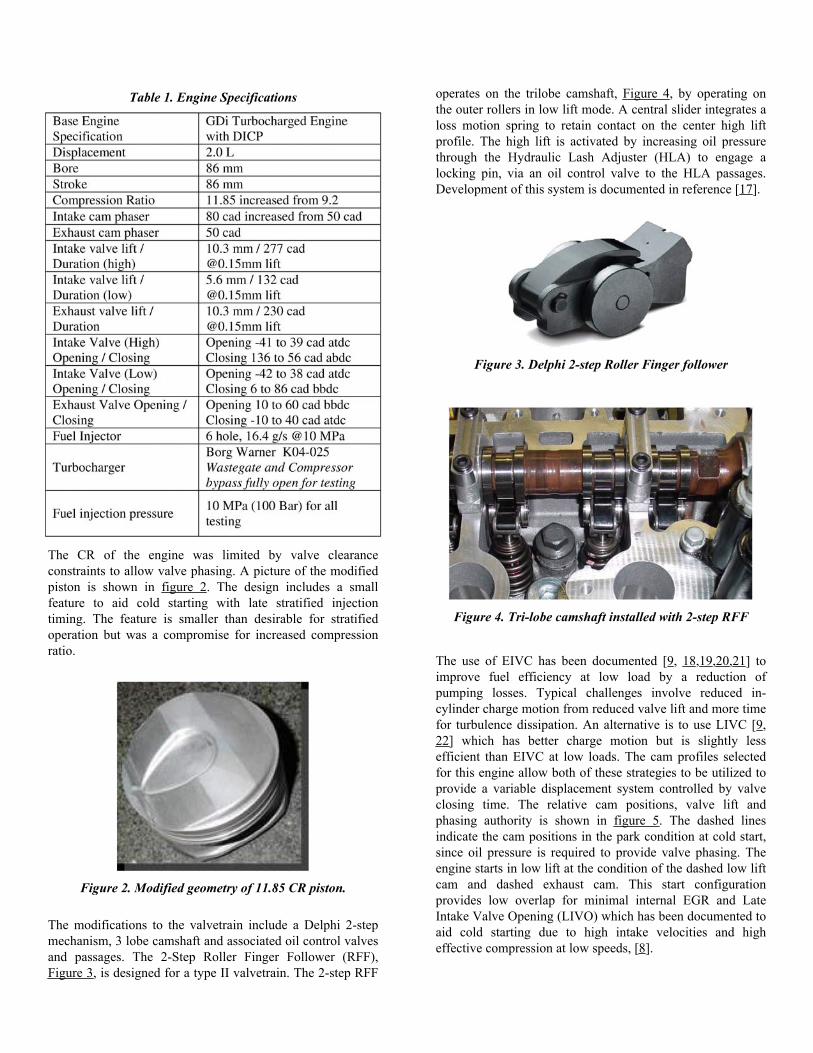
Table 1. Engine Specifications
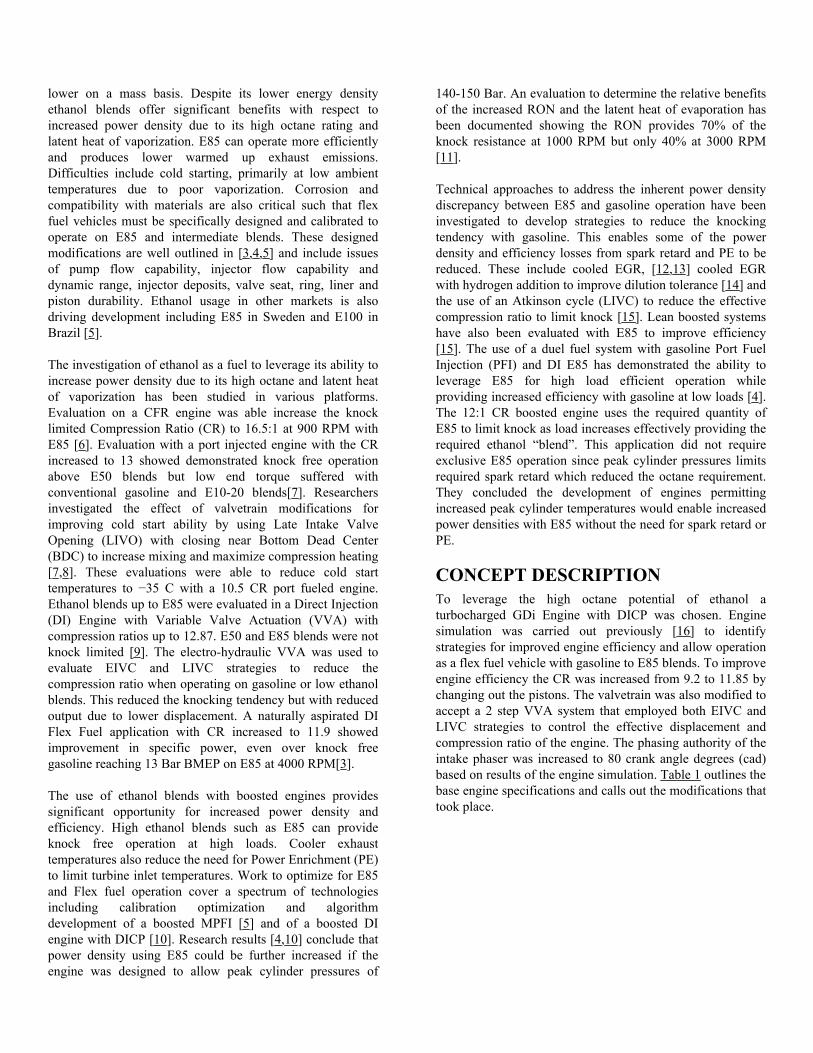
The CR of the engine was limited by valve clearanceconstraints to allow valve phasing. A picture of the modifiedpiston is shown in figure 2. The design includes a smallfeature to aid cold starting with late stratified injectiontiming. The feature is smaller than desirable for stratifiedoperation but was a compromise for increased compressionratio.
Figure 2. Modified geometry of 11.85 CR piston.
The modifications to the valvetrain include a Delphi 2-stepmechanism, 3 lobe camshaft and associated oil control valvesand passages. The 2-Step Roller Finger Follower (RFF),Figure 3, is designed for a type II valvetrain. The 2-step RFF
operates on the trilobe camshaft, Figure 4, by operating onthe outer rollers in low lift mode. A central slider integrates aloss motion spring to retain contact on the center high liftprofile. The high lift is activated by increasing oil pressurethrough the Hydraulic Lash Adjuster (HLA) to engage alocking pin, via an oil control valve to the HLA passages.Development of this system is documented in reference [17].
Figure 3. Delphi 2-step Roller Finger follower
Figure 4. Tri-lobe camshaft installed with 2-step RFF
The use of EIVC has been documented [9, 18,19,20,21] toimprove fuel efficiency at low load by a reduction ofpumping losses. Typical challenges involve reduced in-cylinder charge motion from reduced valve lift and more timefor turbulence dissipation. An alternative is to use LIVC [9,22] which has better charge motion but is slightly lessefficient than EIVC at low loads. The cam profiles selectedfor this engine allow both of these strategies to be utilized toprovide a variable displacement system controlled by valveclosing time. The relative cam positions, valve lift andphasing authority is shown in figure 5. The dashed linesindicate the cam positions in the park condition at cold start,since oil pressure is required to provide valve phasing. Theengine starts in low lift at the condition of the dashed low liftcam and dashed exhaust cam. This start configurationprovides low overlap for minimal internal EGR and LateIntake Valve Opening (LIVO) which has been documented toaid cold starting due to high intake velocities and higheffective compression at low speeds, [8].
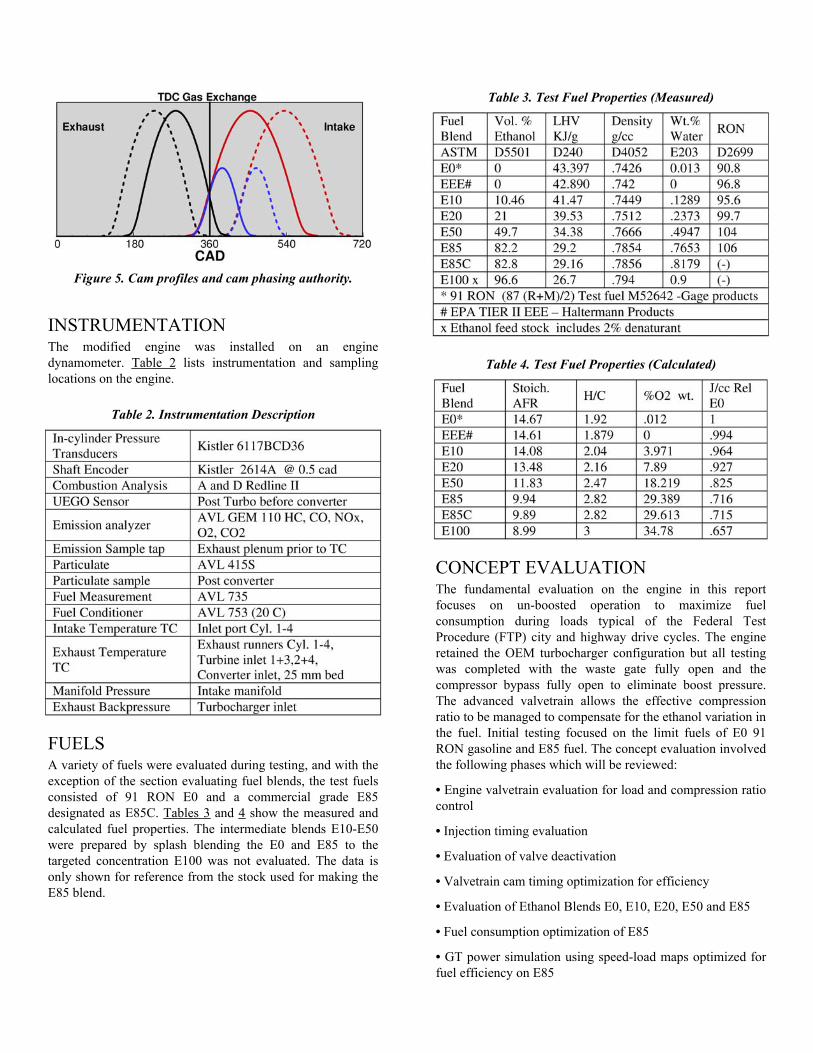
Figure 5. Cam profiles and cam phasing authority.
INSTRUMENTATIONThe modified engine was installed on an enginedynamometer. Table 2 lists instrumentation and samplinglocations on the engine.
Table 2. Instrumentation Description
FUELSA variety of fuels were evaluated during testing, and with theexception of the section evaluating fuel blends, the test fuelsconsisted of 91 RON E0 and a commercial grade E85designated as E85C. Tables 3 and 4 show the measured andcalculated fuel properties. The intermediate blends E10-E50were prepared by splash blending the E0 and E85 to thetargeted concentration E100 was not evaluated. The data isonly shown for reference from the stock used for making theE85 blend.
Table 3. Test Fuel Properties (Measured)
Table 4. Test Fuel Properties (Calculated)
CONCEPT EVALUATIONThe fundamental evaluation on the engine in this reportfocuses on un-boosted operation to maximize fuelconsumption during loads typical of the Federal TestProcedure (FTP) city and highway drive cycles. The engineretained the OEM turbocharger configuration but all testingwas completed with the waste gate fully open and thecompressor bypass fully open to eliminate boost pressure.The advanced valvetrain allows the effective compressionratio to be managed to compensate for the ethanol variation inthe fuel. Initial testing focused on the limit fuels of E0 91RON gasoline and E85 fuel. The concept evaluation involvedthe following phases which will be reviewed:
• Engine valvetrain evaluation for load and compression ratiocontrol
• Injection timing evaluation
• Evaluation of valve deactivation
• Valvetrain cam timing optimization for efficiency
• Evaluation of Ethanol Blends E0, E10, E20, E50 and E85
• Fuel consumption optimization of E85
• GT power simulation using speed-load maps optimized forfuel efficiency on E85
Valvetrain EvaluationA primary feature of this engine concept is its ability tomodify the effective displacement and hence compressionratio of the engine using valve timing. It still retains its fullgeometric expansion ratio of 11.85 independent of theeffective compression ratio. The effective displacement iscontrolled by the intake phaser. By adjusting the intake valveclosing time the trapped air mass is controlled as shown infigure 6. The system provides a smooth transition betweencams by matching airflow at the switch point. The system islimited at low displacements by poor combustion stabilitydue to increased residual fraction and slow combustion. Athigh loads, tuning allows volumetric efficiency to exceed100% this providing increased effective displacement.
Figure 6. Effective displacement of engine controlled bylift selection and intake cam phasing, 2000 RPM, un-
throttled operation, E85C fuel.
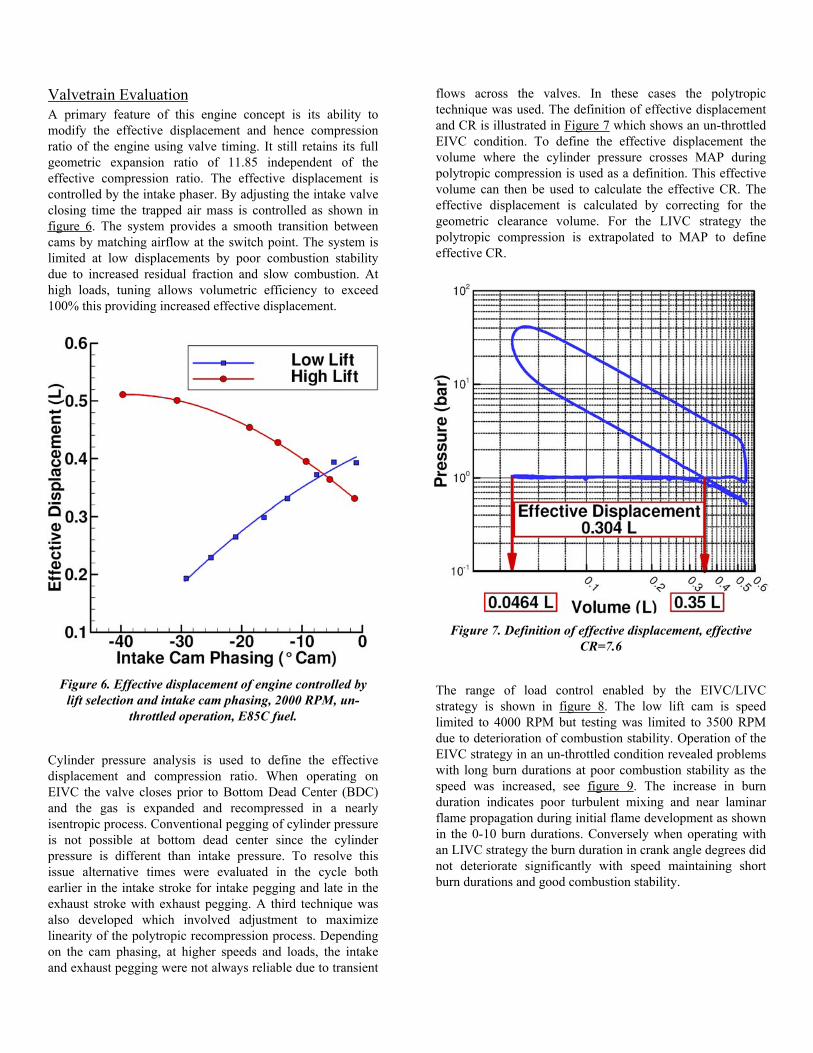
Cylinder pressure analysis is used to define the effectivedisplacement and compression ratio. When operating onEIVC the valve closes prior to Bottom Dead Center (BDC)and the gas is expanded and recompressed in a nearlyisentropic process. Conventional pegging of cylinder pressureis not possible at bottom dead center since the cylinderpressure is different than intake pressure. To resolve thisissue alternative times were evaluated in the cycle bothearlier in the intake stroke for intake pegging and late in theexhaust stroke with exhaust pegging. A third technique wasalso developed which involved adjustment to maximizelinearity of the polytropic recompression process. Dependingon the cam phasing, at higher speeds and loads, the intakeand exhaust pegging were not always reliable due to transient
flows across the valves. In these cases the polytropictechnique was used. The definition of effective displacementand CR is illustrated in Figure 7 which shows an un-throttledEIVC condition. To define the effective displacement thevolume where the cylinder pressure crosses MAP duringpolytropic compression is used as a definition. This effectivevolume can then be used to calculate the effective CR. Theeffective displacement is calculated by correcting for thegeometric clearance volume. For the LIVC strategy thepolytropic compression is extrapolated to MAP to defineeffective CR.
Figure 7. Definition of effective displacement, effectiveCR=7.6
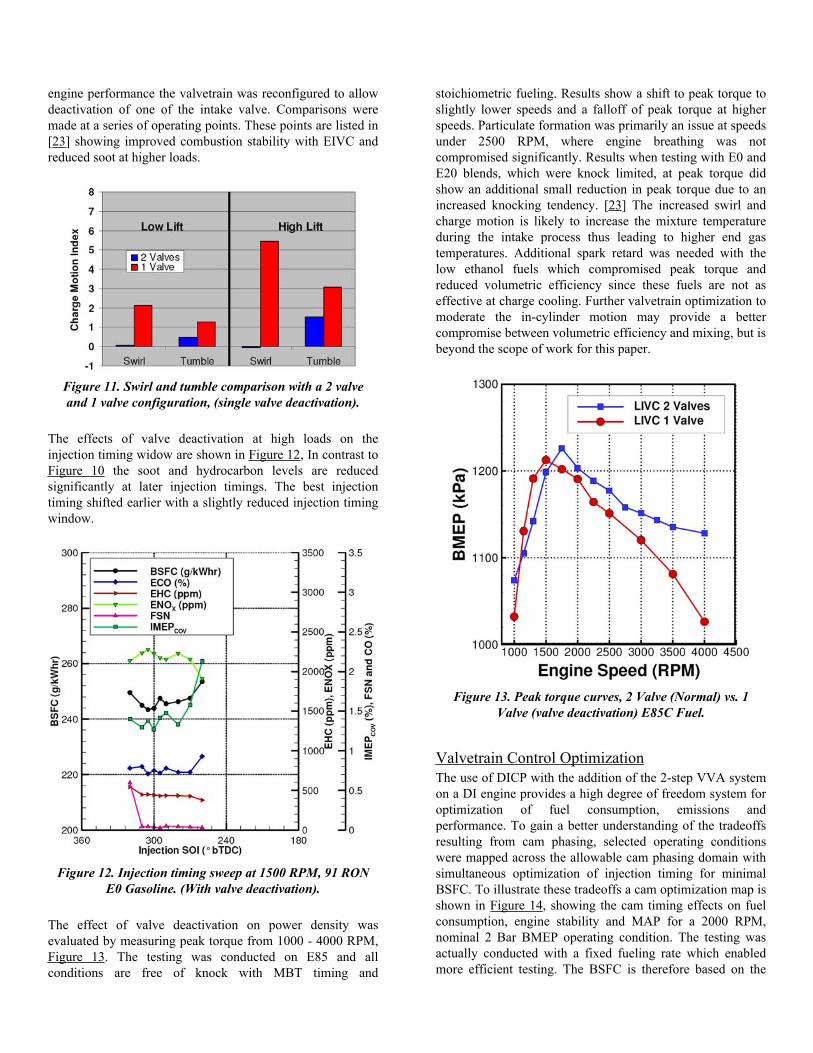
The range of load control enabled by the EIVC/LIVCstrategy is shown in figure 8. The low lift cam is speedlimited to 4000 RPM but testing was limited to 3500 RPMdue to deterioration of combustion stability. Operation of theEIVC strategy in an un-throttled condition revealed problemswith long burn durations at poor combustion stability as thespeed was increased, see figure 9. The increase in burnduration indicates poor turbulent mixing and near laminarflame propagation during initial flame development as shownin the 0-10 burn durations. Conversely when operating withan LIVC strategy the burn duration in crank angle degrees didnot deteriorate significantly with speed maintaining shortburn durations and good combustion stability.
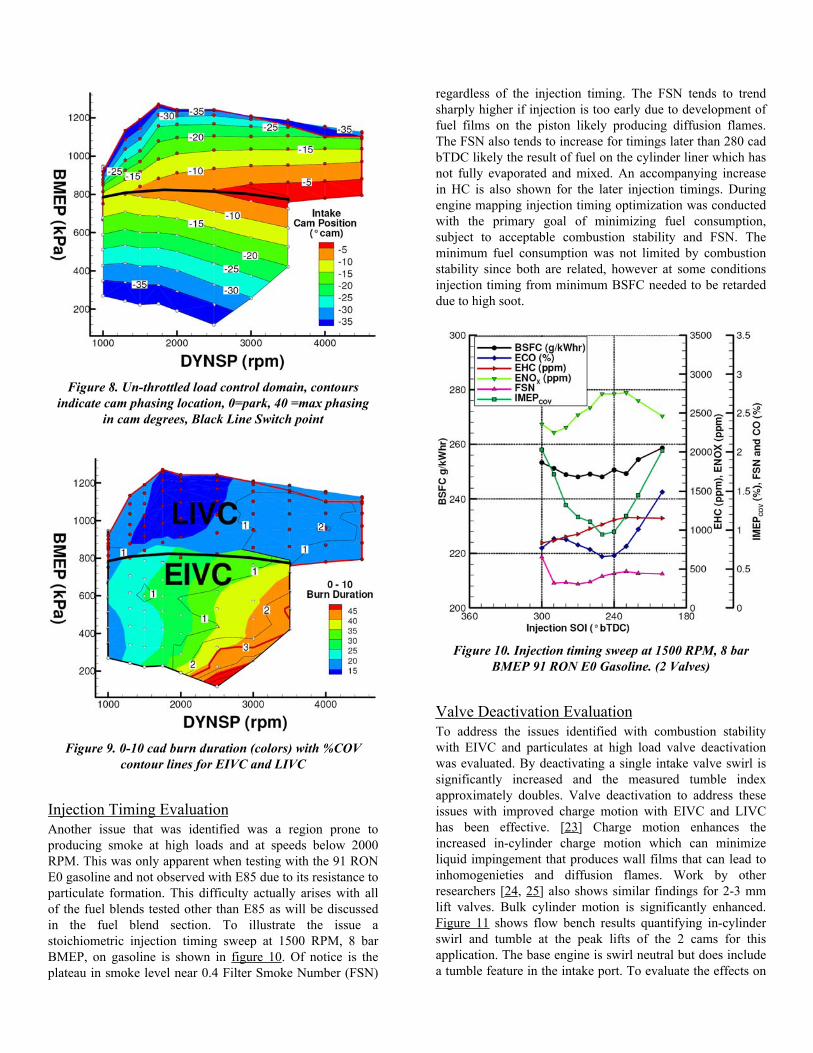
Figure 8. Un-throttled load control domain, contoursindicate cam phasing location, 0=park, 40 =max phasing
in cam degrees, Black Line Switch point
Figure 9. 0-10 cad burn duration (colors) with %COVcontour lines for EIVC and LIVC
Injection Timing EvaluationAnother issue that was identified was a region prone toproducing smoke at high loads and at speeds below 2000RPM. This was only apparent when testing with the 91 RONE0 gasoline and not observed with E85 due to its resistance toparticulate formation. This difficulty actually arises with allof the fuel blends tested other than E85 as will be discussedin the fuel blend section. To illustrate the issue astoichiometric injection timing sweep at 1500 RPM, 8 barBMEP, on gasoline is shown in figure 10. Of notice is theplateau in smoke level near 0.4 Filter Smoke Number (FSN)
regardless of the injection timing. The FSN tends to trendsharply higher if injection is too early due to development offuel films on the piston likely producing diffusion flames.The FSN also tends to increase for timings later than 280 cadbTDC likely the result of fuel on the cylinder liner which hasnot fully evaporated and mixed. An accompanying increasein HC is also shown for the later injection timings. Duringengine mapping injection timing optimization was conductedwith the primary goal of minimizing fuel consumption,subject to acceptable combustion stability and FSN. Theminimum fuel consumption was not limited by combustionstability since both are related, however at some conditionsinjection timing from minimum BSFC needed to be retardeddue to high soot.
Figure 10. Injection timing sweep at 1500 RPM, 8 barBMEP 91 RON E0 Gasoline. (2 Valves)
Valve Deactivation EvaluationTo address the issues identified with combustion stabilitywith EIVC and particulates at high load valve deactivationwas evaluated. By deactivating a single intake valve swirl issignificantly increased and the measured tumble indexapproximately doubles. Valve deactivation to address theseissues with improved charge motion with EIVC and LIVChas been effective. [23] Charge motion enhances theincreased in-cylinder charge motion which can minimizeliquid impingement that produces wall films that can lead toinhomogenieties and diffusion flames. Work by otherresearchers [24, 25] also shows similar findings for 2-3 mmlift valves. Bulk cylinder motion is significantly enhanced.Figure 11 shows flow bench results quantifying in-cylinderswirl and tumble at the peak lifts of the 2 cams for thisapplication. The base engine is swirl neutral but does includea tumble feature in the intake port. To evaluate the effects on
engine performance the valvetrain was reconfigured to allowdeactivation of one of the intake valve. Comparisons weremade at a series of operating points. These points are listed in[23] showing improved combustion stability with EIVC andreduced soot at higher loads.
Figure 11. Swirl and tumble comparison with a 2 valveand 1 valve configuration, (single valve deactivation).
The effects of valve deactivation at high loads on theinjection timing widow are shown in Figure 12, In contrast toFigure 10 the soot and hydrocarbon levels are reducedsignificantly at later injection timings. The best injectiontiming shifted earlier with a slightly reduced injection timingwindow.
Figure 12. Injection timing sweep at 1500 RPM, 91 RONE0 Gasoline. (With valve deactivation).
The effect of valve deactivation on power density wasevaluated by measuring peak torque from 1000 - 4000 RPM,Figure 13. The testing was conducted on E85 and allconditions are free of knock with MBT timing and
stoichiometric fueling. Results show a shift to peak torque toslightly lower speeds and a falloff of peak torque at higherspeeds. Particulate formation was primarily an issue at speedsunder 2500 RPM, where engine breathing was notcompromised significantly. Results when testing with E0 andE20 blends, which were knock limited, at peak torque didshow an additional small reduction in peak torque due to anincreased knocking tendency. [23] The increased swirl andcharge motion is likely to increase the mixture temperatureduring the intake process thus leading to higher end gastemperatures. Additional spark retard was needed with thelow ethanol fuels which compromised peak torque andreduced volumetric efficiency since these fuels are not aseffective at charge cooling. Further valvetrain optimization tomoderate the in-cylinder motion may provide a bettercompromise between volumetric efficiency and mixing, but isbeyond the scope of work for this paper.
Figure 13. Peak torque curves, 2 Valve (Normal) vs. 1Valve (valve deactivation) E85C Fuel.
Valvetrain Control OptimizationThe use of DICP with the addition of the 2-step VVA systemon a DI engine provides a high degree of freedom system foroptimization of fuel consumption, emissions andperformance. To gain a better understanding of the tradeoffsresulting from cam phasing, selected operating conditionswere mapped across the allowable cam phasing domain withsimultaneous optimization of injection timing for minimalBSFC. To illustrate these tradeoffs a cam optimization map isshown in Figure 14, showing the cam timing effects on fuelconsumption, engine stability and MAP for a 2000 RPM,nominal 2 Bar BMEP operating condition. The testing wasactually conducted with a fixed fueling rate which enabledmore efficient testing. The BSFC is therefore based on the
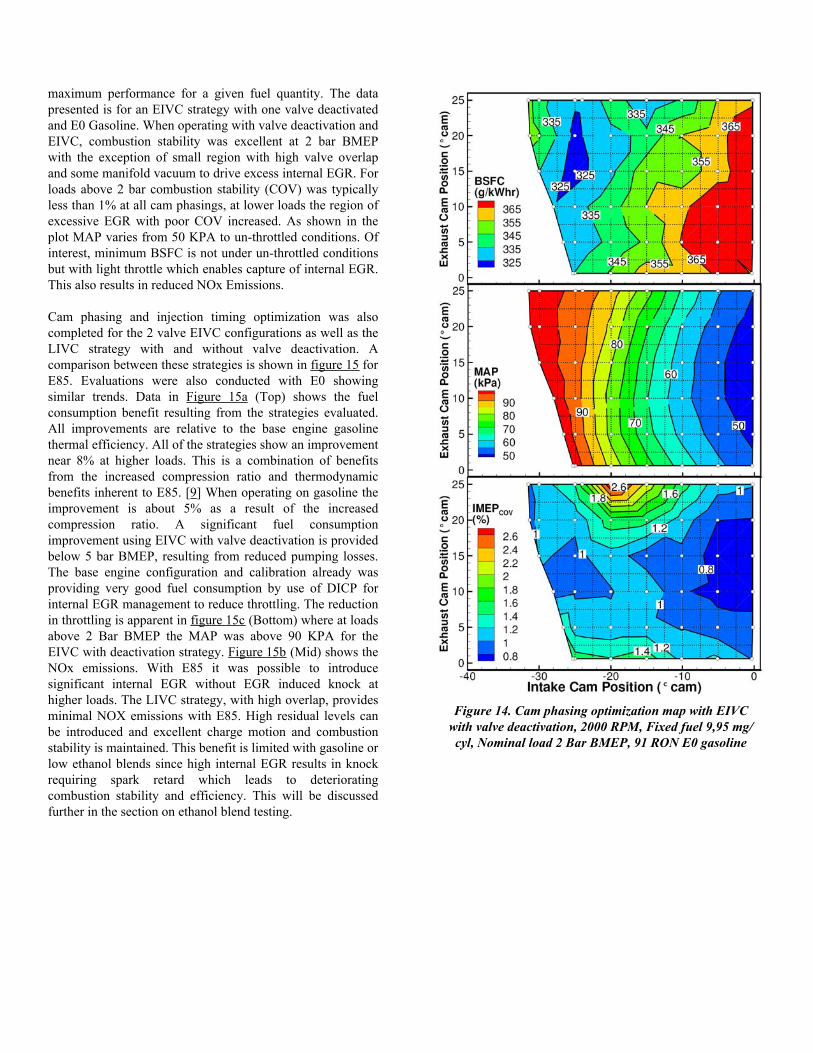
maximum performance for a given fuel quantity. The datapresented is for an EIVC strategy with one valve deactivatedand E0 Gasoline. When operating with valve deactivation andEIVC, combustion stability was excellent at 2 bar BMEPwith the exception of small region with high valve overlapand some manifold vacuum to drive excess internal EGR. Forloads above 2 bar combustion stability (COV) was typicallyless than 1% at all cam phasings, at lower loads the region ofexcessive EGR with poor COV increased. As shown in theplot MAP varies from 50 KPA to un-throttled conditions. Ofinterest, minimum BSFC is not under un-throttled conditionsbut with light throttle which enables capture of internal EGR.This also results in reduced NOx Emissions.
Cam phasing and injection timing optimization was alsocompleted for the 2 valve EIVC configurations as well as theLIVC strategy with and without valve deactivation. Acomparison between these strategies is shown in figure 15 forE85. Evaluations were also conducted with E0 showingsimilar trends. Data in Figure 15a (Top) shows the fuelconsumption benefit resulting from the strategies evaluated.All improvements are relative to the base engine gasolinethermal efficiency. All of the strategies show an improvementnear 8% at higher loads. This is a combination of benefitsfrom the increased compression ratio and thermodynamicbenefits inherent to E85. [9] When operating on gasoline theimprovement is about 5% as a result of the increasedcompression ratio. A significant fuel consumptionimprovement using EIVC with valve deactivation is providedbelow 5 bar BMEP, resulting from reduced pumping losses.The base engine configuration and calibration already wasproviding very good fuel consumption by use of DICP forinternal EGR management to reduce throttling. The reductionin throttling is apparent in figure 15c (Bottom) where at loadsabove 2 Bar BMEP the MAP was above 90 KPA for theEIVC with deactivation strategy. Figure 15b (Mid) shows theNOx emissions. With E85 it was possible to introducesignificant internal EGR without EGR induced knock athigher loads. The LIVC strategy, with high overlap, providesminimal NOX emissions with E85. High residual levels canbe introduced and excellent charge motion and combustionstability is maintained. This benefit is limited with gasoline orlow ethanol blends since high internal EGR results in knockrequiring spark retard which leads to deterioratingcombustion stability and efficiency. This will be discussedfurther in the section on ethanol blend testing.
Figure 14. Cam phasing optimization map with EIVCwith valve deactivation, 2000 RPM, Fixed fuel 9,95 mg/cyl, Nominal load 2 Bar BMEP, 91 RON E0 gasoline
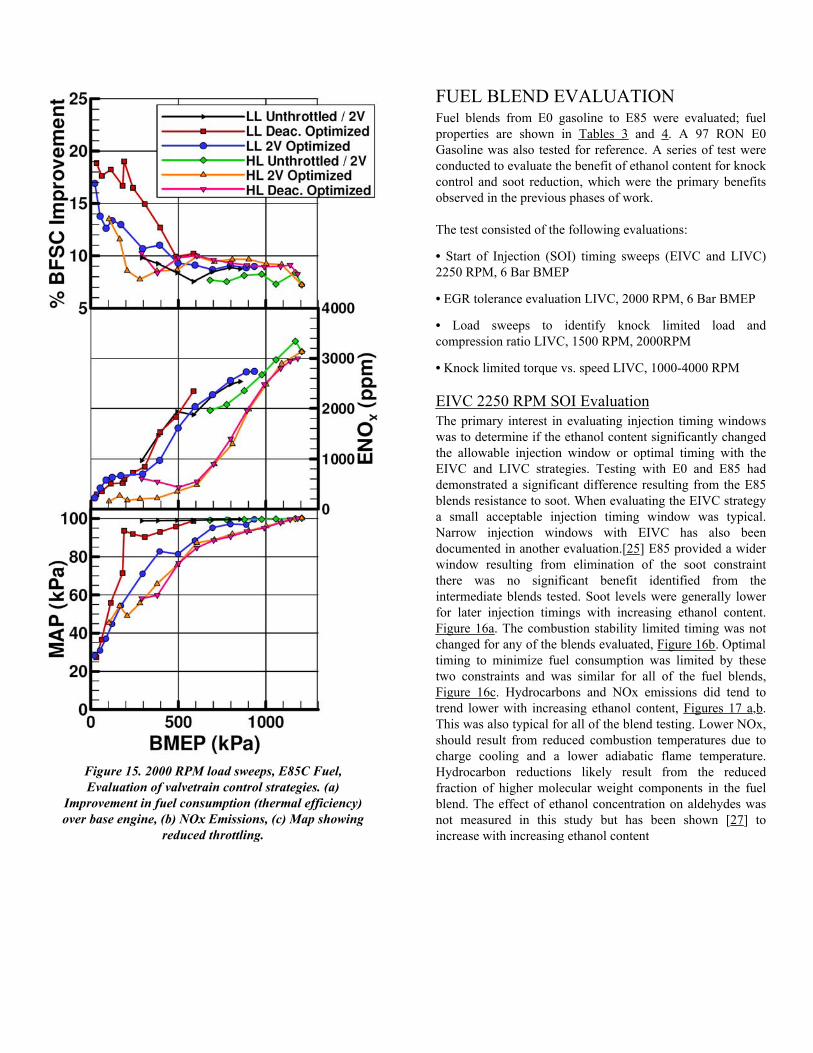
Figure 15. 2000 RPM load sweeps, E85C Fuel,Evaluation of valvetrain control strategies. (a)
Improvement in fuel consumption (thermal efficiency)over base engine, (b) NOx Emissions, (c) Map showing
reduced throttling.
FUEL BLEND EVALUATIONFuel blends from E0 gasoline to E85 were evaluated; fuelproperties are shown in Tables 3 and 4. A 97 RON E0Gasoline was also tested for reference. A series of test wereconducted to evaluate the benefit of ethanol content for knockcontrol and soot reduction, which were the primary benefitsobserved in the previous phases of work.
The test consisted of the following evaluations:
• Start of Injection (SOI) timing sweeps (EIVC and LIVC)2250 RPM, 6 Bar BMEP
• EGR tolerance evaluation LIVC, 2000 RPM, 6 Bar BMEP
• Load sweeps to identify knock limited load andcompression ratio LIVC, 1500 RPM, 2000RPM
• Knock limited torque vs. speed LIVC, 1000-4000 RPM
EIVC 2250 RPM SOI EvaluationThe primary interest in evaluating injection timing windowswas to determine if the ethanol content significantly changedthe allowable injection window or optimal timing with theEIVC and LIVC strategies. Testing with E0 and E85 haddemonstrated a significant difference resulting from the E85blends resistance to soot. When evaluating the EIVC strategya small acceptable injection timing window was typical.Narrow injection windows with EIVC has also beendocumented in another evaluation.[25] E85 provided a widerwindow resulting from elimination of the soot constraintthere was no significant benefit identified from theintermediate blends tested. Soot levels were generally lowerfor later injection timings with increasing ethanol content.Figure 16a. The combustion stability limited timing was notchanged for any of the blends evaluated, Figure 16b. Optimaltiming to minimize fuel consumption was limited by thesetwo constraints and was similar for all of the fuel blends,Figure 16c. Hydrocarbons and NOx emissions did tend totrend lower with increasing ethanol content, Figures 17 a,b.This was also typical for all of the blend testing. Lower NOx,should result from reduced combustion temperatures due tocharge cooling and a lower adiabatic flame temperature.Hydrocarbon reductions likely result from the reducedfraction of higher molecular weight components in the fuelblend. The effect of ethanol concentration on aldehydes wasnot measured in this study but has been shown [27] toincrease with increasing ethanol content
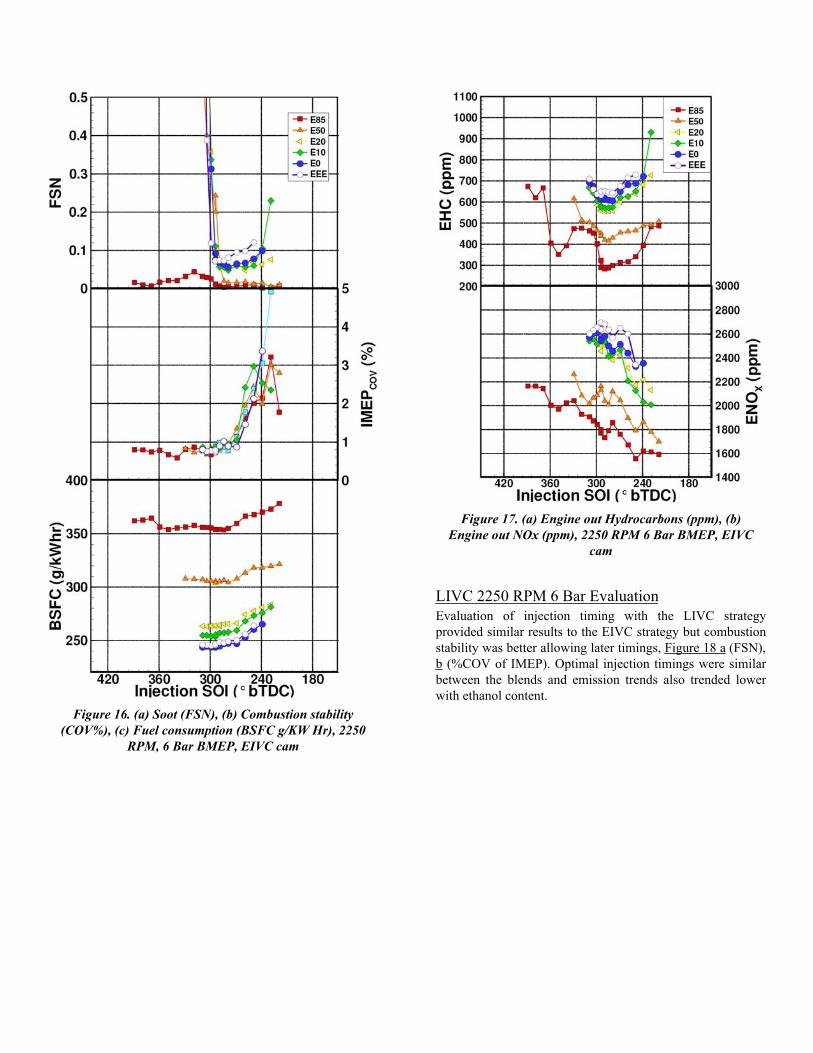
Figure 16. (a) Soot (FSN), (b) Combustion stability(COV%), (c) Fuel consumption (BSFC g/KW Hr), 2250
RPM, 6 Bar BMEP, EIVC cam
Figure 17. (a) Engine out Hydrocarbons (ppm), (b)Engine out NOx (ppm), 2250 RPM 6 Bar BMEP, EIVC
cam
LIVC 2250 RPM 6 Bar EvaluationEvaluation of injection timing with the LIVC strategyprovided similar results to the EIVC strategy but combustionstability was better allowing later timings, Figure 18 a (FSN),b (%COV of IMEP). Optimal injection timings were similarbetween the blends and emission trends also trended lowerwith ethanol content.
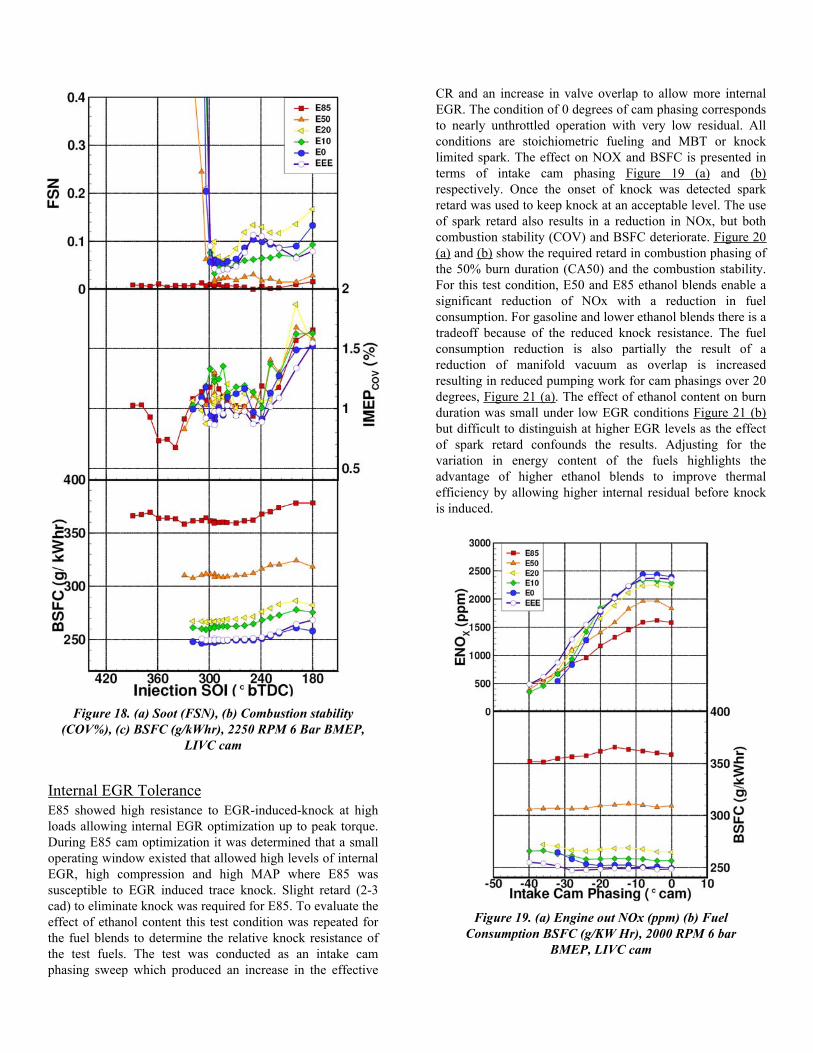
Figure 18. (a) Soot (FSN), (b) Combustion stability(COV%), (c) BSFC (g/kWhr), 2250 RPM 6 Bar BMEP,
LIVC cam
Internal EGR ToleranceE85 showed high resistance to EGR-induced-knock at highloads allowing internal EGR optimization up to peak torque.During E85 cam optimization it was determined that a smalloperating window existed that allowed high levels of internalEGR, high compression and high MAP where E85 wassusceptible to EGR induced trace knock. Slight retard (2-3cad) to eliminate knock was required for E85. To evaluate theeffect of ethanol content this test condition was repeated forthe fuel blends to determine the relative knock resistance ofthe test fuels. The test was conducted as an intake camphasing sweep which produced an increase in the effective
CR and an increase in valve overlap to allow more internalEGR. The condition of 0 degrees of cam phasing correspondsto nearly unthrottled operation with very low residual. Allconditions are stoichiometric fueling and MBT or knocklimited spark. The effect on NOX and BSFC is presented interms of intake cam phasing Figure 19 (a) and (b)respectively. Once the onset of knock was detected sparkretard was used to keep knock at an acceptable level. The useof spark retard also results in a reduction in NOx, but bothcombustion stability (COV) and BSFC deteriorate. Figure 20(a) and (b) show the required retard in combustion phasing ofthe 50% burn duration (CA50) and the combustion stability.For this test condition, E50 and E85 ethanol blends enable asignificant reduction of NOx with a reduction in fuelconsumption. For gasoline and lower ethanol blends there is atradeoff because of the reduced knock resistance. The fuelconsumption reduction is also partially the result of areduction of manifold vacuum as overlap is increasedresulting in reduced pumping work for cam phasings over 20degrees, Figure 21 (a). The effect of ethanol content on burnduration was small under low EGR conditions Figure 21 (b)but difficult to distinguish at higher EGR levels as the effectof spark retard confounds the results. Adjusting for thevariation in energy content of the fuels highlights theadvantage of higher ethanol blends to improve thermalefficiency by allowing higher internal residual before knockis induced.
Figure 19. (a) Engine out NOx (ppm) (b) FuelConsumption BSFC (g/KW Hr), 2000 RPM 6 bar
BMEP, LIVC cam
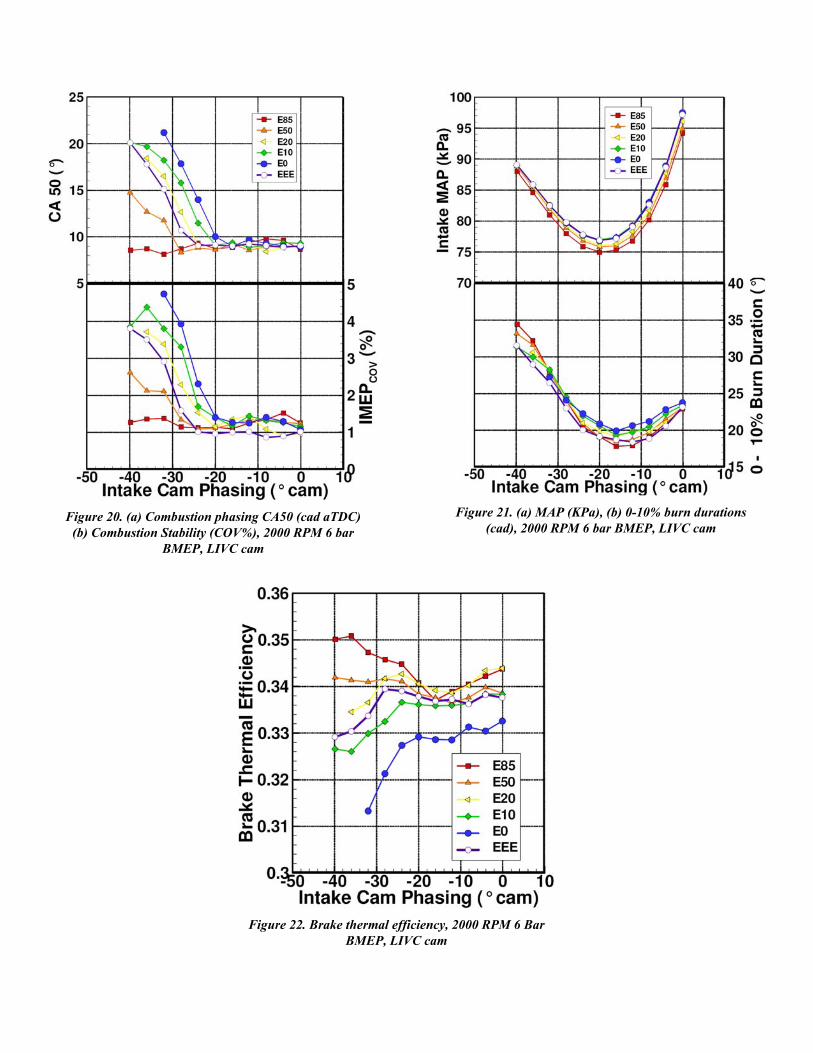
Figure 20. (a) Combustion phasing CA50 (cad aTDC)(b) Combustion Stability (COV%), 2000 RPM 6 bar
BMEP, LIVC cam
Figure 21. (a) MAP (KPa), (b) 0-10% burn durations(cad), 2000 RPM 6 bar BMEP, LIVC cam
Figure 22. Brake thermal efficiency, 2000 RPM 6 BarBMEP, LIVC cam
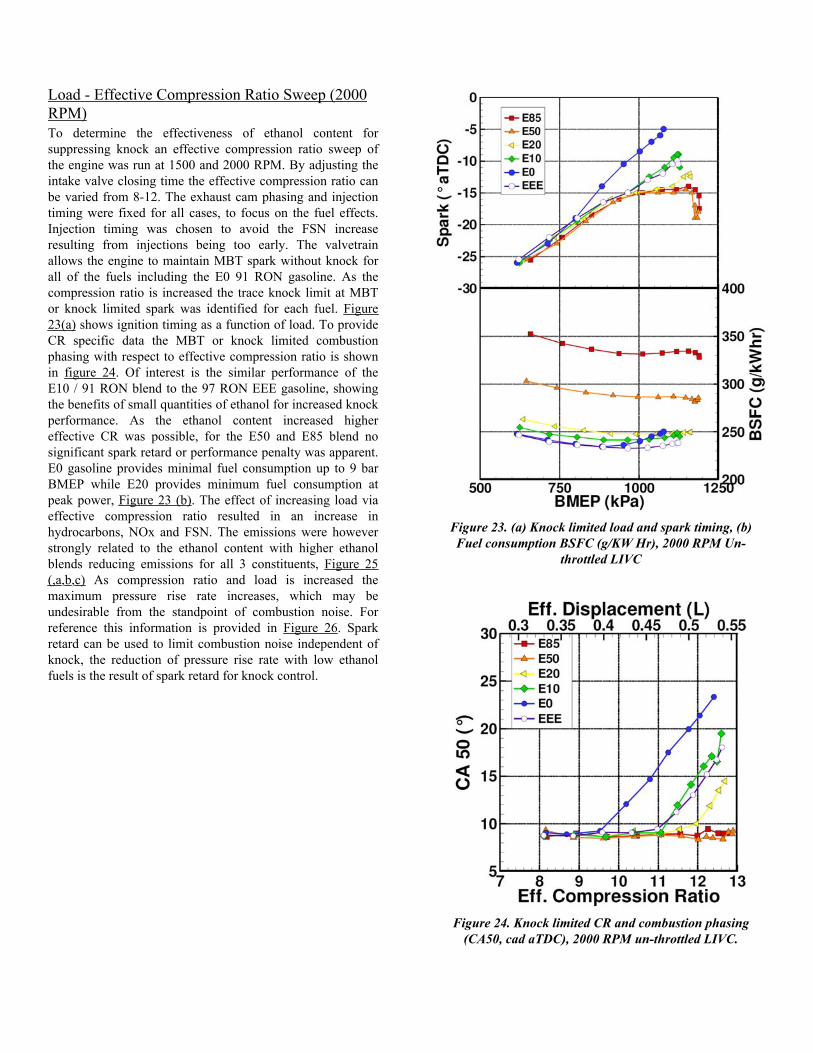
Load - Effective Compression Ratio Sweep (2000RPM)To determine the effectiveness of ethanol content forsuppressing knock an effective compression ratio sweep ofthe engine was run at 1500 and 2000 RPM. By adjusting theintake valve closing time the effective compression ratio canbe varied from 8-12. The exhaust cam phasing and injectiontiming were fixed for all cases, to focus on the fuel effects.Injection timing was chosen to avoid the FSN increaseresulting from injections being too early. The valvetrainallows the engine to maintain MBT spark without knock forall of the fuels including the E0 91 RON gasoline. As thecompression ratio is increased the trace knock limit at MBTor knock limited spark was identified for each fuel. Figure23(a) shows ignition timing as a function of load. To provideCR specific data the MBT or knock limited combustionphasing with respect to effective compression ratio is shownin figure 24. Of interest is the similar performance of theE10 / 91 RON blend to the 97 RON EEE gasoline, showingthe benefits of small quantities of ethanol for increased knockperformance. As the ethanol content increased highereffective CR was possible, for the E50 and E85 blend nosignificant spark retard or performance penalty was apparent.E0 gasoline provides minimal fuel consumption up to 9 barBMEP while E20 provides minimum fuel consumption atpeak power, Figure 23 (b). The effect of increasing load viaeffective compression ratio resulted in an increase inhydrocarbons, NOx and FSN. The emissions were howeverstrongly related to the ethanol content with higher ethanolblends reducing emissions for all 3 constituents, Figure 25(,a,b,c) As compression ratio and load is increased themaximum pressure rise rate increases, which may beundesirable from the standpoint of combustion noise. Forreference this information is provided in Figure 26. Sparkretard can be used to limit combustion noise independent ofknock, the reduction of pressure rise rate with low ethanolfuels is the result of spark retard for knock control.
Figure 23. (a) Knock limited load and spark timing, (b)Fuel consumption BSFC (g/KW Hr), 2000 RPM Un-
throttled LIVC
Figure 24. Knock limited CR and combustion phasing(CA50, cad aTDC), 2000 RPM un-throttled LIVC.
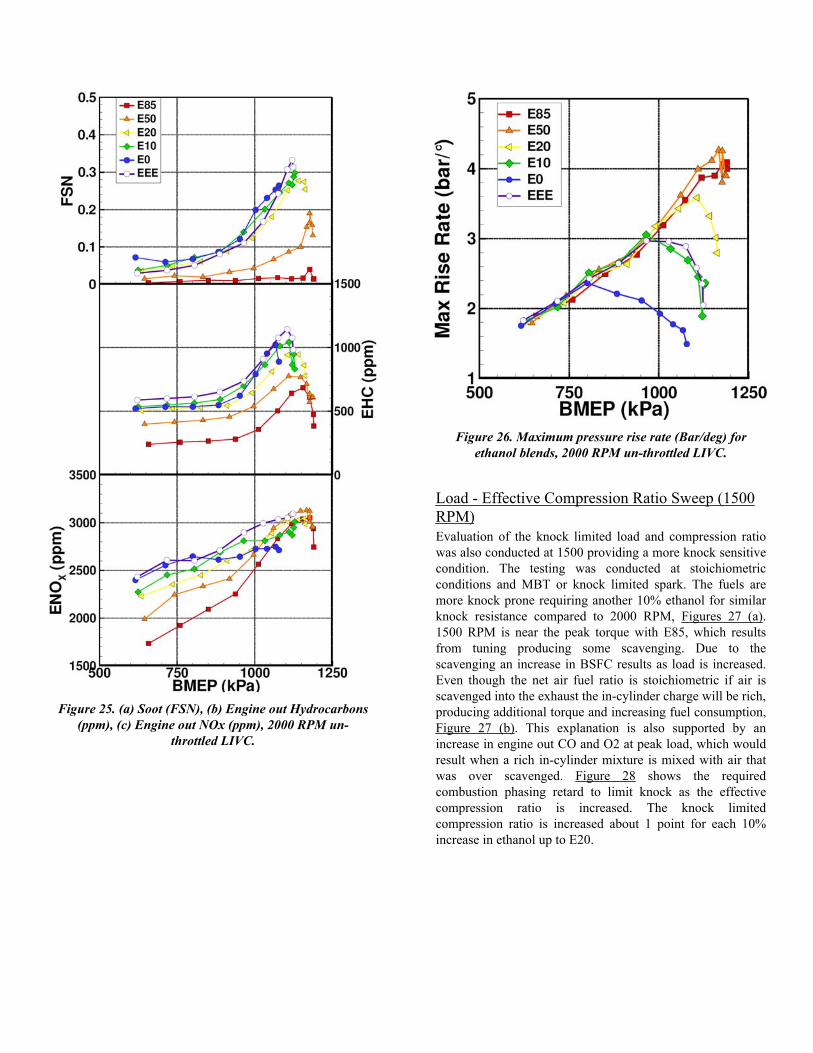
Figure 25. (a) Soot (FSN), (b) Engine out Hydrocarbons(ppm), (c) Engine out NOx (ppm), 2000 RPM un-
throttled LIVC.
Figure 26. Maximum pressure rise rate (Bar/deg) forethanol blends, 2000 RPM un-throttled LIVC.
Load - Effective Compression Ratio Sweep (1500RPM)Evaluation of the knock limited load and compression ratiowas also conducted at 1500 providing a more knock sensitivecondition. The testing was conducted at stoichiometricconditions and MBT or knock limited spark. The fuels aremore knock prone requiring another 10% ethanol for similarknock resistance compared to 2000 RPM, Figures 27 (a).1500 RPM is near the peak torque with E85, which resultsfrom tuning producing some scavenging. Due to thescavenging an increase in BSFC results as load is increased.Even though the net air fuel ratio is stoichiometric if air isscavenged into the exhaust the in-cylinder charge will be rich,producing additional torque and increasing fuel consumption,Figure 27 (b). This explanation is also supported by anincrease in engine out CO and O2 at peak load, which wouldresult when a rich in-cylinder mixture is mixed with air thatwas over scavenged. Figure 28 shows the requiredcombustion phasing retard to limit knock as the effectivecompression ratio is increased. The knock limitedcompression ratio is increased about 1 point for each 10%increase in ethanol up to E20.
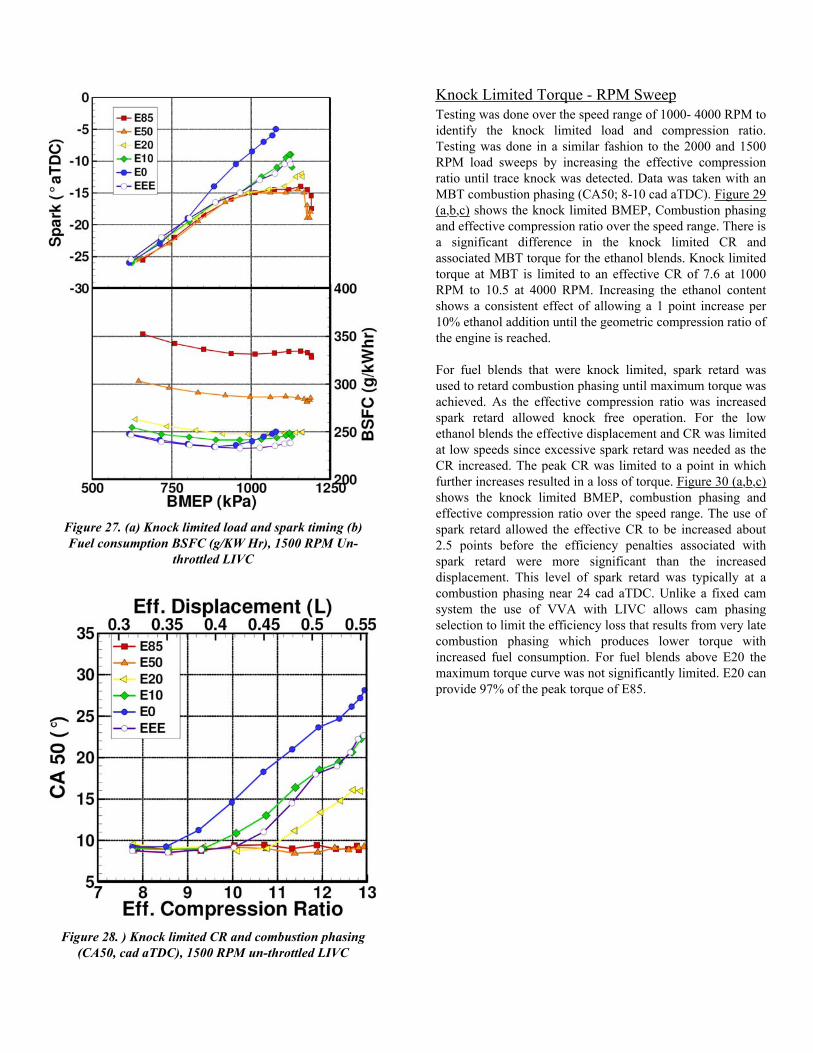
Figure 27. (a) Knock limited load and spark timing (b)Fuel consumption BSFC (g/KW Hr), 1500 RPM Un-
throttled LIVC
Figure 28. ) Knock limited CR and combustion phasing(CA50, cad aTDC), 1500 RPM un-throttled LIVC
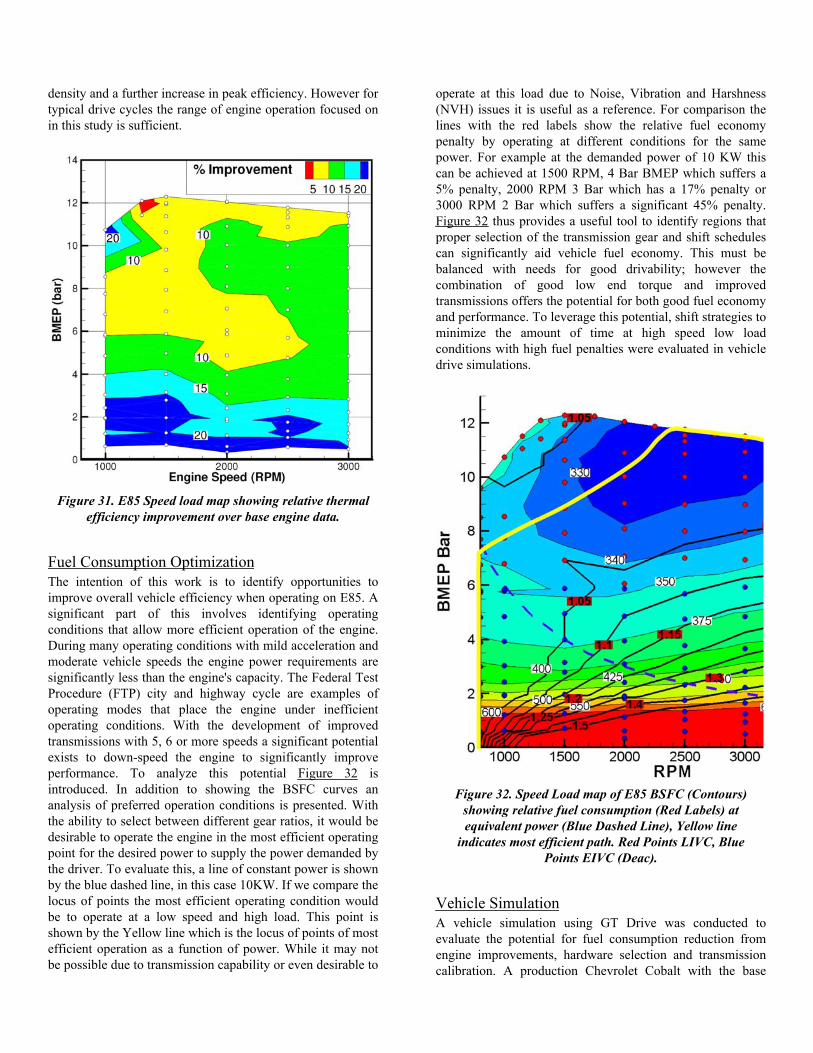
Knock Limited Torque - RPM SweepTesting was done over the speed range of 1000- 4000 RPM toidentify the knock limited load and compression ratio.Testing was done in a similar fashion to the 2000 and 1500RPM load sweeps by increasing the effective compressionratio until trace knock was detected. Data was taken with anMBT combustion phasing (CA50; 8-10 cad aTDC). Figure 29(a,b,c) shows the knock limited BMEP, Combustion phasingand effective compression ratio over the speed range. There isa significant difference in the knock limited CR andassociated MBT torque for the ethanol blends. Knock limitedtorque at MBT is limited to an effective CR of 7.6 at 1000RPM to 10.5 at 4000 RPM. Increasing the ethanol contentshows a consistent effect of allowing a 1 point increase per10% ethanol addition until the geometric compression ratio ofthe engine is reached.
For fuel blends that were knock limited, spark retard wasused to retard combustion phasing until maximum torque wasachieved. As the effective compression ratio was increasedspark retard allowed knock free operation. For the lowethanol blends the effective displacement and CR was limitedat low speeds since excessive spark retard was needed as theCR increased. The peak CR was limited to a point in whichfurther increases resulted in a loss of torque. Figure 30 (a,b,c)shows the knock limited BMEP, combustion phasing andeffective compression ratio over the speed range. The use ofspark retard allowed the effective CR to be increased about2.5 points before the efficiency penalties associated withspark retard were more significant than the increaseddisplacement. This level of spark retard was typically at acombustion phasing near 24 cad aTDC. Unlike a fixed camsystem the use of VVA with LIVC allows cam phasingselection to limit the efficiency loss that results from very latecombustion phasing which produces lower torque withincreased fuel consumption. For fuel blends above E20 themaximum torque curve was not significantly limited. E20 canprovide 97% of the peak torque of E85.
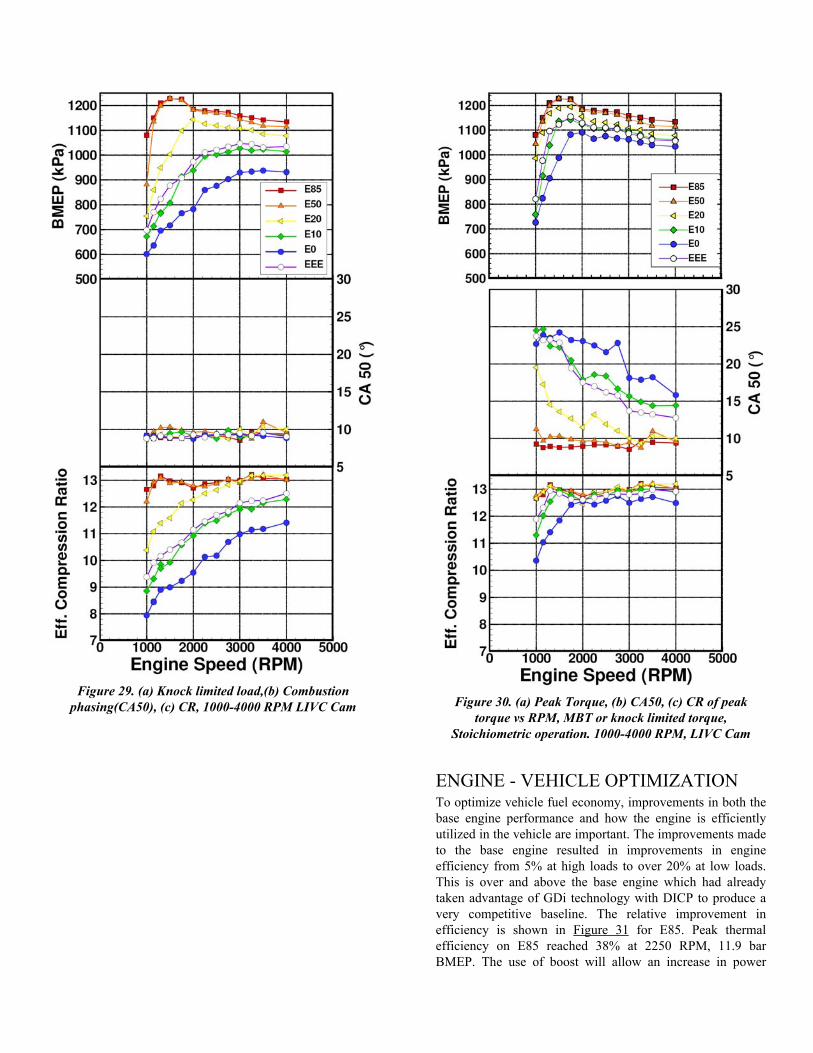
Figure 29. (a) Knock limited load,(b) Combustionphasing(CA50), (c) CR, 1000-4000 RPM LIVC Cam Figure 30. (a) Peak Torque, (b) CA50, (c) CR of peak
torque vs RPM, MBT or knock limited torque,Stoichiometric operation. 1000-4000 RPM, LIVC Cam
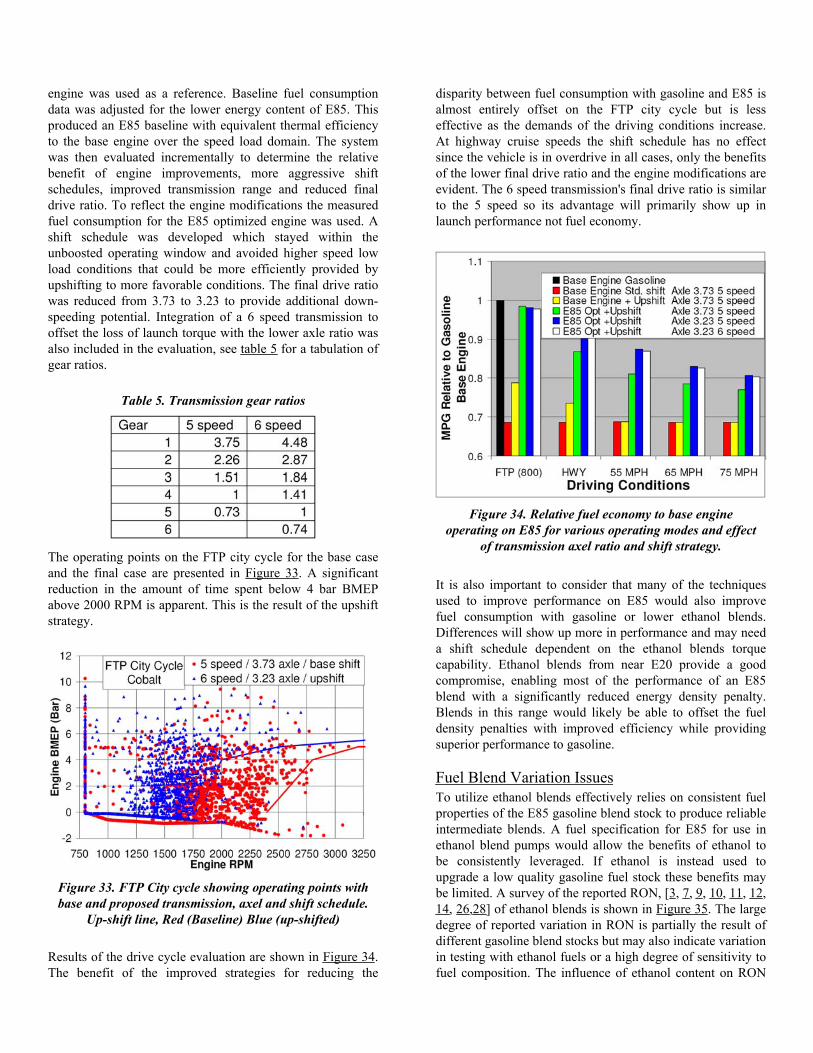
ENGINE - VEHICLE OPTIMIZATIONTo optimize vehicle fuel economy, improvements in both thebase engine performance and how the engine is efficientlyutilized in the vehicle are important. The improvements madeto the base engine resulted in improvements in engineefficiency from 5% at high loads to over 20% at low loads.This is over and above the base engine which had alreadytaken advantage of GDi technology with DICP to produce avery competitive baseline. The relative improvement inefficiency is shown in Figure 31 for E85. Peak thermalefficiency on E85 reached 38% at 2250 RPM, 11.9 barBMEP. The use of boost will allow an increase in power
density and a further increase in peak efficiency. However fortypical drive cycles the range of engine operation focused onin this study is sufficient.
Figure 31. E85 Speed load map showing relative thermalefficiency improvement over base engine data.
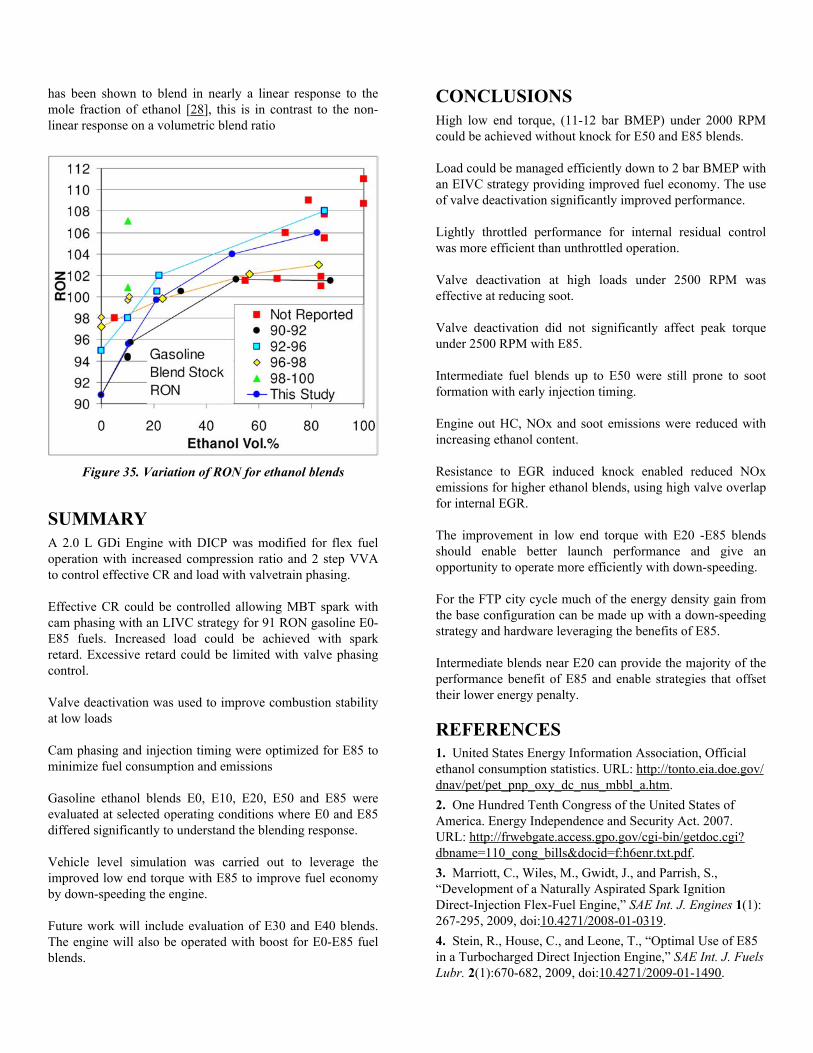
Fuel Consumption OptimizationThe intention of this work is to identify opportunities toimprove overall vehicle efficiency when operating on E85. Asignificant part of this involves identifying operatingconditions that allow more efficient operation of the engine.During many operating conditions with mild acceleration andmoderate vehicle speeds the engine power requirements aresignificantly less than the engine's capacity. The Federal TestProcedure (FTP) city and highway cycle are examples ofoperating modes that place the engine under inefficientoperating conditions. With the development of improvedtransmissions with 5, 6 or more speeds a significant potentialexists to down-speed the engine to significantly improveperformance. To analyze this potential Figure 32 isintroduced. In addition to showing the BSFC curves ananalysis of preferred operation conditions is presented. Withthe ability to select between different gear ratios, it would bedesirable to operate the engine in the most efficient operatingpoint for the desired power to supply the power demanded bythe driver. To evaluate this, a line of constant power is shownby the blue dashed line, in this case 10KW. If we compare thelocus of points the most efficient operating condition wouldbe to operate at a low speed and high load. This point isshown by the Yellow line which is the locus of points of mostefficient operation as a function of power. While it may notbe possible due to transmission capability or even desirable to
operate at this load due to Noise, Vibration and Harshness(NVH) issues it is useful as a reference. For comparison thelines with the red labels show the relative fuel economypenalty by operating at different conditions for the samepower. For example at the demanded power of 10 KW thiscan be achieved at 1500 RPM, 4 Bar BMEP which suffers a5% penalty, 2000 RPM 3 Bar which has a 17% penalty or3000 RPM 2 Bar which suffers a significant 45% penalty.Figure 32 thus provides a useful tool to identify regions thatproper selection of the transmission gear and shift schedulescan significantly aid vehicle fuel economy. This must bebalanced with needs for good drivability; however thecombination of good low end torque and improvedtransmissions offers the potential for both good fuel economyand performance. To leverage this potential, shift strategies tominimize the amount of time at high speed low loadconditions with high fuel penalties were evaluated in vehicledrive simulations.
Figure 32. Speed Load map of E85 BSFC (Contours)showing relative fuel consumption (Red Labels) atequivalent power (Blue Dashed Line), Yellow line
indicates most efficient path. Red Points LIVC, BluePoints EIVC (Deac).
Vehicle SimulationA vehicle simulation using GT Drive was conducted toevaluate the potential for fuel consumption reduction fromengine improvements, hardware selection and transmissioncalibration. A production Chevrolet Cobalt with the base
engine was used as a reference. Baseline fuel consumptiondata was adjusted for the lower energy content of E85. Thisproduced an E85 baseline with equivalent thermal efficiencyto the base engine over the speed load domain. The systemwas then evaluated incrementally to determine the relativebenefit of engine improvements, more aggressive shiftschedules, improved transmission range and reduced finaldrive ratio. To reflect the engine modifications the measuredfuel consumption for the E85 optimized engine was used. Ashift schedule was developed which stayed within theunboosted operating window and avoided higher speed lowload conditions that could be more efficiently provided byupshifting to more favorable conditions. The final drive ratiowas reduced from 3.73 to 3.23 to provide additional down-speeding potential. Integration of a 6 speed transmission tooffset the loss of launch torque with the lower axle ratio wasalso included in the evaluation, see table 5 for a tabulation ofgear ratios.
Table 5. Transmission gear ratios
The operating points on the FTP city cycle for the base caseand the final case are presented in Figure 33. A significantreduction in the amount of time spent below 4 bar BMEPabove 2000 RPM is apparent. This is the result of the upshiftstrategy.
Figure 33. FTP City cycle showing operating points withbase and proposed transmission, axel and shift schedule.
Up-shift line, Red (Baseline) Blue (up-shifted)
Results of the drive cycle evaluation are shown in Figure 34.The benefit of the improved strategies for reducing the
disparity between fuel consumption with gasoline and E85 isalmost entirely offset on the FTP city cycle but is lesseffective as the demands of the driving conditions increase.At highway cruise speeds the shift schedule has no effectsince the vehicle is in overdrive in all cases, only the benefitsof the lower final drive ratio and the engine modifications areevident. The 6 speed transmission's final drive ratio is similarto the 5 speed so its advantage will primarily show up inlaunch performance not fuel economy.
Figure 34. Relative fuel economy to base engineoperating on E85 for various operating modes and effect
of transmission axel ratio and shift strategy.
It is also important to consider that many of the techniquesused to improve performance on E85 would also improvefuel consumption with gasoline or lower ethanol blends.Differences will show up more in performance and may needa shift schedule dependent on the ethanol blends torquecapability. Ethanol blends from near E20 provide a goodcompromise, enabling most of the performance of an E85blend with a significantly reduced energy density penalty.Blends in this range would likely be able to offset the fueldensity penalties with improved efficiency while providingsuperior performance to gasoline.
Fuel Blend Variation IssuesTo utilize ethanol blends effectively relies on consistent fuelproperties of the E85 gasoline blend stock to produce reliableintermediate blends. A fuel specification for E85 for use inethanol blend pumps would allow the benefits of ethanol tobe consistently leveraged. If ethanol is instead used toupgrade a low quality gasoline fuel stock these benefits maybe limited. A survey of the reported RON, [3, 7, 9, 10, 11, 12,14, 26,28] of ethanol blends is shown in Figure 35. The largedegree of reported variation in RON is partially the result ofdifferent gasoline blend stocks but may also indicate variationin testing with ethanol fuels or a high degree of sensitivity tofuel composition. The influence of ethanol content on RON
has been shown to blend in nearly a linear response to themole fraction of ethanol [28], this is in contrast to the non-linear response on a volumetric blend ratio
Figure 35. Variation of RON for ethanol blends
SUMMARYA 2.0 L GDi Engine with DICP was modified for flex fueloperation with increased compression ratio and 2 step VVAto control effective CR and load with valvetrain phasing.
Effective CR could be controlled allowing MBT spark withcam phasing with an LIVC strategy for 91 RON gasoline E0-E85 fuels. Increased load could be achieved with sparkretard. Excessive retard could be limited with valve phasingcontrol.
Valve deactivation was used to improve combustion stabilityat low loads
Cam phasing and injection timing were optimized for E85 tominimize fuel consumption and emissions
Gasoline ethanol blends E0, E10, E20, E50 and E85 wereevaluated at selected operating conditions where E0 and E85differed significantly to understand the blending response.
Vehicle level simulation was carried out to leverage theimproved low end torque with E85 to improve fuel economyby down-speeding the engine.
Future work will include evaluation of E30 and E40 blends.The engine will also be operated with boost for E0-E85 fuelblends.
CONCLUSIONSHigh low end torque, (11-12 bar BMEP) under 2000 RPMcould be achieved without knock for E50 and E85 blends.
Load could be managed efficiently down to 2 bar BMEP withan EIVC strategy providing improved fuel economy. The useof valve deactivation significantly improved performance.
Lightly throttled performance for internal residual controlwas more efficient than unthrottled operation.
Valve deactivation at high loads under 2500 RPM waseffective at reducing soot.
Valve deactivation did not significantly affect peak torqueunder 2500 RPM with E85.
Intermediate fuel blends up to E50 were still prone to sootformation with early injection timing.
Engine out HC, NOx and soot emissions were reduced withincreasing ethanol content.
Resistance to EGR induced knock enabled reduced NOxemissions for higher ethanol blends, using high valve overlapfor internal EGR.
The improvement in low end torque with E20 -E85 blendsshould enable better launch performance and give anopportunity to operate more efficiently with down-speeding.
For the FTP city cycle much of the energy density gain fromthe base configuration can be made up with a down-speedingstrategy and hardware leveraging the benefits of E85.
Intermediate blends near E20 can provide the majority of theperformance benefit of E85 and enable strategies that offsettheir lower energy penalty.
REFERENCES1. United States Energy Information Association, Officialethanol consumption statistics. URL: http://tonto.eia.doe.gov/dnav/pet/pet_pnp_oxy_dc_nus_mbbl_a.htm.2. One Hundred Tenth Congress of the United States ofAmerica. Energy Independence and Security Act. 2007.URL: http://frwebgate.access.gpo.gov/cgi-bin/getdoc.cgi?dbname=110_cong_bills&docid=f:h6enr.txt.pdf.3. Marriott, C., Wiles, M., Gwidt, J., and Parrish, S.,“Development of a Naturally Aspirated Spark IgnitionDirect-Injection Flex-Fuel Engine,” SAE Int. J. Engines 1(1):267-295, 2009, doi:10.4271/2008-01-0319.4. Stein, R., House, C., and Leone, T., “Optimal Use of E85in a Turbocharged Direct Injection Engine,” SAE Int. J. FuelsLubr. 2(1):670-682, 2009, doi:10.4271/2009-01-1490.
5. Bergström, K., Melin, S.A., Jones, D.C., “The newECOTEC Turbo Biopower Engine from GM Powertrain-Utilizing the Power of Nature's Resources,” InternationalesWiener Motorensymposium, 2007.
6. Caton, P., Hamilton, L., and Cowart, J., “An Experimentaland Modeling Investigation into the Comparative Knock andPerformance Characteristics of E85, Gasohol [E10] andRegular Unleaded Gasoline [87 (R+M)/2],” SAE TechnicalPaper 2007-01-0473, 2007, doi:10.4271/2007-01-0473.
7. Nakata, K., Utsumi, S., Ota, A., Kawatake, K. et al., “TheEffect of Ethanol Fuel on a Spark Ignition Engine,” SAETechnical Paper 2006-01-3380, 2006, doi:10.4271/2006-01-3380.
8. Tsunooka, T., Hosokawa, Y., Utsumi, S., Kawai, T. et al.,“High Concentration Ethanol Effect on SI Engine ColdStartability,” SAE Technical Paper 2007-01-2036, 2007, doi:10.4271/2007-01-2036.
9. Szybist, J., Foster, M., Moore, W., Confer, K. et al.,“Investigation of Knock Limited Compression Ratio ofEthanol Gasoline Blends,” SAE Technical Paper2010-01-0619, 2010, doi:10.4271/2010-01-0619.
10. Christie, M., Fortino, N., and Yilmaz, H., “ParameterOptimization of a Turbo Charged Direct Injection Flex FuelSI Engine,” SAE Int. J. Engines 2(1):123-133, 2009, doi:10.4271/2009-01-0238.
11. Milpied, J., Jeuland, N., Plassat, G., Guichaous, S. et al.,“Impact of Fuel Properties on the Performances and KnockBehaviour of a Downsized Turbocharged DI SI Engine -Focus on Octane Numbers and Latent Heat of Vaporization,”SAE Int. J. Fuels Lubr. 2(1):118-126, 2009, doi:10.4271/2009-01-0324.
12. Cairns, A., Stansfield, P., Fraser, N., Blaxill, H. et al., “AStudy of Gasoline-Alcohol Blended Fuels in an AdvancedTurbocharged DISI Engine,” SAE Int. J. Fuels Lubr. 2(1):41-57, 2009, doi:10.4271/2009-01-0138.
13. Cruff, L., Kaiser, M., Krause, S., Harris, R. et al.,“EBDI® - Application of a Fully Flexible High BMEPDownsized Spark Ignited Engine,” SAE Technical Paper2010-01-0587, 2010, doi:10.4271/2010-01-0587.
14. Gingrich, J., Alger, T., and Sullivan, B., “Ethanol Flex-fuel Engine Improvements with Exhaust Gas Recirculationand Hydrogen Enrichment,” SAE Int. J. Fuels Lubr. 2(1):58-65, 2009, doi:10.4271/2009-01-0140.
15. Nakata, K., Uchida, D., Ota, A., Utsumi, S. et al., “TheImpact of RON on SI Engine Thermal Efficiency,” SAETechnical Paper 2007-01-2007, 2007, doi:10.4271/2007-01-2007.
16. Hoyer, K., Moore, W., and Confer, K., “A SimulationMethod to Guide DISI Engine Redesign for IncreasedEfficiency using Alcohol Fuel Blends,” SAE Int. J. Engines3(1):889-902, 2010, doi:10.4271/2010-01-1203.
17. Hendriksma, N., Kunz, T., and Greene, C., “Design andDevelopment of a 2-Step Rocker Arm,” SAE Technical Paper2007-01-1285, 2007, doi:10.4271/2007-01-1285.
18. Sellnau, M., Kunz, T., Sinnamon, J., and Burkhard, J.,“2-step Variable Valve Actuation: System Optimization andIntegration on an SI Engine,” SAE Technical Paper2006-01-0040, 2006, doi:10.4271/2006-01-0040.
19. Sellnau, M. and Rask, E., “Two-Step Variable ValveActuation for Fuel Economy, Emissions, and Performance,”SAE Technical Paper 2003-01-0029, 2003, doi:10.4271/2003-01-0029.
20. Cleary, D. and Silvas, G., “Unthrottled Engine Operationwith Variable Intake Valve Lift, Duration, and Timing,” SAETechnical Paper 2007-01-1282, 2007, doi:10.4271/2007-01-1282.
21. Sugiyama, T., Hiyoshi, R., Takemura, S., and Aoyama,S., “Technology for Improving Engine Performance usingVariable Mechanisms,” SAE Technical Paper 2007-01-1290,2007, doi:10.4271/2007-01-1290.
22. Haugen, D., Blackshear, P., Pipho, M., and Esler, W.,“Modifications of a Quad 4 Engine to Permit Late IntakeValve Closure,” SAE Technical Paper 921663, 1992, doi:10.4271/921663.
23. Moore, W., Foster, M., Lai, M., Xie, X. et al., “ChargeMotion Benefits of Valve Deactivation to Reduce FuelConsumption and Emissions in an GDi, VVA Engine,” SAETechnical Paper 2011-01-1221, 2011, doi:10.4271/2011-01-1221.
24. Stansfield, P., Wigley, G., Garner, C., Patel, R. et al.,“Unthrottled Engine Operation using Variable ValveActuation: The Impact on the Flow Field, Mixing andCombustion,” SAE Technical Paper 2007-01-1414, 2007,doi:10.4271/2007-01-1414.
25. Patel, R., Ladommatos, N., Stansfield, P., Wigley, G. etal., “Comparison between Unthrottled, Single and Two-valveInduction Strategies Utilising Direct Gasoline Injection:Emissions, Heat-release and Fuel Consumption Analysis,”SAE Technical Paper 2008-01-1626, 2008, doi:10.4271/2008-01-1626.
26. Alleman, T.L., Wright, K., Hogan, D., “National Reportof E85 Quality”, CRC Report NO. E85, 2009. URL: http://www.crcao.com/reports/recentstudies2009/E-85/E-85%20Final%20Report%20_120609_.pdf
27. Graham, L.A., Belisle, S.L., Baas, C.-L., “Emissionsfrom Light Duty Gasoline Vehicles Operating on Low BlendEthanol Gasoline and E85”, Atmospheric Environment 42(19), 4498-4516, 2008.
28. Anderson, J.E., Kramer, U., Meuller, S.A., Wallington,T.J., “Octane Numbers of Ethanol-and Methanol-GasolineBlends Estimated from Molar Concentrations”, Energy and
Fuels 2010, 24,6576-6585, 2010 URL: http://pubs.acs.org/doi/abs/10.1021/ef101125c
CONTACT INFORMATIONWayne [email protected]
ACKNOWLEDGMENTSThe authors wish to acknowledge project support from:
Delphi Powertrain; Tim Kunz, Cindy Tawaf, Ray Parker,Steve Crossman, Tom Verstraete, Tim Coha, EunjooHopkins, David Yen, Randy Okenka, Keith Confer. CarlMcQuillen Racing., Wayne State University; Dr. Ming-ChiaLai, Dr. Xingbin Xie, Atsushi Matsumoto, Yi Zheng
This material is based upon work supported by theDepartment of Energy under Award Number DE-FC26-07NT43270.
DEFINITIONS/ABBREVIATIONSabdc
after bottom dead center
ASTMAmerican Society for Testing and Materials
atdcafter top dead center
BDCBottom Dead Center
bbdcbefore bottom dead center
BMEPBrake Mean Effective Pressure (KPa)
BSFCBrake Specific Fuel Consumption (g/KW Hr)
btdcbefore top dead center
cadcrank angle degrees
CA50Crank Angle of 50% Burn duration
CFRCooperative Fuels Research
COVCoefficient of Variation (IMEP)
CRCompression Ratio
DIDirect Injection
DICPDual Independent Cam Phasing
EAEngine Averaged
ECOEngine out Carbon Monoxide (%)
EGRExhaust Gas Recirculation
EHCEngine out Hydrocarbons (ppm)
EIVCEarly Intake Valve Closing
ENOxEngine out Nitrogen Oxide (ppm)
E02Engine out Oxygen (%)
FMEPFriction Mean Effective Pressure (KPa)
FSNFilter Smoke Number
FTPFederal Test Procedure
GDiGasoline Direct Injection
HLAHydraulic Lash Adjuster
IMEPIndicated Mean Effective pressure (KPa)
LHVLower Heating Value (KJ/g)
LIVCLate Intake Valve Closing
LIVOLate Intake Valve Opening
MAPManifold Absolute Pressure (KPa)
MBTMinimum spark advance for Best Torque
MPFIMulti -Port (Point) Fuel Injection
MPGMiles Per Gallon
NMEPNet Mean Effective Pressure (KPa)
NVHNoise, Vibration, Harshness
PEPower Enrichment
PFIPort Fuel Injection
RFFRoller Finger Follower
RONResearch Octane Number
SOIStart of Injection
SISpark Ignited
TDCTop Dead Center
VVAVariable Valve Actuation
DISCLAIMER“This report was prepared as an account of work sponsoredby an agency of the United States Government. Neither theUnited States Government nor any agency thereof, nor any oftheir employees, makes any warranty, express or implied, orassumes any legal liability or responsibility for the accuracy,completeness, or usefulness of any information, apparatus,product, or process disclosed, or represents that its use wouldnot infringe privately owned rights. Reference herein to anyspecific commercial product, process, or service by tradename, trademark, manufacturer, or otherwise does notnecessarily constitute or imply its endorsement,recommendation, or favoring by the United StatesGovernment or any agency thereof. The views and opinionsof authors expressed herein do not necessarily state or reflectthose of the United States Government or any agencythereof.”

The Engineering Meetings Board has approved this paper for publication. It hassuccessfully completed SAE's peer review process under the supervision of the sessionorganizer. This process requires a minimum of three (3) reviews by industry experts.
All rights reserved. No part of this publication may be reproduced, stored in aretrieval system, or transmitted, in any form or by any means, electronic, mechanical,photocopying, recording, or otherwise, without the prior written permission of SAE.
ISSN 0148-7191
Positions and opinions advanced in this paper are those of the author(s) and notnecessarily those of SAE. The author is solely responsible for the content of the paper.
SAE Customer Service:Tel: 877-606-7323 (inside USA and Canada)Tel: 724-776-4970 (outside USA)Fax: 724-776-0790Email: [email protected] Web Address: http://www.sae.orgPrinted in USA