Embed Size (px)
Citation preview
Ethanol Dehydration with Zeolite ZSM-5
A Major Qualifying Project Report
Submitted to the Faculty of the
WORCESTER POLYTECHNIC INSTITUTE
In partial fulfillment of the requirements for the
Degree of Bachelor of Science
In Chemical Engineering
By
______________________________
Jennifer Coffey
______________________________
Alexander Zitoli
April 28, 2016
Approved: .
______________________________
Professor Michael Timko, Advisor
ii
Abstract
In the global effort to reduce fossil fuel reliance, green ethylene is being produced
through vapor phase catalytic dehydration of bio-ethanol. This project studied the benefits of
ethanol dehydration with zeolite ZSM-5 in the liquid phase. Process variables manipulated were
phase, feed flowrate ratio, and volume-hourly space velocity. Through gas chromatography, it
was determined that liquid phase dehydration had comparable ethanol conversion and superior
ethylene production on a per gram of catalyst basis. Further investigation of process variables is
recommended.

iii
Table of Contents
Abstract ........................................................................................................................................... ii
Table of Contents ........................................................................................................................... iii
List of Figures ................................................................................................................................. v
Chapter 1: Introduction ................................................................................................................... 1
Chapter 2: Background ................................................................................................................... 5
2.1 Bio-Ethylene Industry ........................................................................................................... 5
2.2 Catalysis ................................................................................................................................ 6
2.3 Zeolites .................................................................................................................................. 6
2.3.1 Zeolites in Industry ........................................................................................................ 6
2.4 Ethanol Dehydration Mechanism ......................................................................................... 7
2.5 Ethanol Dehydration with ZSM-5 ........................................................................................ 8
2.6 Efficacy Criteria .................................................................................................................... 9
Chapter 3: Experimental ............................................................................................................... 10
3.1 Safety .................................................................................................................................. 10
3.2 Equipment ........................................................................................................................... 10
3.3 Procedure ............................................................................................................................ 12
3.3.1 Catalyst Preparation ..................................................................................................... 12
3.3.2 Reactor Assembly ........................................................................................................ 13
3.3.3 Reactor Startup............................................................................................................. 13
3.2 Gas Chromatograph Continuous Gaseous Product Analysis .............................................. 14
3.3 Liquid Product Analysis ..................................................................................................... 15
3.4 Variables Investigated ......................................................................................................... 17
3.5 Volume-Hourly Space Velocity .......................................................................................... 18
3.6 Ethanol Conversion ............................................................................................................. 18
iv
3.6 Ethylene Yield .................................................................................................................... 19
Chapter 4: Results ......................................................................................................................... 21
4.1 Gaseous Products ................................................................................................................ 21
4.2 Liquid Products ................................................................................................................... 23
4.3 Reaction Activity ................................................................................................................ 25
4.3.1 Liquid Phase Ethanol Dehydration Reaction Activity ................................................. 25
4.3.2 Vapor Phase Ethanol Dehydration Reaction Activity ................................................. 26
4.3.3 Steady State .................................................................................................................. 27
4.4 Conversion .......................................................................................................................... 28
4.5 Yield .................................................................................................................................... 28
4.6 Throughput .......................................................................................................................... 31
Chapter 5: Conclusions and Recommendations ........................................................................... 33
5.1 Conclusions ......................................................................................................................... 33
5.1.1 Industrial Considerations ............................................................................................. 33
5.2 Recommendations for Further Study .................................................................................. 34
Acknowledgements ....................................................................................................................... 35
References ..................................................................................................................................... 36
Appendix A: Zeolite ZSM-5 Material Safety Data Sheet ............................................................. 38
Appendix B: Gas Chromatograph Methods .................................................................................. 40
Appendix C: Gas Chromatograph Calibration Curves ................................................................. 43
Appendix D: Trial Parameters ...................................................................................................... 45
Appendix E: In-Line GC-FID Intensity Graphs ........................................................................... 46
Appendix F: Liquid Product Analysis Graphs .............................................................................. 51
Appendix G: Raw Data ................................................................................................................. 55
Appendix H: Poster ....................................................................................................................... 58

v
List of Figures
Figure 1: Route to Green Commodity Products ............................................................................. 1
Figure 2: Structural Formula Depicting Aluminasilicate Attractions in Zeolite Structures ........... 6
Figure 3: Possible Ethanol Dehydration Triangular Reaction Network based on Luiz .................. 7
Figure 4: Ethanol Dehydration Equipment Schematic ................................................................. 11
Figure 5: Picture of Process Unit; Gas Chromatograph not pictured ........................................... 11
Figure 6: Micro reactors Used for Experiment ............................................................................. 13
Figure 7: Micro reactor Installed in Oven ..................................................................................... 14
Figure 8: Gas Chromatograph Equipment Used for Continuous and Batch Analysis .................. 15
Figure 9: Glass Collection Column for Reactor Outlet ................................................................ 16
Figure 10: Liquid Product Dilution Table .................................................................................... 16
Figure 11: Trial Parameters for Phase 3, Study of the Effects of VHSV ..................................... 17
Figure 12: Liquid Phase Steady State Gaseous Products.............................................................. 21
Figure 13: Vapor Phase Steady State Gaseous Products .............................................................. 22
Figure 14: Overlay of Steady State Gaseous Products ................................................................. 22
Figure 15: GC-MS Identification of Liquid Products ................................................................... 23
Figure 16: GC-FID Analysis of Liquid Products .......................................................................... 24
Figure 17: Typical Liquid Product from Vapor Phase Ethanol Dehydration ............................... 24
Figure 18: Oil Sample GC-MS Analysis ...................................................................................... 25
Figure 19: Typical Liquid Phase Reaction Activity from In-Line GC-FID ................................. 25
Figure 20: Liquid Phase Reaction with VHSV of 24.35 .............................................................. 26
Figure 21: Vapor Phase Reaction Activity from In-Line GC-FID ............................................... 27
Figure 22: Ethanol Conversion ..................................................................................................... 28
Figure 23: Ethylene Yield ............................................................................................................. 29
Figure 24: Liquid Phase Product Yield ......................................................................................... 30

vi
Figure 25: Vapor Phase Product Yield ......................................................................................... 30
Figure 26: Throughput Comparison based on VHSV................................................................... 31
Figure 27: WHSV and VHSV Comparison .................................................................................. 32
Figure 28: GC-FID In-Line Method for Gaseous Product Analysis ............................................ 40
Figure 29: GC-FID Method for Liquid Product Analysis ............................................................ 41
Figure 30: GC-MS Method for Compound Identification ............................................................ 42
Figure 31: Ethylene Calibration Curve ......................................................................................... 43
Figure 32: Ethanol Calibration Curve ........................................................................................... 43
Figure 33: Butanol Calibration Curve........................................................................................... 44
Figure 34: Complete Trial Parameters .......................................................................................... 45
Figure 35: Run 22, Vapor Phase, VHSV: 20.16 ........................................................................... 46
Figure 36: Run 23, Liquid Phase, VHSV: 24.35 .......................................................................... 46
Figure 37: Run 25, Vapor Phase, VHSV: 40.38 ........................................................................... 46
Figure 38: Run 26, Liquid Phase, VHSV: 2.43 ............................................................................ 46
Figure 39: Run 27, Vapor Phase, VHSV: 201.7 ........................................................................... 47
Figure 40: Run 28, Liquid Phase, VHSV: 4.87 ............................................................................ 47
Figure 41: Run 29, Liquid Phase, VHSV: 24.35 .......................................................................... 47
Figure 42: Run 30, Vapor Phase, VHSV: 100.84 ......................................................................... 47
Figure 43: Run 31, Liquid Phase, VHSV: 4.87 ............................................................................ 48
Figure 44: Run 32, Liquid Phase, VHSV: 4.87 ............................................................................ 48
Figure 45: Run 33, Liquids Phase, VHSV: 8.12 ........................................................................... 48
Figure 46: Run 34, Vapor Phase, VHSV: 20.17 ........................................................................... 48
Figure 47: Run 35, Vapor Phase, VHSV: 100.84 ......................................................................... 49
Figure 48: Run 36, Vapor Phase, VHSV: 141.18 ......................................................................... 49
Figure 49: Run 37, Vapor Phase, VHSV: 80.68 ........................................................................... 49

vii
Figure 50: Run 38, Vapor Phase, VHSV: 60.51 ........................................................................... 49
Figure 51: Run 39, Vapor Phase, VHSV: 121.02 ......................................................................... 50
Figure 52: Run 40, Liquid Phase, VHSV: 40.58 .......................................................................... 50
Figure 53: Liquid Phase, VHSV: 12.17 ........................................................................................ 51
Figure 54: Vapor Phase, VHSV: 40.38 ......................................................................................... 51
Figure 55: Liquid Phase, VHSV: 2.43 .......................................................................................... 51
Figure 56: Vapor Phase, VHSV: 201.7 ......................................................................................... 52
Figure 57: Liquid Phase, VHSV: 4.87 .......................................................................................... 52
Figure 58: Liquid Phase, VHSV: 24.35 ........................................................................................ 53
Figure 59: Vapor Phase, VHSV: 100.84 ....................................................................................... 53
Figure 60: Liquid Phase, VHSV: 4.87 .......................................................................................... 53
Figure 61: Liquid Phase, VHSV: 8 ............................................................................................... 54
Figure 62: Conversion Data Table ................................................................................................ 55
Figure 63: Yield Data Table ......................................................................................................... 56
Figure 64: Throughput Data Table ............................................................................................... 57

1
Chapter 1: Introduction
Ethylene is a commodity product that is used daily by millions of people. From plastic
water bottles to adhesives, ethylene plays a large role in modern day life. The global demand for
ethylene is greater than 156 million tons annually (Fan et. al, 2013). Currently, the vast majority
of ethylene is produced from fossil fuels. Ethylene production from ethanol has gained growing
interest as an environmental alternative to fossil fuels. Producing bio-ethanol from corn and
sugarcane in the United States and Brazil, respectively, has been successful in recent years.
Traditionally, ethylene has been produced by cracking fossil fuels. However, to make this
process competitive compared to current oil refineries, considerable improvements must be
made. Economic benefits would help drive a method of bio-ethylene production can be
developed that is an attractive green alternative. Figure 1 shows a sequence of processing could
provide green commodity products.
Figure 1: Route to Green Commodity Products
Bio-ethanol would continue to be produced from the fermentation of agricultural byproducts
such as sugar cane or corn stover. It would then undergo catalytic dehydration to produce green
ethylene, which is a drop in replacement for petro-produced ethylene.
While bio-ethylene production has undeniable environmental benefits- there are many
factors preventing it from growing to be the main source of ethylene and its derivatives. Bio-
based plastic production produces 327,000 tons a year compared to 12.3 million tons a year of
plastics made from petrochemicals (Williams, 2010). Opposition in America to bio-based
products is often centered on the argument regarding direct and indirect impacts on food
production. The concern is that land will be unequally distributed between commodity
production and food production. Many of the crops that bio-based plastics come from are also
very resource intensive. For example, corn nearly depletes the land it is grown on of all nutrients,
requiring future crops to rely heavily on fertilizers- which have their own set of well

2
documented, negative effects on the environment. Additionally, industry has not latched onto
bio-based plastics because of the added cost. That cost is eventually passed on to the customer.
The most notable company using bio-ethylene is Coca-Cola with their “Plant Bottle.” Currently
Coca-Cola is absorbing the cost of using bio-ethylene while further research and development
aims to lower costs. They have pledged that all Coca-Cola Brand bottles will be 30% plant based
by 2020 (Plant Bottle FAQ, 2015).
Large feed stocks of sugar cane and corn enable industrial scale production of bio-
ethylene. Bio-ethylene is identical in chemical structure and reactivity to petrochemical ethylene.
This makes it a drop-in substitute, meaning companies do not need to alter their current
processes or equipment before they begin to use bio-ethylene. Production and use of bio-ethylene
generates 10% of the green-house gases associated with petro-based ethylene (Brazilian
Sugarcane Industry Association, 2015). Eliminating the need for ethylene generated from fossil
fuels with bio-ethylene is not feasible at this point in time. One company that has had particular
success with bio-ethylene production is Braskem, located in Brazil. Historically, Braskem is
known best as a petrochemical company holding group. Ironically, they are now the most notable
bioplastic producer in the entire world. A major source of their success is smart supply chain
usage (Luiz et. al, 2013). Their plants are located near where the bio-ethanol is produced, as
Brazil produces 588 million tons of sugarcane each year. A substantial amount of Brazil’s sugar
cane is fermented into bio-ethanol. Braskem has produces bio-ethanol from sugar cane without
effecting the countries food supply or the rain forest
Industry currently uses a series of fixed bed, adiabatic reactors to carry out the
dehydration of bio-ethanol. Ethanol dehydration is a zero-order endothermic reaction that favors
the production of ethanol. High temperature and pressure drives the equilibrium in favor of the
production of ethylene (Cameron, Levine & Nagulapalli, 2012). Fixed bed reactors inherently
require a catalyst to work over a large temperature range. Unfortunately, catalysts with the
highest selectivity for ethylene production have very high and small ideal temperature ranges.
Additionally, the products of vapor phase ethanol dehydration are also difficult to separate.
Many products similar to ethylene are produced requiring several separation steps to isolate
ethylene.

3
A method that has been under particularly rigorous study is the use of a zeolite catalyst.
At Worcester Polytechnic Institute (WPI), ethanol dehydration is being investigated with the use
of the zeolite catalyst, ZSM-5. In the reaction mechanism, ZSM-5 acts as a bronsted acid site that
facilitates dehydration. However, numerous studies have indicated that the concentration of
active acid sites on ZSM-5 decreases significantly over time when reactions are run
continuously. Additionally, fouling of the catalyst occurs when species within the reaction
deposit on the surface of the catalyst, blocking sites of activity (Zhang et. al, 2008).
The main goal of this project was to optimize the liquid phase zeolite catalyzed
dehydration of ethanol to contribute to the current industrial processes used to create ethylene
from bio-ethanol. Data were collected over the course of seven months by two undergraduate
students with the help of a PhD candidate. From the results of this project, recommendations
were developed on how to improve the current ethanol dehydration process being investigated at
WPI. This project aims to provide evidence of a liquid phase advantage. Additionally, this
project aimed to contribute to a growing body of research on liquid phase chemical processes for
bio-refineries.
Data was collected over 41 experimental trials that lasted between four and eight hours
depending on the activity of the reaction. Trials were run in both the liquid and vapor phase.
Experiments were conducted using a ZSM-5 packed bed micro-reactor. The volume-hourly
space velocity (VHSV) was the variable manipulated in order to compare the efficacy of the
liquid phase reactions. Ethanol and water were co-fed to the reactor at a ratio of 2:1 volume
percent. Upon exiting the micro-reactor, the gas and liquid phase products were sent to a glass
column for collection. The gas products were fed to the gas chromatograph (GC) for further
analysis. Liquid products were collected periodically and analyzed in batches. From the GC, the
continuously generated graph of intensity vs. retention time was used to identify and quantify
each product species. The intensity of generated peaks was further analyzed with calibration
curves to determine conversion and yield. The amounts of each species were calculated by
integrating the areas of the peaks that corresponded to each species.
Initial trials were used to determine the optimal feed ratio of 2:1 (ethanol: water).
Different temperatures were investigated. Liquid phase reactions ensure better heat exchange
throughout the reaction media. When comparing liquid and gas phase interactions, the liquid

4
phase has more contact between molecules and surface area for heat transfer. The stability of the
catalyst and the optimization of the temperature regime are barriers in the optimization of this
chemical process.
Currently, there are three main concerns with the process that are potentially leading to
the deactivation of the catalyst: ion exchange, coking, and the framework stability of the
temperature regime. Ion exchange, also referred to as leaching, is the phenomena of chemical
species of the zeolite dissociating from the primary body of the catalyst into the reaction
medium, rendering catalytic sites obsolete. Coking stability, as mentioned earlier, cannot be
directly prevented or reversed when using powdered ZSM-5. Leaching and coking stability
cannot be quantified sufficiently with the lab equipment available. However, the effects of the
temperature regime can be directly observed based on the ethanol conversion and ethylene yield
at different temperatures within the range of 250-450°C.
In early trials, the liquid and vapor phase were compared by operating at the same
weight-hourly space velocities (WHSV’s). However, to account for differences in the density of
the liquid and vapor phases, the VHSV was chosen as a comparison variable instead of the
WHSV. Comparison of the VHSV’s showed that at the same space velocities, liquid phase
dehydration has a higher ethylene yield and lower ethanol conversion than the vapor phase. In
contrast, the vapor phase has a higher ethanol conversion than the liquid phase, but the liquid
phase trials demonstrated greater throughput than the vapor phase.

5
Chapter 2: Background
This project studies the benefits of performing ethanol dehydration with ZSM-5 in the
liquid phase versus the vapor phase. This chapter provides background information on the
industry that does ethanol dehydration with zeolites, catalysis and ZSM-5, the mechanism of
ethanol dehydration, vapor and liquid phase dehydration, and elements of reactor design.
Although vapor phase dehydration and zeolites are well researched in the bio-ethylene industry,
this project explores the potential for liquid phase dehydration to generate a higher product purity
and greater throughput than vapor phase dehydration. In addition to providing background
information on current industrial practices and the dehydration mechanism, this chapter will
investigate the criteria that determine the efficiency of a process.
2.1 Bio-Ethylene Industry
Ethylene is a commodity product that is used daily by millions of people, resulting in a
global demand for ethylene greater than 156 million tons annually (Fan, 2013). Traditionally,
ethylene is produced from petroleum, but ethylene production from ethanol has gained a growing
environmental and financial interest (Haro et. al, 2013). Conventionally, ethylene has been
produced by cracking fossil fuels, but ethylene production from bio-ethanol from corn and
sugarcane in the United States and Brazil, respectively, has been successful in recent years.
Large feed stocks of sugar cane and corn enable industrial scale production of bio-
ethylene. Bio-ethylene is identical in chemical structure and reactivity to petrochemical ethylene.
This makes it a drop-in substitute, meaning companies do not need to alter their current
processes or equipment before they begin to use bio-ethylene. Production and use of bio-ethylene
generates 10% of the green-house gases associated with petro-based ethylene (Brazilian
Sugarcane Industry Association, 2015). Eliminating the need for ethylene generated from fossil
fuels with bio-ethylene is not feasible at this point in time. One company that has had particular
success with bio-ethylene production is Brazil’s Braskem. Historically, Braskem is known best
as a petrochemical company holding group. Ironically, they are now the most notable bioplastic
producer in the entire world. A major source of their success is smart supply chain usage (Luiz,
2013). Their plants are located near where the bio-ethanol is produced, as Brazil produces 588
million tons of sugarcane each year. A substantial amount of Brazil’s sugar cane is fermented
into bio-ethanol via catalytic dehydration.
6
2.2 Catalysis
Catalysis, the study of catalysts, supports many industries around the world such as
petroleum refining, the food industry, energy generation, and the chemical industry. Estimates
from the North American Catalysis Society state that catalysis contributes to more than 35% of
the global gross domestic product (GDP), making the study of catalysts and catalyst-aided
reactions extremely valuable and relevant to the global economy. Particularly, the chemical
industry relies heavily on catalysts to decrease production costs and increase efficiency (What is
Catalysis?, 2008).
2.3 Zeolites
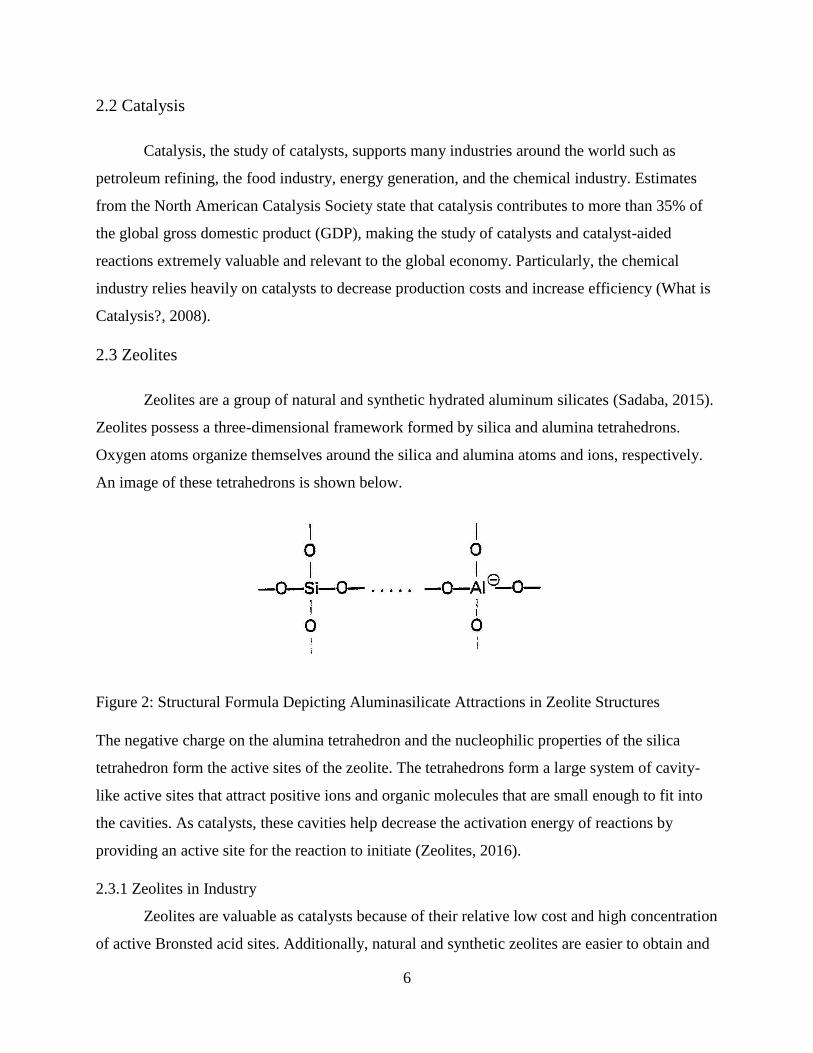
Zeolites are a group of natural and synthetic hydrated aluminum silicates (Sadaba, 2015).
Zeolites possess a three-dimensional framework formed by silica and alumina tetrahedrons.
Oxygen atoms organize themselves around the silica and alumina atoms and ions, respectively.
An image of these tetrahedrons is shown below.
Figure 2: Structural Formula Depicting Aluminasilicate Attractions in Zeolite Structures
The negative charge on the alumina tetrahedron and the nucleophilic properties of the silica
tetrahedron form the active sites of the zeolite. The tetrahedrons form a large system of cavity-
like active sites that attract positive ions and organic molecules that are small enough to fit into
the cavities. As catalysts, these cavities help decrease the activation energy of reactions by
providing an active site for the reaction to initiate (Zeolites, 2016).
2.3.1 Zeolites in Industry
Zeolites are valuable as catalysts because of their relative low cost and high concentration
of active Bronsted acid sites. Additionally, natural and synthetic zeolites are easier to obtain and
7
process than higher value transition metal catalysts. The well-defined and consistent structure of
zeolites allows for relatively consistent results in industrial processes. However, zeolites are
susceptible to degradation via coking, leaching, and breakdown of the framework. The solvents,
reactants, temperature, and reaction conditions used in the presence of zeolites can lead to
degeneration (Sadaba, 2015).
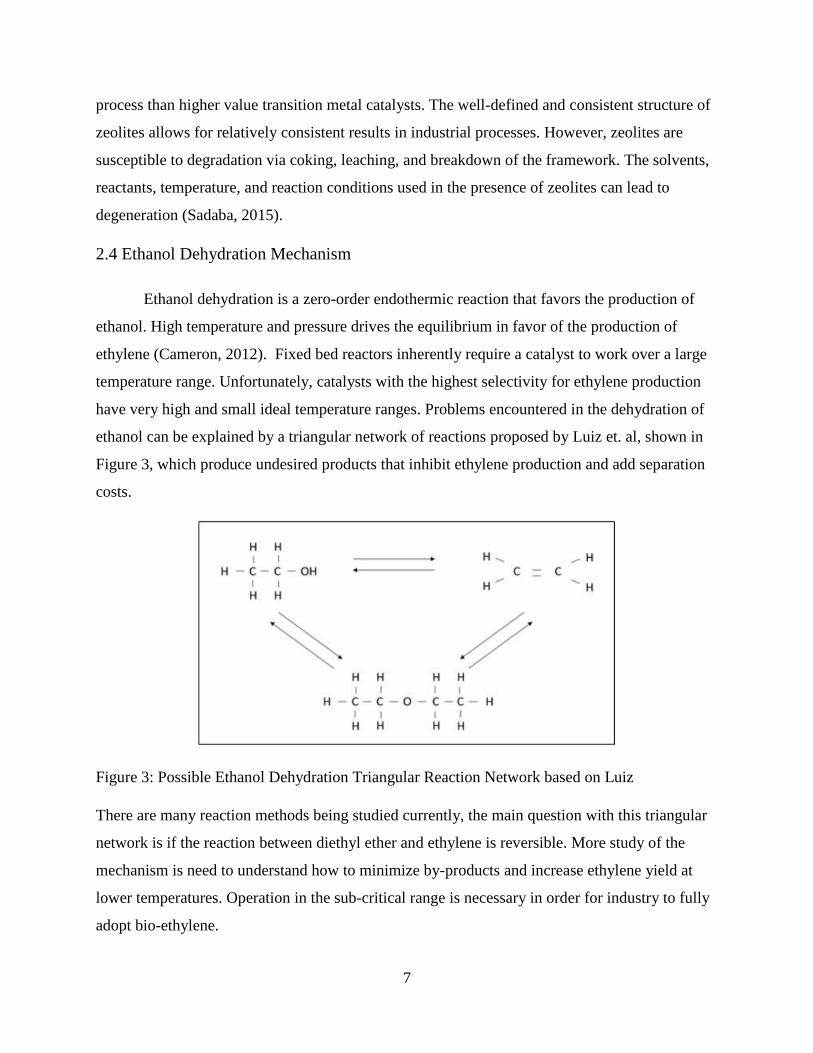
2.4 Ethanol Dehydration Mechanism
Ethanol dehydration is a zero-order endothermic reaction that favors the production of
ethanol. High temperature and pressure drives the equilibrium in favor of the production of
ethylene (Cameron, 2012). Fixed bed reactors inherently require a catalyst to work over a large
temperature range. Unfortunately, catalysts with the highest selectivity for ethylene production
have very high and small ideal temperature ranges. Problems encountered in the dehydration of
ethanol can be explained by a triangular network of reactions proposed by Luiz et. al, shown in
Figure 3, which produce undesired products that inhibit ethylene production and add separation
costs.
Figure 3: Possible Ethanol Dehydration Triangular Reaction Network based on Luiz
There are many reaction methods being studied currently, the main question with this triangular
network is if the reaction between diethyl ether and ethylene is reversible. More study of the
mechanism is need to understand how to minimize by-products and increase ethylene yield at
lower temperatures. Operation in the sub-critical range is necessary in order for industry to fully
adopt bio-ethylene.

8
A large body of research has contributed to the feasibility of carrying out catalytic
ethanol dehydration in the sub-critical range. In a study by Chen et. al, catalytic ethanol
dehydration was tested with SAPO as the catalyst. An investigation of the temperature regime
determined that the highest catalytic activity for ethanol and ethylene was in the range of 340-
440˚C (Chen et. al, 2010).
2.5 Ethanol Dehydration with ZSM-5
Zeolite Socony Mobil-5 (ZSM-5) is an aluminosilicate zeolite patented by Mobil Oil
Company in 1975 (Lisensky, 2010). Research organizations and chemical companies have
investigated the physical and chemical properties of ZSM-5 under a variety of conditions to
determine the efficacy of ZSM-5 as a catalyst. Particularly, a joint study by the research
scientists from the Georgia Institute of Technology, the U.S. Department of Chemistry and
Catalysis Research Center, and universities in Germany and Switzerland investigated the
stability of ZSM-5 and Zeolite Y with different ratios of Aluminum to Silica in hot liquid water
from 150-200˚C. Through a variety of analytical methods like absorption spectroscopy and X-
ray diffraction, the group of researchers determined that ZSM-5 did not experience modifications
when exposed to hot liquid water under the given conditions (Ravenelle et. al, 2010).
In a study conducted by researchers at the School of Chemical Engineering and
Technology at Tianjin University, ZSM-5 and three other catalysts were studied in the catalytic
dehydration of ethanol to ethylene. The research group determined that among four catalysts,
ZSM-5 exhibited the highest ethanol conversion and the highest selectivity to ethylene, making
ZSM-5 a preferred choice for ethanol dehydration (Zhang et. al, 2008). The study also noted that
the stability of ZSM-5 had issues with stability over long periods of time due to coking.
A study conducted at the University of Iowa further investigated ethanol dehydration
with ZSM-5. Cory Phillips and Ravindra Datta determined that the presence of water in the
ethanol feedstock increased catalytic activity and ethylene selectivity. They studied ethanol
dehydration in the vapor phase with a feed ratio of 3:1, ethanol to water. The reaction
temperature for their investigation was 140-220°C. They purposed that the presence of water was
able to prevent coking by tempering the acidity of ZSM-5’s active sites (Phillips & Datta, 1997).

9
2.6 Efficacy Criteria
Multiple criteria are used to analyze collected data for an experiment. Conversion and
yield calculations as well as throughput calculations were key evaluative tools for this project.
Conversion is defined as the number of moles reacted of a species per mole of the species fed to
the reactor (Fogler, 2005). An equation for calculating conversion is show below.
𝐶𝑜𝑛𝑣𝑒𝑟𝑠𝑖𝑜𝑛 =𝑀𝑜𝑙𝑒𝑠 𝑓𝑒𝑑
𝑀𝑜𝑙𝑒𝑠 𝑟𝑒𝑎𝑐𝑡𝑒𝑑
Throughput is a criteria used to measure the value and efficiency of an industrial chemical
process. Throughput can be measured by the total output of a process or a unit over a specific
period of time under normal operating conditions (What is Throughput?, 2016). For analysis,
throughput was compared by determining the amount of ethylene generate per gram of catalyst
used. When comparing the effects of a variable on a process, changes in throughput are a useful
indication of the efficacy of a process.

10
Chapter 3: Experimental
Ethylene production is young and growing industry where advances in industrial
processes could increase efficacy and productivity. Specifically, ethanol dehydration in the liquid
phase holds potential for lower energy costs and fits better with the supply chain for the industry.
To determine the benefits of liquid phase versus vapor phase ethanol dehydration, the project
team accomplished three objectives.
1. To vary the VHSV and feed flow ratios to optimize the production of ethylene.
2. To determine the ethanol conversion and ethylene yield of liquid and vapor phase
reactions.
3. To quantify the throughput of ethylene for liquid and vapor phase reaction.
After accomplishing these objectives, the project team was able to analyze the data collected and
make recommendation and conclusions on liquid phase and vapor phase ethanol dehydration.
3.1 Safety
Standard safety precautions were taken throughout the entire series of experiments
conducted. Personal protective gear was used at all times including safety glasses with side
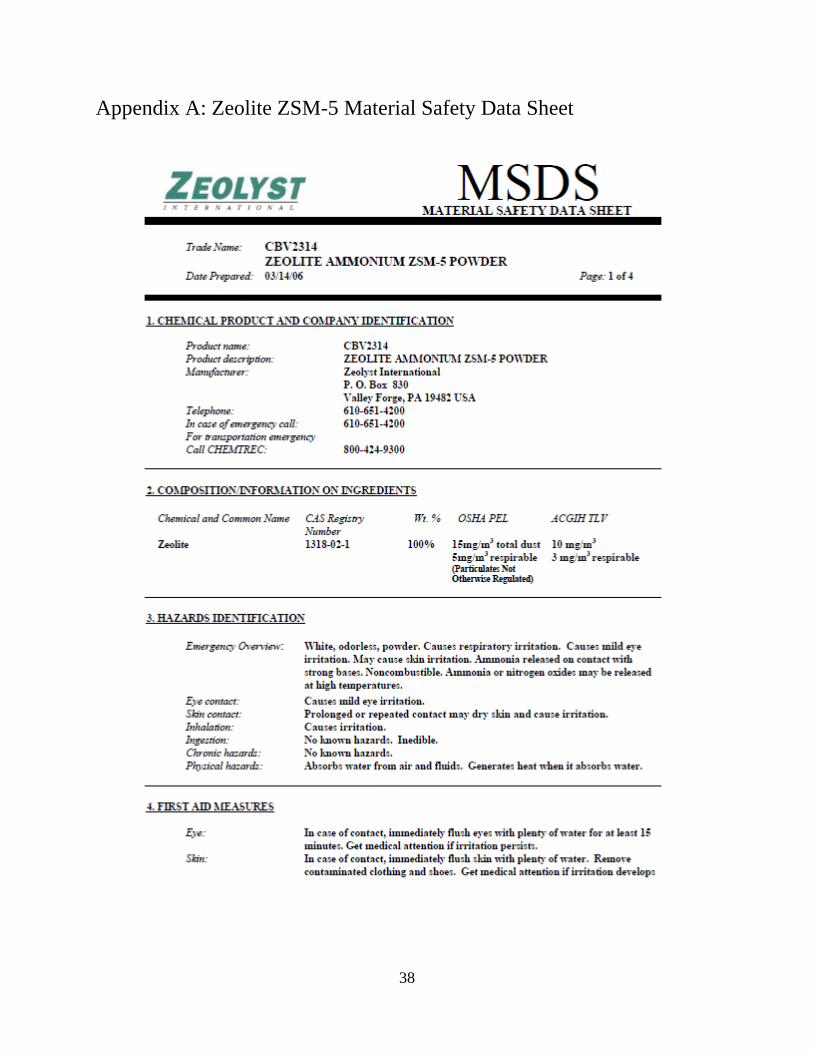
shields and gloves. Gloves were especially important when handling zeolite ZSM-5 as it is a
micro-powder that can easily irritate skin. The material safety data sheet for zeolite ZSM-5 can
be found in Appendix A. Safety shields were used around the oven during reactions as typical
operating temperature was above 300°C and some runs were at pressures as high as 3600 psi. All
gas tanks were also secured to a vertical edge using chains to prevent tipping.
3.2 Equipment
The ethanol dehydration reaction in both liquid and vapor phases was carried out in a
micro-scale reactor. The reactor was housed in a retrofitted gas chromatograph chamber that
allowed for tight temperature control and had ports for inlet and outlets as well as temperature
probes. A full schematic can be seen below in Figure 4.

11
Figure 4: Ethanol Dehydration Equipment Schematic
Reactants are stored within the reactor enclosure and pumped with separate centrifugal pumps.
Nitrogen was used as a carrier gas in this study. They pass through a mixing block prior to
entering the oven chamber. Upon entering the oven, reactants move through a coil designed to
allow them to reach full temperature before entering a packed bed reactor. The outlet end of the
reactor is blocked with a porous frit that allowed products to exit but retained the ZSM-5 packed
bed. Products flow from the reactor to a glass collection chamber. Liquid products are collected
and as gaseous products build pressure they move towards the in-line gas chromatograph. A
photograph of the equipment can be seen below in Figure 5:
Figure 5: Picture of Process Unit; Gas Chromatograph not pictured
12
Throughout this study, the most significant change in the equipment was the length of the outlet
piping. The reactor oven was reconfigured to minimize the length of the outlet piping to the gas
chromatograph. Operating with the least possible distance to the gas chromatograph provided
reliable, reproducible results. Longer outlet pipe lengths lead to pressure build up and sudden
release- skewing the results of the in-line gas chromatograph.
3.3 Procedure
A very well defined procedure was followed for each of the 41 experimental trials. The
catalyst would be calcined the evening before a trial was scheduled. This process is discussed in
detail in section 3.3.1. The reactor was then loaded with the appropriate amount of catalyst and
secured in oven of the retrofitted gas chromatograph. The oven was then turned on and allowed
to reach temperature. If the trial was to be in the liquid phase, the lines would be pressurized for
the pre-heating period to ensure that reactants were in the proper phase from the very beginning
of the reaction. Once the oven reached the desired temperature, the pumps and GC-FID were
turned on. Gaseous product activity was measured with the GC-FID for the duration of the trial.
The glass collection column for liquid products was emptied as needed. Liquid product samples
were retained for further analysis. Thorough explanations for each phase of a trial can be found
in the following sections.
3.3.1 Catalyst Preparation
ZSM-5 was prepared for each reaction by calcining the desired amount in a crucible for
an extended period of time at high temperatures. Calcining ZSM-5 decreases the moisture
content of the catalyst, allowing for the reactants to more easily access the active sites within the
ZSM-5. The catalyst was initially calcined in a low temperature oven for one hour at 100˚C, and
the catalyst was then moved to a 550 ˚C oven for approximately 12 hours. The catalyst was
removed from the oven by using long metal tongs to decrease proximity to the heat source, and
heat resistant gloves were used to prevent burns and other injuries from occurring in the case of
skin contact with the hot crucible. The crucible and catalyst were cooled on a heat resistant brick
for 10 minutes, and the desired amount of catalyst was weighed in a weighing tray on a scale that
read up to four digits after the decimal place. However, only two digits after the decimal places
were used for the actual weight considering the weight of the catalyst did not need to be known
after the hundredth decimal place.
13
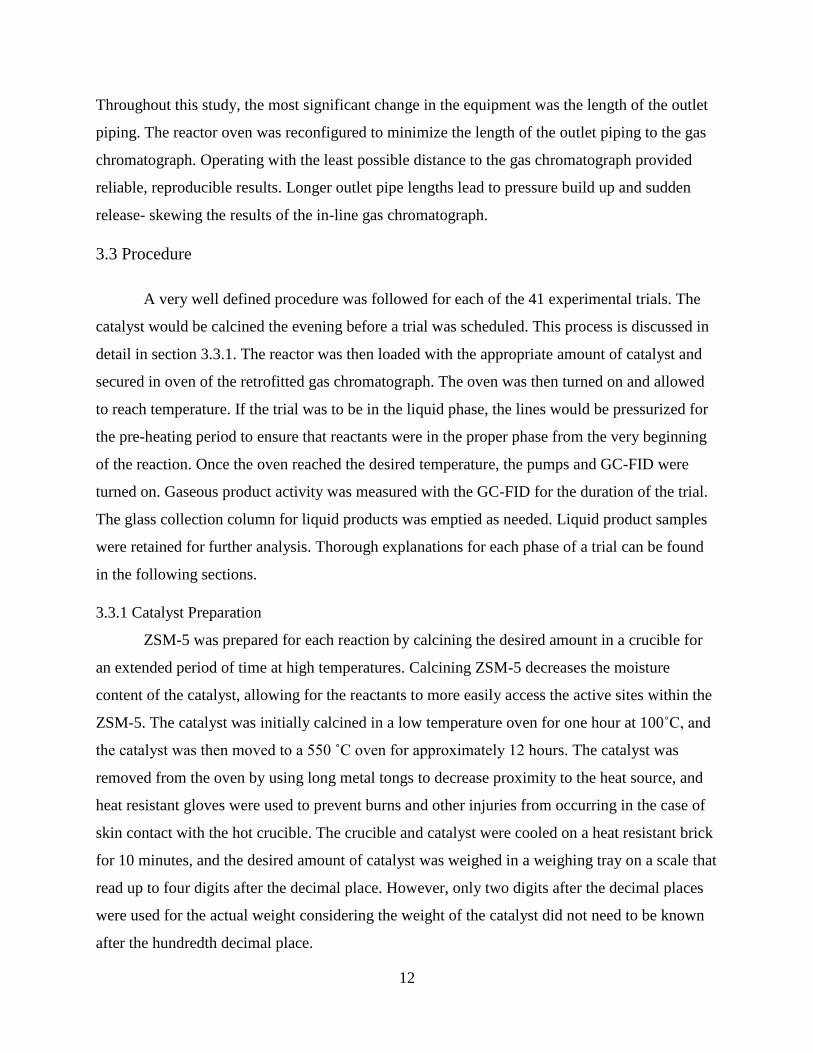
3.3.2 Reactor Assembly
Before connecting the reactor to the inlet feed line, a semi-porous metal frit was secured
on the outlet of the micro-reactor. The frit required modification in order to fit the reactor outlet.
A grinding tool with a fine tip was used in concert with a lathe to rotate and grind the edges of
the frit. Once the frit was fitted, the desired amount of catalyst was loaded into the micro-reactor
using a small plastic funnel and metal spatula. ZSM-5 is a light, powdery substance, so, when a
large amount of catalyst was needed, the catalyst was packed tightly in the reactor using a metal
rod. Once the reactor was loaded, the reactor was connected to the inlet and outlet piping of the
unit using a wrench. Below is a picture of the two reactors used for the reactions.
Figure 6: Micro reactors Used for Experiment
The smaller top reactor pictured was used for liquid phase runs and the bottom was used for gas
phase reactions. Different sized reactors were needed to accommodate different catalyst amounts
required to reach desired volume-hourly space velocities.
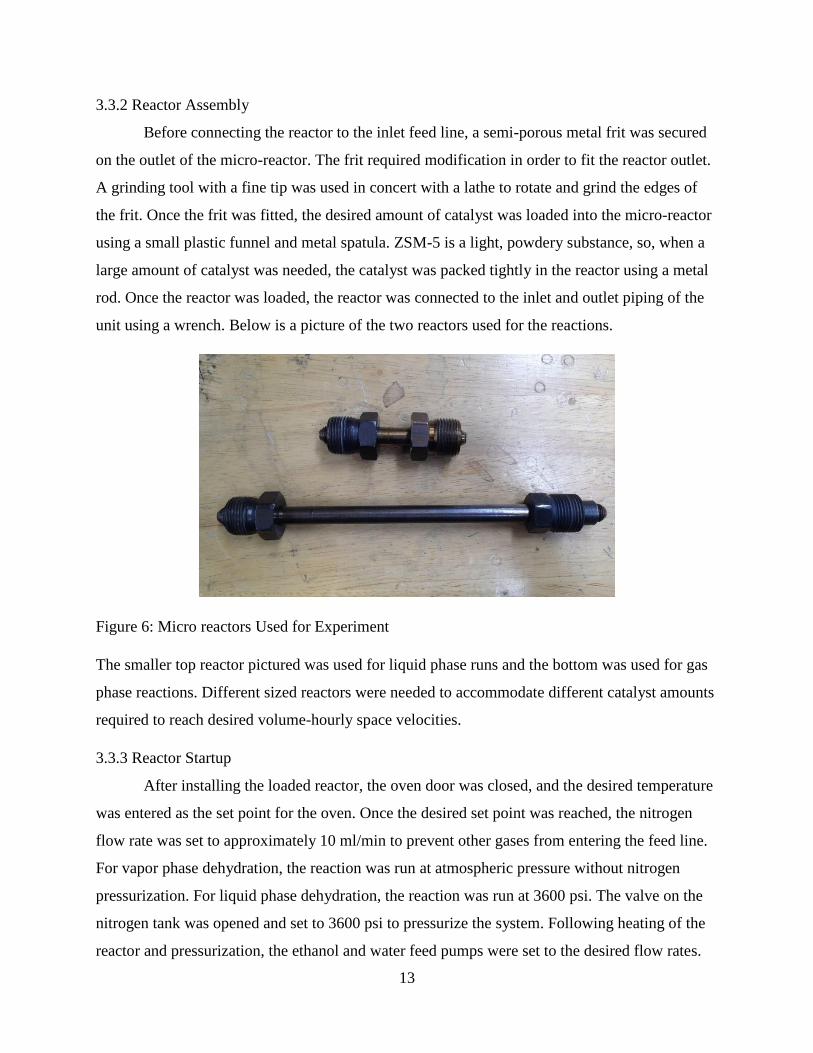
3.3.3 Reactor Startup
After installing the loaded reactor, the oven door was closed, and the desired temperature
was entered as the set point for the oven. Once the desired set point was reached, the nitrogen
flow rate was set to approximately 10 ml/min to prevent other gases from entering the feed line.
For vapor phase dehydration, the reaction was run at atmospheric pressure without nitrogen
pressurization. For liquid phase dehydration, the reaction was run at 3600 psi. The valve on the
nitrogen tank was opened and set to 3600 psi to pressurize the system. Following heating of the
reactor and pressurization, the ethanol and water feed pumps were set to the desired flow rates.

14
The pumps were connected to the mixer outside of the reactor which fed into the reactor inlet.
Below is a picture of the micro reactor in the oven attached to the inlet and outlet streams.
Figure 7: Micro reactor Installed in Oven
Special care was taken to ensure that the reactor was tightly secured to the inlet and outlet
blocks. A tight connection was needed to prevent reactants, zeolite and products from being lost
when the equipment was pressurized.
3.2 Gas Chromatograph Continuous Gaseous Product Analysis
Immediately after the feed pumps were turned on, the Gas Chromatograph FID (GC-
FID) analysis was initiated via a data collection software. To determine the identity and quantity
of gaseous species generated by the reaction, a gaseous sample was auto-injected and analyzed
every ten minutes from the reactor outlet stream. Figure 8 below shows a picture of the gas
chromatograph used.

15
Figure 8: Gas Chromatograph Equipment Used for Continuous and Batch Analysis
An intensity graph was generated for the gaseous products. Prior to running any experimental
trials, a calibration curve was created by injecting sample of known concentrations for analysis
with the same method used for in-line analysis. The same gas chromatograph was used for both
gaseous and liquid product analysis. Appendix B contains the method files for both the GC-FID
and GC-MS analyses.
3.3 Liquid Product Analysis
The reactor outlet was immediately followed by a glass column for product collection.
Outlet gas passed through the top of the column to the gas chromatograph while the liquid
sample was collected in the column. Glass beads of different diameters were used to reduce the
volume of the column to facilitate more consistent production rates. This collection column can
be seen below in Figure 9.

16
Figure 9: Glass Collection Column for Reactor Outlet
Liquid product samples were collected as the column filled. Special care was taken to ensure that
the glass column was not being emptied at the same time a gas sample was being auto-injected to
the GC-FID. Collection of liquid samples changed the pressure in the product line which could
cause an artificially low activity peak. The sample was collected in a graduated cylinder to
determine the volume. The sample was then weighed on a scale to determine the mass. The time
over which the sample was generated was recorded and used to determine the mass flow rate and
volume flow rate exiting the reactor.
Samples were collected and stored in a freezer until further analysis could be completed.
GC-MS was used to identify the components of the liquid product and GC-FID was used to
measure the quantity of each product. Samples were diluted for batch analysis. The dilutions
used can be seen in Figure 10 below:
Liquid
Product
Type
Solvent
Sample
Amount
(μL)
Solvent
Amount
(mL)
Polar Water 50 8
Non-Polar Dodecane 50 8
Figure 10: Liquid Product Dilution Table

17
Dodecane was used as the carrier solvent for non-polar sample analysis because there was an
insignificant amount of dodecane detected in a representative non-polar sample tested with the
GC-MS. Toluene was also evaluated as a potential solvent, but interfered with the products of
the reaction. When nonpolar samples were analyzed using dodecane, a large presence of toluene
was detected.
3.4 Variables Investigated
Throughout this study key variables were varied to determine their effect on ethylene
production. High temperature is needed to ensure that this endothermic reaction is
thermodynamically favorable. Pressure was used to manipulate the phase of the reaction. At high
temperature and pressure, the reaction proceeds in the liquid phase. At high temperatures and
atmospheric pressure, the reaction proceeds in the vapor phase. During the first phase of the
project, temperature, feed flowrate and feed ratio were constant. This phase involved reactor
design and proving that results were reliable and reproducible. In the second phase of the
investigation there were slight variations in temperature, catalyst mass and water was introduced
to the feed. The third, and most enlightening, phase of the study involved variation of volume-
hourly space velocity (VHSV) while catalyst amount, feed ratio and temperature were constant.
The following table shows the parameters of the trials involved in the third phase of this study.
Figure 11: Trial Parameters for Phase 3, Study of the Effects of VHSV
Run Number PhaseTemperature
(°C)
Operating
Pressure (PSI)
Catalyst
Amount (g)
Ethanol Feed
Flowrate
(mL/min)
Water Feed
Flowrate
(mL/min)
Feed Ratio VHSV
22 Vapor 390 14.7 1.6 0.05 0.025 0.66 20.17
23 Liquid 390 3600 0.02 1.5 0.75 0.66 24.35
24 Liquid 390 3600 0.02 0.75 0.375 0.66 12.17
25 Vapor 390 14.7 1.6 0.1 0.05 0.66 40.34
26 Liquid 390 3600 0.02 0.15 0.075 0.66 2.43
27 Vapor 390 14.7 1.6 0.5 0.25 0.66 201.7
28 Liquid 390 3600 0.02 0.3 0.15 0.66 4.87
29 Liquid 390 3600 0.02 1.5 0.75 0.66 24.35
30 Vapor 390 14.7 1.6 0.25 0.125 0.66 100.84
31 Liquid 390 3600 0.02 0.3 0.15 0.66 4.87
32 Liquid 390 3600 0.02 0.5 0.25 0.66 8.12
33 Liquid 390 3600 0.02 0.3 0.15 0.66 4.87
34 Vapor 390 14.7 1.6 0.05 0.025 0.66 20.17
35 Vapor 390 14.7 1.6 0.25 0.125 0.66 100.84
36 Vapor 390 14.7 1.6 0.35 0.18 0.66 141.18
37 Vapor 390 14.7 1.6 0.2 0.1 0.66 80.68
38 Vapor 390 14.7 1.6 0.15 0.77 0.66 60.51
39 Vapor 390 14.7 1.6 0.3 0.154 0.66 121.02
40 Liquid 390 3600 0.01 1.25 0.643 0.66 40.58
41 Liquid 390 3600 0.01 1.85 0.95 0.66 60.07

18
Catalyst amount and feed flowrates of both ethanol and water were varied in order to manipulate
VHSV throughout phase 3. Limitations were found with pump minimum flowrate as well as
minimum and maximum catalyst amounts. There was also a maximum ethanol flowrate based on
cost. Runs typically lasted upward of 300 minutes, using greater than 1.5 mL/min was not
feasible. The largest reactor available could hold a maximum of 1.6 grams of catalyst. A much
smaller reactor was used for liquid phase trials. A minimum catalyst amount of 0.02 grams was
needed to ensure that some sort of packed bed existed within the reactor. The highest liquid
phase VHSV achievable with 0.02 grams of catalyst and the maximum ethanol flowrate was
24.35. In order to reach higher VHSVs, catalyst amount was decreased to 0.01 grams and mixed
with 10 grams of sand.
3.5 Volume-Hourly Space Velocity
Volume-hourly space velocity (VHSV) was used as the basis to compare vapor and liquid
phase reactions. VHSV accounts for the difference in density between the two phases. With
ethanol, the difference between liquid phase and vapor phase density is 3 orders of magnitude.
Liquid phase density at 400°C is 0.91 g/mL, while vapor density is 0.000332 g/mL. Comparison
based on VHSV ensures that the same volume of reactant is encountering the same volume of
catalyst. VHSV is calculated with the following formula:
The volumetric flowrate of ethanol is divided by the volume of catalyst. VHSV provided an
accurate basis to compare differences between liquid and vapor phase ethanol dehydration.
3.6 Ethanol Conversion
A calibration curve was used to determine the amount of weight percent of ethanol
present in liquid product samples. From there the moles of unreacted ethanol, and therefor also
reacted moles of ethanol were found and compared to the moles of reactant that were fed into the
process over the sampling time. Conversion percent was calculated according to the following
formulas:

19
𝑃𝑒𝑎𝑘 𝐴𝑟𝑒𝑎 = 5136018.83 ∗ 𝐸𝑡ℎ𝑎𝑛𝑜𝑙 𝑊𝑒𝑖𝑔ℎ𝑡 𝑃𝑒𝑟𝑐𝑒𝑛𝑡 + 44344.32
𝐸𝑡ℎ𝑎𝑛𝑜𝑙 𝑀𝑜𝑙𝑒 𝑃𝑒𝑟𝑐𝑒𝑛𝑡 =
𝐸𝑡ℎ𝑎𝑛𝑜𝑙 𝑊𝑒𝑖𝑔ℎ𝑡 𝑃𝑒𝑟𝑐𝑒𝑛𝑡𝐸𝑡ℎ𝑎𝑛𝑜𝑙 𝑀𝑜𝑙𝑎𝑟 𝑀𝑎𝑠𝑠
𝐸𝑡ℎ𝑎𝑛𝑜𝑙 𝑊𝑒𝑖𝑔ℎ𝑡 𝑃𝑒𝑟𝑐𝑒𝑛𝑡𝐸𝑡ℎ𝑎𝑛𝑜𝑙 𝑚𝑜𝑙𝑎𝑟 𝑀𝑎𝑠𝑠
+100 − 𝐸𝑡ℎ𝑎𝑛𝑜𝑙 𝑊𝑒𝑖𝑔ℎ𝑡 𝑃𝑒𝑟𝑐𝑒𝑛𝑡
𝑊𝑎𝑡𝑒𝑟 𝑀𝑜𝑙𝑎𝑟 𝑀𝑎𝑠𝑠
𝐶𝑜𝑛𝑣𝑒𝑟𝑠𝑖𝑜𝑛 = 100 − (100 ∗ 𝐸𝑡ℎ𝑎𝑛𝑜𝑙 𝑀𝑜𝑙𝑒 𝑃𝑒𝑟𝑐𝑒𝑛𝑡)
An important assumption made for this calculation is that the liquid products consist only of
water and ethanol. This assumption is valid when there is very little ethanol detected in the liquid
product sample. For a true conversion value, all liquid products would need to be factored into
the denominator of the mole percent calculation.
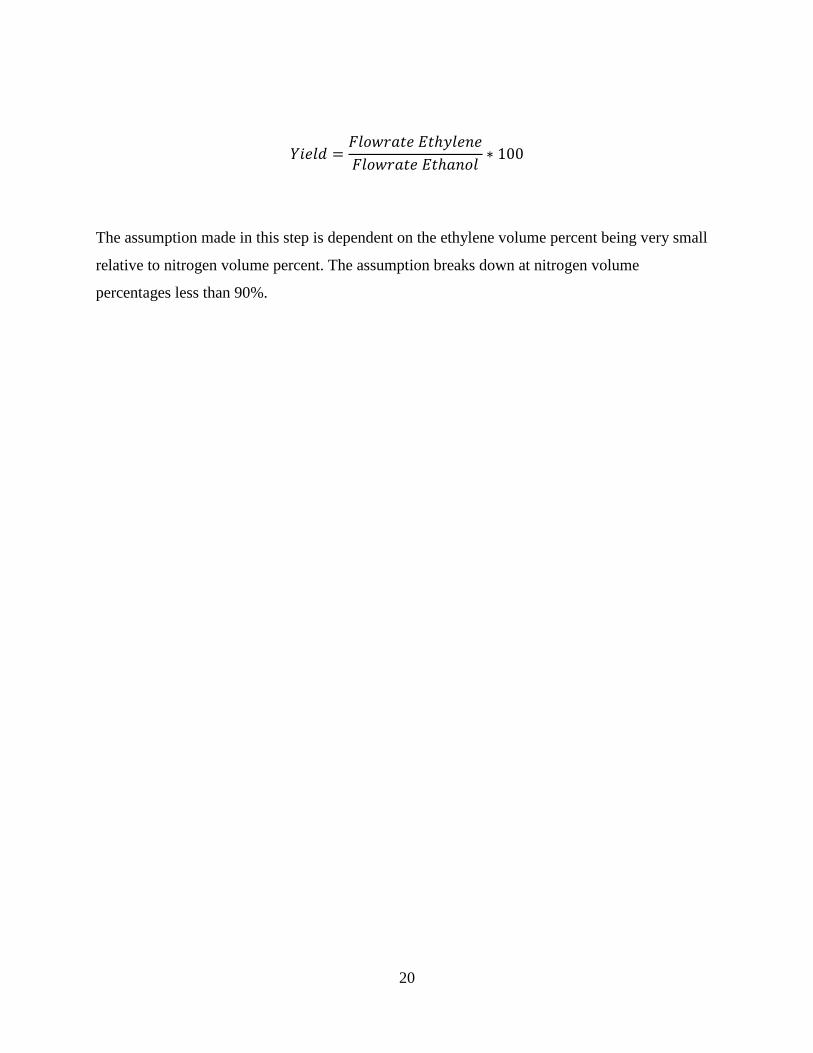
3.6 Ethylene Yield
Ethylene yield was also calculated based on quantity of ethylene determined through the
use of a calibration curve. Volume percent of ethylene was found. It was assumed that the
remaining volume in the sample loop was filled with nitrogen, the carrier gas. From this
information, flowrate of ethylene was found in milliliters per minute and then converted to moles
per minute. The molar flowrate of ethylene was then divided by the molar flowrate of ethanol to
determine yield. The following series of formulas were used for this calculation:
𝑃𝑒𝑎𝑘 𝐴𝑟𝑒𝑎 = 4330218.9 ∗ 𝐸𝑡ℎ𝑦𝑙𝑒𝑛𝑒 𝑉𝑜𝑙𝑢𝑚𝑒 − 5414486.67
𝑉𝑜𝑙𝑢𝑚𝑒 % 𝐸𝑡𝑦𝑙𝑒𝑛𝑒 =𝐸𝑡ℎ𝑦𝑙𝑒𝑛𝑒 𝑉𝑜𝑙𝑢𝑚𝑒
𝑆𝑎𝑚𝑝𝑙𝑒 𝐿𝑜𝑜𝑝 𝑉𝑜𝑙𝑢𝑚𝑒
𝑉𝑜𝑙𝑢𝑚𝑒 % 𝑁𝑖𝑡𝑟𝑜𝑔𝑒𝑛 = 1 − 𝑉𝑜𝑙𝑢𝑚𝑒 % 𝐸𝑡ℎ𝑦𝑙𝑒𝑛𝑒
𝐹𝑙𝑜𝑤𝑟𝑎𝑡𝑒 𝐸𝑡ℎ𝑦𝑙𝑒𝑛𝑒 =𝑁𝑖𝑡𝑟𝑜𝑔𝑒𝑛 𝐹𝑙𝑜𝑤𝑟𝑎𝑡𝑒 − (𝑉𝑜𝑙𝑢𝑚𝑒 % 𝑁𝑖𝑡𝑟𝑜𝑔𝑒𝑛 ∗ 𝑁𝑖𝑡𝑟𝑜𝑔𝑒𝑛 𝐹𝑙𝑜𝑤𝑟𝑎𝑡𝑒)
𝑉𝑜𝑙𝑢𝑚𝑒 % 𝑁𝑖𝑡𝑟𝑜𝑔𝑒𝑛
20
𝑌𝑖𝑒𝑙𝑑 =𝐹𝑙𝑜𝑤𝑟𝑎𝑡𝑒 𝐸𝑡ℎ𝑦𝑙𝑒𝑛𝑒
𝐹𝑙𝑜𝑤𝑟𝑎𝑡𝑒 𝐸𝑡ℎ𝑎𝑛𝑜𝑙∗ 100
The assumption made in this step is dependent on the ethylene volume percent being very small
relative to nitrogen volume percent. The assumption breaks down at nitrogen volume
percentages less than 90%.
21
Chapter 4: Results
This portion of the report will detail the results of extensive data analysis. All
experimental runs contributed to the learning outcomes of this study, however the final 12 trials
were the most illuminating. The following sections on yield, selectivity and throughput focus
heavily on the last 12 trials where VHSV became a basis for comparison.
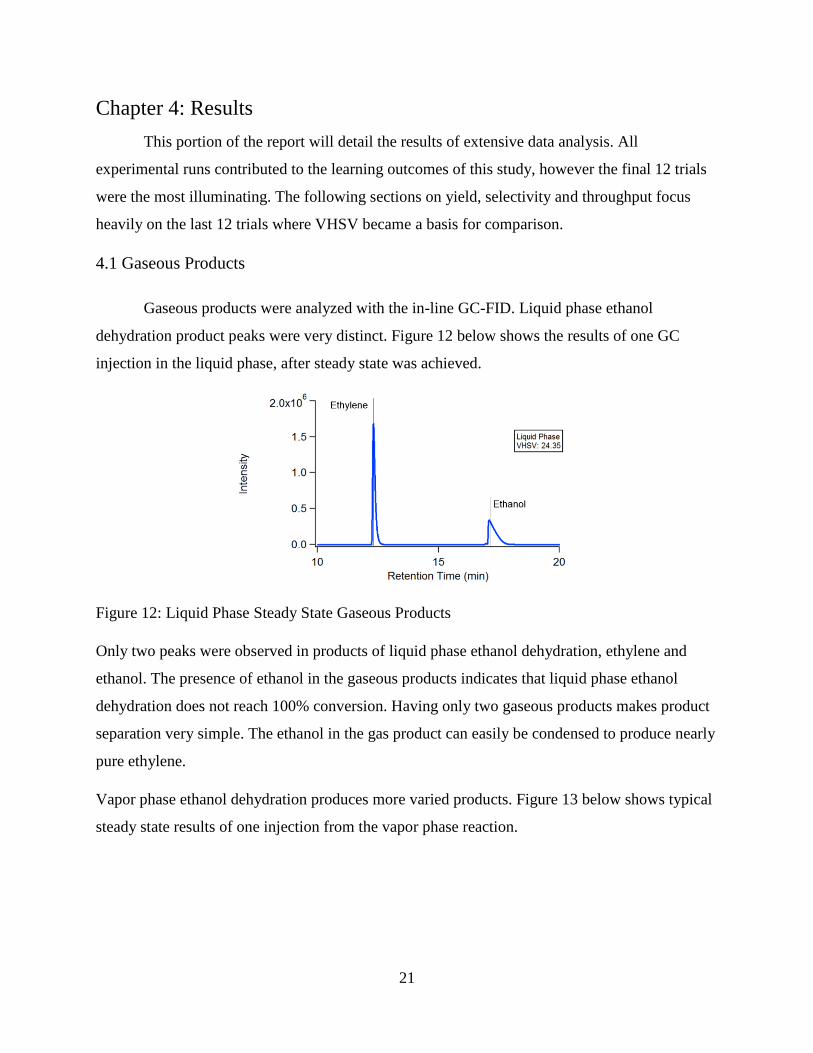
4.1 Gaseous Products
Gaseous products were analyzed with the in-line GC-FID. Liquid phase ethanol
dehydration product peaks were very distinct. Figure 12 below shows the results of one GC
injection in the liquid phase, after steady state was achieved.
Figure 12: Liquid Phase Steady State Gaseous Products
Only two peaks were observed in products of liquid phase ethanol dehydration, ethylene and
ethanol. The presence of ethanol in the gaseous products indicates that liquid phase ethanol
dehydration does not reach 100% conversion. Having only two gaseous products makes product
separation very simple. The ethanol in the gas product can easily be condensed to produce nearly
pure ethylene.
Vapor phase ethanol dehydration produces more varied products. Figure 13 below shows typical
steady state results of one injection from the vapor phase reaction.

22
Figure 13: Vapor Phase Steady State Gaseous Products
Vapor phase ethanol dehydration produces various carbon volatiles at low VHSVs. The most
abundant product is butylene. For this study ethylene was the product of interest. The reaction
would not be run this slowly under vapor phase conditions industrially to produce ethylene.
Higher carbon volatiles are present because of the long amount of time it takes for the reactant to
proceed through the packed bed reactor. The non-distinct peak after a retention time of 13
minutes contains products that could not be identified with the GC-FID method that was used.
The peaks colluded making it difficult to definitively identify the additional products. Another
feature to note is the absence of an ethanol peak. Vapor phase ethanol dehydration showed very
high conversion, so much so that ethanol was not detected in the gaseous product.
Liquid phase ethanol dehydration at the VHSVs studied shows a clear advantage. The
overlay below illustrates the differences between the phases very clearly.
Figure 14: Overlay of Steady State Gaseous Products

23
It is clear that liquid phase ethanol dehydration, under these conditions, produces much greater
amount of ethylene. Vapor phase ethanol dehydration produces a more varied product set. While
the peaks labelled “Higher Carbon Volatiles” could not be identified, with gas chromatography
compounds that have a greater molar mass have a longer retention time. Compounds with similar
molar masses produce a peak at similar times. All of the products from vapor phase ethanol
dehydration are observed from 2-3.5 minutes. This suggests that all products have a relatively
similar molar mass and would not be easily separated. Liquid phase generates more ethylene.
Liquid phase ethanol dehydration is also more selective toward ethylene production versus
higher carbon volatiles.
4.2 Liquid Products
Liquid products were also collected from all runs. Similar to gas products, liquid and
vapor phase reactions produced different liquid products. Liquid phase ethanol dehydration
produced a homogenous solution largely consisting butanol, ethanol and water. GC-MS was used
to identify the components of the liquid products and then GC-FID was used for each sample to
determine conversion of ethanol and yield of butanol. Figure 15 below shows the GC-MS
identification of liquid products.
Figure 15: GC-MS Identification of Liquid Products
GC-MS identified the first peak as ethanol with a similarity of 95, and the second peak as
butanol with a similarity of 88. The column and method used for the GC-MS were not able to
fully separate ethanol and butanol. GC-FID was more appropriate to separate and determine the

24
amounts of each component. A representative GC-FID analysis of the liquid product is shown
below in Figure 16.
Figure 16: GC-FID Analysis of Liquid Products
Both the injections analyzed in Figure 15 and 16 are from the same liquid sample. GC-FID was
able to separate the components and produce distinct peaks that could then be used for further
analysis.
Vapor phase reactions produced the same homogeneous polar mixture with an oil layer at the
top. A typical sample from vapor phase ethanol dehydration is shown below in Figure 17.
Figure 17: Typical Liquid Product from Vapor Phase Ethanol Dehydration
More oil was produced during the early phase of the reaction. As the reaction proceeded, less oil
was produced. Samples collected at the end of vapor phase trials did not have an oil component.
This suggests that pathway for oil production is blocked as the reaction proceeds and the zeolite
lattice changes. Oil samples were analyzed with GC-MS producing the following results shown
below in Figure 18.

25
Figure 18: Oil Sample GC-MS Analysis
The non-polar, oily component of the liquid products from vapor phase ethanol dehydration are
largely a mix different benzene aromatics. Dodecane was selected as the solvent for GC-MS
testing as it did not interfere with the majority of product peaks generated.
4.3 Reaction Activity
Reaction activity patterns varied between the gas and liquid phase reactions. Eventually,
reactions in both phases would reach steady state.
4.3.1 Liquid Phase Ethanol Dehydration Reaction Activity
Liquid phase reactions generally followed a distinct pattern. Figure 19 below shows a
typical example of a liquid phase reaction.
Figure 19: Typical Liquid Phase Reaction Activity from In-Line GC-FID
Liquid phase reactions typically exhibited a short ramp up period, followed by a spike in activity
and then decline. The sharp decline is then followed by another ramp up period resulting in
steady state. The above intensity graph was generated from a trial with a VHSV of 8. The

26
patterns observed in reaction activity are more apparent in trials at slower VHSVs. Figure 20
below shows the GC-FID results for a reaction at a VHSV triple that in Figure 19.
Figure 20: Liquid Phase Reaction with VHSV of 24.35
The pattern described above is not seen at faster VHSVs. It is likely that the reaction proceeds in
a similar fashion, but the GC injections are not frequent enough to capture data points to
illustrate the pattern. Timing between GC injections is dependent upon the compounds being
measured. With the column and method used for this study ethylene peaks are observed between
2.3 and 2.6 minutes. Ethanol peaks are seen in the 7 minute range. To observe the pattern at
faster VHSVs a different method of analysis or type of equipment would be needed.
4.3.2 Vapor Phase Ethanol Dehydration Reaction Activity
Vapor phase ethanol dehydration did not exhibit a reliable pattern of activity. No
products were detected for a long period of time and then a quick ramp up would occur leading
to a period of high activity, followed by relatively steady state. The period of time before
products were detected was a direct result of the flowrates of the reactants and VHSV. Figure 21
below shows how VHSV effected product detection.

27
Figure 21: Vapor Phase Reaction Activity from In-Line GC-FID
At low VHSVs, products were not detectable for an extended period of time. The reactants took
a long time to move through the packed bed reactor- as the trials were run at atmospheric
pressure. This extended period of time without products is non-ideal for an industrial setting.
VHSV greatly affected this amount of time. VHSV also contributed to the gross amount of
products generated. While higher VHSVs produced generated more products sooner after start-
up these results may not be viable for industry. Intensity charts for all trials involved in the
VHSV comparison can be found in Appendix E.
4.3.3 Steady State
Steady state was reached in most experimental trials. For the purposes of this project,
steady state was defined as 60 minutes where the major products peak intensity varied by less
than 10%. Liquid phase ethanol dehydration consistently exceeded this definition. Steady state
lasted significantly longer than 60 minutes for many liquid phase trials. This definition had to be
expanded for vapor phase trials. Especially at lower VHSVs, products were not consistent. If
there was not a clear period of steady state production, a representative portion of the data set
was used. Once a steady state region or representative data set was identified, peak area for each
product was averaged. This average peak area was then used for further analysis.

28
4.4 Conversion
Both liquid and vapor phase ethanol dehydration showed very high conversion rates.
Conversion was calculated based on liquid product analysis. Liquid product samples were
collected periodically throughout a trial. Each sample underwent GC-FID analysis, results from
all sample for each trial were averaged to determine total conversion. Figure 22 below shows
average ethanol conversion from each trial of both liquid and vapor phase ethanol dehydration.
Figure 22: Ethanol Conversion
Vapor phase consistently showed 100% ethanol conversion at all VHSVs. Liquid phase reactions
also showed very high conversion, typically between 95 and 98 percent. Raw data for conversion
calculation can be found in Appendix G.
4.5 Yield
From the average steady state peak area, yield was calculated. A calibration curve was
generated for ethylene, butanol, and ethanol. The calibration curves for each of these can be seen
found in Appendix C. From the calibration curve, the amount of each product was determined.
The amount of product could then be used to calculated yield. The raw data for yield calculation
can be found in Appendix G: Raw Data. When plotted against VHSV, ethylene yield follows a
distinct trend. This can be seen below in Figure 23:
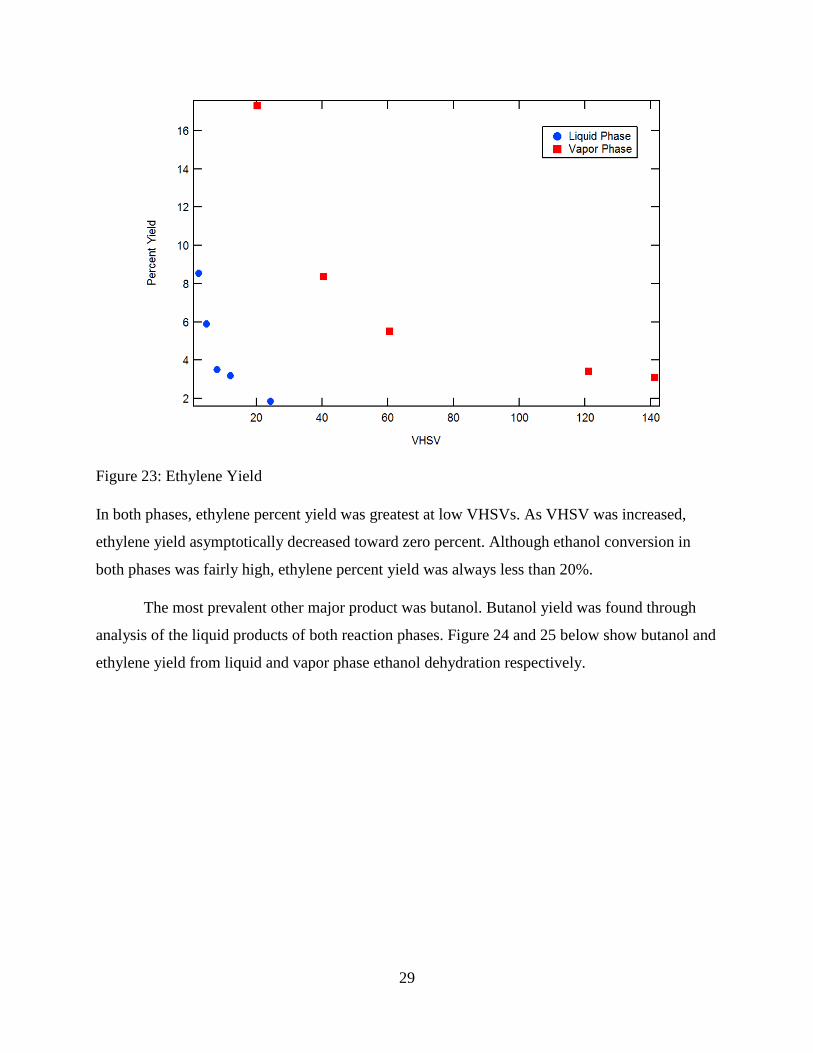
29
Figure 23: Ethylene Yield
In both phases, ethylene percent yield was greatest at low VHSVs. As VHSV was increased,
ethylene yield asymptotically decreased toward zero percent. Although ethanol conversion in
both phases was fairly high, ethylene percent yield was always less than 20%.
The most prevalent other major product was butanol. Butanol yield was found through
analysis of the liquid products of both reaction phases. Figure 24 and 25 below show butanol and
ethylene yield from liquid and vapor phase ethanol dehydration respectively.

30
Figure 24: Liquid Phase Product Yield
Figure 25: Vapor Phase Product Yield
0
10
20
30
40
50
60
70
80
90
100
2 5 12 24
Per
cen
t Yi
eld
VHSV
Ethylene Yield
Butanol Yield
0
10
20
30
40
50
60
70
80
90
100
20 40 61 121 141
Per
cen
t Yi
eld
VHSV
Ethylene Yield
Butanol Yield
31
Liquid phase ethanol dehydration produces considerably more butanol than ethylene. Butanol
yield increases with VHSV as ethylene yield decreases. A different phenomena is observed in
vapor phase ethanol dehydration. Butanol yield decreases along with ethylene yield as VHSV
increases. At VHSVs above 50, butanol is not observed as a product. Vapor phase total product
yield is notably less than that of liquid phase ethanol dehydration. The additional products are
higher carbon volatiles as discussed above. Those peaks could not be separated well or
identified, therefor no yield data is available for the additional gaseous products.
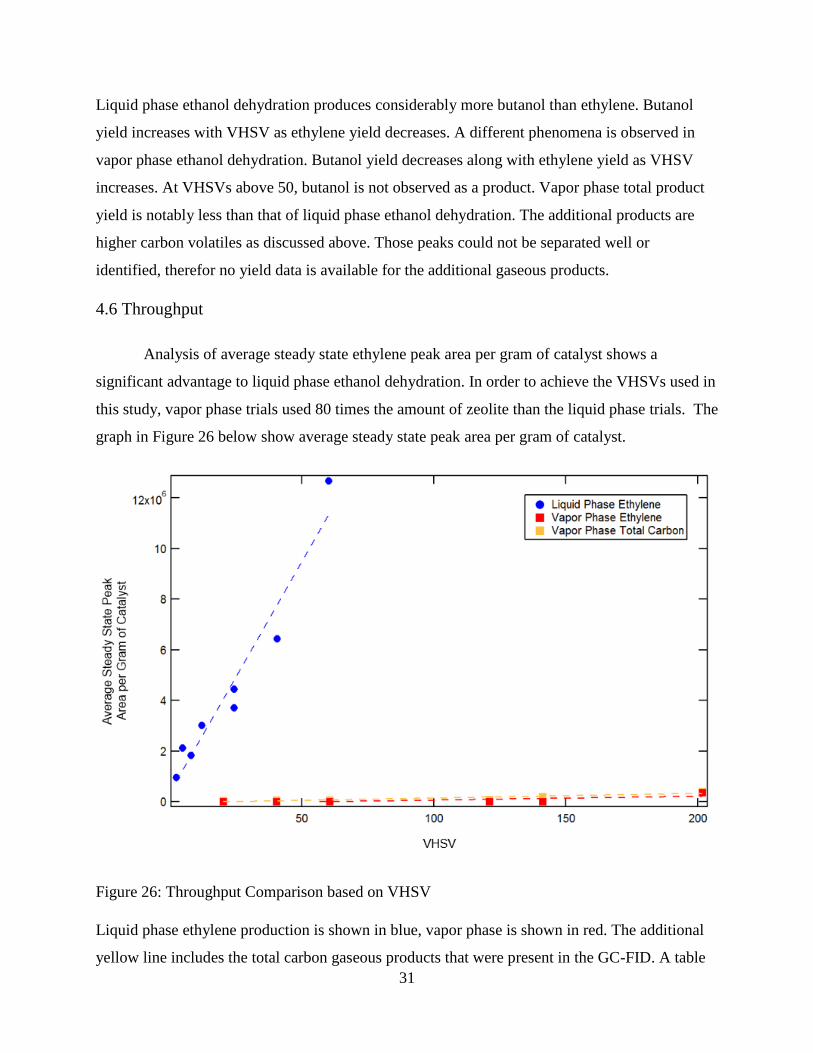
4.6 Throughput
Analysis of average steady state ethylene peak area per gram of catalyst shows a
significant advantage to liquid phase ethanol dehydration. In order to achieve the VHSVs used in
this study, vapor phase trials used 80 times the amount of zeolite than the liquid phase trials. The
graph in Figure 26 below show average steady state peak area per gram of catalyst.
Figure 26: Throughput Comparison based on VHSV
Liquid phase ethylene production is shown in blue, vapor phase is shown in red. The additional
yellow line includes the total carbon gaseous products that were present in the GC-FID. A table

32
in Appendix G: Raw Data. At the flowrates/VHSVs studied, liquid phase ethanol dehydration
produces a significantly greater amount of ethylene. Even when considering the higher carbon
volatiles, liquid phase ethanol dehydration produces more products.
Revisiting the idea of VHSV versus WHSV, liquid phase ethanol dehydration also shows
a throughput advantage when WHSV is used as the basis for comparison. Figure 27 below show
yield percent per gram of catalyst compared on the basis of VHSV and WHSV.
Figure 27: WHSV and VHSV Comparison
When ethanol dehydration in both liquid and vapor phase are compared based on mass flowrate,
liquid phase reactions show a significant advantage. More ethanol is being fed into the reaction,
producing more ethylene, using less catalyst.
33
Chapter 5: Conclusions and Recommendations
5.1 Conclusions
From the data analysis discussed above, conclusions can be drawn about the advantages
of liquid phase ethanol dehydration.
1. Liquid phase ethanol dehydration shows comparable conversion to the vapor phase.
An insignificant amount of ethanol is found in the gaseous products and virtually no
ethanol is found in the liquid products.
2. At low volume hourly space velocities, liquid phase ethanol dehydration produces
more ethylene and butanol than vapor phase reactions. Liquid phase ethanol
dehydration also produces a large amount of butanol.
3. On a per gram of catalyst basis, liquid phase ethanol dehydration shows a massive
advantage in ethylene production over vapor phase reactions.
The conclusions reached by this study have great industrial potential. Liquid phase ethanol
dehydration can address some of the challenges presented by traditional, vapor phase bio-ethanol
dehydration.
5.1.1 Industrial Considerations
Liquid phase ethanol dehydration has many industrial advantages over vapor phase
ethanol dehydration that is current common practice. The one major disadvantage is that in order
to operate in the liquid phase, the reactor must be run at very high pressures (2800-3600 psi).
High pressure operations presents a safety issue. Equipment must be designed to handle the
pressure and additional safety measures must be taken. Operators require additional training, and
personal protective equipment and shields must be provided. However, once the initial capital
investment is made for safety equipment, running at high pressure and 390°C is more cost
effective than running at the very high temperature that Braskem does.
The industrial advantages of liquid phase ethanol dehydration arguably outweigh the
disadvantages. Liquid phase ethanol dehydration yields very good results with a feed that is not
100 percent ethanol. Often the broth from the fermentation process that produces bio-ethanol is a
“wet” broth, meaning it has high water content. Before traditional vapor phase catalytic
dehydration can occur, the broth needs to be dried substantially, removing most of the water.
34
This study has shown that at a 2:1 ethanol to water feed ratio liquid phase dehydration produces
a large amount of ethylene. In industry, use of liquid phase dehydration would eliminate the need
for equipment and process steps associated with drying the fermentation broth. Elimination of
this step is also a time saving measure.
The reduced amount of catalyst needed to operate at low volume hourly space velocities
is also attractive to industry. The liquid phase reactions in this study used 80 times less catalyst
than the vapor phase runs. The catalyst is destroyed throughout the reaction, so using less
catalyst to begin with presents a cost advantage. Reactor size can also be reduced to
accommodate the smaller packed bed size needed.
Additionally, liquid phase ethanol dehydration products are more easily separated than
those of vapor phase. Fewer products are produced to begin with. Upon exiting the reactor,
separation naturally occurs between liquid and gaseous products. The only products detected in
the gas phase are ethylene and ethanol. At atmospheric pressure, the difference in boiling point
between ethylene and ethanol is nearly 200°C (-103.7°C and 78.4°C respectively). A large
difference in boiling point allows for easy separation. Vapor phase ethanol dehydration produces
many gas phase products with similar molecular weights. The molecular weights of the
compounds referred throughout this report as “higher carbon volatiles” are so similar that they
could not be separated by a gas chromatograph specifically designed for separation. The products
from vapor phase ethanol dehydration require several separation steps to isolate ethylene, the
desired product.
5.2 Recommendations for Further Study
Further investigation of a greater range of volume-hourly space velocities for ethanol
dehydration in both liquid and vapor phase would make the evidence more compelling. In this
study, experimental limitations were found with pump flowrate minimums and maximums and
reactor size. The cost of ethanol also became cost prohibitive at higher flowrates. Further
development of a GC-FID method capable of separating the gaseous products from vapor phase
ethanol dehydration would also be useful. Identification and quantification of those products
would close the carbon balance and allow for a better understanding of the reaction. Additional
calibration curves would also need to be created for this further analysis.

35
Acknowledgements
The project team thanks Professor Michael Timko, our advisor, for his constant encouragement
and ability to direct us in this project. Additionally, we would like to thank Alex Maag, a
chemical engineering PhD Candidate, for the countless hours of assistance inside the laboratory
and for the support with research and data analysis outside of the laboratory.

36
References
Brazilian Sugarcane Industry Association. Sugarcane Producing Regions in Brazil. Unica, n.d.
Web. 28 Sept. 2015. <http://english.unica.com.br/production-map/>.
Cameron, G., Le, L., Levine, J., & Nagulapalli, N. (2012, April 1). Process Design for the
Production of Ethylene from Ethanol. Retrieved November 9, 2015, from
http://repository.upenn.edu/cgi/viewcontent.cgi?article=1036&context=cbe_sdr
Chen, Yu, Zhen Chen, Yulong Wu, Ling Tao, Bin Dai, Mingde Yang, and Xiaoyan Zhu. 2010.
Dehydration reaction of bio-ethanol to ethylene over modified SAPO catalysts.Journal of
Industrial and Engineering Chemistry 16 (5): 717-22.
Fan, Denise, Der-Jong Dai, and Ho-Shing Wu. "Ethylene Formation by Catalytic Dehydration of
Ethanol with Industrial Considerations." Materials 6 (2013): 101-15. Web.
Fogler, H. Scott. Elements of Chemical Reaction Engineering. 4th ed. Upper Saddle River, NJ:
Prentice Hall PTR, 2005. Print. p.645-755
Haro, P., P. Ollero, and F. Trippe. "Technoeconomic Assessment of Potential Processes for Bio-
Ethylene Production." Fuel Processing Technology 114 (2013): 35-48. Web.
Lisensky, George. 2010. “Preparation of Zeolite ZSM5 and Catalysis of Xylene Isomerization”
University of Wisconsin-Madison MRSEC Education Group. 2010. Web. 13 Nov 2015.
http://education.mrsec.wisc.edu/nanolab/zeolite/
Luiz, Paulo, Augusto Morita, Luis F. Cassinelli, Antonio Morschbacker, and Roberto Werneck
Do Carmo. "Braskem's Ethanol to Polyethylene Process Development." Catalytic
Process Development for Renewable Materials 1 (2013): 149-65. Web.
Phillips, Cory B., and Ravindra Datta. "Production of Ethylene from Hydrous Ethanol on H-
ZSM-5 under Mild Conditions." Industrial & Engineering Chemistry Research 36
(1997): 4466-475. - Industrial & Engineering Chemistry Research (ACS Publications).
Web. 18 Jan. 2016. <http://pubs.acs.org/doi/pdf/10.1021/ie9702542>.
Plant Bottle Frequently Asked Questions. The Coca-Cola Company- Plant Bottle FAQ. N.p., n.d.
Web. 28 Sept. 2015. <http://www.coca-colacompany.com/plantbottle-
technology/plantbottle-frequently-asked-questions#TCCC>.

37
Ravenelle, Ryan M., Florian Schübler, Andrew Damico, Nadiya Danilina, Jeroen A. Van
Bokhoven, Johannes A. Lercher, Christopher W. Jones, and Carsten Sievers. 2010.
Stability of Zeolites in Hot Liquid Water. Journal of Physical Chemistry C 114 (46):
19582-95.
Sadaba, Irantzu, Manuel Lopez Granados, Anders Riisager, and Esben Taarning. "Deactivation
of Solid Catalysts in Liquid Media: The Case of Leaching of Active Sites in Biomass
Conversion Reactions." Green Chemistry 17.8 (2015): 4133-145. Publishing: Journals,
Books, and Databases. Web.
<http://pubs.rsc.org/en/Content/ArticleLanding/2015/GC/C5GC00804B#!divAbstract>.
What is Catalysis? North American Catalysis Society. February, 2008. Web. 26 Mar. 2016.
http://nacatsoc.org/above/what-is-catalysis/
What is throughput? Business Dictionary. 2016. Web. 20 Mar 2016.
http://www.businessdictionary.com/definition/throughput.html
Williams, J. (2010, February 1). Bioplastics: Renewable Materials Factsheet. Retrieved
November 9, 2015, from http://www.nnfcc.co.uk/publications/nnfcc-renewable-
polymers-factsheet-bioplastics
Zeolites. Chemistry Explained: Foundations and Applications. 2016. Web. 26 Mar 2016.
http://www.chemistryexplained.com/Va-Z/Zeolites.html
Zhang, Xian, Rijie Wang, Xiaoxia Yang, and Fengbao Zhang. "Comparison of Four Catalysts in
the Catalytic Dehydration of Ethanol to Ethylene." Microporous and Mesoporous
Materials 116.1-3 (2008): 210-15. Science Direct. Web. 28 Sept. 2015.
<http://www.sciencedirect.com/science/article/pii/S1387181108001819>.
38
Appendix A: Zeolite ZSM-5 Material Safety Data Sheet

39

40
Appendix B: Gas Chromatograph Methods
Figure 28: GC-FID In-Line Method for Gaseous Product Analysis
1.0 μL
0
0
1
High
0.2 sec
High
High
Normal
250°C
Split
1.00 min
Pressure
11.1 psi
13.0 mL/min
1.67 mL/min
33.1 cm/sec
3.0 mL/min
5
Rt-U-BOND
0.10 μm
30.0 m
0.32 mm
130°C
0.5 min
Rate Temperature Hold Time
- 130 410.00
250°C
40 msec
410 min
0.00 min
None
Makeup
Rate Flow Hold Time
- 30 0.00
Stop Time
Delay Time
Subtract Detector
Column Oven Temperature Program
Flow Program
Temperature
Equilibrium Time
Column Oven Temperature Program
FID1
Temperature
Sampling Rate
Split Ratio
Column Name
Film Thickness
Length
Inner Diameter
Column
Flow Control Mode
Pressure
Total Flow
Column Flow
Linear Velocity
Purge Flow
Syring Injection Speed
Injection Mode
SPL2
Temperature
Injection Mode
Sampling Time
GC-FID Gaseous Product Analysis Method
AOC-20i
Injection Volume
# of Rinses with Solvent (Pre-run)
# of Rinses with Solvent (Post-run)
# of Rinses with Sample
Plunger Speed (Suction)
Viscosity Comp. Time
Plunger Speed (Injection)
41
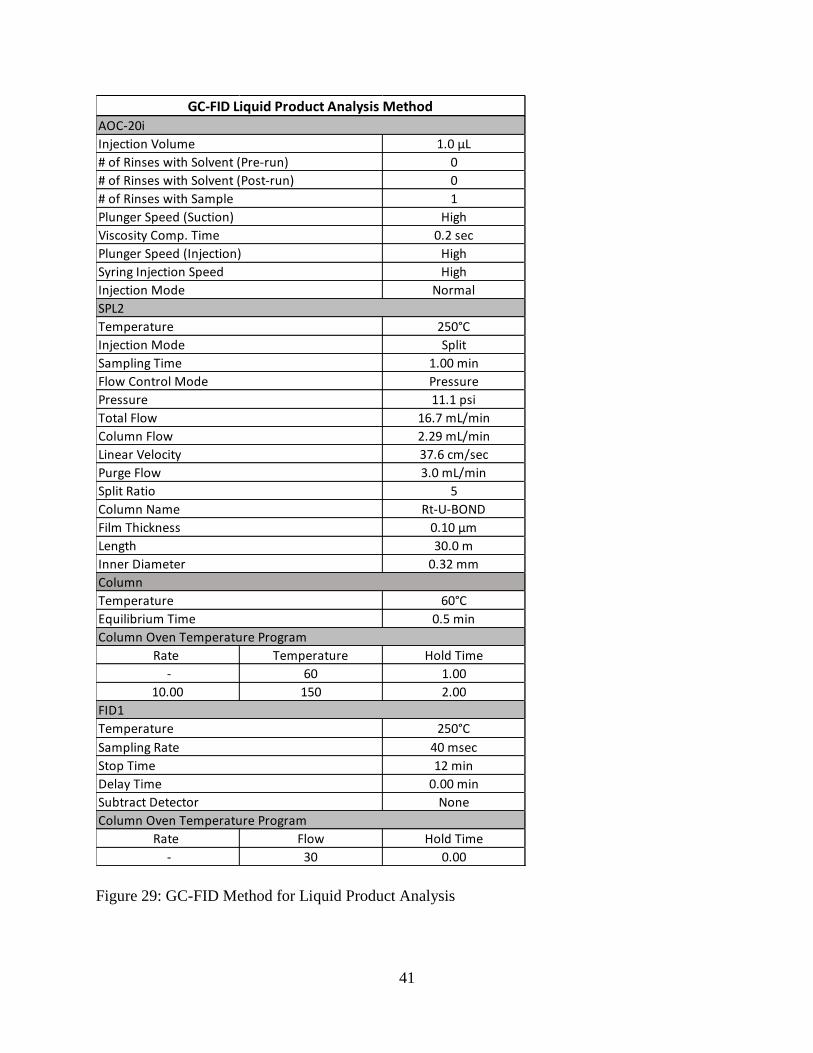
Figure 29: GC-FID Method for Liquid Product Analysis
1.0 μL
0
0
1
High
0.2 sec
High
High
Normal
250°C
Split
1.00 min
Pressure
11.1 psi
16.7 mL/min
2.29 mL/min
37.6 cm/sec
3.0 mL/min
5
Rt-U-BOND
0.10 μm
30.0 m
0.32 mm
60°C
0.5 min
Rate Temperature Hold Time
- 60 1.00
10.00 150 2.00
250°C
40 msec
12 min
0.00 min
None
Rate Flow Hold Time
- 30 0.00
Column Oven Temperature Program
Delay Time
Subtract Detector
Injection Volume
Sampling Time
Column
Equilibrium Time
Temperature
Inner Diameter
Column Oven Temperature Program
FID1
Temperature
Sampling Rate
Stop Time
Linear Velocity
Purge Flow
Split Ratio
Column Name
Film Thickness
Length
Injection Mode
Flow Control Mode
Pressure
Total Flow
Column Flow
Viscosity Comp. Time
Plunger Speed (Injection)
Syring Injection Speed
Injection Mode
SPL2
Temperature
GC-FID Liquid Product Analysis Method
AOC-20i
# of Rinses with Solvent (Pre-run)
# of Rinses with Solvent (Post-run)
# of Rinses with Sample
Plunger Speed (Suction)

42
Figure 30: GC-MS Method for Compound Identification
0
1
2
High
0.2 sec
High
High
0: Normal
40°C
90°C
Split
Linear Velocity
21 psi
9.0 mL/min
2.66 mL/min
58.8 cm/sec
1.0 mL/min
2
SHRXI-5MS
0.25 μm
30.0 m
0.25 mm
Rate Final Temp Hold Time
- 40 1.00
2.00 60 0.00
230°C
75°C
0.1 min
0
11 min
Interface Temp
Solvent Cut Time
Micro Scan Width
GC Program Time
Thickness
Length
Diameter
GC Program
MS
Ion Source Temp
Total Flow
Column Flow
Linear Velocity
Purge Flow
Split Ratio
Column Name
Syring Injection Speed
Column Oven Temp
Injection Temp
Injection Mode
Row Control Mode
Pressure
GC-Mass Spectrometer Method for Compound IdentificationSampler
GC
Injection Mode
# of Rinses with Solvent (Pre-run)
# of Rinses with Solvent (Post-run)
# of Rinses with Sample
Plunger Speed (Suction)
Viscosity Comp. Time
Plunger Speed (Injection)

43
Appendix C: Gas Chromatograph Calibration Curves
Figure 31: Ethylene Calibration Curve
Figure 32: Ethanol Calibration Curve

44
Figure 33: Butanol Calibration Curve
The butanol calibration curve was provided by another Worcester Polytechnic Institute project
team studying butanol extraction. The butanol extraction team members are Allison Rivard,
Chelsea Conlon, Mark Overdevest and David Knutson advised by Professor Thompsett.
y = 6E+06x + 118225R² = 0.9942
y = 9E+06x - 1E+06R² = 0.9847
-5.00E+06
0.00E+00
5.00E+06
1.00E+07
1.50E+07
2.00E+07
2.50E+07
3.00E+07
3.50E+07
0 0.5 1 1.5 2 2.5 3 3.5 4
Pea
k A
rea
(mV.
s)
Concentration (wt% butanol in water)
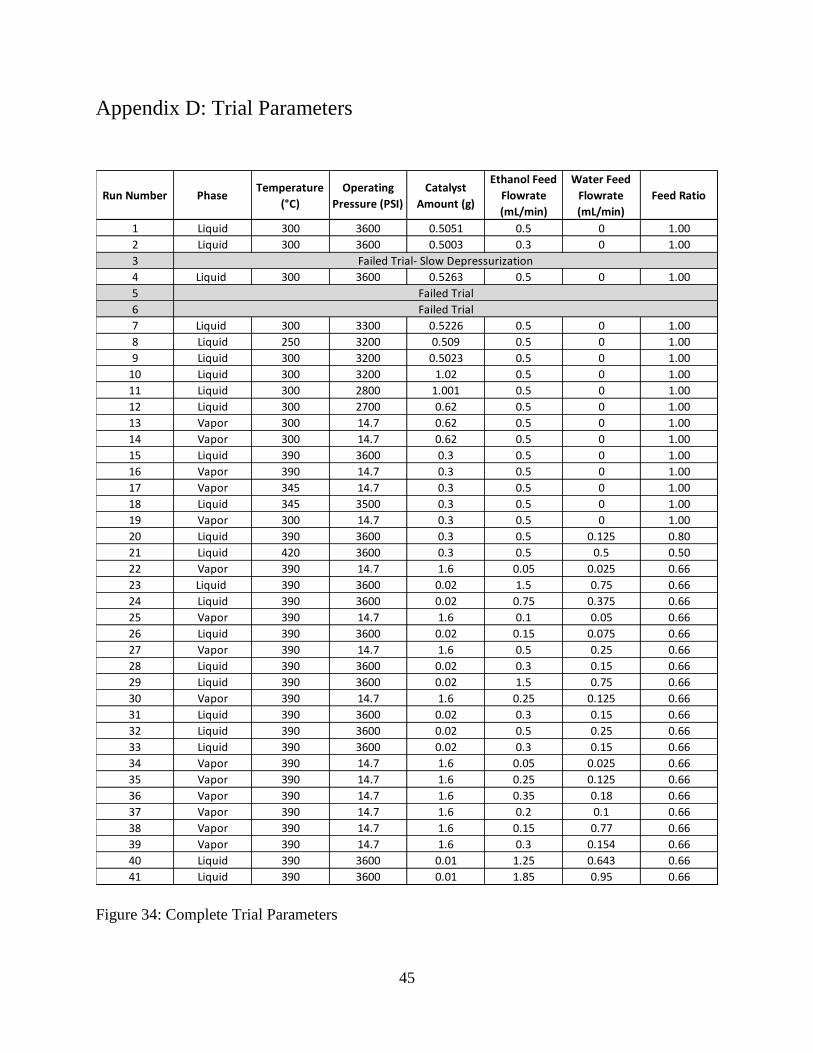
45
Appendix D: Trial Parameters
Figure 34: Complete Trial Parameters
Run Number PhaseTemperature
(°C)
Operating
Pressure (PSI)
Catalyst
Amount (g)
Ethanol Feed
Flowrate
(mL/min)
Water Feed
Flowrate
(mL/min)
Feed Ratio
1 Liquid 300 3600 0.5051 0.5 0 1.00
2 Liquid 300 3600 0.5003 0.3 0 1.00
3
4 Liquid 300 3600 0.5263 0.5 0 1.00
5
6
7 Liquid 300 3300 0.5226 0.5 0 1.00
8 Liquid 250 3200 0.509 0.5 0 1.00
9 Liquid 300 3200 0.5023 0.5 0 1.00
10 Liquid 300 3200 1.02 0.5 0 1.00
11 Liquid 300 2800 1.001 0.5 0 1.00
12 Liquid 300 2700 0.62 0.5 0 1.00
13 Vapor 300 14.7 0.62 0.5 0 1.00
14 Vapor 300 14.7 0.62 0.5 0 1.00
15 Liquid 390 3600 0.3 0.5 0 1.00
16 Vapor 390 14.7 0.3 0.5 0 1.00
17 Vapor 345 14.7 0.3 0.5 0 1.00
18 Liquid 345 3500 0.3 0.5 0 1.00
19 Vapor 300 14.7 0.3 0.5 0 1.00
20 Liquid 390 3600 0.3 0.5 0.125 0.80
21 Liquid 420 3600 0.3 0.5 0.5 0.50
22 Vapor 390 14.7 1.6 0.05 0.025 0.66
23 Liquid 390 3600 0.02 1.5 0.75 0.66
24 Liquid 390 3600 0.02 0.75 0.375 0.66
25 Vapor 390 14.7 1.6 0.1 0.05 0.66
26 Liquid 390 3600 0.02 0.15 0.075 0.66
27 Vapor 390 14.7 1.6 0.5 0.25 0.66
28 Liquid 390 3600 0.02 0.3 0.15 0.66
29 Liquid 390 3600 0.02 1.5 0.75 0.66
30 Vapor 390 14.7 1.6 0.25 0.125 0.66
31 Liquid 390 3600 0.02 0.3 0.15 0.66
32 Liquid 390 3600 0.02 0.5 0.25 0.66
33 Liquid 390 3600 0.02 0.3 0.15 0.66
34 Vapor 390 14.7 1.6 0.05 0.025 0.66
35 Vapor 390 14.7 1.6 0.25 0.125 0.66
36 Vapor 390 14.7 1.6 0.35 0.18 0.66
37 Vapor 390 14.7 1.6 0.2 0.1 0.66
38 Vapor 390 14.7 1.6 0.15 0.77 0.66
39 Vapor 390 14.7 1.6 0.3 0.154 0.66
40 Liquid 390 3600 0.01 1.25 0.643 0.66
41 Liquid 390 3600 0.01 1.85 0.95 0.66
Failed Trial- Slow Depressurization
Failed Trial
Failed Trial

46
Appendix E: In-Line GC-FID Intensity Graphs
Figure 35: Run 22, Vapor Phase, VHSV: 20.16
Figure 36: Run 23, Liquid Phase, VHSV: 24.35
Figure 37: Run 25, Vapor Phase, VHSV: 40.38
Figure 38: Run 26, Liquid Phase, VHSV: 2.43

47
Figure 39: Run 27, Vapor Phase, VHSV: 201.7
Figure 40: Run 28, Liquid Phase, VHSV: 4.87
Figure 41: Run 29, Liquid Phase, VHSV: 24.35
Figure 42: Run 30, Vapor Phase, VHSV: 100.84

48
Figure 43: Run 31, Liquid Phase, VHSV: 4.87
Figure 44: Run 32, Liquid Phase, VHSV: 4.87
Figure 45: Run 33, Liquids Phase, VHSV: 8.12
Figure 46: Run 34, Vapor Phase, VHSV: 20.17
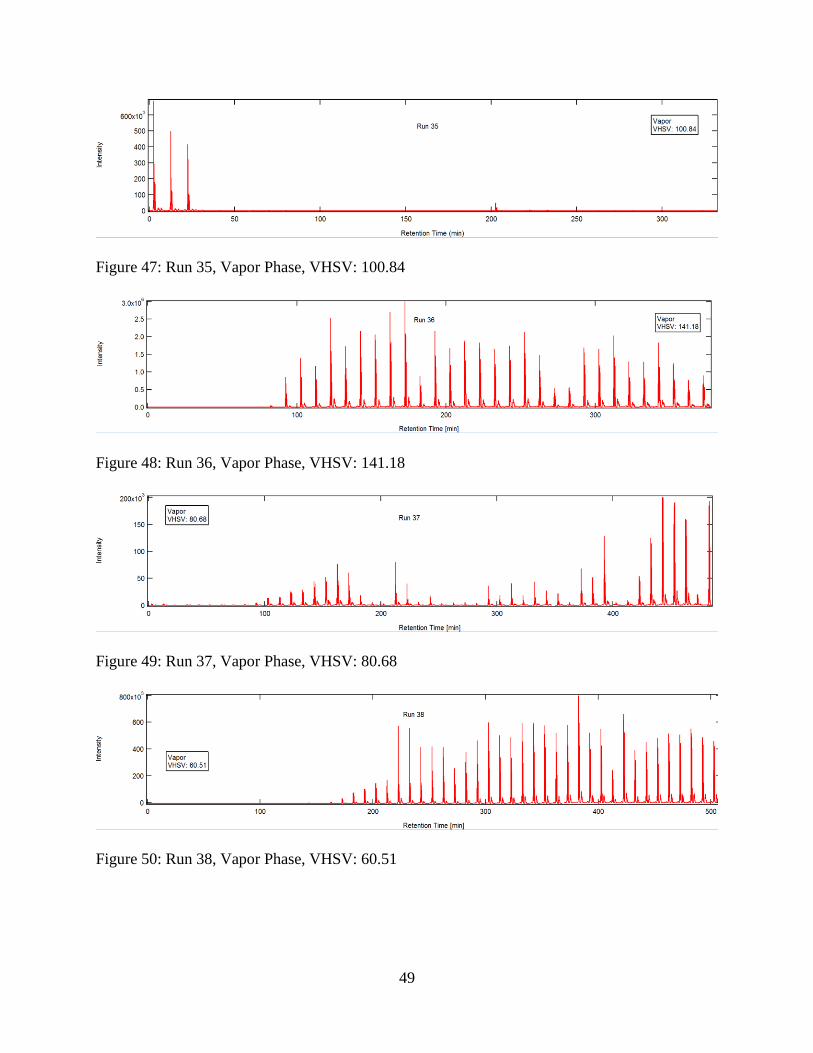
49
Figure 47: Run 35, Vapor Phase, VHSV: 100.84
Figure 48: Run 36, Vapor Phase, VHSV: 141.18
Figure 49: Run 37, Vapor Phase, VHSV: 80.68
Figure 50: Run 38, Vapor Phase, VHSV: 60.51

50
Figure 51: Run 39, Vapor Phase, VHSV: 121.02
Figure 52: Run 40, Liquid Phase, VHSV: 40.58
Figure 53: Run 41, Liquid Phase, VHSV: 60.07

51
Appendix F: Liquid Product Analysis Graphs
Figure 53: Liquid Phase, VHSV: 12.17
Figure 54: Vapor Phase, VHSV: 40.38
Figure 55: Liquid Phase, VHSV: 2.43
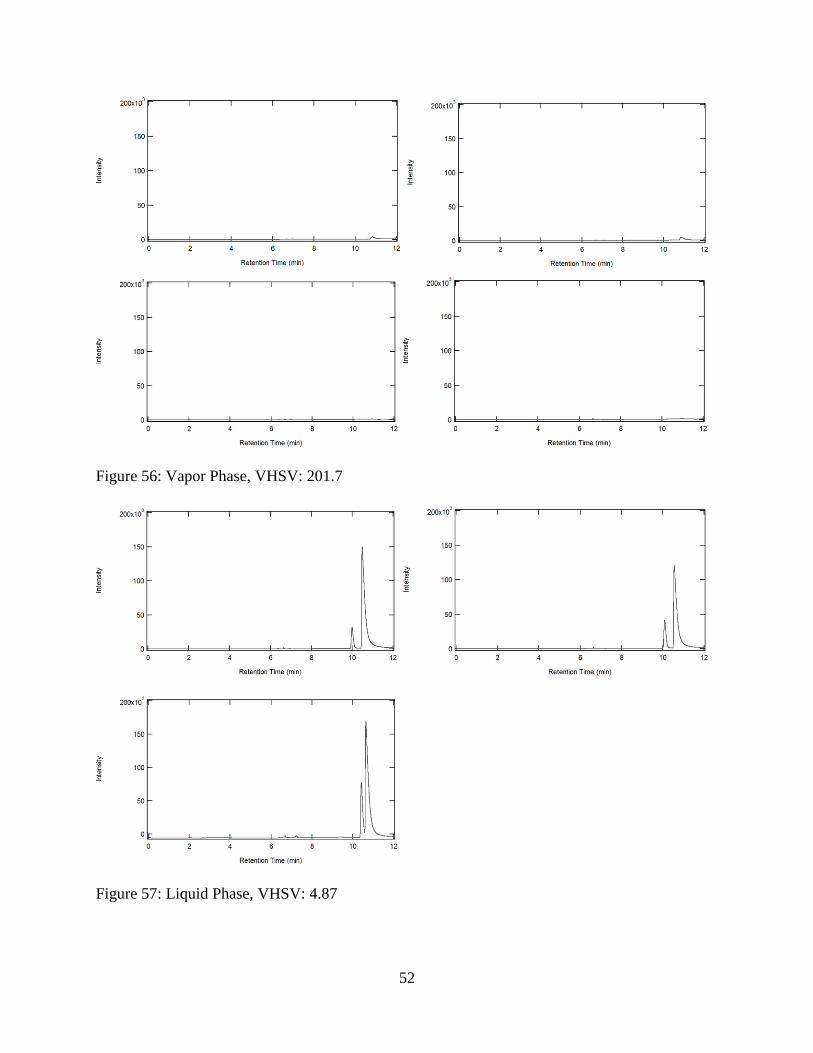
52
Figure 56: Vapor Phase, VHSV: 201.7
Figure 57: Liquid Phase, VHSV: 4.87

53
Figure 58: Liquid Phase, VHSV: 24.35
Figure 59: Vapor Phase, VHSV: 100.84
Figure 60: Liquid Phase, VHSV: 4.87

54
Figure 61: Liquid Phase, VHSV: 8
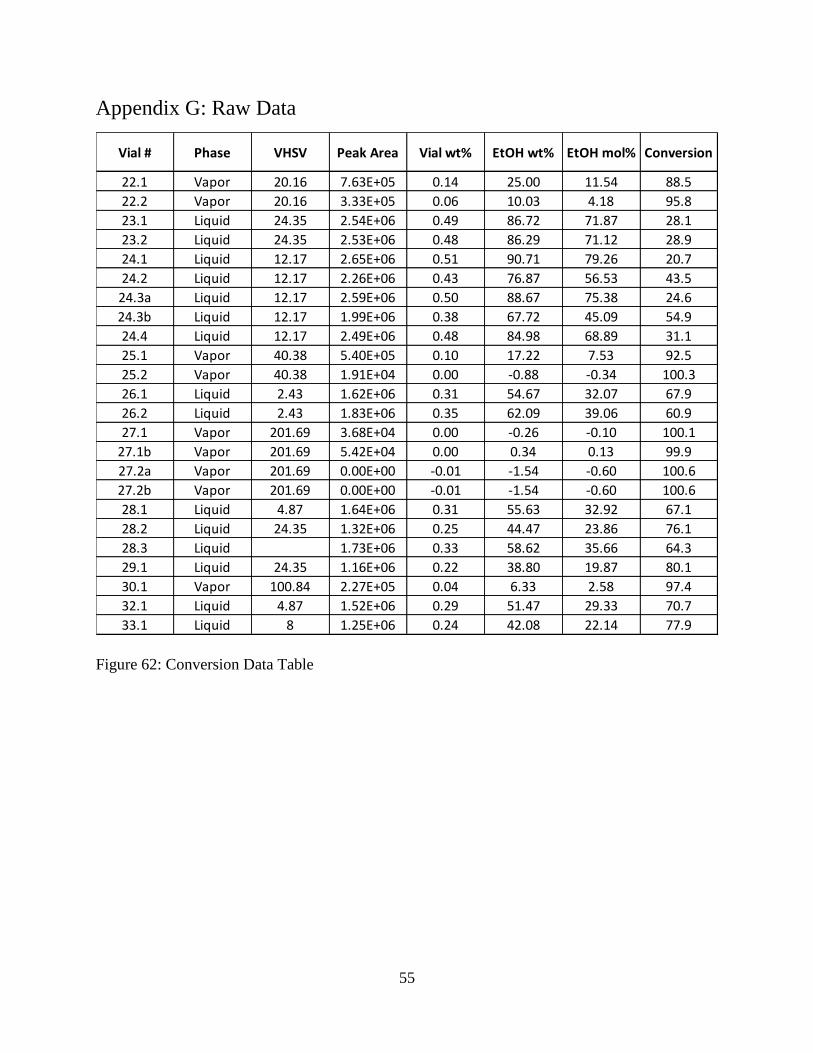
55
Appendix G: Raw Data
Figure 62: Conversion Data Table
Vial # Phase VHSV Peak Area Vial wt% EtOH wt% EtOH mol% Conversion
22.1 Vapor 20.16 7.63E+05 0.14 25.00 11.54 88.5
22.2 Vapor 20.16 3.33E+05 0.06 10.03 4.18 95.8
23.1 Liquid 24.35 2.54E+06 0.49 86.72 71.87 28.1
23.2 Liquid 24.35 2.53E+06 0.48 86.29 71.12 28.9
24.1 Liquid 12.17 2.65E+06 0.51 90.71 79.26 20.7
24.2 Liquid 12.17 2.26E+06 0.43 76.87 56.53 43.5
24.3a Liquid 12.17 2.59E+06 0.50 88.67 75.38 24.6
24.3b Liquid 12.17 1.99E+06 0.38 67.72 45.09 54.9
24.4 Liquid 12.17 2.49E+06 0.48 84.98 68.89 31.1
25.1 Vapor 40.38 5.40E+05 0.10 17.22 7.53 92.5
25.2 Vapor 40.38 1.91E+04 0.00 -0.88 -0.34 100.3
26.1 Liquid 2.43 1.62E+06 0.31 54.67 32.07 67.9
26.2 Liquid 2.43 1.83E+06 0.35 62.09 39.06 60.9
27.1 Vapor 201.69 3.68E+04 0.00 -0.26 -0.10 100.1
27.1b Vapor 201.69 5.42E+04 0.00 0.34 0.13 99.9
27.2a Vapor 201.69 0.00E+00 -0.01 -1.54 -0.60 100.6
27.2b Vapor 201.69 0.00E+00 -0.01 -1.54 -0.60 100.6
28.1 Liquid 4.87 1.64E+06 0.31 55.63 32.92 67.1
28.2 Liquid 24.35 1.32E+06 0.25 44.47 23.86 76.1
28.3 Liquid 1.73E+06 0.33 58.62 35.66 64.3
29.1 Liquid 24.35 1.16E+06 0.22 38.80 19.87 80.1
30.1 Vapor 100.84 2.27E+05 0.04 6.33 2.58 97.4
32.1 Liquid 4.87 1.52E+06 0.29 51.47 29.33 70.7
33.1 Liquid 8 1.25E+06 0.24 42.08 22.14 77.9
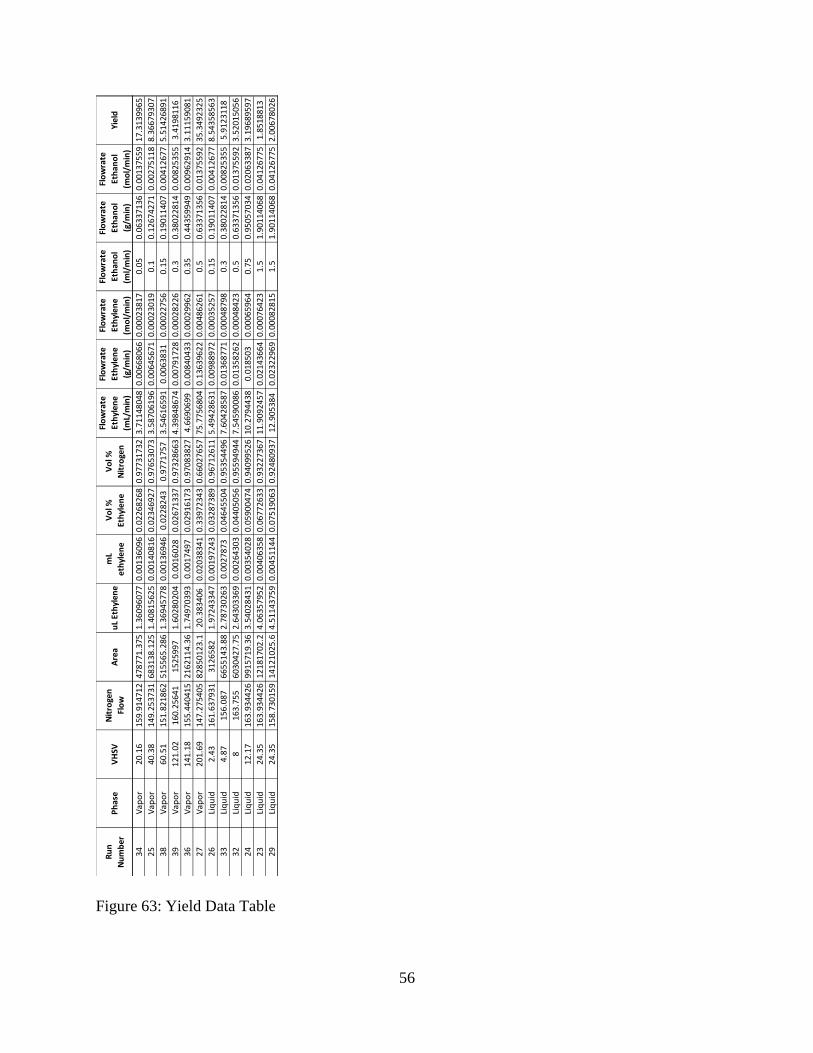
56
Figure 63: Yield Data Table
Ru
n
Nu
mb
er
Ph
ase
VH
SVN
itro
gen
Flo
wA
rea
uL
Eth
yle
ne
mL
eth
yle
ne
Vo
l %
Eth
yle
ne
Vo
l %
Nit
roge
n
Flo
wra
te
Eth
yle
ne
(mL/
min
)
Flo
wra
te
Eth
yle
ne
(g/m
in)
Flo
wra
te
Eth
yle
ne
(mo
l/m
in)
Flo
wra
te
Eth
ano
l
(ml/
min
)
Flo
wra
te
Eth
ano
l
(g/m
in)
Flo
wra
te
Eth
ano
l
(mo
l/m
in)
Yie
ld
34
Vap
or
20
.16
15
9.9
14
71
24
78
77
1.3
75
1.3
60
96
07
70
.00
13
60
96
0.0
22
68
26
80
.97
73
17
32
3.7
11
48
04
80
.00
66
80
66
0.0
00
23
81
70
.05
0.0
63
37
13
60
.00
13
75
59
17
.31
39
96
5
25
Vap
or
40
.38
14
9.2
53
73
16
83
13
8.1
25
1.4
08
15
62
50
.00
14
08
16
0.0
23
46
92
70
.97
65
30
73
3.5
87
06
19
60
.00
64
56
71
0.0
00
23
01
90
.10
.12
67
42
71
0.0
02
75
11
88
.36
67
93
07
38
Vap
or
60
.51
15
1.8
21
86
25
15
56
5.2
86
1.3
69
45
77
80
.00
13
69
46
0.0
22
82
43
0.9
77
17
57
3.5
46
16
59
10
.00
63
83
10
.00
02
27
56
0.1
50
.19
01
14
07
0.0
04
12
67
75
.51
42
68
91
39
Vap
or
12
1.0
21
60
.25
64
11
52
59
97
1.6
02
80
20
40
.00
16
02
80
.02
67
13
37
0.9
73
28
66
34
.39
84
86
74
0.0
07
91
72
80
.00
02
82
26
0.3
0.3
80
22
81
40
.00
82
53
55
3.4
19
81
16
36
Vap
or
14
1.1
81
55
.44
04
15
21
62
11
4.3
61
.74
97
03
93
0.0
01
74
97
0.0
29
16
17
30
.97
08
38
27
4.6
69
06
99
0.0
08
40
43
30
.00
02
99
62
0.3
50
.44
35
99
49
0.0
09
62
91
43
.11
15
90
81
27
Vap
or
20
1.6
91
47
.27
54
05
82
85
01
23
.12
0.3
83
40
60
.02
03
83
41
0.3
39
72
34
30
.66
02
76
57
75
.77
56
80
40
.13
63
96
22
0.0
04
86
26
10
.50
.63
37
13
56
0.0
13
75
59
23
5.3
49
23
25
26
Liq
uid
2.4
31
61
.63
79
31
31
26
58
21
.97
24
33
47
0.0
01
97
24
30
.03
28
73
89
0.9
67
12
61
15
.49
42
86
31
0.0
09
88
97
20
.00
03
52
57
0.1
50
.19
01
14
07
0.0
04
12
67
78
.54
35
85
63
33
Liq
uid
4.8
71
56
.08
76
65
51
43
.88
2.7
87
30
26
30
.00
27
87
30
.04
64
55
04
0.9
53
54
49
67
.60
42
85
87
0.0
13
68
77
10
.00
04
87
98
0.3
0.3
80
22
81
40
.00
82
53
55
5.9
12
31
18
32
Liq
uid
81
63
.75
56
03
04
27
.75
2.6
43
03
36
90
.00
26
43
03
0.0
44
05
05
60
.95
59
49
44
7.5
45
90
08
60
.01
35
82
62
0.0
00
48
42
30
.50
.63
37
13
56
0.0
13
75
59
23
.52
01
50
56
24
Liq
uid
12
.17
16
3.9
34
42
69
91
57
19
.36
3.5
40
28
43
10
.00
35
40
28
0.0
59
00
47
40
.94
09
95
26
10
.27
94
43
80
.01
85
03
0.0
00
65
96
40
.75
0.9
50
57
03
40
.02
06
33
87
3.1
96
89
59
7
23
Liq
uid
24
.35
16
3.9
34
42
61
21
81
70
2.2
4.0
63
57
95
20
.00
40
63
58
0.0
67
72
63
30
.93
22
73
67
11
.90
92
45
70
.02
14
36
64
0.0
00
76
42
31
.51
.90
11
40
68
0.0
41
26
77
51
.85
18
81
3
29
Liq
uid
24
.35
15
8.7
30
15
91
41
21
02
5.6
4.5
11
43
75
90
.00
45
11
44
0.0
75
19
06
30
.92
48
09
37
12
.90
53
84
0.0
23
22
96
90
.00
08
28
15
1.5
1.9
01
14
06
80
.04
12
67
75
2.0
06
78
02
6

57
Figure 64: Throughput Data Table
Ru
n N
um
ber
Ph
ase
VH
SVC
atal
yst
Mas
s (g
)A
vera
ge E
thyl
ene
Pea
k A
rea
Nit
roge
n F
low
rate
(mL/
min
)
Etyl
ene
Pea
k A
rea
No
rmal
ized
fo
r
Nit
roge
n F
low
rate
Ave
rage
Eth
ylen
e
Pea
k A
rea
per
Gra
m o
f C
atal
yst
Ave
rage
To
tal
Car
bo
n P
eak
Are
a
Tota
l Car
bo
n P
eak
Are
a N
orm
aliz
ed
for
Nit
roge
n
Flo
wra
te
Ave
rage
To
tal
Car
bo
n P
eak
Are
a
per
Gra
m o
f
Cat
alys
t
26Li
qu
id2.
430.
023.
13E+
06
161.
641.
93E+
04
9.67
E+0
5 -
- -
33Li
qu
id4.
870.
026.
66E+
06
156.
094.
26E+
04
2.13
E+0
6 -
- -
32Li
qu
id8
0.02
6.03
E+0
616
3.76
3.68
E+0
41.
84E+
06
- -
-
24Li
qu
id12
.17
0.02
9.92
E+0
616
3.93
6.05
E+0
43.
02E+
06
- -
-
23Li
qu
id24
.35
0.02
1.22
E+0
716
3.93
7.43
E+0
43.
72E+
06
- -
-
29Li
qu
id24
.35
0.02
1.41
E+0
715
8.73
8.90
E+0
44.
45E+
06
- -
-
40Li
qu
id40
.58
0.01
1.03
E+0
716
0.26
6.43
E+0
46.
43E+
06
- -
-
41Li
qu
id60
.07
0.01
2.01
E+0
715
8.39
1.27
E+0
51.
27E+
07
- -
-
34V
apo
r20
.16
1.6
4.79
E+0
515
9.91
2.99
E+0
31.
87E+
03
9.54
E+0
65.
97E+
04
3.73
E+0
4
25V
apo
r40
.38
1.6
6.83
E+0
514
9.25
4.58
E+0
32.
86E+
03
1.49
E+0
79.
98E+
04
6.24
E+0
4
36V
apo
r60
.51
1.6
5.16
E+0
515
1.82
3.40
E+0
32.
12E+
03
1.47
E+0
79.
70E+
04
6.06
E+0
4
27V
apo
r12
1.02
1.6
1.32
E+0
616
0.26
8.25
E+0
35.
16E+
03
2.47
E+0
71.
54E+
05
9.63
E+0
4
36V
apo
r14
1.18
1.6
2.16
E+0
615
5.44
1.39
E+0
48.
69E+
03
4.57
E+0
73.
05E+
05
1.90
E+0
5
27V
apo
r20
1.69
1.6
8.29
E+0
714
7.28
5.63
E+0
53.
52E+
05
9.55
E+0
76.
49E+
05
4.05
E+0
5

58
Appendix H: Poster