Embed Size (px)
Citation preview
© Asset Development and Improvement Limited 2015 – all rights reserved. Copyright in the information, layout, systems and processes contained in this document is proprietary to Asset Development and Improvement Limited (“ADIL”). The contents of this document are confidential and must not be disclosed to or used by any person other than for the strict purposes for which this document was produced by ADIL. www.assetdev.com
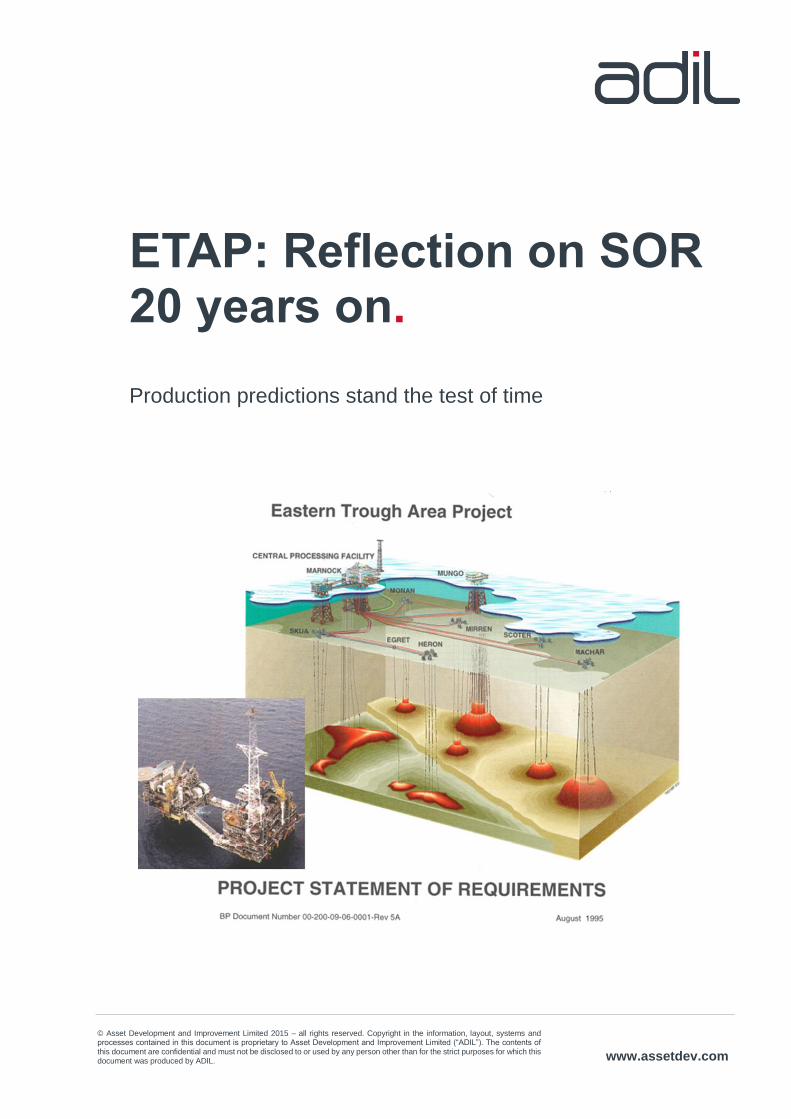
ETAP: Reflection on SOR 20 years on.
Production predictions stand the test of time
Rev 0 © Asset Development and Improvement Limited 2015 – all rights reserved Page 2 of 23
ETAP: Reflection on SOR 20 years on
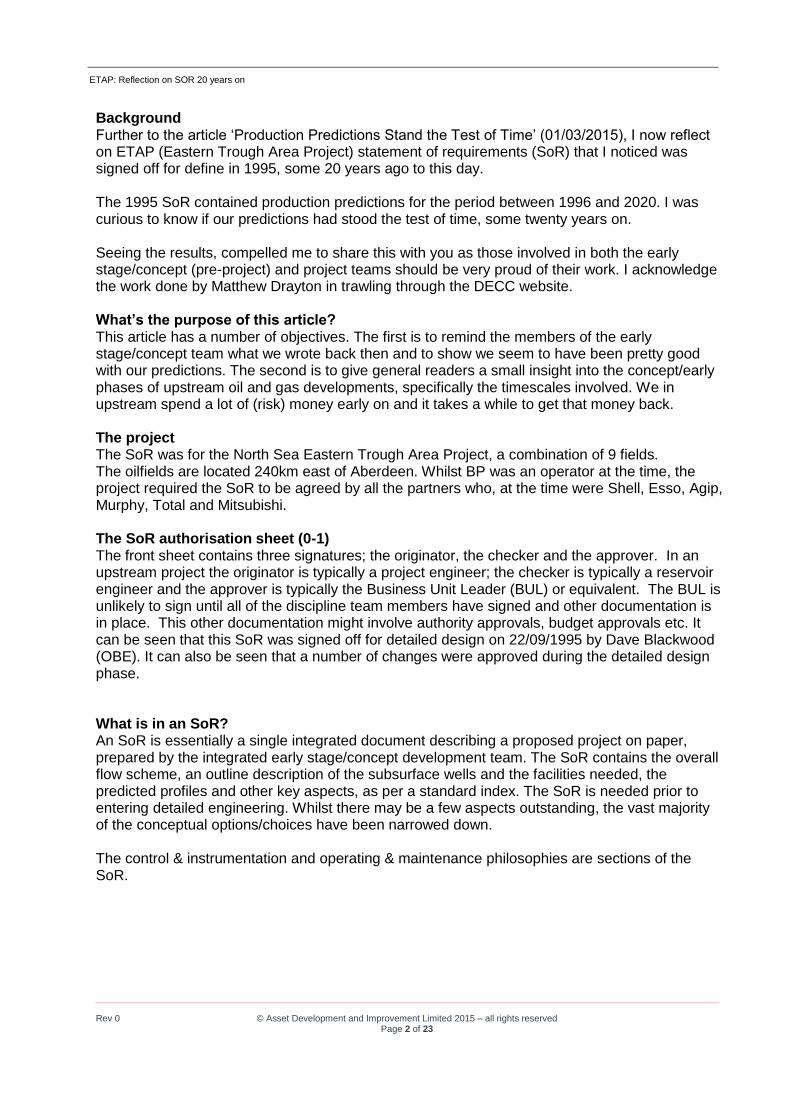
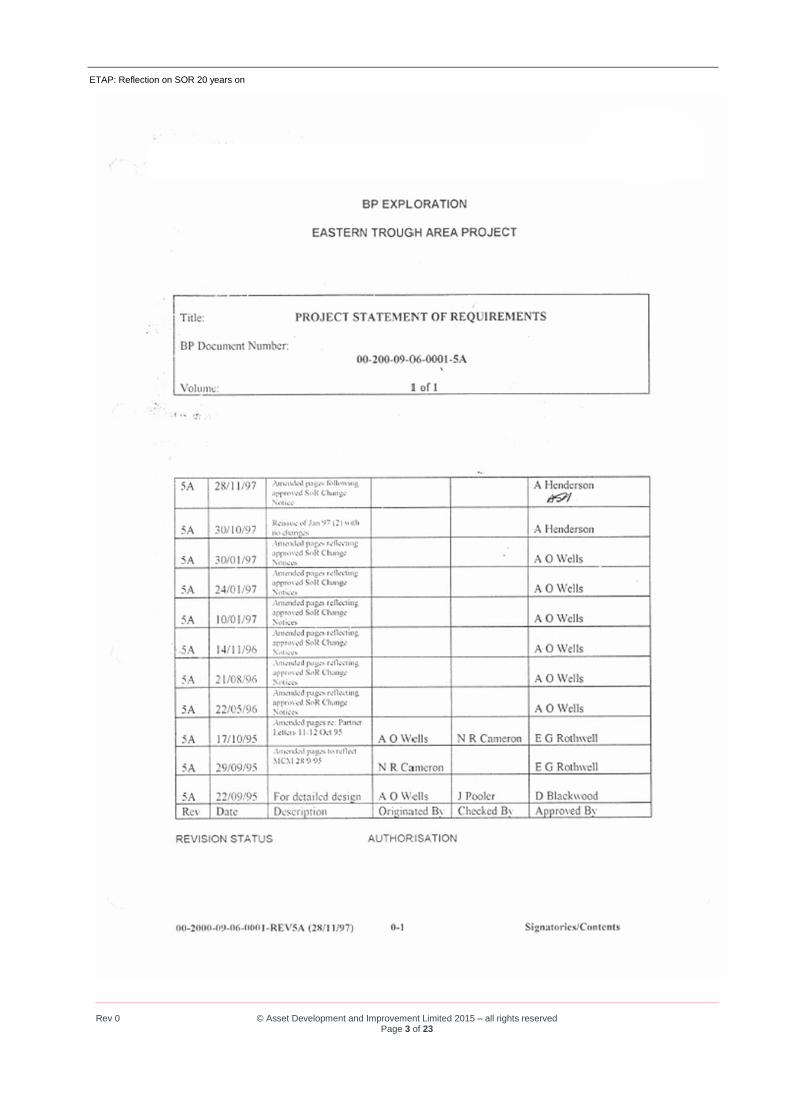
Background Further to the article ‘Production Predictions Stand the Test of Time’ (01/03/2015), I now reflect on ETAP (Eastern Trough Area Project) statement of requirements (SoR) that I noticed was signed off for define in 1995, some 20 years ago to this day. The 1995 SoR contained production predictions for the period between 1996 and 2020. I was curious to know if our predictions had stood the test of time, some twenty years on. Seeing the results, compelled me to share this with you as those involved in both the early stage/concept (pre-project) and project teams should be very proud of their work. I acknowledge the work done by Matthew Drayton in trawling through the DECC website. What’s the purpose of this article? This article has a number of objectives. The first is to remind the members of the early stage/concept team what we wrote back then and to show we seem to have been pretty good with our predictions. The second is to give general readers a small insight into the concept/early phases of upstream oil and gas developments, specifically the timescales involved. We in upstream spend a lot of (risk) money early on and it takes a while to get that money back. The project The SoR was for the North Sea Eastern Trough Area Project, a combination of 9 fields. The oilfields are located 240km east of Aberdeen. Whilst BP was an operator at the time, the project required the SoR to be agreed by all the partners who, at the time were Shell, Esso, Agip, Murphy, Total and Mitsubishi. The SoR authorisation sheet (0-1) The front sheet contains three signatures; the originator, the checker and the approver. In an upstream project the originator is typically a project engineer; the checker is typically a reservoir engineer and the approver is typically the Business Unit Leader (BUL) or equivalent. The BUL is unlikely to sign until all of the discipline team members have signed and other documentation is in place. This other documentation might involve authority approvals, budget approvals etc. It can be seen that this SoR was signed off for detailed design on 22/09/1995 by Dave Blackwood (OBE). It can also be seen that a number of changes were approved during the detailed design phase. What is in an SoR? An SoR is essentially a single integrated document describing a proposed project on paper, prepared by the integrated early stage/concept development team. The SoR contains the overall flow scheme, an outline description of the subsurface wells and the facilities needed, the predicted profiles and other key aspects, as per a standard index. The SoR is needed prior to entering detailed engineering. Whilst there may be a few aspects outstanding, the vast majority of the conceptual options/choices have been narrowed down. The control & instrumentation and operating & maintenance philosophies are sections of the SoR.
Rev 0 © Asset Development and Improvement Limited 2015 – all rights reserved Page 3 of 23
ETAP: Reflection on SOR 20 years on
Rev 0 © Asset Development and Improvement Limited 2015 – all rights reserved Page 4 of 23
ETAP: Reflection on SOR 20 years on
Rev 0 © Asset Development and Improvement Limited 2015 – all rights reserved Page 5 of 23
ETAP: Reflection on SOR 20 years on
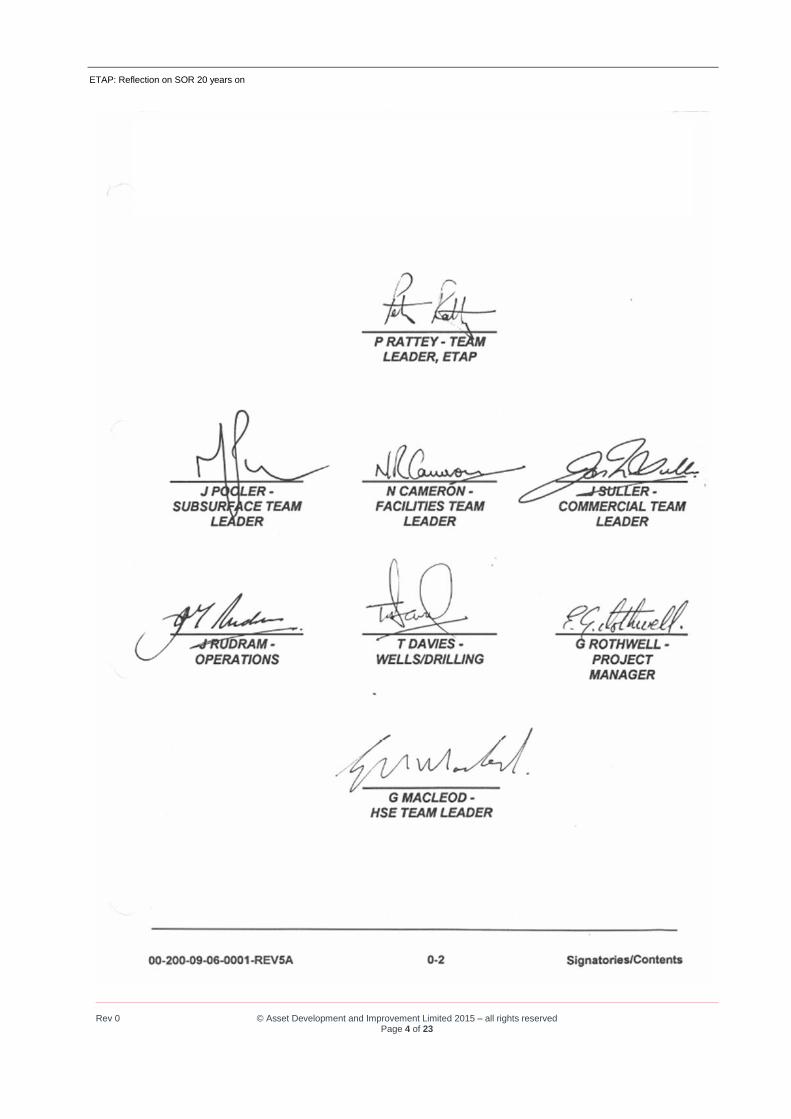
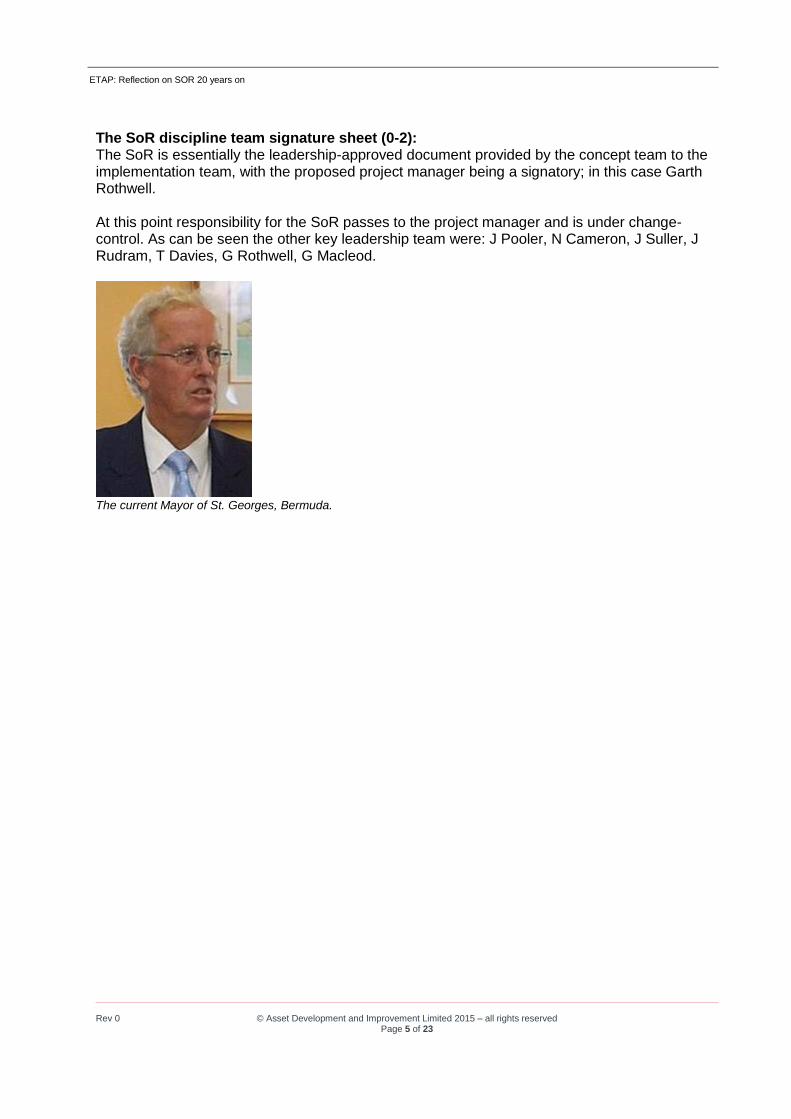
The SoR discipline team signature sheet (0-2): The SoR is essentially the leadership-approved document provided by the concept team to the implementation team, with the proposed project manager being a signatory; in this case Garth Rothwell. At this point responsibility for the SoR passes to the project manager and is under change-control. As can be seen the other key leadership team were: J Pooler, N Cameron, J Suller, J Rudram, T Davies, G Rothwell, G Macleod.
The current Mayor of St. Georges, Bermuda.
Rev 0 © Asset Development and Improvement Limited 2015 – all rights reserved Page 6 of 23
ETAP: Reflection on SOR 20 years on
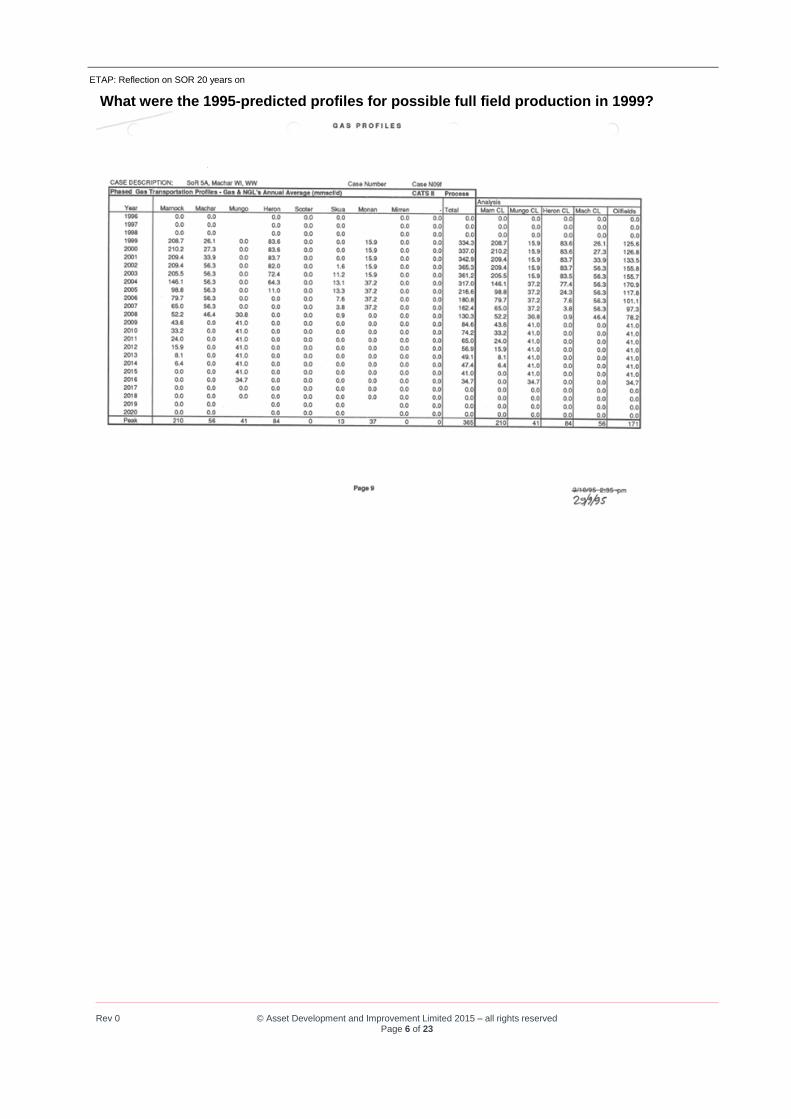
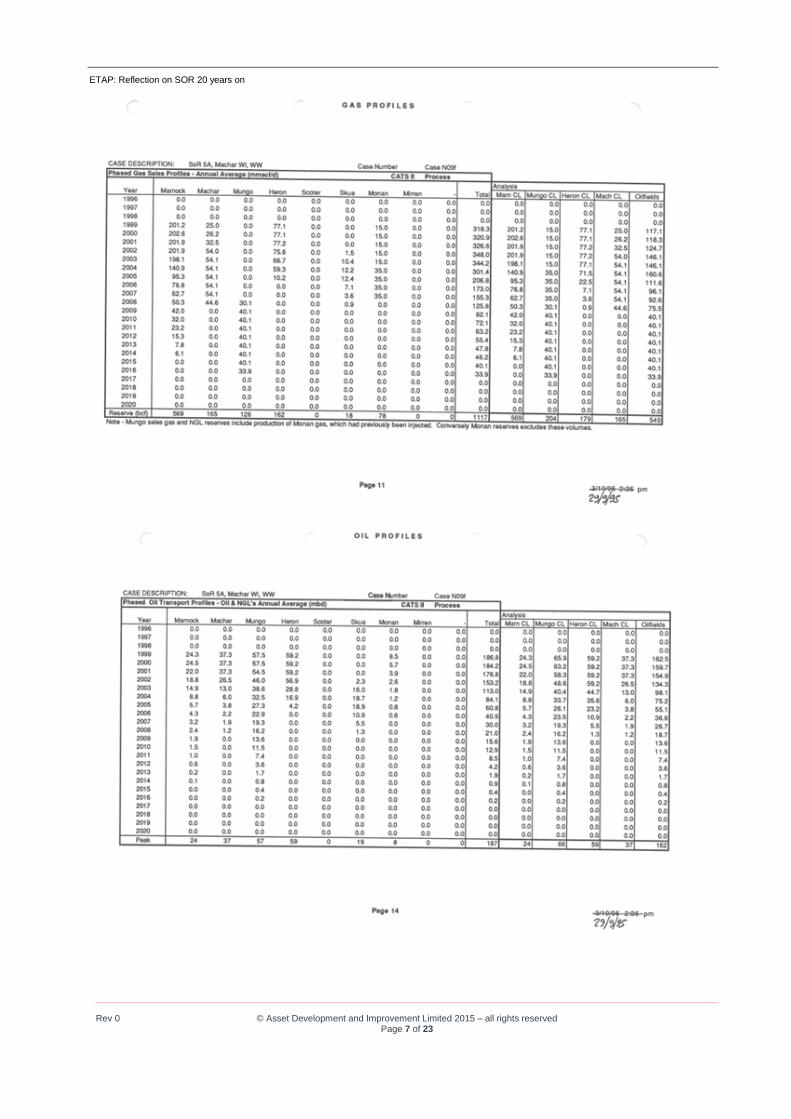
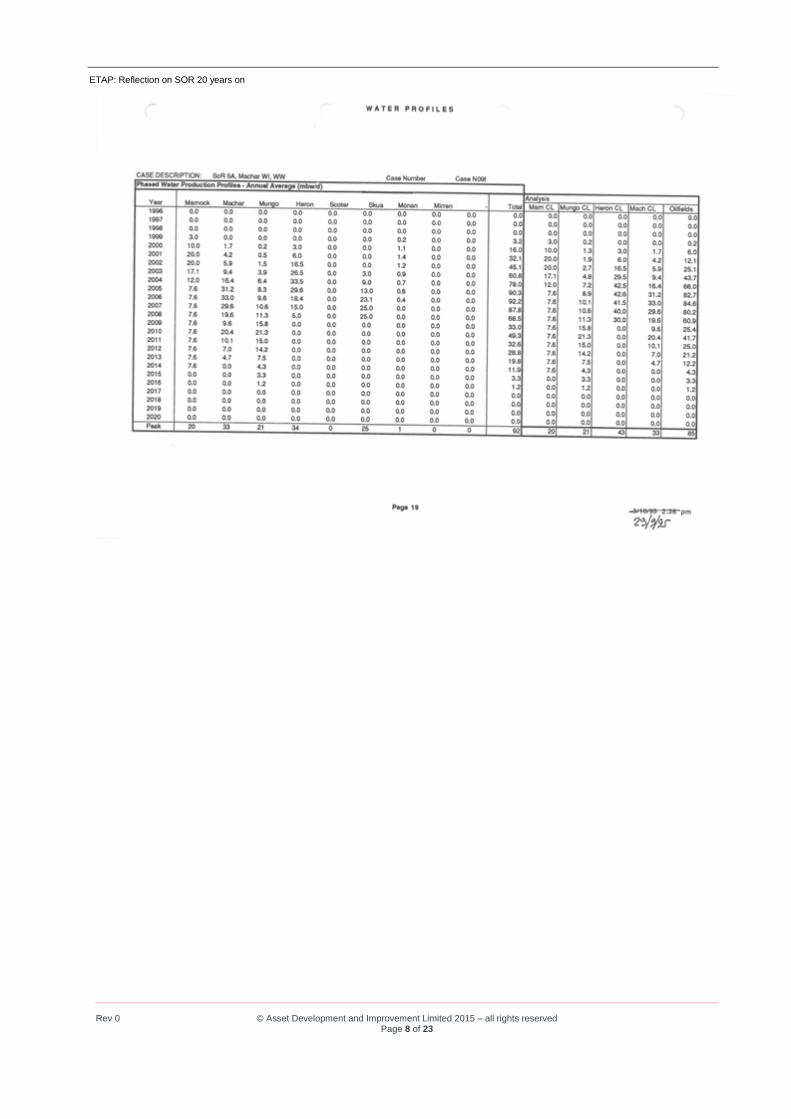
What were the 1995-predicted profiles for possible full field production in 1999?
Rev 0 © Asset Development and Improvement Limited 2015 – all rights reserved Page 7 of 23
ETAP: Reflection on SOR 20 years on
Rev 0 © Asset Development and Improvement Limited 2015 – all rights reserved Page 8 of 23
ETAP: Reflection on SOR 20 years on
Rev 0 © Asset Development and Improvement Limited 2015 – all rights reserved Page 9 of 23
ETAP: Reflection on SOR 20 years on
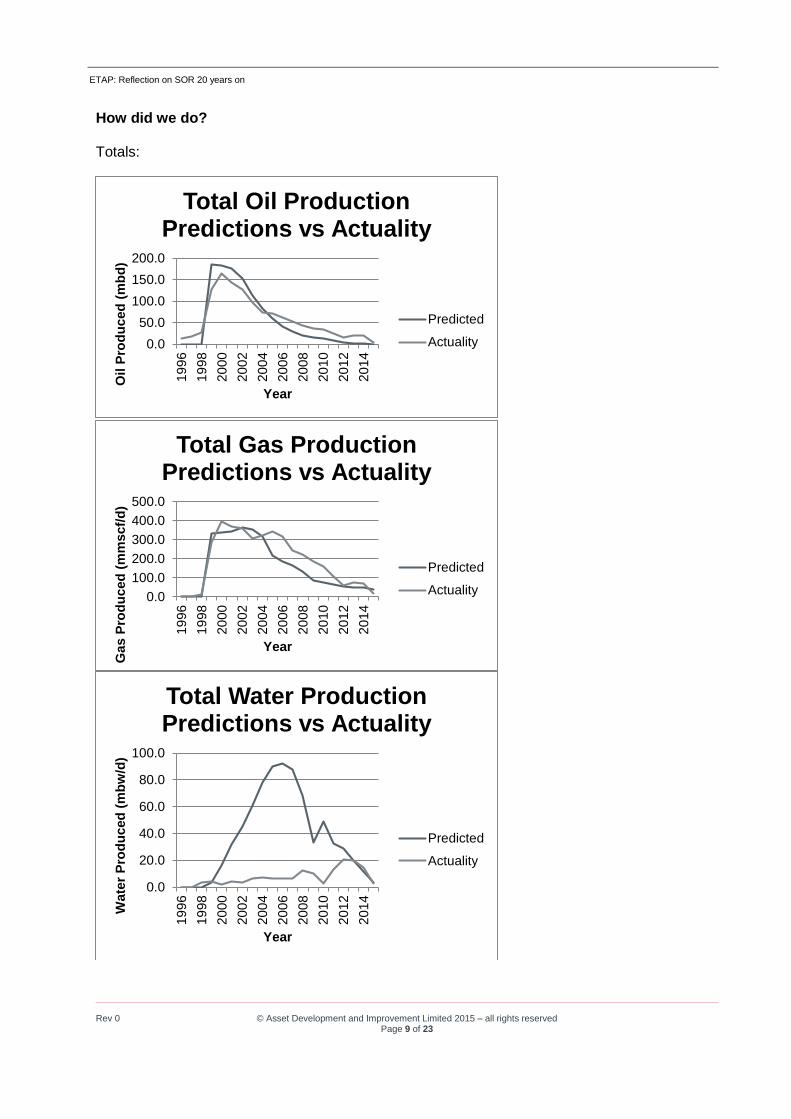
How did we do? Totals:
0.0
50.0
100.0
150.0
200.0
19
96
19
98
20
00
20
02
20
04
20
06
20
08
20
10
20
12
20
14
Oil P
rod
uced
(m
bd
)
Year
Total Oil Production Predictions vs Actuality
Predicted
Actuality
0.0
100.0
200.0
300.0
400.0
500.0
19
96
19
98
20
00
20
02
20
04
20
06
20
08
20
10
20
12
20
14
Gas P
rod
uced
(m
mscf/
d)
Year
Total Gas Production Predictions vs Actuality
Predicted
Actuality
0.0
20.0
40.0
60.0
80.0
100.0
19
96
19
98
20
00
20
02
20
04
20
06
20
08
20
10
20
12
20
14
Wate
r P
rod
uced
(m
bw
/d)
Year
Total Water Production Predictions vs Actuality
Predicted
Actuality
Rev 0 © Asset Development and Improvement Limited 2015 – all rights reserved Page 10 of 23
ETAP: Reflection on SOR 20 years on
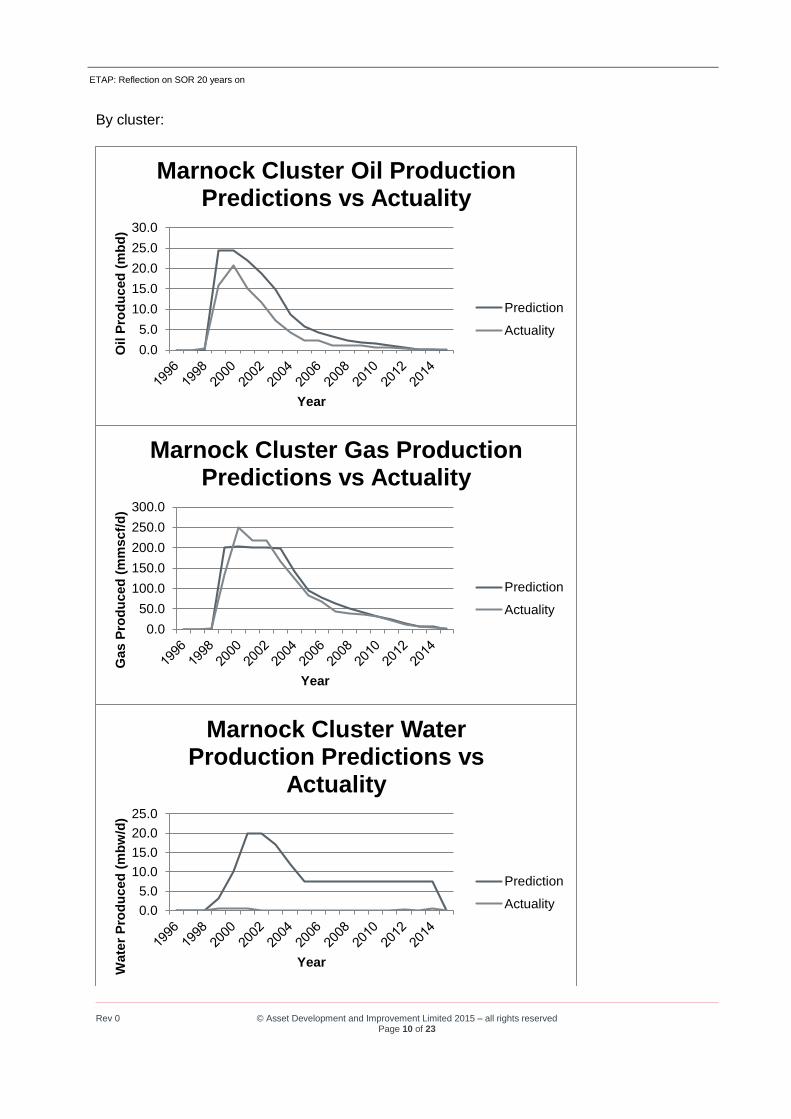
By cluster:
0.0
5.0
10.0
15.0
20.0
25.0
30.0
Oil P
rod
uced
(m
bd
)
Year
Marnock Cluster Oil Production Predictions vs Actuality
Prediction
Actuality
0.0
50.0
100.0
150.0
200.0
250.0
300.0
Gas P
rod
uced
(m
mscf/
d)
Year
Marnock Cluster Gas Production Predictions vs Actuality
Prediction
Actuality
0.0
5.0
10.0
15.0
20.0
25.0
Wate
r P
rod
uced
(m
bw
/d)
Year
Marnock Cluster Water Production Predictions vs
Actuality
Prediction
Actuality
Rev 0 © Asset Development and Improvement Limited 2015 – all rights reserved Page 11 of 23
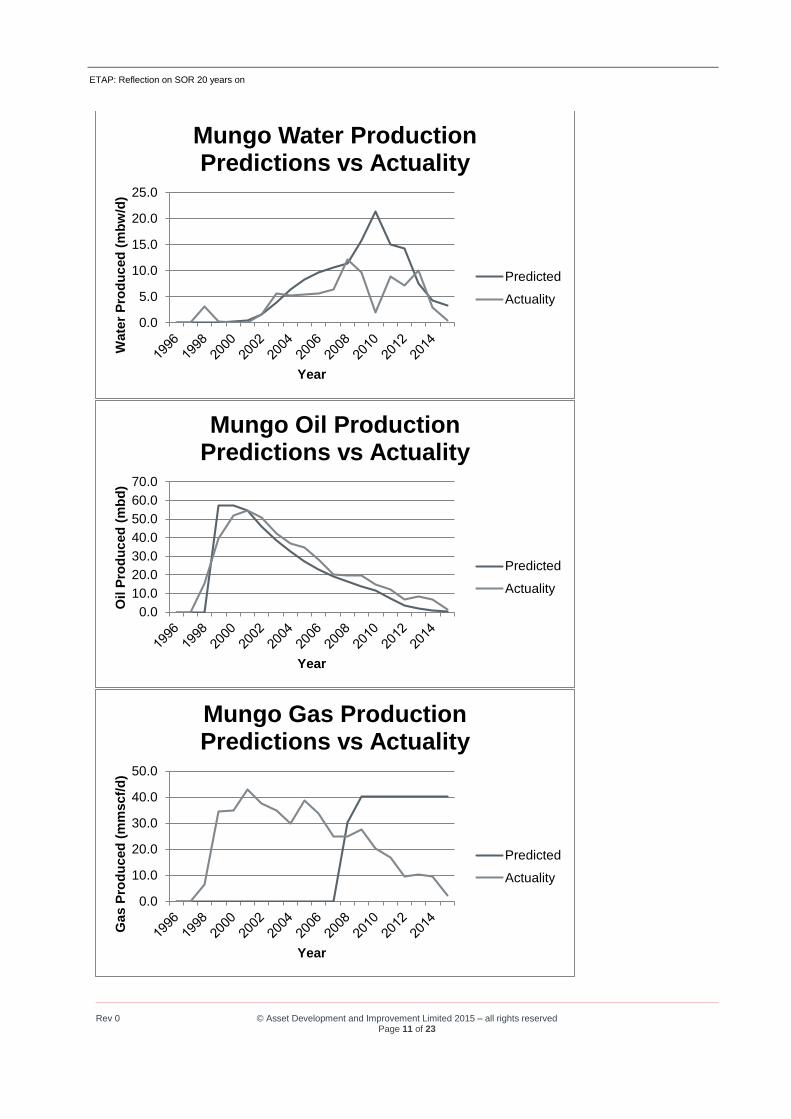
ETAP: Reflection on SOR 20 years on
0.0
5.0
10.0
15.0
20.0
25.0
Wate
r P
rod
uced
(m
bw
/d)
Year
Mungo Water Production Predictions vs Actuality
Predicted
Actuality
0.0
10.0
20.0
30.0
40.0
50.0
60.0
70.0
Oil P
rod
uced
(m
bd
)
Year
Mungo Oil Production Predictions vs Actuality
Predicted
Actuality
0.0
10.0
20.0
30.0
40.0
50.0
Gas P
rod
uced
(m
mscf/
d)
Year
Mungo Gas Production Predictions vs Actuality
Predicted
Actuality
Rev 0 © Asset Development and Improvement Limited 2015 – all rights reserved Page 12 of 23
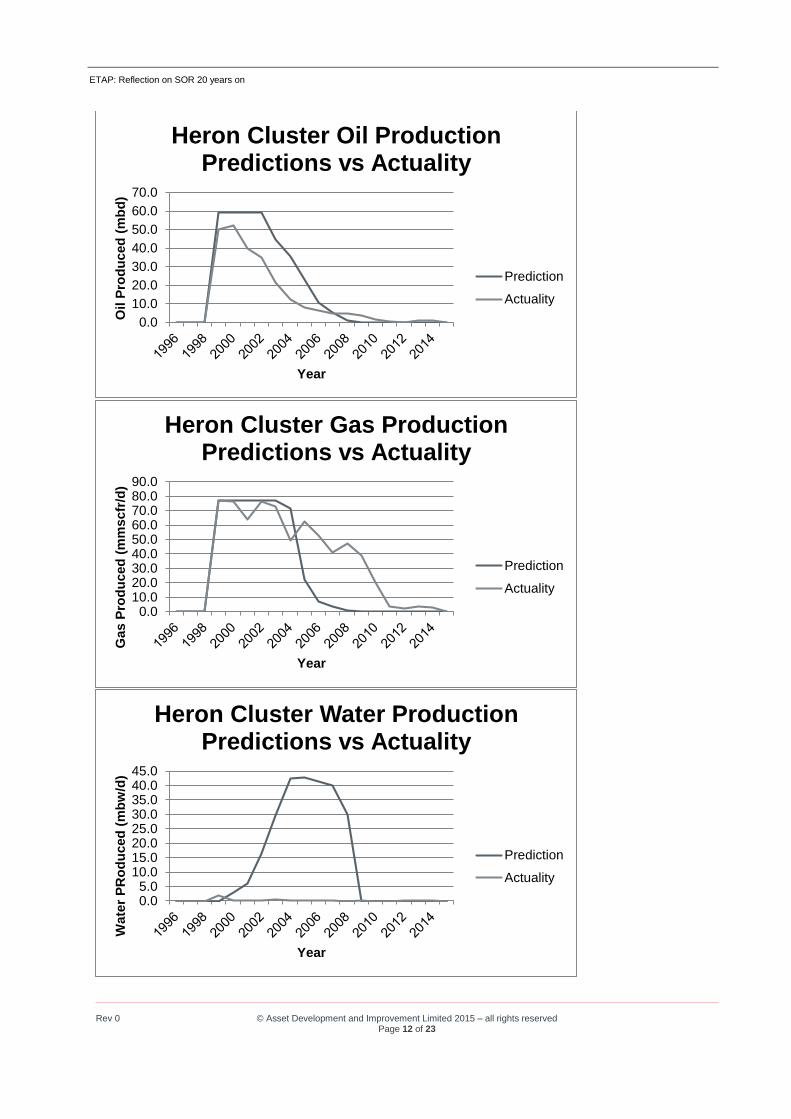
ETAP: Reflection on SOR 20 years on
0.0
10.0
20.0
30.0
40.0
50.0
60.0
70.0
Oil P
rod
uced
(m
bd
)
Year
Heron Cluster Oil Production Predictions vs Actuality
Prediction
Actuality
0.010.020.030.040.050.060.070.080.090.0
Gas P
rod
uced
(m
mscfr
/d)
Year
Heron Cluster Gas Production Predictions vs Actuality
Prediction
Actuality
0.05.0
10.015.020.025.030.035.040.045.0
Wate
r P
Ro
du
ced
(m
bw
/d)
Year
Heron Cluster Water Production Predictions vs Actuality
Prediction
Actuality
Rev 0 © Asset Development and Improvement Limited 2015 – all rights reserved Page 13 of 23
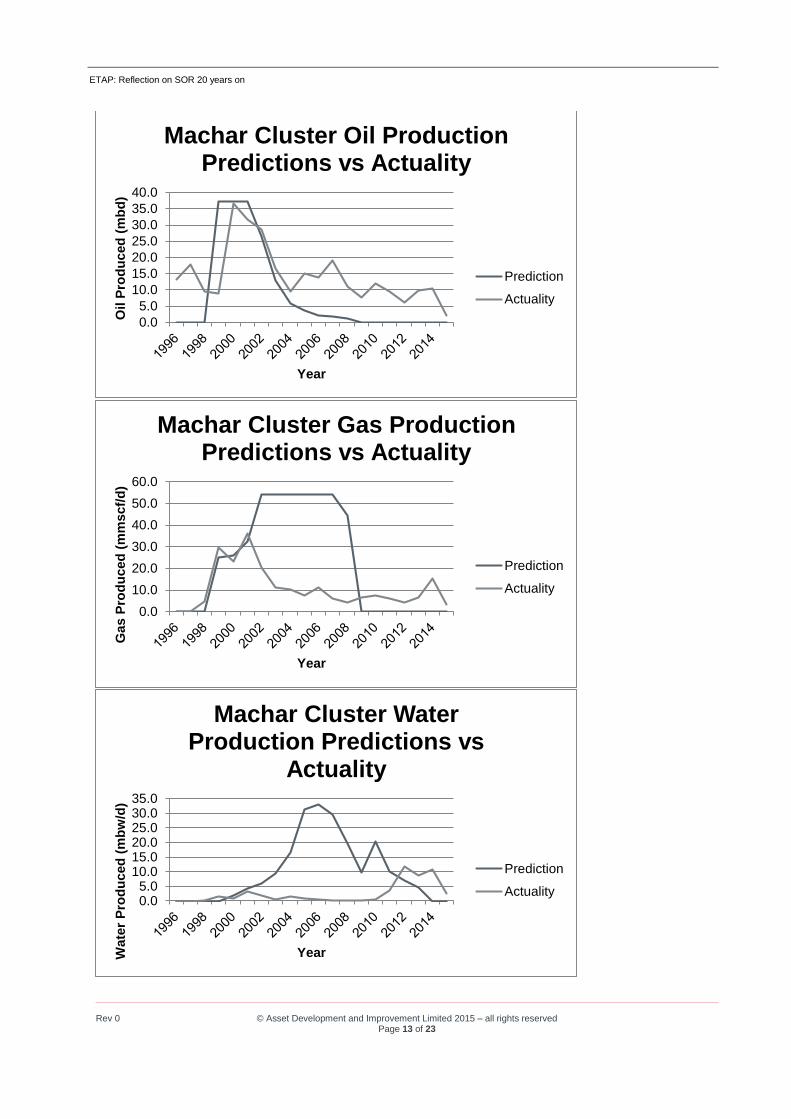
ETAP: Reflection on SOR 20 years on
0.0
5.0
10.0
15.0
20.0
25.0
30.0
35.0
40.0
Oil P
rod
uced
(m
bd
)
Year
Machar Cluster Oil Production Predictions vs Actuality
Prediction
Actuality
0.0
10.0
20.0
30.0
40.0
50.0
60.0
Gas P
rod
uced
(m
mscf/
d)
Year
Machar Cluster Gas Production Predictions vs Actuality
Prediction
Actuality
0.05.0
10.015.020.025.030.035.0
Wate
r P
rod
uced
(m
bw
/d)
Year
Machar Cluster Water Production Predictions vs
Actuality
Prediction
Actuality

Rev 0 © Asset Development and Improvement Limited 2015 – all rights reserved Page 14 of 23
ETAP: Reflection on SOR 20 years on
By field:
0.0200.0400.0600.0800.0
1000.01200.01400.01600.01800.0
To
tal G
as P
rod
uced
(m
mscf/
d)
Field
Total Gas Production Predictions vs Actuality
Gas Predictions
Gas Actuality
0.050.0
100.0150.0200.0250.0300.0350.0400.0450.0500.0
To
tal O
il P
rod
uced
(m
bd
)
Field
Total Oil Production Predictions vs Actuality
Oil Predicted
Oil Actuality

Rev 0 © Asset Development and Improvement Limited 2015 – all rights reserved Page 15 of 23
ETAP: Reflection on SOR 20 years on
0.0
5.0
10.0
15.0
20.0
25.0
Wate
r P
rod
uced
(m
bw
/d)
Year
Marnock Water Production Predictions vs Actuality
Predicted
Actuality
0.0
5.0
10.0
15.0
20.0
25.0
30.0
Oil P
rod
uced
(m
bd
)
Year
Marnock Oil Production Predictions vs Actuality
Predicted
Actuality
0.0
50.0
100.0
150.0
200.0
250.0
300.0
Gas P
rod
uced
(m
mscf/
d)
Year
Marnock Gas Production Predictions vs Actuality
Predicted
Actuality
Rev 0 © Asset Development and Improvement Limited 2015 – all rights reserved Page 16 of 23
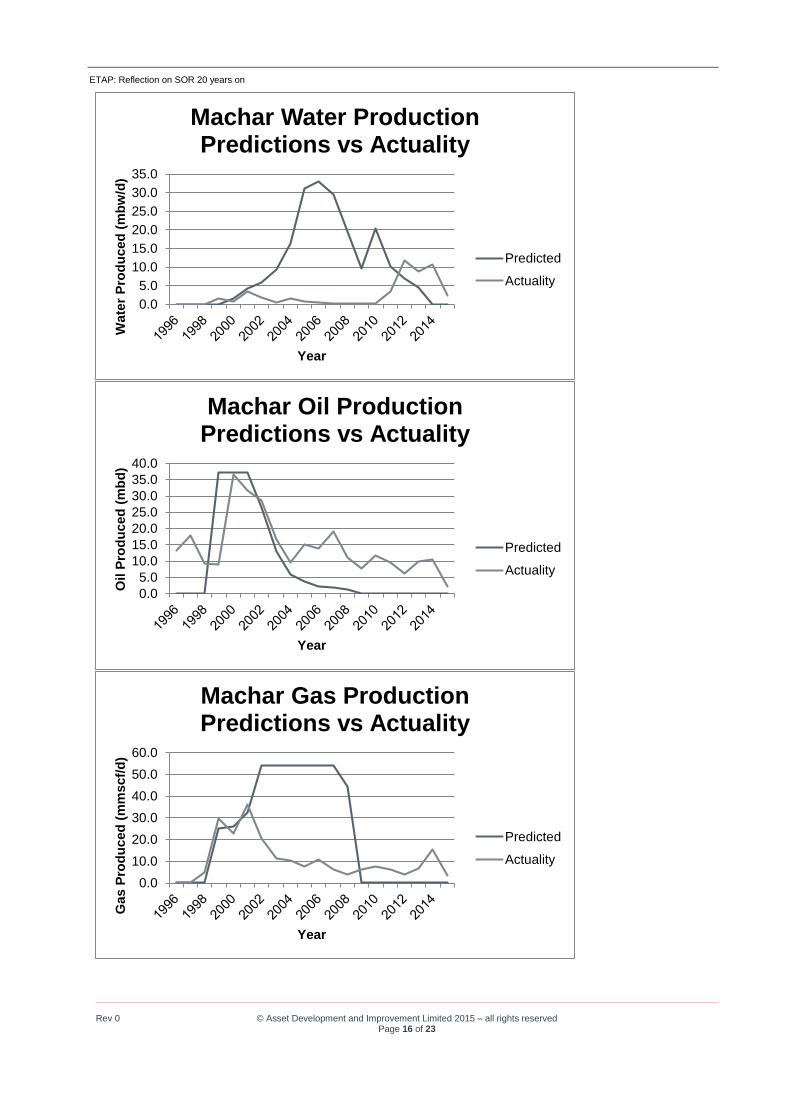
ETAP: Reflection on SOR 20 years on
0.0
5.0
10.0
15.0
20.0
25.0
30.0
35.0
Wate
r P
rod
uced
(m
bw
/d)
Year
Machar Water Production Predictions vs Actuality
Predicted
Actuality
0.0
5.0
10.0
15.0
20.0
25.0
30.0
35.0
40.0
Oil P
rod
uced
(m
bd
)
Year
Machar Oil Production Predictions vs Actuality
Predicted
Actuality
0.0
10.0
20.0
30.0
40.0
50.0
60.0
Gas P
rod
uced
(m
mscf/
d)
Year
Machar Gas Production Predictions vs Actuality
Predicted
Actuality
Rev 0 © Asset Development and Improvement Limited 2015 – all rights reserved Page 17 of 23
ETAP: Reflection on SOR 20 years on
0.0
5.0
10.0
15.0
20.0
25.0
Wate
r P
rod
uced
(m
bw
/d)
Year
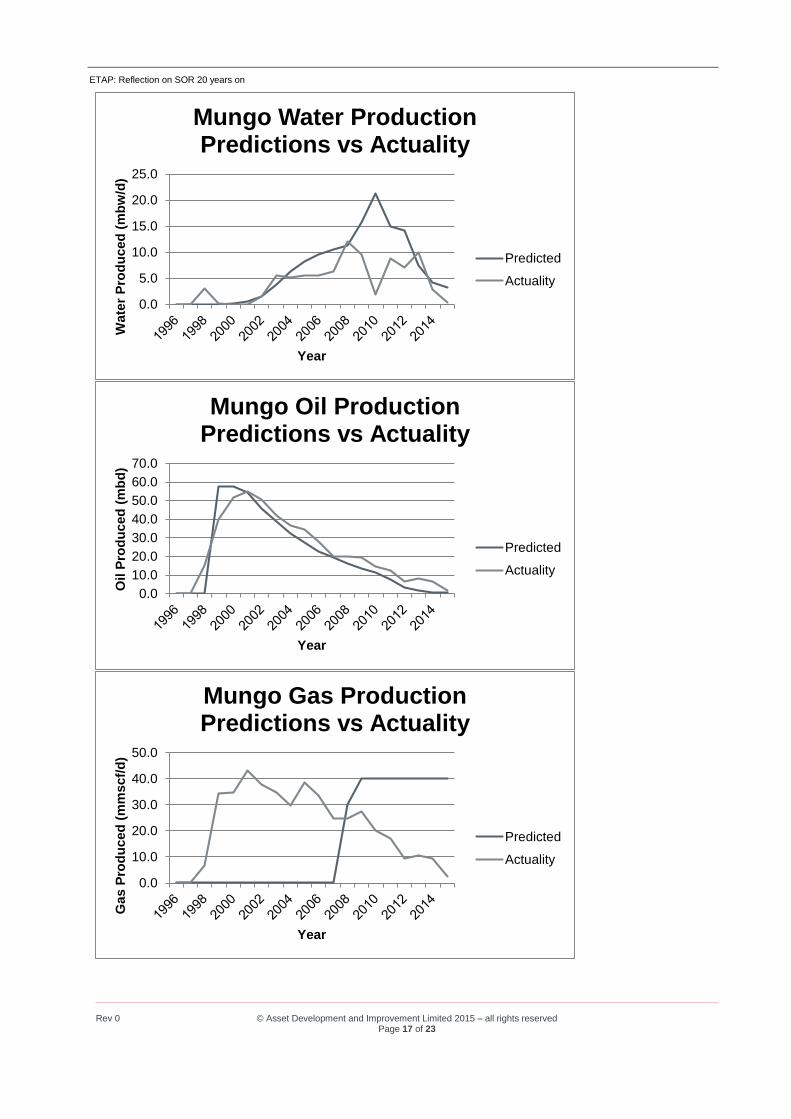
Mungo Water Production Predictions vs Actuality
Predicted
Actuality
0.0
10.0
20.0
30.0
40.0
50.0
60.0
70.0
Oil P
rod
uced
(m
bd
)
Year
Mungo Oil Production Predictions vs Actuality
Predicted
Actuality
0.0
10.0
20.0
30.0
40.0
50.0
Gas P
rod
uced
(m
mscf/
d)
Year
Mungo Gas Production Predictions vs Actuality
Predicted
Actuality
Rev 0 © Asset Development and Improvement Limited 2015 – all rights reserved Page 18 of 23
ETAP: Reflection on SOR 20 years on
0.0
5.0
10.0
15.0
20.0
25.0
30.0
35.0
40.0
Wate
r P
rod
uced
(m
bw
/d)
Year
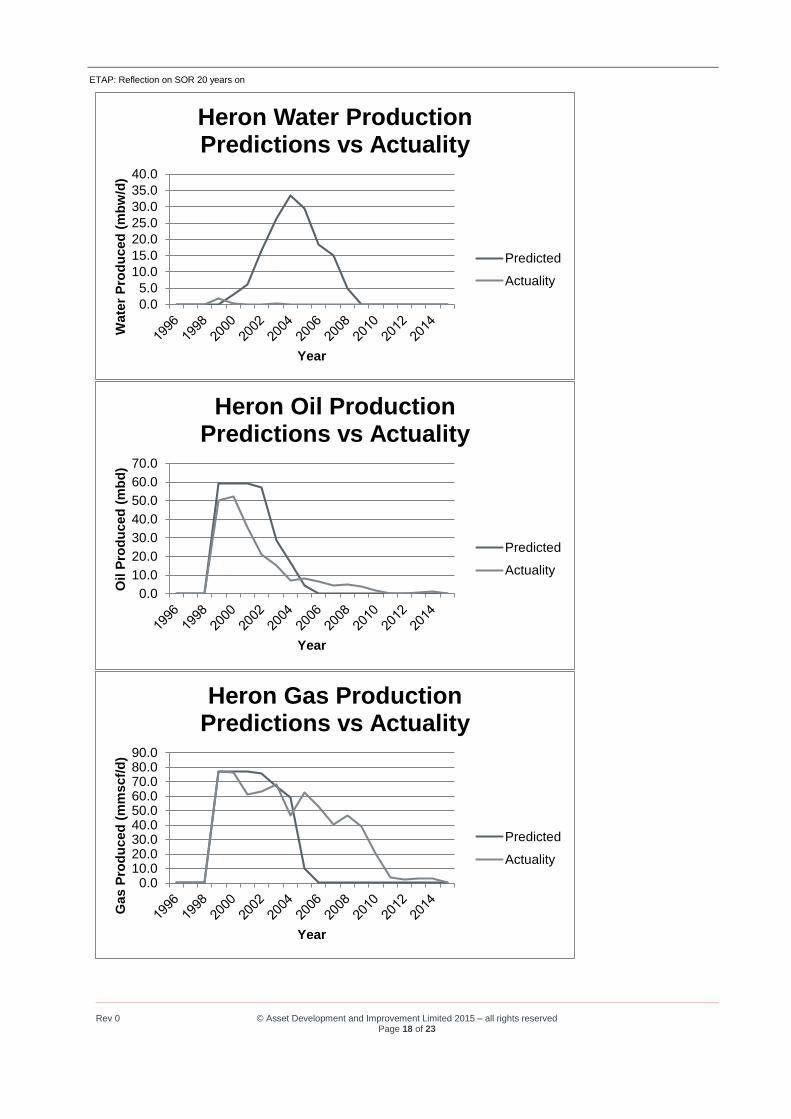
Heron Water Production Predictions vs Actuality
Predicted
Actuality
0.0
10.0
20.0
30.0
40.0
50.0
60.0
70.0
Oil P
rod
uced
(m
bd
)
Year
Heron Oil Production Predictions vs Actuality
Predicted
Actuality
0.010.020.030.040.050.060.070.080.090.0
Gas P
rod
uced
(m
mscf/
d)
Year
Heron Gas Production Predictions vs Actuality
Predicted
Actuality
Rev 0 © Asset Development and Improvement Limited 2015 – all rights reserved Page 19 of 23
ETAP: Reflection on SOR 20 years on
0.0
20.0
40.0
60.0
80.0
100.0
120.0
140.0
Gas P
rod
uced
(m
mscf/
d)
Year
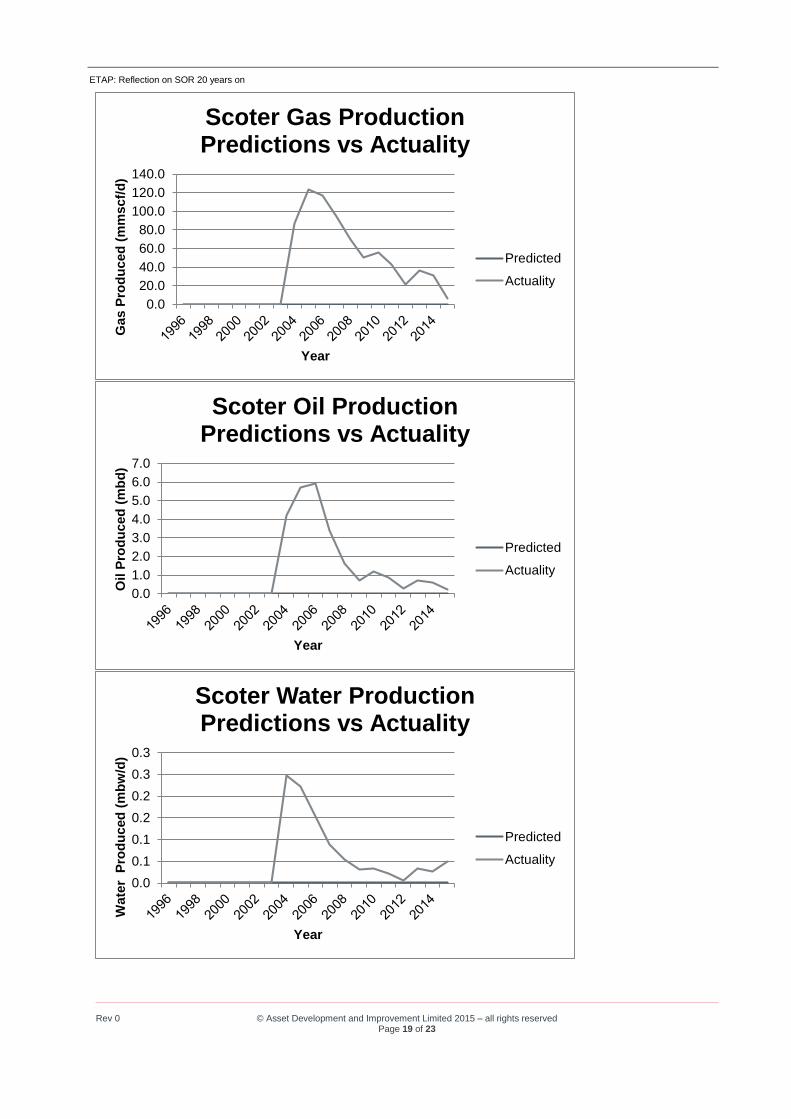
Scoter Gas Production Predictions vs Actuality
Predicted
Actuality
0.0
1.0
2.0
3.0
4.0
5.0
6.0
7.0
Oil P
rod
uced
(m
bd
)
Year
Scoter Oil Production Predictions vs Actuality
Predicted
Actuality
0.0
0.1
0.1
0.2
0.2
0.3
0.3
Wate
r P
rod
uced
(m
bw
/d)
Year
Scoter Water Production Predictions vs Actuality
Predicted
Actuality
Rev 0 © Asset Development and Improvement Limited 2015 – all rights reserved Page 20 of 23
ETAP: Reflection on SOR 20 years on
0.0
5.0
10.0
15.0
20.0
Oil P
rod
uced
(m
bd
)
Year
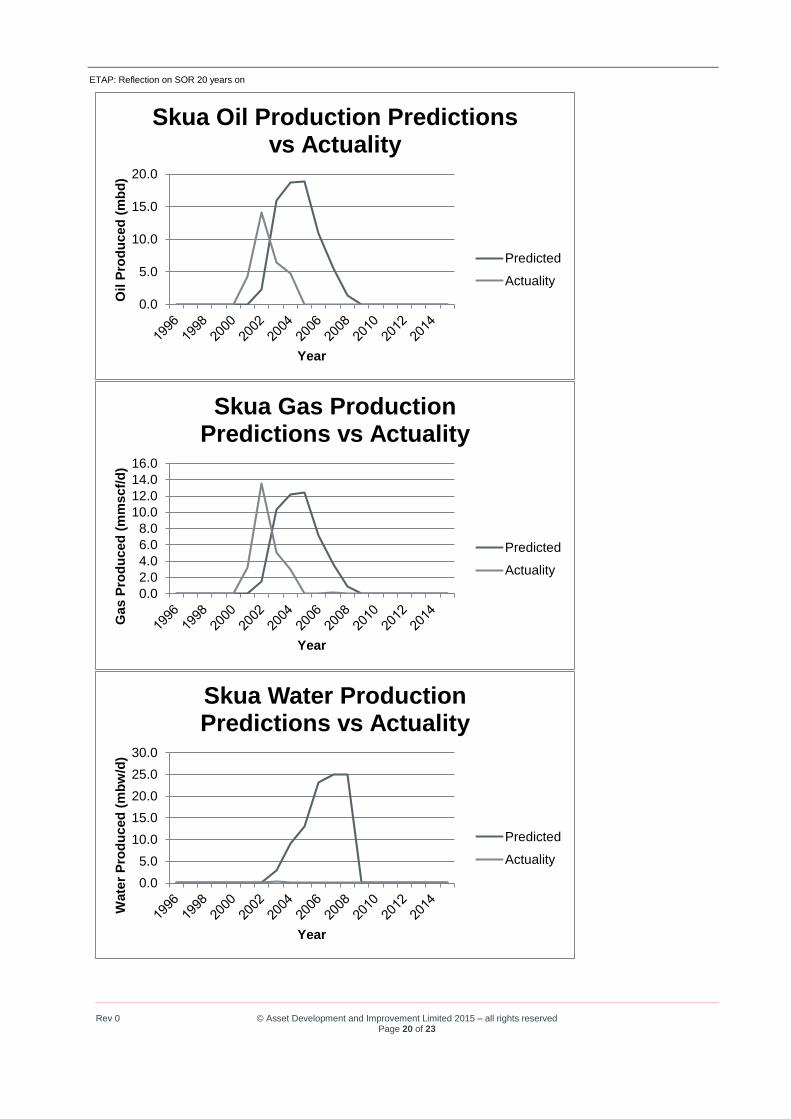
Skua Oil Production Predictions vs Actuality
Predicted
Actuality
0.0
2.0
4.0
6.0
8.0
10.0
12.0
14.0
16.0
Gas P
rod
uced
(m
mscf/
d)
Year
Skua Gas Production Predictions vs Actuality
Predicted
Actuality
0.0
5.0
10.0
15.0
20.0
25.0
30.0
Wate
r P
rod
uced
(m
bw
/d)
Year
Skua Water Production Predictions vs Actuality
Predicted
Actuality
Rev 0 © Asset Development and Improvement Limited 2015 – all rights reserved Page 21 of 23
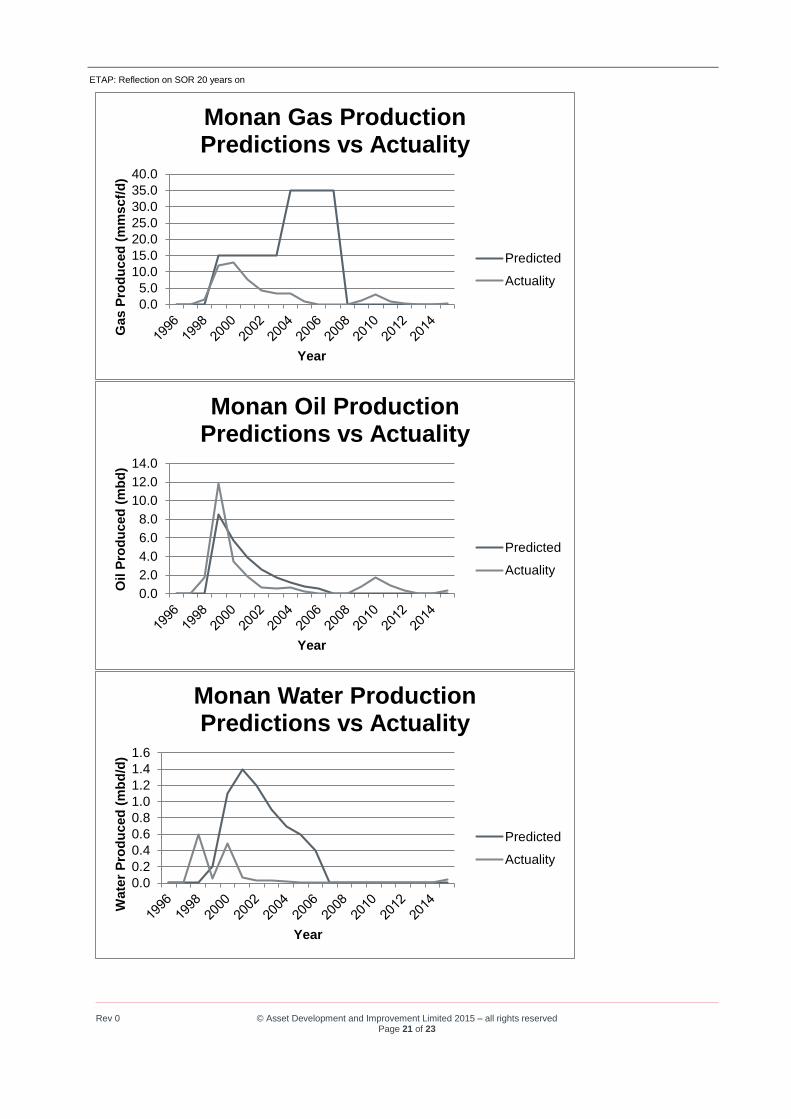
ETAP: Reflection on SOR 20 years on
0.0
5.0
10.0
15.0
20.0
25.0
30.0
35.0
40.0
Gas P
rod
uced
(m
mscf/
d)
Year
Monan Gas Production Predictions vs Actuality
Predicted
Actuality
0.0
2.0
4.0
6.0
8.0
10.0
12.0
14.0
Oil P
rod
uced
(m
bd
)
Year
Monan Oil Production Predictions vs Actuality
Predicted
Actuality
0.0
0.2
0.4
0.6
0.8
1.0
1.2
1.4
1.6
Wate
r P
rod
uced
(m
bd
/d)
Year
Monan Water Production Predictions vs Actuality
Predicted
Actuality
Rev 0 © Asset Development and Improvement Limited 2015 – all rights reserved Page 22 of 23
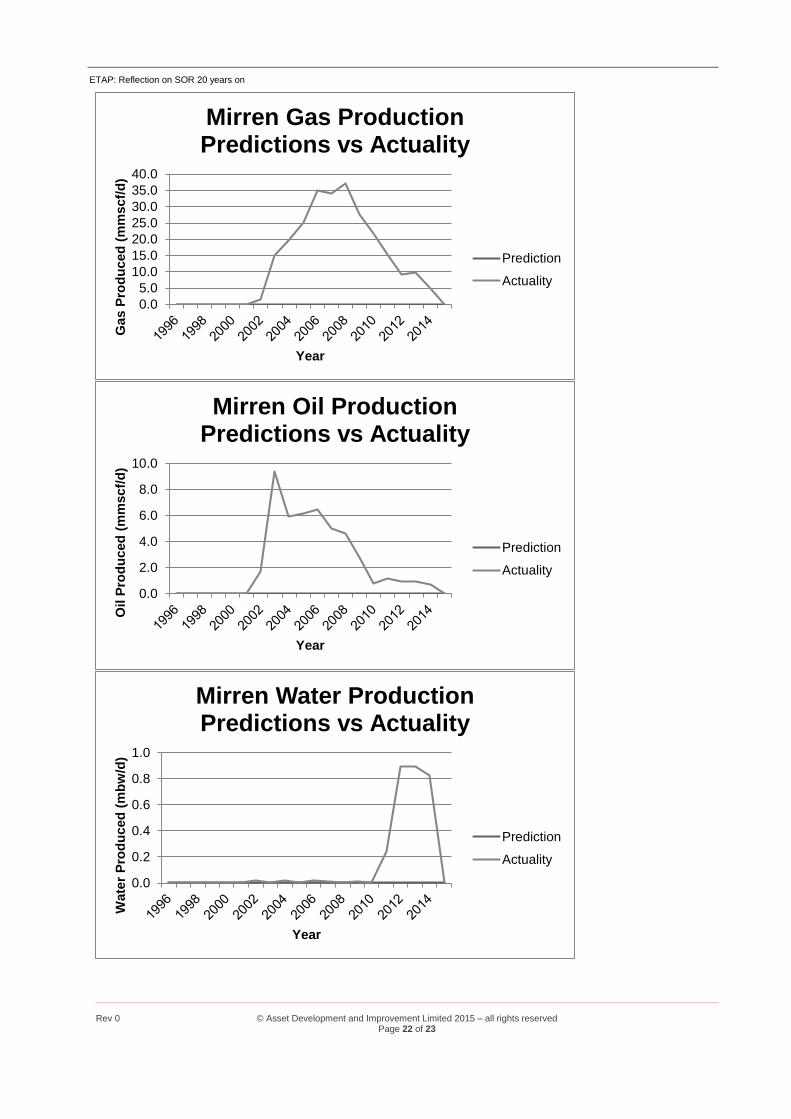
ETAP: Reflection on SOR 20 years on
0.0
5.0
10.0
15.0
20.0
25.0
30.0
35.0
40.0
Gas P
rod
uced
(m
mscf/
d)
Year
Mirren Gas Production Predictions vs Actuality
Prediction
Actuality
0.0
2.0
4.0
6.0
8.0
10.0
Oil P
rod
uced
(m
mscf/
d)
Year
Mirren Oil Production Predictions vs Actuality
Prediction
Actuality
0.0
0.2
0.4
0.6
0.8
1.0
Wate
r P
rod
uced
(m
bw
/d)
Year
Mirren Water Production Predictions vs Actuality
Prediction
Actuality
Rev 0 © Asset Development and Improvement Limited 2015 – all rights reserved Page 23 of 23
ETAP: Reflection on SOR 20 years on
Acknowledgements In preparing this post I have tried to contact original participants. Given the passage of time this has been hard (a few are on LinkedIn; many are not). Some participants finished their work on the publication of the SoR; others came in with the approval of the project, many have changed roles. I have been able to contact Jon Suller. A lot has happened in the 10 years since we signed off the document. I recall some great times in doing the concept work in the UK. All those involved should be quite proud that we did not do too badly in our predictions. Rory Smyth prepared the METOCEAN stats. I mention this specifically because one of the trials during define was to challenge basis of design of the indirect cooling medium system. All around the world there are people who have been (and now automated equipment) recording all sorts of actual weather readings for many many years. Nowadays readings mainly come from airports but satellites also play a role. Specialists in our industry have to interpret this data for practical use and have to interpolate to the specific field area. This post gives me the opportunity to thank all those involved in the day-to-day tasks of collecting basic weather data. Reflections I reflect on a few things in preparing this post. Very early on in my career my manager at the time said "Mr Wells (they called you mister in those days) here is the contents list for a project SoR we have been asked to deliver - please do a study on such-and-such a potential project with so-and-so as your client". Of course I thought I was smarter and tried to write up my own project SoR in a different way; it did not work. So this is definitely a very belated thank-you to Eugene, Dick, Martin, Richard and others who were amongst the many SoR mentors I had in my early days in the industry. I note that the SoR I worked on in 1995 had essentially the same contents list that I was provided at the very start of my career. I have also been able to reflect that the work undertaken ten years ago in this project was something a forerunner for ADIL’s Accelerated Conceptual Engineering (ACE) service that we deliver for clients. Interested in knowing more? I did wonder about approaching BP regarding any thoughts they had on the performance of ETAP over the years. I did contact BP Craig Campbell who advises that there is now a bolt replacement project underway on the CPF and Mungo. Well if that’s the major issue then we did not do too badly.