Embed Size (px)
Citation preview

Page 1 of 12
The ET & MPH Equations Earles L. McCaul
June 2014
1. The relationships between a vehicle’s horsepower (HP) and weight (WT) ratios and its quarter-mile elapsed time (ET) and trap speed (MPH) can be mathematically represented using the POWER equation:
( )BXAY ⋅=
where A is a ‘scaling’ coefficient, B is the ‘power’ or exponent coefficient, and X and Y are respectively the known ‘input’ and unknown ‘output’ variables. 2. There are two similar equations, one for determining ET and one for determining MPH:
31
31
WTHP%VKVMPH
HP%TWTKTET
⎟⎠
⎞⎜⎝
⎛ ⋅⋅=
⎟⎠
⎞⎜⎝
⎛⋅
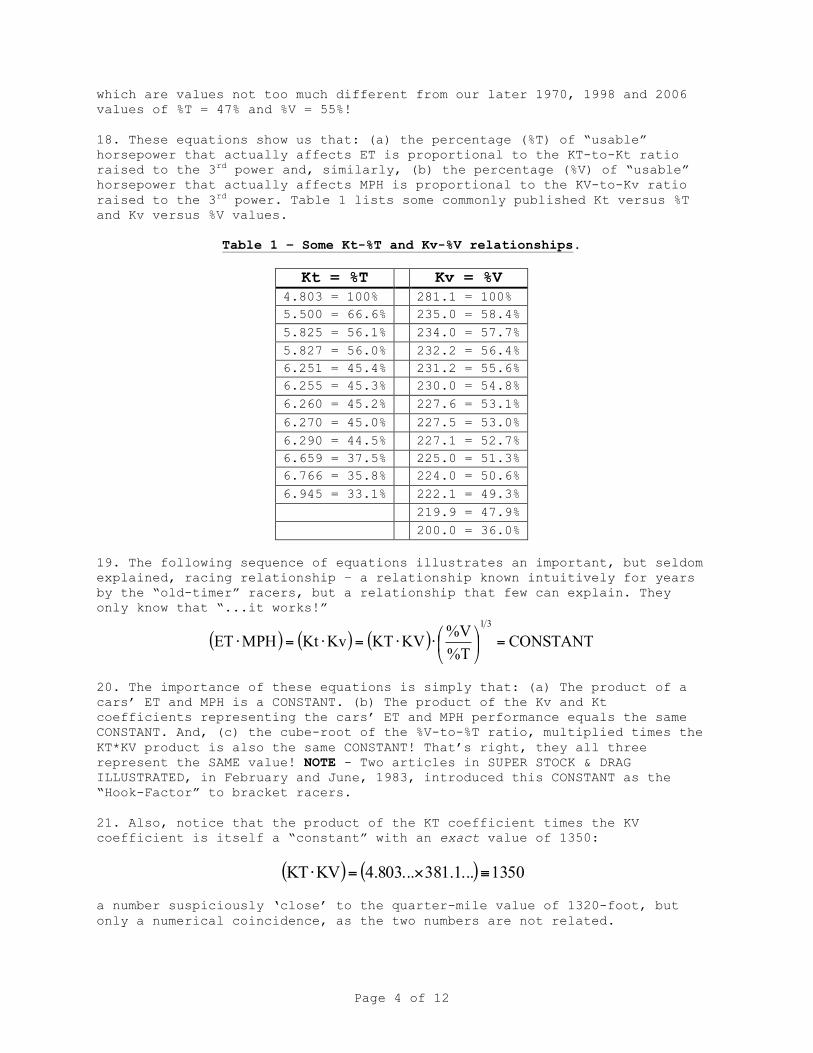
⋅=
where KT and KV are the scaling coefficients, 1/3 is the power coefficient, and the known variables are the ratios of horsepower-to-weight, with ET using a WT-to-HP ratio and MPH using a reciprocal HP-to-WT ratio. 3. The %T and %V values represent, respectively, the percentage of engine HP actually affecting ET and the percentage of engine HP actually affecting MPH. Engine HP is ‘net’ and is measured at the driving (rear or front) wheels. Thus, %T and %V show the power “effectiveness” between making-ET and making-MPH. Depending upon the type of transmission, the effective HP available at the driving wheels (net HP) is typically about 15-18% less than the advertised or gross HP measured at the flywheel. 4. The KT scaling coefficient is a TIME constant of proportionality that represents the combination of quarter-mile distance (1320 feet), gravity (32.17 feet-per-second-squared) and horsepower (550 lbf-ft per second):
4.803...4.8028115355032.17
132089KT
312
≈=⎟⎟⎠
⎞⎜⎜⎝
⎛
⋅⋅=
5. The KV scaling coefficient is a VELOCITY constant of proportionality that represents the combination of miles-per-hour (in feet-per-second), gravity (32.17 feet-per-second-squared), quarter-mile distance (1320 feet) and horsepower (550 lbf-ft per second):
( ) 281.1..281.08535.550132032.1738860KV 31 ≈=⋅⋅⋅⋅⎟⎠
⎞⎜⎝
⎛=
6. Substituting the KT and KV constant values into the ET and MPH equations yields:

Page 2 of 12
31
31
WTHP%V1.812MPH
HP%TWT4.803ET
⎟⎠
⎞⎜⎝
⎛ ⋅⋅=
⎟⎠
⎞⎜⎝
⎛⋅
⋅=
7. By mathematical rearrangement, the %T and %V variables can be separated from the HP and WT ratio inputs:
3131
3131
WTHP
1%V281.1MPH
HPWT
%T14.803ET
⎟⎠
⎞⎜⎝
⎛⋅⎟⎠
⎞⎜⎝
⎛⋅=
⎟⎠
⎞⎜⎝
⎛⋅⎟⎠
⎞⎜⎝
⎛⋅=
and then backsolved to yield the %T and %V values:
WTHP
!
"#
$
%&⋅KTET!
"#
$
%&3
=%T
WTHP
!
"#
$
%&⋅MPHKV
!
"#
$
%&3
=%V
8. We can determine the %T and %V values in two ways, by either backsolving from known ET/MPH/WT/HP data for similar cars, or by backsolving from existing published empirically-derived ET and MPH equations. 9. An example of backsolving from similar cars would be the comparison of performance specifications of similar cars. For instance, let’s compare some “muscle” cars: a 1970 Plymouth AAR ‘Cuda 340-6BBL, a 1998 Ford SVT Cobra Mustang and a 2006 Dodge Charger R/T-Hemi. 10. First, we use the performance numbers for the 1970 AAR ‘Cuda: WT = 3585 lbs, HP = 290 hp, ET = 14.30 seconds, and MPH = 99.5 mph:
%T = 3585lbs290hp
!
"#
$
%&⋅
4.80314.30sec!
"#
$
%&3
= 0.4684 ≈ 47%
%V = 3585lbs290hp
!
"#
$
%&⋅99.5mph281.1
!
"#
$
%&3
= 0.5482 ≈ 55%
11. Next, we use the performance numbers for the 1998 SVT Cobra Mustang: WT = 3739 lbs, HP = 320 hp (est.) (rated 305 hp), ET = 13.99 seconds, and MPH = 101.6 mph:
55%0.5517281.1
101.63203739%V
47%0.4728sec13.99
4.8033203739%T
3
3
≈=⎟⎠
⎞⎜⎝
⎛⋅⎟⎟⎠
⎞⎜⎜⎝
⎛=
≈=⎟⎠
⎞⎜⎝
⎛⋅⎟⎟⎠
⎞⎜⎜⎝
⎛=
mphhplbs
hplbs

Page 3 of 12
12. Then, we use the performance numbers for the 2006 Charger R/T-Hemi: WT = 4131 lbs, HP = 345 hp, ET = 14.10 seconds, and MPH = 100.9 mph:
55%0.5538281.1
100.93454131%V
48%0.4825sec14.10
4.8033454131%T
3
3
≈=⎟⎠
⎞⎜⎝
⎛⋅⎟⎟⎠
⎞⎜⎜⎝
⎛=
≈=⎟⎠
⎞⎜⎝
⎛⋅⎟⎟⎠
⎞⎜⎜⎝
⎛=
mphhplbs
hplbs
13. From these values, we see that the %T value for muscle cars is about 47% and the %V value is about 55%. These numbers indicate that only about HALF of the ‘effective’ engine horsepower available at the rear wheels is actually being used, with only about 47% going to make ET and only about 55% going to make MPH. 14. The second method of determining %T and %V values is from existing published empirical equations. Such equations are typically based upon mathematical analyses of the ET, MPH and HP-to-WT values collected during car tests. Unfortunately, however, such equations often contain ‘everything’ from full-race cars to pure-stock cars, and thus are truly “average” representations. Additionally, these empirically derived equations do not separately show the %T and %V values because they are embedded within the ‘scaling’ coefficients. This means we have to manually extract the %T and %V values from the published KT and KV coefficient constant values. 15. By letting Kt and Kv represent, respectively, the published ‘scaled’ KT and KV constants, the %T and %V values can be determined using the following relationships:
%V281.1Kv
KVKv
%TKt4.803
KtKT
33
33
=⎟⎠
⎞⎜⎝
⎛=⎟⎠
⎞⎜⎝
⎛
=⎟⎠
⎞⎜⎝
⎛=⎟⎠
⎞⎜⎝
⎛
16. For example, let’s examine the “original” ET and MPH equations that the late Roger Huntington developed and published back in the early 1960s:
31
31
WTHP224MPH
HPWT6.29ET
⎟⎠
⎞⎜⎝
⎛⋅=
⎟⎠
⎞⎜⎝
⎛⋅=
where Kt = 6.29 and Kv = 224. 17. Thus, for the high-performance cars that Mr. Huntington tested in 1960s, we find the %T value was about 45% and %V was about 50%:
%515060.0281.1224%V
%454452.06.294.803%T
3
3
≈=⎟⎠
⎞⎜⎝
⎛=
≈=⎟⎠
⎞⎜⎝
⎛=
Page 4 of 12
which are values not too much different from our later 1970, 1998 and 2006 values of %T = 47% and %V = 55%! 18. These equations show us that: (a) the percentage (%T) of “usable” horsepower that actually affects ET is proportional to the KT-to-Kt ratio raised to the 3rd power and, similarly, (b) the percentage (%V) of “usable” horsepower that actually affects MPH is proportional to the KV-to-Kv ratio raised to the 3rd power. Table 1 lists some commonly published Kt versus %T and Kv versus %V values.
Table 1 – Some Kt-%T and Kv-%V relationships.
Kt = %T Kv = %V 4.803 = 100% 281.1 = 100% 5.500 = 66.6% 235.0 = 58.4% 5.825 = 56.1% 234.0 = 57.7% 5.827 = 56.0% 232.2 = 56.4% 6.251 = 45.4% 231.2 = 55.6% 6.255 = 45.3% 230.0 = 54.8% 6.260 = 45.2% 227.6 = 53.1% 6.270 = 45.0% 227.5 = 53.0% 6.290 = 44.5% 227.1 = 52.7% 6.659 = 37.5% 225.0 = 51.3% 6.766 = 35.8% 224.0 = 50.6% 6.945 = 33.1% 222.1 = 49.3%
219.9 = 47.9% 200.0 = 36.0%
19. The following sequence of equations illustrates an important, but seldom explained, racing relationship – a relationship known intuitively for years by the “old-timer” racers, but a relationship that few can explain. They only know that “...it works!”
( ) ( ) ( ) CONSTANT%T%VKVKTKvKtMPHET
31
=⎟⎠
⎞⎜⎝
⎛⋅⋅=⋅=⋅
20. The importance of these equations is simply that: (a) The product of a cars’ ET and MPH is a CONSTANT. (b) The product of the Kv and Kt coefficients representing the cars’ ET and MPH performance equals the same CONSTANT. And, (c) the cube-root of the %V-to-%T ratio, multiplied times the KT*KV product is also the same CONSTANT! That’s right, they all three represent the SAME value! NOTE - Two articles in SUPER STOCK & DRAG ILLUSTRATED, in February and June, 1983, introduced this CONSTANT as the “Hook-Factor” to bracket racers. 21. Also, notice that the product of the KT coefficient times the KV coefficient is itself a “constant” with an exact value of 1350:
( ) ( ) 1350381.1...4.803...KVKT ≡×=⋅
a number suspiciously ‘close’ to the quarter-mile value of 1320-foot, but only a numerical coincidence, as the two numbers are not related.

Page 5 of 12
22. To verify that these three equations are indeed “equal” we can simply ‘plug-in’ the AAR ‘Cuda numbers and observe the results:
( ) ( )( ) ( )
( ) ( ) 14231422.680.46840.5482281.14.803
%T%VKVKT
14231422.92230.066.185KvKt14231422.8599.514.30MPHET
3131
≈=⎟⎠
⎞⎜⎝
⎛⋅×=⎟⎠
⎞⎜⎝
⎛⋅⋅
≈=×=⋅
≈=×=⋅
23. What this relationship tells us – what the “old-timer” racers have known all along – is that, for a given HP-to-WT ratio, the BEST way to estimate ET or MPH is by using the two “...simple...” relationships:
ETCONSTANTMPH
MPHCONSTANTET ==
where CONSTANT is determined using any one of the above three equations. Yes, it truly IS that simple! 24. However, we first must understand what the correct CONSTANT values are. Returning to Huntington’s equations, we find that the CONSTANT value for the 1960’s high-performance cars that he tested was about 1409:
( ) ( ) 14091408.962246.29KvKt ≈=×=⋅ which is a value that coincides well with the NHRA racers’ “rule-of-thumb” that declares “...the product of your speed and time should equal 1400.” 25. The CONSTANT values for our later 1970 AAR ‘Cuda, 1998 SVT Cobra Mustang, and 2006 Charger R/T-Hemi vehicles are respectively 1423, 1421 and 1423:
( ) ( )( ) ( )( ) ( ) 14239.10010.14MPHET
14216.10199.13MPHET14235.9930.14MPHET
Hemi-R/T
Mustang SVT
CudaAAR'
=×=⋅
=×=⋅
=×=⋅
which implies a CONSTANT value of about 1420 for muscle cars. 26. The CONSTANT value is also a function of the cube-root of the ratio of the %V and %T values multiplied times the KT*KV constant 1350:
( ) ( )
31
31
%T%V1350CONSTANT
%T%VKVKTMPHET
⎟⎠
⎞⎜⎝
⎛⋅=
⎟⎠
⎞⎜⎝
⎛⋅⋅=⋅
Thus, CONSTANT (the product of ET-times-MPH) goes UP when %V is increased or %T is decreased and goes DOWN when %V is decreased or %T is increased, but stays the same when both %V and $T are increased or decreased by the SAME amount. Increases in %T are associated with better traction, higher gearing and more HP, while increases in %V are associated with better aerodynamics, lower gearing and, also, with more HP.

Page 6 of 12
27. In order for maximum acceleration (ET) and maximum speed (MPH) to occur simultaneously, the %V and %T values must be equal (example: assume %V = %T = 55%):
( ) ( ) 1350113500.550.551350
%T%V1350MPHET 31
3131
≡⋅=⎟⎠
⎞⎜⎝
⎛⋅=⎟⎠
⎞⎜⎝
⎛⋅=⋅
which means optimum performance occurs only when the vehicles’ ET*MPH value equals 1350. While, in reality, this ratio seldom occurs, full race vehicles often approach it when %T = 57% and %V = 58%. And, similarly, NHRA appears to use the values of %T = %V = 55%. Street cars (hi-performance, muscle and stock), however, with lower traction capabilities, typically have values of %T = 47% and %V = 55%. 28. Now, changing direction for a moment, have you ever wondered “Why?” many website HP calculators give you two, different, horsepower answers? This occurs when they get one answer from an ET equation and a different answer from an MPH equation, because they’re using the SAME ‘effective’ HP value for both equations. While this is OK for race vehicles where %T and %V are usually almost equal, it fails for vehicles where the %T and %V values are NOT equal, such as for street and stock cars. Use the appropriate %T and %V values and both the ET and MPH equations will yield the same HP answers (within round-off error limits). 29. For “race” cars (Super Stock and above), the %T and %V values are “almost” equal, that is %T = 57% and %V = 58%, so the HP equations become:
( )
( )
33
V
33
T
281.1MPH
0.58WT
KVMPH
%VWTHP
ET4.803
0.57WT
ETKT
%TWTHP
⎟⎠
⎞⎜⎝
⎛⋅⎟⎠
⎞⎜⎝
⎛=⎟⎠
⎞⎜⎝
⎛⋅⎟⎠
⎞⎜⎝
⎛=
⎟⎠
⎞⎜⎝
⎛⋅⎟⎠
⎞⎜⎝
⎛=⎟⎠
⎞⎜⎝
⎛⋅⎟⎠
⎞⎜⎝
⎛=
but, remember, NHRA uses the equal values of %T = %V = 55%. 30. For “street” cars, the %T and %V values range, respectively, between 40-50% and 50-60%, with typical “rule-of-thumb” values for today’s hi-performance and muscle cars being, respectively, 47% and 55%:
( )
( )
33
V
33
T
281.1MPH
0.55WT
KVMPH
%VWTHP
ET4.803
0.47WT
ETKT
%TWTHP
⎟⎠
⎞⎜⎝
⎛⋅⎟⎠
⎞⎜⎝
⎛=⎟⎠
⎞⎜⎝
⎛⋅⎟⎠
⎞⎜⎝
⎛=
⎟⎠
⎞⎜⎝
⎛⋅⎟⎠
⎞⎜⎝
⎛=⎟⎠
⎞⎜⎝
⎛⋅⎟⎠
⎞⎜⎝
⎛=
while “stock” street cars are, respectively, about %T = 40% and %V = 50%. 31. For the VERY quickest and fastest vehicles, however, the %T values change – they’re actually LOWER! For example, the 2004 NHRA Top Fuel winner “U.S. ARMY,” with WT = 2225 lbs, HP = 6700 hp(net) (7500 hp(gross) less 800 hp for blower), ET = 4.441 seconds, and MPH = 333.08 mph, has values of %T = 42% and %V = 55%:

Page 7 of 12
%550.5525281.1
333.0867002225%V
42%0.4201sec4.441
4.80367002225%T
3
3
≈=⎟⎠
⎞⎜⎝
⎛⋅⎟⎟⎠
⎞⎜⎜⎝
⎛=
≈=⎟⎠
⎞⎜⎝
⎛⋅⎟⎟⎠
⎞⎜⎜⎝
⎛=
mphhplbs
hplbs
with the main culprit for this reduction in %T being the poor initial power transfer and “smoking” wheel spin. Remarkably, the %V drops only slightly, from 58% down to 55%. 32. Table 2 summarizes some of the empirical ET and MPH equations that have been published over the years, along with their respective ET*MPH constants and corresponding Kt and %T and Kv and %V values.
Table 2 – Some published empirical ET and MPH equations.
CONSTANT Kt = %T Kv = %V source:
race 1293 5.500 66.6% 235.0 58.4% H & H Racing 1306 5.825 56.1% 224.2 50.7% E. L. McCaul 1350 5.801 56.8% 232.7 56.8% S & A 340 Handbook (*)
SS 1350 5.857 55.1% 230.5 55.1% NHRA (S/SS)
1353 5.827 56.0% 232.2 56.4% A. S. Martin & Sons 1361 6.050 50.0% 225.0 51.3% Geoffrey Fox/AJP
1363 5.825 56.1% 234.0 57.7% Patrick Hale/Qtr.Jr.
1369 5.825 56.1% 235.0 58.4% Ron Landry
hi-perf 1400 6.335 43.6% 221.0 48.6% HOT ROD Tech Tips
1409 6.290 44.5% 224.0 50.6% Roger Huntington
muscle 1413 6.124 48.3% 230.8 55.4% 2006 Charger R/T-Hemi 1421 6.165 47.3% 230.5 55.1% 1998 SVT Cobra Mustang 1423 6.185 46.8% 230.1 54.8% 1970 AAR‘Cuda 340/6BBL
1434 6.213 45.8% 230.7 54.5% Jeff Lucius/R&T (*)
stock 1435 6.274 44.9% 228.7 53.9% CD-2005 new cars (*) 1442 6.269 45.0% 230.0 54.8% Bob Fox/2000 new cars
1450 6.464 41.0% 224.3 50.8% CR-2006 new cars (*)
fuel 1479 6.413 42.0% 230.7 55.3% NHRA ’04 Top Fuel (NOTE: (*) = cubic approximation of non-cubic power)
33. Notice how “race” vehicles with ET*MPH constants in the 1300’s have %T values of about 56% (50%-67%), while “hi-performance” and “muscle” vehicles with ET*MPH constants in the low-1400’s have %T of about 47% (44%-48%), and “stock” cars with ET*MPH constants in the mid-1400’s have %T values of about 40% (40-45%). 34. Interestingly, for all vehicles, the %V values range between about 50% and 60%, with 58% being a fairly consistent average value for race cars, 55% for performance cars, and 50% for stock cars. 35. Table 3 lists some current 2005-2006 model year cars, along with their performance specs, ET*MPH constants, and %T and %V values. Notice how the ET*MPH constant numbers range between about 1400 and 1500. Curiously, the highest %T values belong to the two Ford Mustangs, while the lowest %T and %V values belong to the turbo-charged Cadillac STS-V.

Page 8 of 12
Table 3 – A few 2005 and 2006 cars and their performance specifications.
Vehicle HP WT ET MPH ET*MPH %T %V notes: Corvette Z06 505 3147 11.8 125 1475 42.0% 54.8% Viper SRT10 500 3450 12.1 121 1464 43.2% 55.0% Corvette 400 3300 12.8 112 1434 43.6% 52.2% Firepower 425 3400 12.8 112 1434 42.3% 50.6% 300C SRT8 425 4212 13.2 109 1439 47.7% 57.8%
Crossfire SRT6 330 3320 13.4 106 1420 46.3% 54.0% Magnum SRT8 425 4379 13.6 106 1442 45.4% 55.3% Mustang GT 300 3673 13.7 103 1411 52.8% 60.2% highest
Cadillac STS-V 440 4300 13.8 101 1394 41.2% 45.3% lowest M-B SLK 350 268 3260 13.9 102 1418 50.2% 58.1% Mazda MX-5 170 2425 15.2 91 1383 45.0% 48.4% Mustang V6 210 3444 15.3 91 1392 50.7% 55.6%
Pontiac Solstice 177 2877 16.3 89 1451 41.6% 51.6%
36. Combining the Table 3 numbers with our previous numbers suggests some typical Kt and Kv values for the very broad and general classifications of “race”, “NHRA”, “hi-performance” and “stock” cars, ie:
race %T = 57% = Kt = 5.793 ~ 5.79 %V = 58% = Kv = 234.5 ~ 235 NHRA %T = 55% = Kt = 5.857 ~ 5.86 %V = 55% = Kv = 230.5 ~ 231
hi-perf %T = 47% = Kt = 6.178 ~ 6.18 %V = 55% = Kv = 230.5 ~ 231 stock %T = 40% = Kt = 6.519 ~ 6.52 %V = 50% = Kv = 223.1 ~ 223
37. Using these typical Kt and Kv values, we can now generalize the following set of “rule-of-thumb” ET and MPH equations:
3131
3131
3131
3131
WTHP223MPH
HPWT52.6ETstock
WTHP231MPH
HPWT6.18ETperf-hi
WTHP231MPH
HPWT86.5ETNHRA
WTHP235MPH
HPWT5.79ETrace
⎟⎠
⎞⎜⎝
⎛⋅=⎟⎠
⎞⎜⎝
⎛⋅=
⎟⎠
⎞⎜⎝
⎛⋅=⎟⎠
⎞⎜⎝
⎛⋅=
⎟⎠
⎞⎜⎝
⎛⋅=⎟⎠
⎞⎜⎝
⎛⋅=
⎟⎠
⎞⎜⎝
⎛⋅=⎟⎠
⎞⎜⎝
⎛⋅=
38. But, remember, even THESE equations are only “approximations” for obtaining an “estimated” value, they can not provide exact values. For an exact value, you must calculate and use the appropriate Kt and Kv values derived specifically from the vehicle’s own ET, MPH and HP and WT numbers. However, when all of the vehicles performance numbers aren’t known, you can usually get close enough by using the closest, appropriate, equation. 39. If you don’t get approximately the same HP value (within 1-2%) from both the ET and MPH equations, the %T and %V values are probably incorrect. The following relationship is useful for checking and verifying your %T and %V versus ET and MPH values:

Page 9 of 12
3
1350MPHET
%T%V
⎟⎠
⎞⎜⎝
⎛ ⋅=
40. Similarly, if your ET*MPH product is not approximately the same (again, within 1-2%) as the calculated CONSTANT value, and you KNOW the WT value to be correct, then the HP value is probably incorrect. 41. For example, the 1998 Ford SVT Cobra Mustang, with its ET of 13.99 seconds and trap speed of 101.6 mph, has an ET*MPH value of 1421, but its test weight of 3739 pounds and rated 305 hp value yield a CONSTANT value of 1423:
14231422.620.470.551350CONSTANT
31
≈=⎟⎠
⎞⎜⎝
⎛⋅=
These values should be almost identical, but aren’t, which indicates something isn’t quite right. 42. So, substituting the muscle car “rule-of-thumb” values of %T = 47% and %V = 55%, we estimate the horsepower of the 1998 Ford Cobra engine to be closer to 320 hp:
( )
( ) 322hp321.99281.1
101.60.553739HP
322hp321.92sec13.99
4.8030.473739HP
3
V
3
T
≈=⎟⎠
⎞⎜⎝
⎛⋅⎟⎠
⎞⎜⎝
⎛=
≈=⎟⎠
⎞⎜⎝
⎛⋅⎟⎠
⎞⎜⎝
⎛=
mphlbs
lbs
43. In summary, the ET and MPH equations show us four important aspects of quarter-mile drag racing: (a) That only about 45%-55% of the effective (rear wheel) horsepower goes into producing ET. (b) That only about 50-55% of the effective (rear wheel) horsepower goes into producing MPH. (c) That ET-times-MPH is a CONSTANT value, with an optimum value of 1350. And, (d) that there is NO one, single, “universal” ET or MPH equation that “fits” all cars! So, does this mean that most of those website HP calculators are providing incorrect answers? Basically, yes.

Page 10 of 12
I. REFERENCES – Previously published ET and MPH equations: 01/58-Roger Huntington, ET = 6.29*(WT/HP)^(1/3)
ROD & CUSTOM Magazine, MPH = 224*(HP/WT)^(1/3) “Horsepower at the Drag Strip,” pp. 50-53.
03/73-Geoffrey T. Fox, PhD; ET = 6.05*(WT/HP)^(1/3) American Journal of Physics MPH = 225*(HP/WT)^(1/3) (AJP), Vol. 41, page 311. 11/73-E. L. McCaul, HOT ROD Magazine, HP = (WT*197)/ET^3 “Drag Strip Dyno,” p. 86. ET = 5.818*(WT/HP)^(1/3)
MPH = 232*(HP/WT)^(1/3) 08/74-E. L. McCaul, AWC, 1974 NHRA data. ET = 1305.8/MPH + 0.37476 ??/75-H & H Racing Booklet. ET = 5.50*(WT/HP)^(1/3) MPH = 235*(HP/WT)^(1/3) ??/75-S & A 340 Handbook. MPH = 225*(HP/WT)^(0.318) 02/83-Frank Maffiore & Bob Doerrer; 1320 = ET*MPH SUPER STOCK & DRAG ILLUSTRATED,
“The Hook Factor,” pp. 30-31. ??/85-HOT ROD Magazine, “Tech Tips” MPH = 221*(HP/WT)^(1/3) ??/86-Patrick Hale, “Quarter Jr.” ET = 5.825*(WT/HP)^(1/3) MPH = 234*(HP/WT)^(1/3) 10/00-Bob Fox, PhD; new 2000 cars. ET = 6.269*(WT/HP)^(1/3) MPH = 230*(HP/WT)^(1/3) ??/01-Bill Watson, website, 1400 = ET*MPH Volvo: “$15 dyno” MPH = 228.4*(HP/WT)^(1/3) 03/04-Jeff Lucius, website, ET = 6.9446*(WT/HP)^(0.2841) ROAD & TRACK data. MPH = 219.87*(HP/WT)^(0.3138) ??/04-Ron Landry, website. ET = 5.825*(WT/HP)^(1/3) MPH = 235*(HP/WT)^(1/3) ??/05-A. S. Martin & Sons, website. ET = 1353/MPH MPH = 232.2*(HP/WT)^(1/3) ??/14-NRHS Performance, website. ET = 5.92*(WT/HP)^(1/3) MPH = 223*(HP/WT)^(1/3) 1320 = ET*MPH 01/11-Formulas, “RPMoutlet.com” ET = 1353/MPH

Page 11 of 12
II. EQUATIONS
803.4...80281153.455032.17
132089KT
312
≈=⎟⎟⎠
⎞⎜⎜⎝
⎛
⋅⋅=
( ) 281.1..281.08535.550132032.1738860KV 31 ≈=⋅⋅⋅⋅⎟⎠
⎞⎜⎝
⎛=
3131
WTHP%V1.281MPH
HP%TWT4.803ET ⎟
⎠
⎞⎜⎝
⎛ ⋅⋅=⎟
⎠
⎞⎜⎝
⎛⋅
⋅=
31313131
WTHP
1%V281.1MPH
HPWT
%T14.803ET ⎟
⎠
⎞⎜⎝
⎛⋅⎟⎠
⎞⎜⎝
⎛⋅=⎟⎠
⎞⎜⎝
⎛⋅⎟⎠
⎞⎜⎝
⎛⋅=
33
KVMPH
HPWT%V
ETKT
HPWT%T ⎟
⎠
⎞⎜⎝
⎛⋅⎟⎠
⎞⎜⎝
⎛=⎟⎠
⎞⎜⎝
⎛⋅⎟⎠
⎞⎜⎝
⎛=
33
281.1Kv%V
Kt4.803%T ⎟
⎠
⎞⎜⎝
⎛=⎟⎠
⎞⎜⎝
⎛=
( )( ) 3131 %V281.1Kv
%T4.803Kt ⋅==

Page 12 of 12
3131
WTHP%VKVMPH
HP%TWTKTET ⎟
⎠
⎞⎜⎝
⎛ ⋅⋅=⎟
⎠
⎞⎜⎝
⎛⋅
⋅=
( ) ( ) ( ) CONSTANT%T%VKVKTKvKtMPHET
31
=⎟⎠
⎞⎜⎝
⎛⋅⋅=⋅=⋅
( ) ( ) 1350281.1...4.803...KVKT ≡×=⋅
( )31
%T%V1350CONSTANTMPHET ⎟
⎠
⎞⎜⎝
⎛⋅==⋅
ETCONSTANTMPH
MPHCONSTANTET ==
( ) ( )
3
V
3
T KVMPH
%VWTHP
ETKT
%TWTHP ⎟
⎠
⎞⎜⎝
⎛⋅⎟⎠
⎞⎜⎝
⎛=⎟⎠
⎞⎜⎝
⎛⋅⎟⎠
⎞⎜⎝
⎛=
( ) ( )
3
V
3
T KvMPHWTHP
ETKtWTHP ⎟
⎠
⎞⎜⎝
⎛⋅=⎟⎠
⎞⎜⎝
⎛⋅=
ETKt
WTHP
KvMPH
1350MPHET
%T%V 313
=⎟⎠
⎞⎜⎝
⎛=⎟⎠
⎞⎜⎝
⎛ ⋅=
( ) ( )
⎟⎠
⎞⎜⎝
⎛
⎟⎠
⎞⎜⎝
⎛ ⋅
=
⎟⎠
⎞⎜⎝
⎛
⎟⎠
⎞⎜⎝
⎛ ⋅
=
KVMPHLog
WTHP%VLog
exp
ETKTLog
WTHP%TLog
exp VT