Embed Size (px)
Citation preview
THE IMPACT OF SOAP OPERAS
ON VIEWERS
Thesis for the Degree of M. A.
MICHIGAN STATE UNIVERSITY
' MITZI BOND.
l 9 75

WWIHHIIWHWH“Wilflfllflw3 1293 10
3:. V". >' ' f‘ :“f‘ 9 I'm.3
4.1 T ' ' t L'
5."; I" _ . " 3" ' ino..- ,.. .,.:‘ .gv.oa «Jiv
a.
r- .
"'. 4“ a. T .V‘. k”c r , e . ., .
4' '. I' .‘:l. .1 'v ' V *3 g 3. ‘3‘“. m .3... e305')" ‘ L ‘ '
wsfififlp Ava-m 13 '65' 453.5 4' $1.5. a“. ‘y

ABSTRACT
THE IMPACT OF SOAP OPERAS ON VIEWERS
BY
Mitzi Bond
The purpose of this study was to examine viewers'
and nonviewers' perceptions of the reality of soap opera
characters and content, to explore viewers' degree of
interaction, identification, and involvement with soap
operas, and to identify functions satisfied by watching
daytime serials.
Four hypotheses were tested concerning the rela-
tionships among ten variables. The independent variable
was viewing; the intervening variable was perceived reality;
and the dependent variables were knowledge of program con-
tent, involvement, interaction, identification, companion-
ship, escapism, boredom, and social utility.
The following are hypotheses tested in this study:
H1: The higher the amount of viewing, the
greater the perceived reality.
H2: The higher the amount of viewing, the
more knowledge the viewer will have
about program content.

Mitzi Bond
H3: The higher the amount of viewing, the
greater the viewer's involvement, inter-
action, and identification.
H4: The higher the amount of viewing, the
more functions watching soap operas
will satisfy.
A telephone survey was conducted in Lansing,
Michigan, in August, 1974. Five hundred fifty numbers
were randomly chosen from the Lansing telephone directory
and questionnaires were completed by 272 respondents.
Hypotheses were confirmed for the following cri-
terion variables. As the amount of viewing increased,
(1) perceived reality increased, (2) knowledge of soap
opera content increased, (3) involvement increased,
(4) identification increased, (5) interaction increased,
and (6) social utility increased.
As an intervening variable, perceived reality shows
that as the amount of viewing time increases, and perceived
reality increases, the viewer will have (1) more interac-
tion with soap opera characters and content, and (2) more
relief from boredom from the serials.
Hypotheses were not confirmed for an increase in
companionship, escapsim, and relief of boredom as viewing
increased.

Accepted by the faculty of the Department of
Communication, College of Communication Arts, Michigan
State University, in partial fulfillment of the
requirements for the Master of Arts degree.
Dirgfit of TEFsis
Guidance Committee: W42 , Chairman
é/Wm/
I
L.
/

THE IMPACT OF SOAP OPERAS
ON VIEWERS
BY
Mitzi Bond
A THESIS
Submitted to
Michigan State University
in partial fulfillment of the requirements
for the degree of
MASTER OF ARTS
Department of Communication
1975

ACKNOWLEDGMENTS
Deepest appreciation goes to the author's adviser,
Dr. Bradley Greenberg, whose time, patience, and criticisms
were most valuable in conduction of the research and in
preparation of the thesis. Special recognition goes to
two other committee members, Dr. Erwin Bettinghaus and
Dr. Edward Pink, for their assistance and review of the
thesis.
The author also appreciates the time and energy
given by Barbara Brooks, Robert McPhee, Sharon Reinert,
Cheryl Oliver, Jan Bidwell, Viola Morris, Stephanie
Robinson, Gloria Bettinson, and Katherine Smith in col-
lection of the data.
An inspirational thank you goes to Sherrie Mazingo
and a special thank you to David Anderson.
ii

LIST OF
Chapter
I.
II.
III.
TABLE OF CONTENTS
TABLES . . . . . . . . .
INTRODUCTION . . . . . .
TV Soap Opera History.
Production Costs . .
Literature Review. .
Soap Opera Reality and
METHODS. . . . . . . . .
Pretest and Questionnaire
Administration . .
Gratifications.
Respondents and Their Community.
Demographics and Viewing
Operational Definitions.
Independent Variable
Perceived Reality. .
Knowledge. . . . . .
Involvement. . . . .
Identification . . .
Interaction. . . . .
Functions. . . . . .
Analysis . . . . . .
RESULTS. . . . . . . . .
Perceived Reality. .
Knowledge. . . . . .
Involvement, Interaction, and
Identification . .
iii
Page
23
25
25
27
29
29
36
37
40
40
42
44
46
46
48
49

TABLE OF CONTENTS (cont'd.)
Chapter Page
Boredom, Companionship, Escapism,
and Social Utility . . . . . . . . . . 50
Perceived Reality Correlations . . . . . 51
Partial Correlations . . . . . . . . . . 54
One-Way Analysis of Variance . . . . . . 56
IV. SUMMARY AND DISCUSSION . . . . . . . . . . . 60
Study Weaknesses . . . . . . . . . . . . 64
Directions for Future Research . . . . . 65
New Hypotheses . . . . . . . . . . . . . 67
Postscript . . . . . . . . . . . . . . . 69
APPENDICES
A. SOAP OPERA QUESTIONNAIRE . . . . . . . . . . 70
B. SOAP OPERA STUDY . . . . . . . . . . . . . . 80
C. ONE-WAY ANALYSIS OF VARIANCE . . . . . . . . 91
D. CURRENT SOAP OPERA (JANUARY 1975)
1973 NIELSEN SOAP OPERA RATINGS. . . . . . 93
BIBLIOGRAPHY . . . . . . . . . . . . . . . . . . . . 95
iv

Table
10.
11.
12.
13.
14.
LIST OF TABLES
Demographics of Viewers and Nonviewers
(Chi-Square Test). . . . . . . . . . . .
Demographics and Amount of Viewing
(Chi-Square Test). . . . . . . . . . . . .
Perceived Reality Correlations (Total Sample)
Perceived Reality Correlations (Viewers) . .
Perceived Reality Correlations (Nonviewers).
Perceived Reality Item Frequency . . . . . .
Perceived Reality Score Frequency. . . . . .
Knowledge. . . . . . . . . . . . .-. . . . .
Involvement, Identification, and Interaction
(Intercorrelations). . . . . . . . . . . .
Involvement, Identification, and Interaction
(Frequency). . . . . . . . . . . . . . . .
Functions. 0 O O O 0 O O O O O O O O O O O 0
Viewing and Perceived Reality. . . . . . . .
Viewing and Involvement, Interaction,
and Identification . . . . . . . . . . . .
Viewing and Functions. . . . . . . . . . . .
Page
26
28
31
32
33
34
35
38
39
41
43
47
50
51

LIST OF TABLES (cont'd.)
Table
15. Perceived Reality Correlations
(High and Low PRTV Viewers). . . .
16. Perceived Reality Correlations
(Shows—Episodes) . . . . . . . . .
l7. Partial Correlations
(Viewing by Perceived Reality) . .
18. Partial Correlations
(Viewing by Dependent Variables,
Controlling for Perceived Reality)
19. Overall Correlations . . . . . . . .
Cl. One-Way Analysis of Variance
(Viewing-Shows). . . . . . . . . .
C2. One-Way Analysis of Variance
(Viewing-Episodes) . . . . . . . .
D1. Current Soap Operas (January, 1975).
D2. 1973 Nielsen Soap Opera Ratings. . .
vi
Page
52
53
55
55
58
91
92
93
94

CHAPTER I
INTRODUCTION
Soap Operas are the literary products of the
electronic media. They are simply literature to be seen
and not to be read. These serials have central characters
with whom the viewer can often identify, whose life could
be followed, whose problems could be seen, and with whom
the viewer could establish something like a friendship.
Their attraction or addiction is based on audience curi-
osity about and interest in what will happen to the various
characters.
James Thurber's definition of soap operas is
‘perhaps the one most often quoted:
A soap opera is a kind of sandwich, whose
recipe is simple enough, although it took
years to compound. Between thick slices
of advertising, spread twelve minutes of
dialogue, add predicament, villainy, and
female suffering in equal measure, throw
in a dash of nobility, sprinkle with tears,
season with organ music, cover with a rich
announcer sauce, and serve five times a
week.

The dictionary yields a more precise definition:
"soap opera--a radio or television serial drama performed
usually on a daytime commercial program and chiefly char-
acterized by stock domestic situations and often melodra-
matic or sentimental treatment."
However, soap operas really need no definition.
Any television viewer and most nonviewers are familiar
with the daily daytime dramas portraying domestic dilemmas.
TV Soap Opera History1
This study is concerned with the television serials,
the first of which was introduced in 1946. 'A single epi-
sode of Big Sister was televised and a full-scale serial,
A Woman to Remember, aired in 1947. Both failed. Three
years later CBS experimented with The First Hundred Years.'
It missed its mark by 99 years.
There were many obstacles that denied success to
the early television soap Opera. First there was cost.
Producing a serial for television was more complicated
than producing one for radio. The weekly cost of producing
lMadeleine Edmondson and David Rounds, The Soaps:
Daytime Serials of Radio and TV (New York, 1973), pp. 130-
140.
a fifteen-minute daily television serial was $8650, as
opposed to $3500 for a radio serial.- Production also pre-
sented problems. Places and people were now right there
on the television screen, so sets had to be built and
actors appropriately costumed. All props mentioned in
the script actually had to be on the set.
TV soaps were too expensive to produce until CBS
experimented with a new length--the half hour. Production
costs for one half-hour episodes were far lower than those
of two fifteen-minute episodes for different shows, and the
amount of time available to be sold for commercials was un-
changed. Lengthening the soap episode therefore made sense
for the network, and it turned out to have a delightfully
unexpected side effect as well--viewers approved the new
length.
The very early television serials were-almost in-
distinguishable from radio serials. The visual aspect of
the new medium turned out not to be as crucial as had been
feared. Soaps had always been largely domestic so it was
possible to limit most of the action to easily-built indoor
sets. Early television soaps even kept the announcer, that
useful intruder who was so helpful in-commenting on the

action and directing the attention of the audience to the
most fruitful themes of future interest.
Production Costs2
The average soap Opera in 1973 cost about $60,000 a
week to produce (The Young and the Restless is the most ex-
pensive at $70,000) compared to an average $100,000 for a
single half-hour in prime time. To update Thurber's defi-
nition of soaps, the serials consist of 22 minutes of dia-
logue (with the exception of Another World which expanded
to 60 minutes 6 January 1975). The director of a solid
running TV soap makes $2000 a week and the head script
writer makes about $3000 a week.
In 1970, CBS's two-decade hold on daytime TV rat-
ings was an accepted fact of life supported by the Nielsen
ratings. That year CBS racked up $162 million in daytime
sales compared to NBC's $100 million and ABC's $85 million.
However, during the next three years, NBC and ABC intro-
duced new soaps of their own and turned the competition
into a three-way race. From January to May 1973, CBS
2"Real Drama in Daytime: The Networks' Battle for
Dominance," Journal of Broadcasting, 2 July 1973, p. 17.

chalked up $68 million in daytime sales, NBC $61 million,
and ABC $47 million. (One of the reasons for ABC's rela-
tively poor showing is that it only sends out five hours of
daytime programming, whereas NBC and CBS each sends out six
hours.)
The cost-per—minute figures (i.e., how much an ad—
vertiser must pay for a one-minute commercial) depend on
the ratings of the soap opera and on the demographic break-
down of those ratings. By 1973 the most lucrative serial
on the air was CBS's As the World Turns, now in its twen-
tieth year, which was priced at $19,600 a commercial minute.
NBC's Another World, The Doctors, and Days of Our Lives
were priced at $13,600 a minute, $12,400, and $12,200 re—
spectively. For ABC, General Hospital costs $12,400 a
minute compared to $11,200 for All Minhildren and $10,800
for One Life to Live. Advertisers have to pay more to get
their messages on soap operas than on game shows because
the serials attract a higher percentage of women between
the ages of 18 and 49--the most desirable demographic
target for daytime sponsors (and for nighttime sponsors).

Literature Review
One of the earliest studies concerning soap operas
was conducted by Herta Herzog (1942) in Iowa, New York, and
Pittsburgh. A preliminary study based on 100 intensive
interviews suggested three major types of gratification
experienced by listeners to daytime serials: l) emotional
release--the chance to cry because of happy or sad events
in the characters' lives; 2) wishful thinking--the listeners
"drowned" their troubles in listening to the events por-
trayed in the serials; and 3) sources of advice--the ser-
ials teach the listeners appropriate patterns of behavior
and how to handle situations that may turn up in their own
lives. Herzog found that the less formal education a woman
has, the more she is likely to consider these programs
helpful and that less-educated women have fewer sources
from which to learn "how to win friends and influence
people" and are therefore more dependent upon daytime
serials for this gratification.
Sociologist Nora Scott Kinser (1973) attempted to
dissect soap opera characters to show why viewers get mes-
merized. Millions are intimately involved with the lives
and problems of their favorite assortment of soap opera

heroes, heroines, villains, and villainesses. They write
letters to fan magazines anxiously inquiring about the per-
sonal lives of the stars, threatening mass defection should
Mark marry Susy and leave Mamie, weeping over the death of
a special character, and pouting about an actor who has
been replaced. Sometimes their passions even spill over
into real life. Eileen Fulton, who plays Lisa Shea of Ag
the World Turns, once fled in terror from the appliance
section of a large department store after watching a taped
segment of her show and listening to women customers mutter
how much they hated Lisa and wanted to kill her. On another
occasion a woman asked her if she was Lisa Shea. When she
said "yes" and began searching for a pencil to write an
autograph, the fan began cursing Lisa and beating her with
a purse.
How do the soap operas entice such audience involve—
ment? To answer this, Kinser developed a typology of soap
opera characters. Kinser typology:
characters
good bad
good good-bad good-bad
characters
bad bad-good bad-good

In most soap operas the good-good is usually a motherly-
grandmotherly type to whom all the other characters tell
their respective tales of woe. The typical bad-bad is an
out-and-out thoroughly mean witch who always causes trouble
and ruins the lives of the other characters. The good-bad
is a baddie who turns out to have a good side while the
bad-good is a goodie with a bad side. Part of the fun of
soap operas lies in the fact that the audience usually
knows that the supposed bad-bad is really a bad-good or a
good-bad long before the good-goods realize what is happen-
ing. But the immense popularity of the soaps is a complex
affair. While their lusty plots titillate fans' daydreams,
their chaos and affliction make the viewer's dull life seem
well—ordered and safe by comparison. Is it any wonder fans
shrieked when the Senate Subcommittee on the Watergate pre-
empted their soaps?
LaPota and LaPota (1973) suggest the study of the
soap opera in the classroom as an attempt to broaden the
spectrum of teaching and learning strategies and to promote
the discovery of a whole new vein of human skills. The
daytime serial is a true literary product of the electronic
media. Some authorities believe the soap Opera is already
the literature of millions of Americans. Estimates run

from 10- to 30-million viewers in the United States who
daily watch one or more daytime serials. That is a very
respectably sized audience that depends on nonprinted
material to experience another man's version of the human
experience. And that is what literature basically is.
LaPota and LaPota make three functional observa-
tions about soap opera content.
Values perceived in the soap opera.--(l) It re—
flects a particular aspect of contemporary American life:
primarily the white, Protestant, middle to upper middle
class life style. (2) It is valid to say there is no "typ-
ical" soap opera viewer because of the wide spectrum in age
group, education, and economic standing represented in the
audience. (3) The traditional values of the American de-
mocracy are upheld. Reliance on the judicial system,
stress on law and order, belief in free enterprise, and
duties and responsibilities of citizenship are reflected
frequently in the episodes. Any character who breaks the
law is eventually punished. (4) The American Judaic-
Christian moral values are mirrored. Sin is to be avoided,
but if that is not possible the commission of sin is always
punished in some way; virtue is rewarded in the long run.

10
(5) The economic value system in the soap opera is a dis-
torted picture of the American world of work.
The soap opera as a tool for social and-political
change.--The soap Opera has been a demythicizer and breaker
of subject matter taboo. Apparently producers and writers
of soaps are making conscious efforts to explore objec-
tively certain conservative political and social convic-
tions (e.g., abortion, atheism, alcoholism, sex discrimi-
nation). Characters with points of view and attitudes in
opposition to the conservative are presented as sincere,
thoughtful people operating from their own individuality,
rational convictions, and value systems.
The soapAOpera as an art form.--(l) The structure
of the soap opera is that of continuing episodes without
beginning, middle, and end. It maintains its unity through
a rather permanent cast of characters, permanent settings,
and a theme or variations of one theme. (2) The form of
the soap opera is unique in three ways: the emphasis on
dialogue instead of action, the "slower-than-life“ pace and
movement, and the reviewing of what-happened-yesterday that
often occupies as much as five of the approximate 22
minutes of plot time. (3) Because of its leisurely pace,
the soap opera is allowed time for detailed develOpment of

11
characters, numerous subplots and incidental action, and
the minutiae so often found in real life. (4) Conflict in
all ranges of human problems and emotions keeps the plot
and subplots constantly at a boil. (5) The standard lit-
erary devices most frequently used in the soap opera are
the flashback, interior monologue, and dream sequence.
Figurative language is confined mostly to dramatic irony.
(6) There is little humor in the lives of the characters.
Although tragedy does occur, the survivors usually manage
to work out satisfactory lives eventually.
Katzman (1973) examined the size and character—
istics of the soap opera audience, the situations the soaps
portray, and the characters that populate them, and dis-
cusses some potential implications of all those.
On the average, every adult viewer in the United
States sees two hours of soap Operas-every week. The
growth in viewer-hours can be explained almost totally as
a function of the steady growth in the number of homes with
television and the growth in the number of minutes of
serials broadcast each day. This indicates an "elastic
demand" for soap operas: as the population grows and the
number of homes with television increases, a fairly stable
proportion of the new potential viewers will turn to the

12
daytime serials. As new soap operas are added to daytime
schedules each one seems able to attract an audience with-
out taking viewers away from other serials. This elastic
demand appears to hold even when the networks schedule
three serials in the same time period. Sometimes when
three soaps compete with each other, they reach 30 per cent
of all households with television, a rating as high as the
highest rated prime time program.
Katzman found 71 per cent of the serial audience
composed of adult females. Education of the head of house-
hold was inversely related to the tendency to watch soap
operas; the serials were most popular among the low-income,
low-education groups. The most typical viewer of daytime
serials was a southern or midwestern woman from a large
household with relatively low educational and income levels.
The aLmost-realism of the characters and themes, the repe-
tition due to slow pace, and the extremely large number of
hours spent viewing soap Operas indicate that these shows
have great potential power. They can establish or rein-
force value systems. They can suggest how people should
act in certain situations. They can 1egitimize behavior
and remove taboos about discussing sensitive such topics
as drugs and premarital sex.

13
Edmondson and Rounds (1973) looked at the soap
opera viewer. They found that in 1972, 96 per cent of all
American households had television sets and 53 per cent of
them were color. Thirty per cent of all television house-
holds watch daytime television with 18.6 million viewers
tuned in. Chances were four to one that the viewer was a
woman since fewer than 20 per cent of daytime viewers are
men. Seventy-six per cent of nonworking women watch TV in
the daytime and 54 per cent of the working females still
find time to view the set during the day.- Sixty-five per
cent of all women watch some daytime television--a per—
centage that has remained quite constant since 1968.’
The "average" woman watches television Monday
through Friday between 10 a.m. and S p.m. foreaneaverage of
over seven hours each week. WOmen between 18~and‘50 prefer
soap Operas to game shows, and they watch them a little
over three times a week, more.in the fall, a little less
during the winter, and the least during the summer.
There has been no consistent mode of studies on
soap operas. It is a much unexplored field. The only
viewer-sample study was done by Herzog over 30 years ago.
The Katzman study was solely a content analysis of char-
acters and content. The other studies and articles were

14
4
simply discussions by sociologists and psychologists about
some aspect of the serials.
Soap Opera Reality
and Gratifications
Dr. Louis I. Berg, a New York psychiatrist and
writer, was a man who hated soap operas. His crusade
against them began in 1941, when he developed the suspicion
that certain symptoms manifested by his patients, certain
disturbing relapses, might have their origin in addiction
to radio serials. Setting out to test his hypothesis that
such symptoms as tachycardia (rapid pulse rate), arrhythmia
(distorted heart beat), emotional instability, and vertigo
(fear of heights) might be produced by soap operas, he
found just what he had set out to look for. After a daily
dose of two leading exemplars, Right to Happiness and Women
in White, Dr. Berg tested his own blood pressure and found
it rising. Serials, he concluded on this evidence, are
dangerous, especially to the middle-aged woman, the ado-
lescent, and the neurotic. They furnish to those unfortu-
nate addicts "the same release for the emotionally dis-
torted that is supplied to those who derive satisfaction
from a lynching bee, who lick their lips at the salacious

15
scandals of crime passionnel, who in the unregretted past
cried out in ecstasy at a witch burning."
The subject of all this tempestuous verbiage was
then, as now, a humble art form, meek and unconfident,
looked down upon by the cultivated and even sometimes by
its own creators. But though it has often been snubbed
and publicly humiliated, it has always been beloved by
millions who have found it indispensable to their private
well being.3
What is it in soap operas that can arouse such
loyalty from their audiences and such opposition from their
critics? What is the secret of their addictive powers that
cause viewers to become so involved in the lives of the
characters and their problems? Such questions as these
will be partly explored in this study.
The specific purposes of this study were to examine
viewers' and nonviewers' perceptions of the reality of soap
opera characters and content, to explore viewers' degree of
interaction, identification, and involvement with soap
operas, their knowledge of program content, and tc-examine
four functions (companionship, boredom, escapism, and
3Edmondson and Rounds, p. 15.
16
social utility) possibly satisfied by watching daytime
serials.
The amount of viewing is the independent variable
in this study. The dependent variables are-knowledge of
soap opera content; interaction--stimulation of the viewer
by characters and/or content of the programming'which moti-
vates the viewer to make a response, comments on or dis-
cussion of the program with others; identification--imagin-
ing oneself in the place of a soap opera character; and
involvement--how important watching soaps are to the viewer.
Four other variables are possible functions satisfied by
watching soap operas: companionship, relief of boredom,
escapism, and social utility. Perceived reality (the ex-
tent to which the viewer thinks that program content and
characters resemble peOple and events in real life) is the
intervening variable in that it may affect the relationship
between the independent and certain dependent variables.
Perceived reality is a variable explored to deter-
mine its potential impact on the viewer. According to
Greenberg and Reeves (1974), general use of television is
strongly related to general measures of perceived reality
of television. One may anticipate that people who watch
the medium with some regularity will generate stronger
17
estimates of perceived reality. This media realism has
been researched in connection with television impact on
children (Greenberg, 1973; Reeves, 1974; Greenberg and
Reeves, 1974; McLeod, Atkin and Chaffe, 1971; Ward, 1971;
Greenberg, 1971; Greenberg and Dominick, 1970) adults
(Dervin and Greenberg, 1973; and Greenberg, Vlahos and
Ericson, 1971), aggression stimulation (Feshback, 1971),
and violence (Gerbner, 1969; Dominick, 1972; and Clark and
Blankenburg, 1971). The bulk of this research was con-
cerned with the effects of prime time programming.
Identification, interaction, and involvement are
three variables postulated by Rosengren and Windahl (1972)
as important in examining mass media consumption and mo-
tives. They examined mass media content, identification
with the content, and interaction (imaginary) with the same
content. Identification and interaction take place between
the individual and a media character. Identification is
defined as "imagining oneself in the place of another
person," and interaction is defined as "mutual stimulation
and response." The relation between interaction and iden-
tification defines the degree of involvement (with mass
media content). The authors argued that the need for
interaction may be satisfied by almost any type of media

18
content. They divided media content into (1) fictional and
(2) as supplying explicit and concrete information (fac-
tual). Any media content can be either or both or none.
The cross-break between factual and fictional content yield
the values of another variable--degree of reality proximity
of media content. Their findings supported the following
hypotheses: 1) There is a positive correlation between the
degree of involvement and amount of consumption; and 2) a
high degree of involvement will tend to go together with
preference for and consumption of content with low degree
of reality proximity (where identification and interaction
are easier to establish).
Functions satisfied by soap opera viewing intro-
duced here are relief of boredom, escapism, social utility,
and companionship. Danowski ("Functions and-Gratifications
of Soap Opera Viewing: Some Operationalizations," 1973)
discussed operationalizations of nine functions and grati-
fications of soap Opera viewing. The four functions pre-
sented here are taken from Greenberg, 1973 (learning, re-
lief of boredom, relief of stress habit, identification,
social utility, stability, arousal/emotional release, and
para-social interaction) and from the eight clusters of

19
responses as to why people watch television also demon—
strated by Greenberg (1973).
Knowledge of program content and characters has
been a sparsely researched variable. Questions of this
nature have usually been reserved to measure perceived
reality of a specific character, mentioning the character
by name, but not asking specific questions about characters
and events in programming.
Perceived reality is dependent upon viewing for its
existence and measurement. We posit that it determines how
susceptible the viewer is to interaction, identification,
and involvement. The closer to reality the viewer be-
lieves the content and characters to be, the mOre the
viewer will become involved with the programming. Perceived
reality also determines how likely one is to feel some type
of gratification through exposure to the-medium. Therefore,
viewing predicts the seven variables as mediated by per-
ceived reality.
The following are original hypotheses for this
study.
H1: The higher the amount of viewing, the
greater the perceived reality. The
greater the amount of time and the more
repeated the exposures, the more likely

20
the viewer will see the medium's content
as being very much like real life.
H2: The higher the amount of viewing, the
more knowledge the viewer will have about
program content. The greater the length
of time the viewer is exposed to soap
Operas, the more familiar he/she will
become with the content.
H3 : The higher the amount of viewing, the
greater the viewer's involvement.
H3a : The greater the perceived reality, the
1 greater the viewer's involvement.
H3b: The higher the amount of viewing, the
greater the viewer's interaction.
H3b . The greater the perceived reality, the
1 greater the viewer's interaction.
H3c: The higher the amount of viewing, the
greater the viewer's identification.
H : The greater the perceived reality, the
greater the viewer's identification.
As the viewer spends more and more time-watching
the serials, he/she will develOp more and more interest
(becoming more curious) in the lives of the characters and
their situation, empathizing to the point of placing one-
self in similar circumstances and discussing such events
and alternatives with others who share the same curiosity
about soap operas.
H4 The higher the amount of viewing, the
more companionship the viewer will seek
from soap Operas.
a:

21
H4a : The greater the perceived reality, the
1 more companionship the viewer will seek
from soap operas.
H4b: The higher the amount of viewing, the
’ more the viewer will seek escapism in
soap operas.
4b : The greater the perceived reality, the
1 more the viewer will seek escapism in
soap Operas.
H40: The greater the amount of viewing, the
more relief from boredom the viewer will
seek from soap operas.
H4C : The greater the perceived reality, the
1 more relief from boredom the viewer will
seek from soap operas.
H4d: The greater the amount of viewing time,
the more social utility the viewer will
find in soap operas.
H4d : The greater the perceived reality, the
1 more social utility the viewer will find
in soap Operas.
As the viewer becomes addicted to the serials,
he/she will retreat to them as a break in the daily rou-
tine, to replace absent company, and to observe social
behaviors.

(Note:
perceived
_______9
reality
M
companionship
boredom
escapism
social
utility
(functions)
IN
V
knowledge
Hypotheses
Diagram
Arrows
only
indicate
that
acorrelation
VI
interaction
identification
involvement
A
exists
between
variables.)
22

CHAPTER II
METHODS
This study was drawn entirely from original data
collected in August, 1974, in the greater Lansing, Michigan,
area. The methods used in data gathering and analysis will
be discussed in the following order: 1) pretest and ques-
tionnaire administration, 2) the respondents and their
community, 3) operationalization of the independent vari-
able, 4) operationalization of the dependent variables,
and 5) statistical analyses.
:re\1feSt and Questionnaire
wstration
Pretest telephone interviews were first conducted
7 August 1974. Twenty-five telephone numbers were randomly
Selected from the Michigan State University telephone di-
rectory. Eleven of the 25 completed interviews. Answers
to questions concerning involvement, identification, and
lntereaction determined the coding categories and wording
23

24
for the final instrument. The four functions measured in
the final questionnaire were those most frequently men-
tioned by respondents in the pretest (Appendix A).
The final questionnaire was administered 12-15
August 1974. Five hundred fifty names were randomly drawn
from the Lansing, Michigan, telephone directory. Nine
trained interviewers made calls from 12 noon until 4 p.m.
each day, amassing responses from 272 people, 157 of who
were viewers and 115 of whom were nonviewers.
Telephoning results were 272 completed calls (49%),
188 refusals (21%), 128 no-answers or busy signals (23%),
30 disconnected numbers (5%), and two miscellaneous.
Seventy-three of the 272 completed interviews were call-
backs of previous busy or no-answer numbers. There were
390 contacted respondents of whom 70% yielded interviews.
The questionnaire took approximately 20 minutes for
completion and all questions were read to the respondent
and answers recorded by the interviewer. Only measures of
perceived reality and demographic information were obtained
from nonviewers. The first person who answered the tele-
phone was interviewed unless that person declined in favor
of someone else in the household who did watch soap operas.
After the interviewer read the introduction and the

25
instructions for question one, the respondent indicated
whether or not he/she watched daytime television and/or
soap operas.
The entire questionnaire is in Appendix B.
Respondents and Their Community
The total sample consisted of 55 males and 216
females, ranging in age from the teens to the eighties
with over half the sample in their thirties or younger.
All the respondents came from the Lansing, Michigan
area, including East Lansing, Meridian, Haslett, and Okemos.
People in the sample came from a variety of socioeconomic
backgrounds with a fairly even spread among income and
education.
Lansing is located in the central part of Michigan
and has a large number of industries. Its suburbs offer
faculty, staff, and students from Michigan State University
and other professional people. Consequently, respondents
come from a variety of backgrounds.
Demographics and Viewing
Table 1 shows that both viewers and-nonviewers in
this sample were predominantly female (87% and 65%

TABLE l.--Demographics of Viewers and Nonviewers
(Chi-Square Test)
26
Total . .
Nonv1ewers Viewers
Sample
Sex: male 55 36 19
female 216 79 137
x2 = 14.96, p < .001, df = 1
Age: teens 41 8 33
20s 79 32 47
303 36 16 20
403 29 19 10
503 + 80 39 41
x2 = 16.67, p < .01, df = 4
Education:
below high school 64 14 50
completed high school 88 34 54
some college 55 28 27
college degree 35 25 10
graduate or professional 22 13 9
degree
x2 = 28.64, p < .001, df = 4
Income: student 26 6 20
below $5,000 18 12 6
$5,000-$10,000 33 15 18
$10,000-$15,000 65 27 38
$15,000-$20,000 35 15 20
over $20,000 21 13 8
retired 34 ll 23
x2 = 13.11, p < .05, df = 6
Marital Status: single 93 37 56
married 158 69 89
widow l8 8 10
x2 = 0.4329, p < .90, df = 2

27
respectively); 34% of the viewers completed high school
compared to 30% for nonviewers; and 40% of viewers and 49%
of nonviewers had incomes of more than $10,000. Half of
the viewers and 35% of the nonviewers were below age 30,
and 60% of both were married.
Table 2 indicates that the "typical" soap opera
viewer is a female of no particular age group whose head-
of-household is in the middle income bracket (between
$10,000 and $20,000), and has a high school education.
Katzman (1973) characterized the "typical viewer" as a
southern or midwestern woman from a large household with
relatively low educational and income levels. Size of
household and area of the country were not examined in
this study.
Operational Definitions
The amount of viewing was used as a predictor for
nine variables: perceived reality (which was also used as
a mediator between the independent variable and seven other
dependent variables), knowledge of soap opera content and
characters, involvement, interaction, identification,
companionship, boredom, escapism, and social utility.

28
TABLE 2.--Demographics and Amount of Viewing
(Chi-Square Test)
1-2 Shows 3-4 Shows 6+ Shows
Sex: male 10 7 2
female 45 48 44
x2 4.54, p < .20, df = 2
Age: teens l4 l6 3
203 16 l7 13
308 6 6 8
40s 4 2 4
50s + 12 l3 16
x2 = 12.36, p < .20, df = 8
Education:
below high school l4 l9 17
completed high school 15 19 20
some college or more 23 15 7
x2 = 10.25, p < .05, df = 4
Income: student 9 8 3
below $10,000 11 3 10
$10,000-$15,000 11 13 14
$15,000 or more 9 11 8
retired 8 8 7
x2 = 13.65, p < .10, df = 8
Marital Status: single 20 27 9
married 30 27 32
x2 = 9.35, p < .01, df = 2

29
Demographic variables (age, sex, marital status, income,
and education) were also examined as predictors of these
dependent variables.
Independent Variable
The amount of 'viewing time was measured by the
number of different soap operas viewed per week and by
the total number of episodes viewed per week. Respondents
were asked which shows they watched and how many times a
week they watched. This was done to establish a compara—
tive frequency of how often each show was viewed weekly.
(The correlation between watching shows and episodes is
.77.)
Viewers were also asked "How long have you been
watching soap operas?" to determine the amount of viewing
in years. This correlated with shows and episodes as .24
and .27, respectively.
Perceived Reality
Perceived reality was measured by reading the
respondent nine statements to which he/she answered
"agree, disagree, or not sure."

30
"Soap operas on TV tell about life the way
it really is."
"The same things that happen to people on
soap operas happen to people in real life."
"The places I see in soap operas are just
like places in real life."
"People in soap operas are just like people
in real life."
"Families on soap operas are just like
families in real life."
"Doctors on soap operas are just like doc-
tors in real life."
"Marriages on soap operas are just like
marriages in real life."
"Problems people have in soap operas are
just like problems people have in real
life."
"Is there any soap opera character who
reminds you of yourself?"
Scores for the individual items were summed for a total
perceived reality score. Measures were coded as
agree = 3, not sure = 2, disagree = l.
The variable "character like self" was dropped
from the perceived reality index because of its poor
correlations with the other variables. The final index
was composed of eight variables.
Intercorrelations among perceived reality items
in the total sample (Table 3), viewers (Table 4), and

31
TABLE 3.--Perceived Reality Correlations
(Total Sample) (N = 272)
O
m H
m Hr-l O
O O O O O o
O m m E D m (n
m O O -a H «0 O 0
4J (D H H O ~r-l H (00) H
c o o 44 p H .o H.x O
O O o E o H o O a .u
> r1 O O o O H .2 q 0
an a. m m o 2 n. L) a
Life .32 .33 47 .43 .29 .40 .29 .04 .68
(X'= 1.6)
Events .18 .32 .26 .16 .34 .38 .04 .60
(X'= 2.2)
Places .38 .41 .29 .22 .21 .08 .60
(X = 2.0)
People .38 .30 .43 .44 -.01 .75
(X = 1.9)
Families .40 .49 .36 .05 .75
(X = 1.7)
Doctors .30 .19 .02 .34
(Y = 1.5)
Marriages .36 -.06 .66
(X = 1.8)
Problems -.006 .60
(X'= 2.3)
Character
Like Self .15
(X = 1.2)
(ifi= 16.2)

32
TABLE 4.--Perceived Reality Correlations
(Viewers) (N = 157)
O
H
m o
O O m o
O m m g m
m O O -H H O O
JJ (D H H 0 ml H H
c o o. -H H H .o O
O O o g o H o H
> H O o O H o
m m m m o z m a
Life .34 .44 42 44 .24 31 .33 70
Events .25 .36 .29 .16 .42 .50 .61
Places .40 .47 .28 .31 .30 .65
People .56 .24 .45 .39 '.72
Families .45 .51 .35 .73
Doctors .32 .17 .53
Marriages .38 .73
Problems .62
(Y = 15.6)
nonviewers (Table 5) are fairly consistent with the excep-
tion of the variable "doctors." This variable correlates
higher with the other perceived reality variables among
nonviewers than it does among viewers and the total sample-

33
TABLE 5.--Perceived Reality Correlations
(Nonviewers) (N = 115)
Events
Places
People
Families
Doctors
Marriages
Problems
Total
Score
Life .29 .15 55 .40 .40 .26 .21 .61
Events .12 .26 .21 .19 .25 .25 .53
Places .37 .30 .34 .13 .13 .49
People .60 .41 .43 .51 .80
Families .33 .45 .37 .72
Doctors .31 .26 .61
Marriages .37 .63
Problems .62
(X = 14.2)
Table 6 shows that viewers have high perceived
reality (above the scale's-midpoint)"fortproblemsx(X==2.5)r
events (Y = 2.3), places (Y = 2.1), and.people (Y’= 2-0).
Nonviewers have high reality perceptions for only events
(X = 2.1) and problems (X = 2.0).

TABLE 6.--Perceived Reality Item Frequency
Viewers (N 157)
34
Nonviewers (N 115)
Viewers Nonviewers
3 2 l 3 2 1
Life 37 31 88 (X = 1.7) 18 19 80 (X 1.5)
Events 80 27 39 (X = 2.3) 51 28 36 (X 2.1)
Places 69 32 54 (X = 2.1) 35 41 35 (X 1.9)
People 68 22 66 (X = 2.0) 34 26 55 (X 1.7)
Families 53 22 81 (X = 1.8) 21 30 62 (X 1.5)
Doctors 30 28 98 (X = 1.6 10 42 65 (X 1.5)
Marriages 47 32 74 (X = 1.8) 30 26 59 (X 1.7)
Problems 99 ~31 26 (X = 2.5) 50 32 31 (X 2.0)
Dividing perceived reality scores into Low PRTV
(range eight to 15) and High PRTV (range 16 to 24), Table 7
shows that 48 per cent of the viewers and 64 per cent of
the nonviewers fall into the low perceived reality cate-
gory. The mean perceived reality score for the two groups
is not statistically different, 15.6 for viewers and 14.1
for nonviewers.

35
TABLE 7.—-Perceived Reality Score Frequency
Viewers (N = 157)
Nonviewers (N = 115)
Viewers Nonviewers
Total Score
Frequency Percentage Frequency Percentage
8 10 6% 7 6%
9 5 3% 6 5%
10 8 5% 4 3%
11 8 5% 6 5%
12 22 14% 18 - 15%
13 7 5% 11 9%
14 6 4% 12 10%
15 10 6% 13 11%
16 12 8% 12 10%
17 13 8% 4 3%
18 9 6% 6 5%
19 5 4% 3 3%
20 11 7% 1 1%
21 8 5% 5 4%
22 10 6% 4 3%
23 5 3% — -
24 7 5% 3 3%
2’: 15.6 X = 14.2
s.d. = 4.75 s.d. = 7.94

36
Knowledge
The variable knowledge about soap opera characters
and content was measured by having respondents answer ques-
tions about the serials he/she claimed to watch. The ques-
tionnaire contained three questions about each of the 14
soaps.
02
For example:
The Young and the Restless
Who is the father of Sally McQuire's baby?
Who is responsible for Leslie Brooks'
emotional breakdown?
What is Brad Elliot's real profession?
All My Children
3.
Who is the father of Tara Martin Tyler's
son Phillip?
Who killed Jason Maxwell?
Why did Ann Martin abruptly leave Pine Valley?
Another World '
Who caused Alice Frame's emotional breakdown?
To whom was Rachael Frame married when Jamie
was born?
Why was Steven Frame sent to prison?
The possible range for correct answers per show was from
0 to 3. The possible range for total correct answers was
from 0 to 42.
37
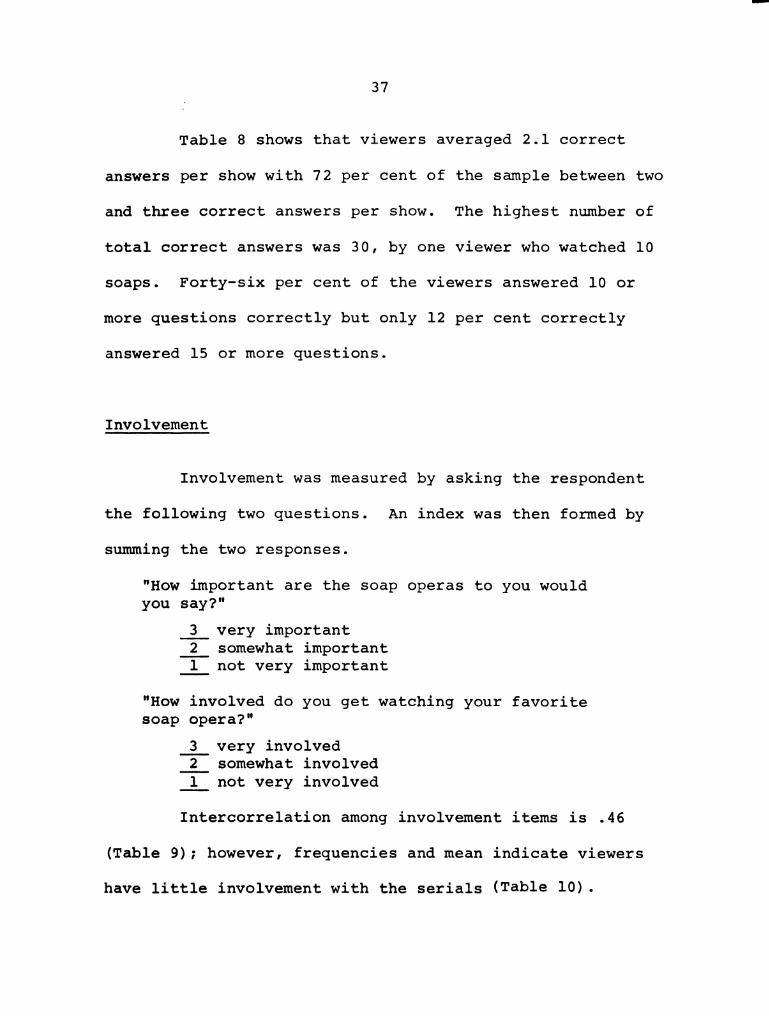
Table 8 shows that viewers averaged 2.1 correct
answers per show with 72 per cent of the sample between two
and three correct answers per show. The highest number of
total correct answers was 30, by one viewer who watched 10
soaps. Forty-six per cent of the viewers answered 10 or
more questions correctly but only 12 per cent correctly
answered 15 or more questions.
Involvement
Involvement was measured by asking the respondent
the following two questions. An index was then formed by
summing the two responses.
"How important are the soap operas to you would
you say?"
3 very important
2 somewhat important
not very important
"How involved do you get watching your favorite
soap Opera?"
3 very involved
2 somewhat involved
1 not very involved
Intercorrelation among involvement items is .46
(Table 9); however, frequencies and mean indicate viewers
have little involvement with the serials (Table 10).
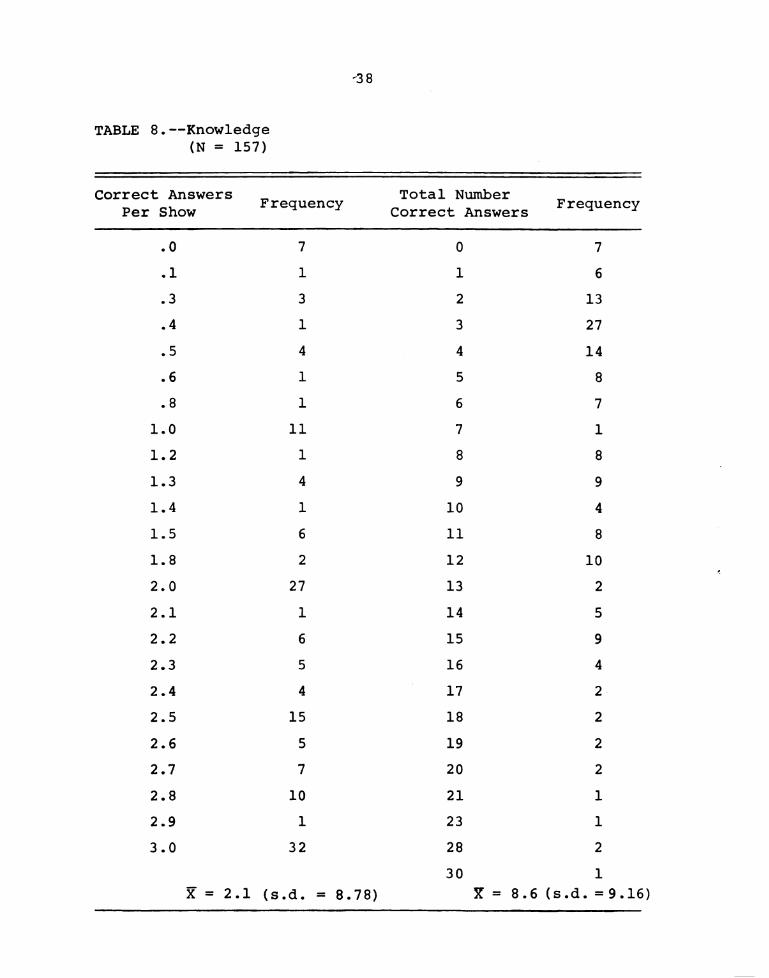
TABLE 8.--Know1edge
(N = 157)
Correct Answers Frequency Total Number Frequency
Per Show Correct Answers
.0 7 0 7
.l l 1 6
.3 3 2 13
.4 l 3 27
.5 4 4 14
.6 l 5 8
.8 l 6 7
1.0 11 7 1
1.2 1 8 8
1.3 4 9 9
1.4 l 10 4
1.5 6 11 8
1.8 2 12 10
2.0 27 13 2
2.1 l 14 5
2.2 6 15 9
2.3 5 l6 4
2.4 4 17 2-
2.5 15 18 2
2.6 5 19 2
2.7 7 20 2
2.8 10 21 l
2.9 l 23 1
3.0 32 28 2
30 1
X'= 2.1 (s.d. = 8.78) X'= 8.6(s.d.==9.l6)

TABLE
9.-Involvement,
Identification,
(Intercorrelations)
(N
=
and
Interaction
Involvement
importance
watching
Identification
be
like
character
imagine
self
as
character
imagine
self
in
similar
situation
written
to
network
Interaction
handle
problems
.68
written
to
network
talk
to
characters
worry
about
characters
watching
.46
imagine
self
as
character
.32
talk
to
characters
.32
.80
involvement
.82
.88
imagine
self
in
similar
situation
.22
.41
worry
about
characters
.26
.77
.47
ID
.37
.70
.82
INT
.69
.96
.77
.72
39

IRE
Lu
—
VI).

40
Identification
Identification was measured-by three questions from
which an index was formed (yes = 2, no_= 1).
"Are there any characters you would like to
be like?"
"Do you ever imagine yourself as one of the
characters?"
"Do you ever imagine yourself in a similar
situation that a particular character faces?"
The mean for identification was 3.8 (Table 10)
although it correlates well with involvement and interac-
tion (Table 9), and very well among its separate items.
Interaction
Interaction was measured by four questions'which
were also summed for an index.
"Do you ever think about telling some char-
acters how to handle their problems?"
"Have you written to the network or any place
about a show?"
"Do you ever find yourself talking to the
characters while the show is on?"
The interaction mean for viewers was 5.5 and
interaction correlated well with both involvement and
identification.

41
1
TABLE 10.--Involvement, Identification, and Interaction
(Frequency) (N = 157)
Involvement (X = 3.5)
value frequency
2 50
3 31
4 37
5 22
6 14
Identification (X'= 3.8)
value frequengy
3 74
4 47
5 28
6 4
Interaction (X = 5.5)
value frequency
4 3S
5 44
6 39
7 35
8 0
Correlations Among Indices
identification interaction
invOlvement .37 » .50
identification .36

,42
Functions
The four functions were operationalized as follows
and indices were formed for each. Response categories were
coded as agree = 3, not sure = 2, disagree = 1.
Boredom--"Watching soap operas helps me to pass the
time." "I watch soap operas because I have nothing better
to do."
These two items correlate .15. The first correlates
insignificantly with the boredom index (r = .09) and the
second correlates highly .78.. This index correlates with
the companionship, escapism, and social utility indices .20,
.18, and .55 respectively, indicating that viewers who seek
relief from boredom from the serials are also more likely
to find social utility in the soaps as well.
Companionshi -—"I watch soap operas when there's no
one to talk to." "Watching soap operas makes me feel less
lonely."
These two items correlate .43. The first corre-
lates with the index .26 and the second .23. 'Companionship
correlates with boredom, escapism, and social utility .20,
.28, and .32 respectively (Table 11).

43
TABLE ll.--Functions
(N = 157)
Boredom (X = 3.0) Companionship (X'= 4.1)
value frequency value freguengy
2 78 2 44
3 8 3 9
4 52 4 37
5 9 5 10
6 6 6 53
Escapism (X'= 3.8) Social Utility (X'= 2.6)
value frequengy, value frequency
2 57 l S
3 10 2 100
4 36 3 21
5 14 4 13
6 36 5 15
Correlations Among Indices
companionship escapism-
boredom .20 .18
companionship .28
escapism
social utility
.55
.32
.21

44
Escapism--"Watching soap operas helps me to escape
from my daily routine." "Watching soap-operas takes me
away for a little while."
These two items correlate .45 and with‘thetindex.29
and .24 respectively. Escapism correlates~witheboredom,
companionship, and social utility .18, .28, and .21 respec-
tively.
Social Utilitye-"Do you get any useful information
from the soap operas you watch?" "Watching soap operas
helps me to deal with other people." (The first question
was coded as yes = 1 and no = l; the second as agree = 3,
not sure = 2, disagree = 1.)
These two items correlate .41 and .72 and .92 with
the index. Social utility correlates with boredom,es-
capism, and companionship .55, .21, and .32 respectively.
Analysis
All questionnaire data were transferred to com-
puter cards for analysis using the Statistical Package
for the Social Sciences.
In testing the hypotheses, four statistical
analyses were used: the Pearson product moment

45
correlations, the chi-square test, partial correlations,
and one-way analysis of variance.

CHAPTER III
RESULTS
The results of this study are presented according
to each hypothesis.4
Perceived Reality,
H1: The higher the amount of viewing, the
greater the perceived reality.
Table 12 shows this hypothesis is confirmed.
Overall perceived reality scores correlate positively with
the number of different shows (.24), the number of epi-
sodes (.16), and the number of years the viewer has
watched soap operas (.26).
All three viewing measures correlated consistently
best with perceived reality measures of life (r = .24, .29,
and .28), people (r = .24, .29, and .21), problems (r = .22,
.21 and .21), and families (r = .19, .26, and .25).
f
4For viewers (N = 150, i 5), correlations above .14
are significant at p < .05 and correlations above .18 are
significant at p < .01. For nonviewers (N = 115) correla-
tions above .18 are significant at p < .05 and correlations
above .20 are significant at p < .01.
46

47
TABLE 12.--Viewing and Perceived Reality—
(N = 157)
Viewing
Perceived Reality
shows episodes years
Life .24 .29 .28
Events .11 .06 .12
Places .04 .08 .24
People .24 .29 .21
Families .19 .26 .25
Doctors -.02 .03 .10
Marriages .10 .15 .19
Problems .22 .21 .21
Index .24 .16 .26
Edmondson and Rounds (1973) found that the viewer
spent seven hours a week with the serials. This study
showed viewers watched an average of 3.8 different soaps
a week and 14.0 episodes (seven hours), and had watched
daytime dramas for over eight years.
Perceived reality was higher for older viewers
(r = .25) and viewers of lower education (r = -.18). For
nonviewers, perceived reality was higher for older viewers

48
(r = .34). There were no significant differences across
sex, income, and marital status for viewers-and none across
sex, income, marital status, and education for nonviewers.
Perceived Reality Index
Demographics . .
Viewers nonV1ewers
Sex -.12 .17
Age .25 .34
Marital Status -.01 .08
Income -.02 .00
Education -.18 -.11
Knowledge
H2: The higher the amount of viewing time,
the more knowledge the viewer will have
about program content.
This hypothesis is true for viewing time measured
by the number of different shows watched correlated with
the total number of correct answers (r = .47); and by the
number of episodes correlated with correct answers per show
and total correct answers (r = .20 and r = .44, respec-
tively. However, the number of years watching soap operas
correlates -.02 with average correct answers and .06 with
total correct answers--both insignificant.

49
Average Correct Total Correct
Demographics Answers Per ShOW' (r = .49) ' AnSWers
Sex .35 .25
Age .00 ‘ .00
Marital Status .07 .02
Income .07 —.03
Education .13 .14
Viewers who had more knowledge about program con-
tent were females with low perceived reality levels. There
were no differences in age, income, marital status, and
education.
Involvement, Interaction,
and Identification
H3: The higher the amount of viewing, the
greater the viewer's involvement,
identification, and interaction.
Table 13 shows viewers who have higher amounts of
viewing have greater involvement (r = .46, r = .46, and
r = .13), identification (r = .19, r = .14, and r = .11),
and interaction (r = .21, r .28, and r = .02). Involve-
ment was greater for lower-income (r = —.16) and lower-
educated viewers (r = -.17). Identification was greater
(among males (r = —.15), single viewers (r = -.19), and
\riewers (r -.25). Interaction was greater for single
\riewers (r -.23), and lower-income viewers (r = —.16).

50
TABLE 13.--Viewing and Involvement, Interaction, and
Identification
(N = 157)
Involvement Interaction Identification
Shows .46 .21 .19
Episodes .46 .28 .14
Years .13 .02 .11
Demographics Involvement Interaction Identification
Sex .02 -.03 —.16
Age -.03 -.14 -.09
Marital Status -.17 -.24 -.14
Income .00 -.17 -.22
Education -.17 -.10 -.10
Boredom, Companionship,
Escapism, and Social Utility
H4: The higher the amount of viewing, the
more functions watching soap operas
will satisfy.
Viewers with higher amounts of viewing found grat-
ification for social utility (r = .20, .23, and .15), but
not for companionship, boredom, and escapism (Table 14).
Only less-educated viewers sought relief from boredom
iflrrough soap operas (r = -.25) and found social utility
in 'the soaps (r = -.25). Escapism seekers were older
(r == .31) and married (r = .18).

51
TABLE 14.--Viewing and Functions
(N = 157)
Boredom Com anionshi Esca ism -Social
9 P p Utility
Shows .03 -.02 .11 .20
Episodes .02 -.03 .13 .23
Years .03 .12 .11 .15
Social
Demographics Boredom Companionship Escapism Utility
Sex -.10 -.02 -.03 -.08
Age .03 .06 .32 .15
Marital Status -.12 .04 .18 .07
Income -.04 -.03 .05 .04
Education -.25 .04 -.08 -.25
Perceived Reality Correlations
Viewers were divided into two groups according to
their perceived reality scores (range: eight to 24). High
PRTV viewers (N = 81) were those whose scores were between
16 and 24 (Table 15). Low PRTV viewers (N = 76) were those
whose scores were for eight through 15.
Viewers with high perceived reality of television
had more knowledge of soap operas in terms of correct
answers per show (r = .18 and .25) than did viewers with
low perceived reality of television (r = .11 and .23).
However, the latter group had better correlations between

52
TABLE 15.—-High and Low PRTV
(N = 157)
Shows Episodes Years
Hi PRTV Lo PRTV Hi Low Hi Low
Knowledge
answers per show .18 .11 .25 .23 .09 -.02
total correct .31 .77 .29 .72 .02 .15
Involvement .48 .43 .57 .34 .15 .10
Identification .11 .34 .06 .28 .14 .14
Interaction .23 .28 .27 .28 .01 .14
Boredom .10 -.07 .08 -.06 .09 -.10
Companionship .02 .01 .15 -.14 .19 .08
Escapism .08 .16 .20 .07 .11 .09
Social Utility .25 .13 .31 .12 .23 .01
viewing and total correct answers across all shows with
r = .77 and .72 compared to r = .31 and .29 for the former
group.
High PRTV viewers found more involvement (r = .48,
.57, and .15), interaction (r = .23 and .27), companionship
(r = .15 and .19), and social utility (r = .25, .31, and
.23) in soap operas. Low PRTV viewers found more identi—
fication (r = .34, .28, and .14). Boredom was insignifi-
cant for both groups while escapism was significant with
episodes (r = .20) for high PRTV viewers and with shows
for low PRTV viewers.

TABLE
16.-Perceived
Reality
Correlations
(Shows-Episodes)
(N
=157)
Shows
Overall
Hi
PRTV
Lo
PRTV
Episodes
Overall
Hi
PRTV
Lo
PRTV
Knowledge
answers
per
show
total
correct
answers
Involvement
Identification
Interaction
Boredom
Companionship
Escapism
Social
Utility
.10
.47
.46
.19
.25
.03
-.02
.11
.20
.18
.31
.48
.11
.23
.10
.02
.08
.25
.11
.77
.43
.34
.28
-.07
.01
.16
.13
.20
.44
.46
.14
.25
.02
.12
.11
.15
.25
.29
.57
.06
.27
.08
.15
.20
.31
.23
.72
.34
.28
.28
-.06
-.14
.07
.12
" 53

54
This analysis provides support for perceived re-
ality of television as an intervening variable. Respondents
with greater amounts of viewing had higher perceived re—
ality scores; high PRTV viewers found more involvement,
companionship, and social utility in the serials. Thus,
perceived reality mediates the relationship between the
independent variable and four of the dependent variables.
Partial Correlations
Variables examined were amount of viewing (separ-
ately for shows, episodes, and years), perceived reality
(index), involvement, identification, interaction, boredom,
companionship, escapism, and social utility. Table 17
represents analysis done by correlating viewing and per-
ceived reality and partialing out the dependent variable.
Table 18 represents analysis done by correlating viewing
time with the dependent variable and partialing out per-
ceived reality.
Table 17 indicates a fairly strong relationship be-
tween viewing and perceived reality, and that the other
dependent variables have little effect on this relation-
ship.
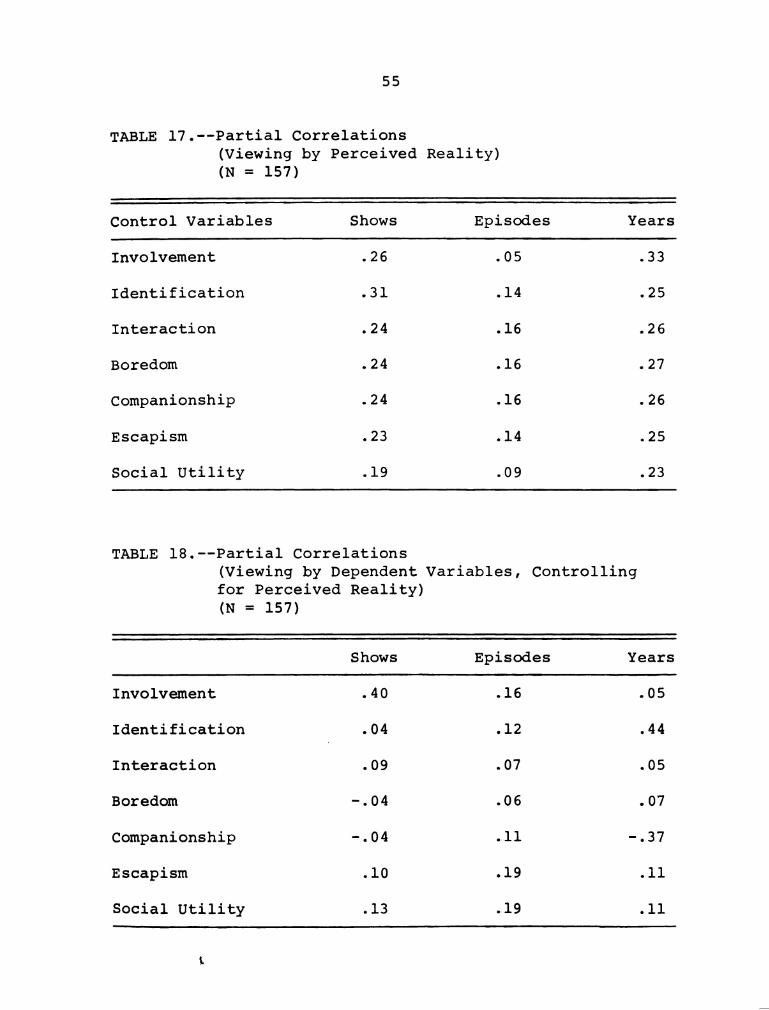
TABLE 17.--Partia1 Correlations
55
(Viewing by Perceived Reality)
(N = 157)
Control Variables Shows Episodes Years
Involvement .26 .05 .33
Identification .31 .14 .25
Interaction .24 .16 .26
Boredom .24 .16 .27
Companionship .24 .16 .26
Escapism .23 .14 .25
Social Utility .19 .09 .23
TABLE 18.--Partial Correlations
(Viewing by Dependent Variables, Controlling
for Perceived Reality)
(N = 157)
Shows Episodes Years
Involvement .40 .16 .05
Identification .04 .12 .44
Interaction .09 .07 .05
Boredom -.04 .06 .07
Companionship -.04 .11 -.37
Escapism .10 .19 .11
Social Utility .13 .19 .11

56
Table 18 shows that perceived reality mediates the
relationship between (1) viewing (years) and involvement;
(2) viewing (shows and episodes) and identification;
(3) viewing (shows, episodes, years) and interaction;
(4) viewing (shows, episodes, years) and boredom; (5) view-
ing (shows and episodes) and companionship; (6) viewing
(shows and years) and escapism; and (7) viewing (shows and
years) and social utility. This analysis refers to the
correlation between viewing time and each dependent vari-
able after the portion in both that can be predicted from
perceived reality has been eliminated. Thus, the above
were no longer significantly correlated when perceived
reality was removed.
As an intervening variable, perceived reality shows
that as the amount of viewing time increases, and perceived
reality increases, the viewer will have (1) more interac-
tion with soap opera characters and content, and (2) more
relief from boredom.
One-Way Analysis of Variance
A one-way analysis of variance was done with two
measures of viewing, the number of shows and the number of
57
episodes watched. Viewing was divided into low (1-2’shows
or 1-7 episodes), medium (3-5 shows or 8—16 episodes), and
high (6 or more shows or 17 or more episodes).
Table C1 (Appendix C) shows that among respondents
who watched a greater number of different shows, perceived
reality, knowledge of soap operas content, involvement,
identification, interaction, escapism, and social utility
were higher. There were no significant differences across
boredom and companionship.
Table C2 (Appendix C) shows that among respondents
who watched a higher number of episodes, perceived reality,
knowledge, involvement, interaction, and social utility
were higher. Relief from boredom was the same for medium
and high viewers; identification was higher for medium
viewers, and companionship was higher for low viewers.

TABLE
19.-Overall
Correlations
(N
=157)
Shows
Episodes
Years
Involvement
zero-order
correlation
hi
PRTV
lo
PRTV
controlling
PRTV
(perceived
reality
xinvolvement,
r=
.31)
Identification
zero—order
correlation
hi
PRTV
loPRTV
controlling
PRTV
(perceived
reality
xidentification,
r=
.17)
Interaction
zero-order
correlation
hi
PRTV
10
PRTV
controlling
PRTV
(perceived
reality
xinteraction,
r=
.18)
.46
.46
.13
.48
.57
-
.43
.34
-
.40
.16
.05
.19
.14
.11
.11
.06
-
.34
.28
-
.07
.12
.44
.21
.25
.02
.23
.27
-
.28
.28
-
.09
.07
.05
58

TABLE
19.-(C0nt'd.)
Shows
Episodes
Years
Boredom
zero-order
correlation
hi
PRTV
lo
PRTV
controlling
PRTV
(perceived
reality
xboredom,
r=
.34)
Companionship
zero-order
correlation
hi
PRTV
lo
PRTV
controlling
PRTV
(perceived
reality
xcompanionship,
r=
Escapism
zero-order
correlation
hi
PRTV
loPRTV
controlling
PRTV
(perceived
reality
xescapism,
r=
.18)
Social
Utility
zero-order
correlation
hi
PRTV
lo
PRTV
controlling
PRTV
(perceived
reality
xsocial
utility,
r
.07)
=.34)
.03
.10
-.O7
-.04
-.02
.02
.01
-.O4
.11
.08
.16
.10
.20
.25
.13
.13
.02
.08
-.06
.06
-.03
.15
-.14
.11
.13
.20
.07
.19
.23
.31
.12
.19
.03
.07
.12
.37
.11
.11
.15
.11
59

CHAPTER IV
SUMMARY AND DISCUSSION
The purpose of this study was to examine viewers'
and nonviewers' perceptions of the reality of soap opera
characters and content, to explore viewers' degree of
interaction, involvement, and identification with soap
operas, and to identify functions satisfied by watching
daytime serials.
Four original hypotheses were tested concerning the
relationship between amount of viewing time and perceived
reality, knowledge of serial content, involvement, identi-
fication, interaction, boredom, companionship, escapism,
and social utility. Correlations between the nine depen-
dent variables and demographic variables (sex, age, marital
status, and income) were also examined.
The Summary of Obtained Effects shows that hy-
potheses were confirmed for the following criterion vari-
ables. As the amount of viewing increased, (1) perceived
reality increased, (2) knowledge of soap opera content
60

61
increased, (3) involvement increased, (4) identification
increased, (5) interaction increased, and (6) social
utility increased.
Hypotheses for companionship, relief of boredom,
and escapism were not confirmed. This indicates that the
serials mainly provide information and advice that is
useful to the viewer in helping him/her to deal with other
people.
Perceived reality mediated only the relationships
between viewing and interaction with partial correlation
of r = .09, .07, and .05 (viewing and-interaction correlate
.21, .28, and .02); and viewing and boredom with partial
correlations of r = -.04, .06, and .07 (viewing and boredom
correlate insignificantly). Therefore, viewers do not
depend upon media realism before becoming involved with
soap opera characters and the events in their lives.
Respondents were asked to indicate their favorite
soap opera and the overwhelming choice was ”The Young and
the Restless," a CBS production that first aired two years
ago. This is the only serial filmed in Hollywood (the
rest are made in New York) and it is the costliest soap
produced. (Soap operas average a $60,000 weekly cost while
CBS puts out $70,000 for this serial.) Fifty-six percent

62
perceived
reality
4’
amount of interaction
viewing g boredom
V
identification
knowledge involvement
social utility
Summary of Obtained Effects
(Note: Arrows only indicate that a correlation exists
between variables.)

63
of the respondents chose "The Young and the Restless" over
the other 13 serials broadcast daily and 71 per cent watch
it each week (Appendix D).
What makes this soap opera so popular? Fifty-three
per cent of this sample were below 30 years of age. "The
Young and the Restless" has a cast mainly composed of young
people between the ages of 18 and 30 and most of the sub-
plots centered around their problems. This serial has been
most prolific in demonstrating physical affection between
persons. Intimate scenes are becoming more common to the
soaps now, but in the sixties, viewers were shocked to see
that Joanne Tate and her husband on "Search for Tomorrow"
in the same bed.
This study demOnstrates that soap Operas viewing
is no lOnger a common practice for only housewives or other
persons confined to the home during the day. There is no
longer a "typical viewer." People of all income levels
and of all educational backgrounds watch the soaps. Why?
From habit. Because their friends or relatives watch them.
Because the serials are the only thing on television during
the day. Or simply because the soaps stimulate curiosity
and interest about other people's lives and problems that
let the viewer forget his/her own troubles.

64
(Nielsen ratings for the serials are also in
Appendix D.)
Study Weaknesses
Weaknesses in this study lay in the confined mea-
“sures of perceived reality and gratifications. Respondents
were offered simply a three-fOil choice of "agree, disagree,
not sure." A wider spectrum for responses was needed for a
more discriminatory measure. For example:
"The same things that happen to people on soap
operas happen to people in real life."
strongly agree
agree
not sure
disagree
strongly disagree
"Watching soap operas helps me to deal with
other people."
strongly agree
agree
not sure
disagree
strongly disagree
Such operationalizations would have allowed for a
finer discrimination of viewers' and nonviewers' level of
perceived reality.

65
Directions for Future Research
There has been no consistent mode of studies on
soap Operas. It is a much unexplored field with vast po-
tential. The only sample study of viewers was done by
Herzog over thirty years ago. The Katzman study was solely
a content analysis of characters and content. The other
so-called studies and articles were simply discussions by
social scientists about some aspect of the serials.
Millions of viewers subscribe to the literature of
one electronic medium. This vast addiction is worth in-
vestigating to find what gratifications come from a daily
dose of soaps, and how similar to real life viewers per-
ceive serial content and characters to be.
In January, 1975, NBC expanded "Another World" to
60 minutes. The network found that it is less expensive to
produce one soap fOr an hour than to produce two 30-minute
serials. This practice is a new trend worth investigating.
Because of success with the hour-long serial, in April, NBC
cancelled "How to Survive a Marriage" to expand "Days of
Our Lives" to an hour, and CBS plans to stretch "Search.for
Tomorrow" and "The Guiding Light" to 45 minutes. What is
viewer reaction to the new serial length? Is the hour to
66
become the standard length for the daytime drama? Will
viewers frequent the soaps less because of their extended
length?
The Herzog study examined only women who were con-
fined to the home with easy access to the soaps. This
study found a large number of teenagers and young adults
(men and women) who were avid soap opera fans. This is an
audience that has not been researched independently about
soaps and deserves to be.
Perceived reality of soap operas is a variable that
could be researched again. A questionnaire completed by
the respondent could contain more in-depth questions and
provide for better measure of media realism.
A possible study would be to examine the same vari—
ables in this study among teenage viewers and viewers in
their forties and older and to contrast the results. View-
ing and age correlated .03 for shows and .20 for episodes.
Age is insignificantly related to the number of different
shows viewed, but correlated more positively with episodes
because the older viewers have more time during the week
to watch while younger viewers have more outside activ-
ities, considering this study was done in the summer, in
the middle of August, the height of vacation season.

67
This study itself could and should be repeated.
One basic criterion for research is that it can be repli—
cated and this study owes such clarification to the serials.
Viewer involvement and gratifications should be more deeply
explored.
Prime time programming, news telecasts, cartoons,
and children's programming are all media literature that
have been researched for violence, news effects, informa-
tion gain, and other concepts. The same courtesy and
recognition should be extended to the serials.
New Hypotheses
Four new questions for future research are pre-
sented here from.which two new hypotheses are tested.
"Who is your favorite soap opera character?"
"Is this person just like someone you know in
real life?"
strongly agree
agree
not sure
disagree
strongly disagree

68
"Which soap opera character do you like the
least?"
"Is this person just like someone you know
in real life?"
strongly agree
agree
not sure
disagree
strongly disagree
Hypothesis: Perceived reality will be greater for
the viewer's favorite character than for the char-
acter the viewers likes the least.
"Is there any character who reminds you of
yourself?"
"If so, who?"
"Do you think this person behaves very much
like you do?"
strongly agree
agree
not sure
disagree
strongly disagree
"Is there any character who least reminds you
of yourself?"
"If so, who?"
"Do you think this person behaves very much
like you do?"
strongly agree
agree
not sure
disagree
strongly disagree
69
Hypothesis: Perceived reality will be greater
for a character who reminds the viewer of him/
herself.
Postscript
The grandmother of soap-opera scriptwriters is
74-year-old Irna Phillips. She has been writing scripts
for 45 years, and like Homer and Shakespeare, is considered
a bard of the mythology of her thmes.
Mythology is the literature created by the nameless
and the illiterate (which is how some critics classify soap
opera writers), passed down from generation to generation
and altered within each. Soap operas are American myth-
ology. The Greeks followed the escapades of the gods and
goddesses of Olympus, recorded by the likes of Homer--the
Americans follow the heroes and heroines of the daily day-
time dramas created by the likes of Ms. Phillips.

APPENDIX A
SOAP OPERA QUESTIONNAIRE

APPENDIX A
Mitzi Bond
Soap opera questionnaire
August 1974
Date: ID number:
Hello, I'm
from the Department of
Communication at Michigan State University. We're doing a
study on daytime television and if I may have a few minutes
of your time, I'd like to ask you a few questions.
1.
01
02
03
04
05
06
07
08
09
10
11
12
13
14
I will read a list of programs that are on television
during the day. Please tell me which of the following
shows you watch and about hOW’many days a week you
watch them.
Love of Life
The Young and the Restless
Search for Tomorrow
Somerset
All My Children
As the WOrld Turns
The Guiding Light
Days of Our Lives
The Edge of Night
The Doctors
Another World
General Hospital
How To Survive a Marriage
One Life to Live
70
9. .1. .2. 1 i 2

2.
71
Total number of shows viewed per week:
Total number of days viewed per week:
Which is your favorite soap Opera?
I have a few statements here on which I would like your
Opinion. Please tell me if you agree, disagree, or are
not sure about whether the statement is true.
3.
K
Soap operas on TV tell about life the way it really is.
___ agree
___ not sure
____disagree
The same things that happen to people on soap operas
happen to people in real life.
___.agree
not sure
____disagree
The places I see in soap operas are just like places
in real life.
agree
not sure
disagree
People in soap operas are just like people in real
life.
agree
not sure
disagree

10.
11.
72
Families on soap Operas are just like families in
real life.
agree
not sure
____disagree
Doctors on soap operas are just like doctors in
real life.
___ agree
___ not sure
‘___'disagree
Marriages on soap operas are just like marriages
in real life.
agree
not sure
disagree
Problems people have in soap operas are just like
problems people have in real life.
agree
not sure
disagree
Which soap Opera character most reminds you of
yourself?
I have a few questions to ask you about the soap operas
you watch. (Only ask respondent questions about soap
operas he/she watches. Refer to page 1.)

12.
13.
14.
15.
73
Love of Life
With whom is Jamie Rollins having an affair?
Who was responsible for the attempts on Bruce and
Vanessa Sterling's lives?
What happened to Dan and Rebecca Phillips?
correct answers
The Young and the Restless
Who is the father of Sally McGuire's baby?
Who is responsible for Leslie Brooks' emotional
breakdown?
What is Brad Elliot's real profession?
correct answers
Search for Tomorrow
Who is responsible for Doug Martin's car accident?
With whom is Scott Phillips having an affair?
To whom is Eunice Martin married?
correct answers
Somerset
Who did Tony COOper marry?
Who headed the syndicate operation in Somerset to
try and gain ownership of Delaney Brands?
Who shot Andrea Moore?
correct answers
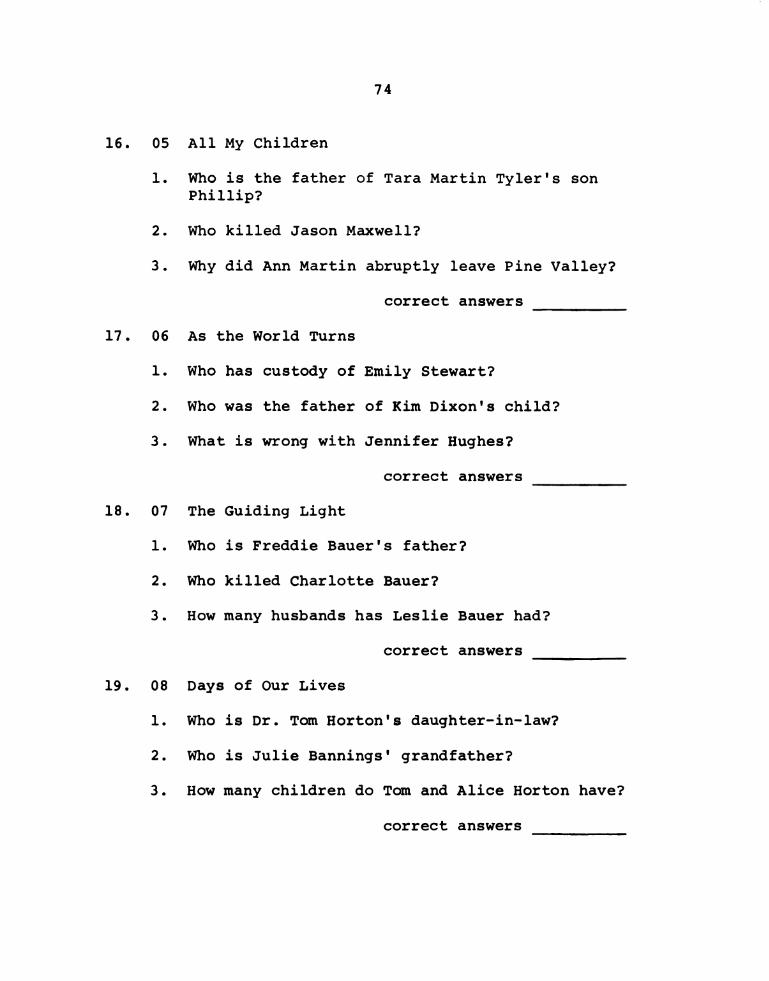
16.
17.
18.
19.
74
All My Children
Who is the father of Tara Martin Tyler's son
Phillip?
Who killed Jason Maxwell?
Why did Ann Martin abruptly leave Pine Valley?
correct answers
As the World Turns
Who has custody of Emily Stewart?
Who was the father of Kim Dixon's child?
What is wrong with Jennifer Hughes?
correct answers
The Guiding Light
Who is Freddie Bauer's father?
Who killed Charlotte Bauer?
How many husbands has Leslie Bauer had?
correct answers
Days of Our Lives
Who is Dr. Tom Horton's daughter—in-law?
Who is Julie Bannings' grandfather?
How many children do Tom and Alice Horton have?
correct answers

20.
21.
22.
23.
09
75
The Edge of Night
Who was the intended victim when Nicole Drake was
killed?
Who killed Babs Macelli?
Who is working as an undercover agent in the
syndicate for the Monticello police?
correct answers
The Doctors
Who killed Dr. John Morrison?
Who is Dr. Althea Davis' most recent husband?
Who is Ann Larimer's former fiancee?
correct answers
Another World
Who caused Alice Frame's emotional breakdown?
To whom was Rachael Frame married when Jamie was
born?
Why was Steven Frame sent to prison?
correct answers
General Hospital
Who is the father of Diana Taylor's baby?
With whom did Teddy Holmes elope?
Who married Dr. James Hobart after his car
accident?
correc t answers

24.
25.
13
76
How to Survive a Marriage
How did David Bachman die?
For whom did Larry Kirby leave his wife Chris?
What is Dr. Julie Franklin's profession?
correct answers
One Life to Live
Who is the father of the child Cathy Craig is
carrying?
Why did Victoria Burke divorce her second husband,
Steve Burke?
With whom is Vince Wolek in love?
correct answers
Total number of correct answers (12-25):
26.
27.
28.
29.
30.
31.
How long have you been watching soap operas?
What is your favorite soap opera?
Why?
Who are your favorite soap opera people?
Why?
Which people do you like least?
Why?
Are there any character(s) you would like to be like?
Who?
DO you ever emagine yourself as one of the characters?
If so, which ones?

32.
33.
34.
35.
36.
37.
38.
39.
40.
77
Do you ever imagine yourself in a similar situation
that a particular character faces?
Please give an example.
Do you talk about the soaps with
friends ____ yes ____ no
relatives ____ yes ____ no
children ____ yes ____ no
spouse _____yes ____ no
anyone else yes ____ no
Why do you watch soap operas?
to learn
to escape
____ to relax
to be aroused
as a habit
to pass time
for companionship
for entertainment
Why did you first begin to watch soap operas?
Why do you watch the particular soaps that you do?
Do you get any useful information from the soap operas
you watch?
How is it useful to you?
Was the information you got socially useful?
Did any information or opinions you heard on soap
operas change your Opinions about any topic or issue?
(Ask for examples.)
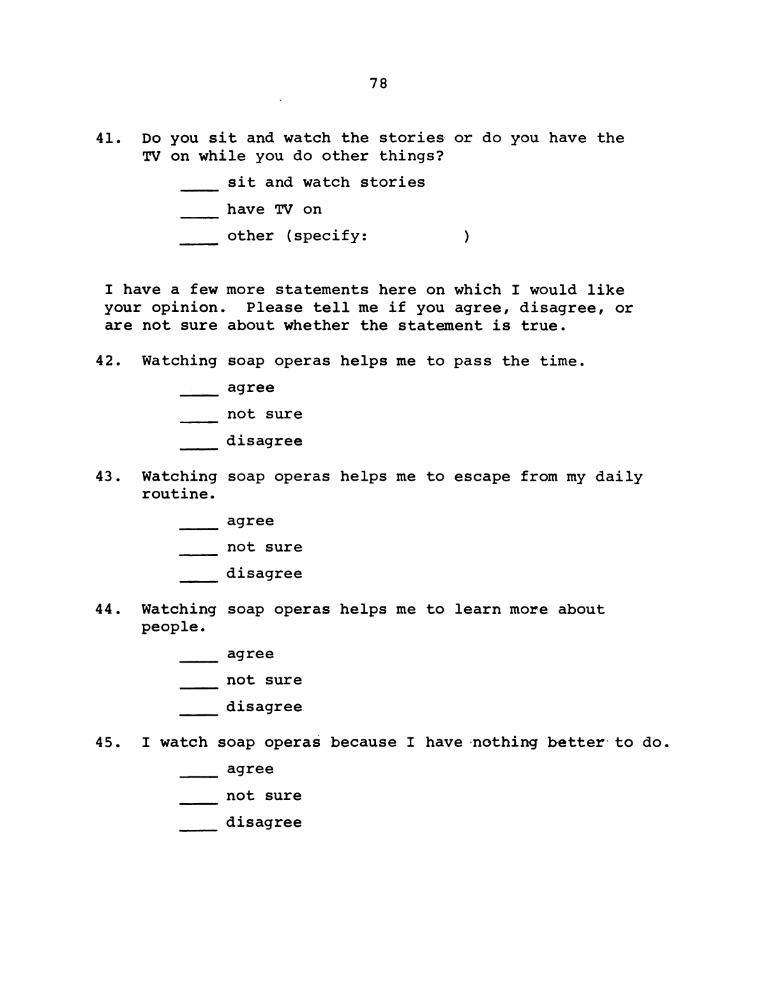
41.
78
Do you sit and watch the stories or do you have the
TV on while you do other things?
sit and watch stories
have TV on
other (specify: )
I have a few more statements here on which I would like
your opinion. Please tell me if you agree, disagree, or
are not sure about whether the statement is true.
42.
43.
44.
45.
Watching soap operas helps me to pass the time.
agree
not sure
disagree
Watching soap operas helps me to escape from my daily
routine.
agree
not sure
disagree
Watching soap operas helps me to learn more about
people.
agree
not sure
disagree
I watch soap Operas because I have nothing better to do.
agree
not sure
disagree
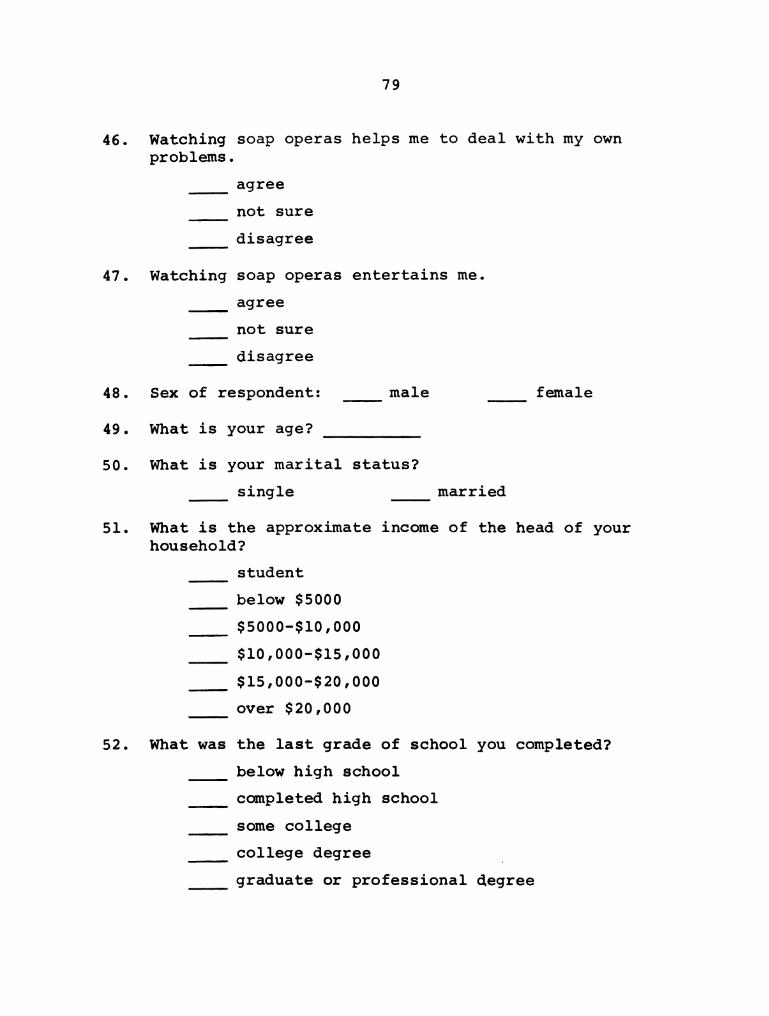
46. Watching
problems.
47. Watching
79
soap Operas helps me to deal with my own
agree
not sure
disagree
soap operas entertains me.
agree
not sure
disagree
48. Sex of respondent: male female
49. What is your age?
50. What is your marital status?
single married
51. What is the approximate income of the head of your
household?
52. What was
student
below $5000
$5000-$10,000
$10,000-$15,000
$15,000-$20,000
over $20,000
the last grade of school you completed?
below high school
completed high school
some college
college degree
graduate or professional degree

APPENDIX B
SOAP OPERA STUDY

APPENDIX B
Mitzi Bond
Soap Opera Study
August 1974
Interviewer: ID number:
Date: Telephone number:
Hello, I'm from.the Department of Communication
at Michigan State University. We're doing a study on daytime televi-
sion and if I may have a few'minutes of your time, I'd like to ask you
a few questions.
1. I will read a list of programs that are on television during the
day. Please tell me which of the following shows you watch and how
many days a week you watch each one.
0 1 .2. 2. i 53.
01 Love of Life
02 The Young and the Restless
03 Search for Tomorrow
04 Somerset
05 All My Children
06 As the World Turns
07 The Guiding Light
08 Days of Our Lives
09 The Edge of Night
10 The Doctors
11 Another World
12 General Hospital
13 How to Survive a Marriage
14 One Life to Live
80
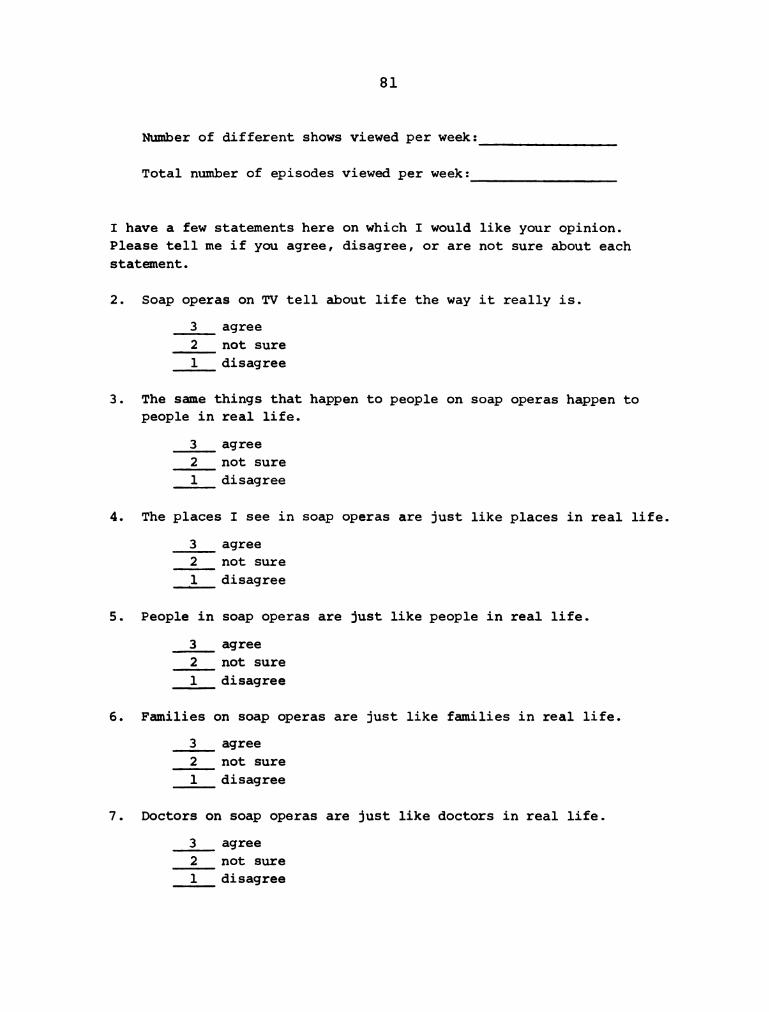
81
Number of different shows viewed per week:
Total number of episodes viewed per week:
I have a few statements here on which I would like your opinion.
Please tell me if you agree, disagree, or are not sure about each
statement.
2. Soap operas on TV tell about life the way it really is.
3 agree
2 not sure
1 disagree
3. The same things that happen to people on soap operas happen to
people in real life.
3 agree
2 not sure
1 disagree
4. The places I see in soap operas are just like places in real life.
3 agree
2 not sure
1 disagree
5. People in soap operas are just like people in real life.
3 agree
2 not sure
1 disagree
6. Families on soap operas are just like families in real life.
3 agree
2 not sure
1 disagree
7. Doctors on soap Operas are just like doctors in real life.
3 agree
2 not sure
1 disagree

82
8. Marriages on soap operas are just like marriages in real life.
3 agree
2 not sure
1 disagree
9. Problems people have in soap operas are just like problems people
have in real life.
3 agree
2 not sure
1 disagree
10. Is there any soap opera character who reminds you of yourself?
3 agree
2 not sure
1 disagree
I have a few questions to ask you about the soap operas you watch.
(Only ask respondent questions about soap operas he/she watches.
Refer to page 1.)
ll. 01 Love of Life
1. With whom is Jamie Rollins having an affair?
2. Who was responsible for the attempts on Bruce and Vanessa
Sterling's lives?
3. What happened to Dan and Rebecca Phillips?

12.
13.
14.
83
Who is responsible for Leslie Brooks' emotional breakdown?
Who is responsible for Doug Martin's car accident?
With whom is Scott Phillips having an affair?
02 The Young and the Restless
1. Who is the father of Sally McGuire's baby?
2.
3. What is Brad Elliot's real profession?
03 Search for Tomorrow
1.
2.
3. To whom is Eunice Martin now married?
04 Somerset
1. Who did Tony Cooper marry?
2. Who headed the syndicate operation in Somerset which tried to
get ownership of Delaney Brands?
Who shot Andrea Moore?

15.
16.
17.
yes"
.“
84
Who is the father of Tara Martin Tyler's son Phillip?
05 All My Children
1.
2. Who killed Jason Maxwell?
3. Why did Ann Martin abruptly leave Pine Valley?
Who has custody of Emily Stewart?
Who was the father of Kim Dixon's child?
What is wrong with Jennifer Hughes?
06 As the World Turns
1.
2.
3.
07 The Guiding Light
1. Who is Freddie Bauer's father?
2. Who kiIled Charlotte Bauer?
How'many husbands has Leslie Bauer had?

18.
19.
20.
85
Who is Dr. Tom Horton's daughter-in-law?
Who is Julie Bannings' grandfather?
How many children do Tom and Alice Horton have?
Who was the intended victim When Nicole Drake was killed?
Who is working as an undercover agent in the syndicate for the
Who killed Dr. John Morrison?
08 Days of Our Lives
1.
2.
3.
09 The Edge of Night.
1.
2. Who killed Babs Macelli?
3.
Monticello police?
10 The Doctors
1.
2. Who is Dr. Althea Davis' most recent husband?
Who is Ann Larimer's former fiancee?

21.
22.
23.
86
Who caused Alice Frame's emotional breakdown?
To whom was Rachael Frame married when Jamie was born?
Who married Dr. James Hobart after his car accident?
For whom did Larry Kirby leave his wife Chris?
11 Another World
1.
2.
3. Why was Steven Frame sent to prison?
12 General Hospital
1. Who is the father of Diana Taylor's baby?
2. With whom did Teddy Holmes elope?
3.
13 How to Survive a Marriage
1. How did David Bachman die?
2.
3. What is Dr. Julie Franklin's profession?

24.
25.
26.
27.
28.
29.
30.
87
14 One Life to Live
1. Who is the father of the child Cathy Craig is carrying?
2. Why did Victoria Burke divorce her second husband, Steve
Burke?
3. With whom.is Vince Wolek in love?
Number of correct answers per show (ll-24):
How long have you been watching soap operas?
years
What is your favorite soap opera? (Only one please.)
How important are the soap operas to you would you say?
3 very important
2 somewhat important
1 not very important
How involved do you get watching your favorite soap opera?
3 very involved
2 somewhat involved
1 not very involved
Are there any characters you would like to be like?
2 Yes 1 No
DO you ever imagine yourself as one of the characters?
2 Yes 1 No

31.
32.
33.
34.
35.
36.
37.
38.
39.
40.
88
Do you ever imagine yourself in a similar situation that a
particular character faces?
2 Yes 1 No
Do you ever think about telling some characters how to handle
their problems?
2 Yes 1 No
Have you written to the network or any place about a show?
2 Yes 1 No
Do you ever find yourself talking to the characters while the show
is on?
2 Yes 1 No
Do you ever worry about the characters in between episodes?
2 Yes 1 NO
Total number of yeses (32-35):
Why did you first begin to watch soap operas?
Why do you watch the particular soaps that you do?
Do you get any useful information from the soap Operas you watch?
2 Yes 1 No
How is it useful to you?
When your stories are on, do you give them full attention or do you
do other things at the same time?
3 full attention
2 some of both
1 do other things

89
I have a few more statements here on which I would like your opinion.
Please tell me if you agree, disagree, or are not sure about whether
the statement is true.
41.
42.
43.
44.
45.
46.
47.
48.
Watching soap Operas helps me to pass the time.
3 agree
2 not sure
1 disagree
Watching soap Operas helps me to escape from my daily routine.
3 agree
2 not sure
1 disagree
I watch soap operas because I have nothing better to do.
3 agree
2 not sure
1 disagree
Watching soap operas helps me to deal with other people.
3 agree
2 not sure
1 disagree
Watching soap operas takes me away for a little while.
3 agree
2 not sure
1 disagree
I watch soap operas when there's no one to talk to.
3 agree
2 not sure
1 disagree
Watching soap operas make me feel less lonely.
3 agree
2 not sure
1 disagree
Record sex of respondent: 1 male 2 female

90
Just a few final questions
49.
50.
51.
52.
1
2
3
uh
U'I
0‘
\l
l
N
w
b
U‘l
What is your age?
Are you single or married? 1 single 2 married
What is the approximate yearly income of the head of your
household?
student
below $5000
$5000-$10,000
$10,000-$15,000
$15,000-$20,000
over $20,000
retired
What was the last grade of school you completed?
below high school
completed high school
some college
college degree
graduate or professional degree
THANK YOU VERY MUCH FOR HELPING ME!

APPENDIX C
ONE-WAY ANALYSIS OF VARIANCE

TABLE C1.--One-Way Analysis of Variance
(Viewing-Shows)
(N = 157)
Low Medium High
(1-2) (3-5) (6+) F P < df
Perceived
Reality 14.3 16.2 16.7 3.987 .021 2/152
Knowledge
answers per
show 2.1 2.0 2.3 1.864 .159 2/151
total correct
answers 4.8 7.7 14.9 19.281 .001 2/152
Involvement 2.8 3.7 4.1 16.736 .001 2/149
Identification 3.5 3.8 4.0 3.280 .040 2/148
Interaction 5.3 5.5 5.8 2.786 .065 2/148
Companionship 4.2 4.2 4.0 .384 .682 2/149
Boredom 3.1 3.1 3.1 .014 .986 2/149
Escapism 3.6 3.6 4.1 1.290 .278 2/149
Social Utility 2.3 2.6 2.8 2.988 .053 2/149
91

92
TABLE C2.--One-Way Analysis of Variance
(Viewing-Episodes)
(N = 154)
Low Medium High
(1-7) (8-16) (17+) F P < df
Perceived
Reality 14.4 15.5 16.9 3.812 .024 2/152
Knowledge
answers per
show 2.0 2.0 2.3 2.335 .100 2/151
total correct
answers 5.0 6.9 13.9 16.640 .001 2/152
Involvement 2.7 3.5 4.3 22.809 .001 2/149
Identification 3.5 4.0 3.8 3.692 .027 2/148
Interaction 5.3 5.4 5.8 3.212 .043 2/148
Companionship 4.2 4.1 4.1 .051 .950 2/149
Boredom 3.0 3.1 3.1 .083 .921 2/149
Escapism 3.7 3.4 4.2 3.410 .036 2/149
Social Utility 2.3 2.6 2.8 3.928 .022‘ 2/149

APPENDIX D
CURRENT SOAP OPERAS (JANUARY, 1975)
1973 NIELSEN SOAP OPERA RATINGS

TABLE Dl.--Current Soap Operas
(January, 1975)
Serial Premiere Date NetwOrk ::;:I:tsg:w::s
Search for
Tomorrow 3 Sept. 1951 CBS 37%
Love of Life 24 Sept. 1951 CBS 39%
The Guiding Light 30 June 1952 CBS 36%
As The World Turns 2 April 1956 CBS 54%
The Edge of Night 2 April 1956 CBS 50%
General Hospital 1 April 1963 ABC 14%
The Doctors 1 April 1963 NBC 12%
Another World 4 May 1964 NBC 15%
Days of Our Lives 19 Nov. 1965 NBC 17%
One Life to Live 15 July 1968 ABC 10%
All My Children 5 Jan. 1970 ABC 12%
Somerset 30 March 1970 NBC 7%
The Young and the
Restless 26 March 1973 CBS 71%
How to Survive a
Marriage* 7 Jan. 1974 NBC 16%
*Canceled in April, 1975.
93

94
TABLE D2.--1973 Nielsen Soap Opera Ratings
Time Serial Rating** A:::::CB
11:30 Love of Life (CBS) 6.9 31
12:00 The Young and the
Restless (CBS) 5.2 21
12:30 Search for Tomorrow (CBS) 8.5 30
1:00 All My Children (ABC) 8.1 28
1:30 As The World Turns (CBS) 10.6 35
2:00 Days of Our Lives (NBC) 9.9 32
2:00 The Guiding Light (CBS) 8.3 28
2:30 The Doctors (NBC) 9.2 32
2:30 The Edge of Night (CBS) 8.0 28
3:00 Another World (NBC) 9.8 33
3:00 General Hospital (ABC) 9.6 31
3:30 Return to Peyton Place
(NBC)* 7.2 24
4:00 Somerset (NBC) 6.8 21
4:00 The Secret Storm (CBS)* 6.5 ‘21
*Canceled in 1974.
**The A. C. Nielsen Company is a research firm that conducts
the audience-measurement research that is paid for by the
networks, advertising agencies, and advertisers. The
audience data comes in two primary forms: the rating and
the share. The rating is a figure that indicates the per-
centage of all existing TV homes actually tuned to a par-
ticular program at a given moment. (Most soaps have a
rating around 7.0 or 8.0 which means that seven or eight
per cent of the homes equipped with television were tuned
to that program.) The audience share is a figure indicat-
ing the percentage of all homes actually using TV at a
given time that are tuned to a particular program. The
Nielsen ratings come from viewing information provided by
3400 television homes.

BIBLIOGRAPHY
BIBLIOGRAPHY
Blumler, J., D. McQuail, and R. Brown, "The Social Origins
of the Gratifications Associated with Television
Viewing," in D. McQuail (ed.), Reader in Mass
Communication, London: Penguin, 1972.
Clark, D. G., and W. B. Blankenburg, "Trends in Violent
Content in Selected Mass Media," Television and
Social Behavior, Vol. 1, ed. G. A. Comstock and
E. A. Rubinstein. U.S. Department of Health,
Education and Welfare, 1971.
Danowski, James, "Functions and Gratifications of Soap
Opera Viewing: Some Operationalizations" (1973).
Dervin, Brenda, and Bradley Greenberg, "The Communication
Environment of the Urban Poor," East Lansing:
Michigan State University, Department of Communi-
cation, 1972.
Dominick, Joseph, and Bradley Greenberg, "Mass Media Func-
tions Among Low-Income Adolescents," Use of Mass
Media by the Urban Poor, ed. Bradley Greenberg and
Brenda Dervin, New York: Praeger Publishers, 1970.
Edmondson, Madeleine, and David Rounds. The Soaps: Day—
time Serials of Radio and TV. New York: Stein and
Day, 1973.
Feshbach, Seymour, "Reality and Fantasy in Filmed Violencefl'
Television and Social Behavior, Vol. III, ed.
Murray, Rubinstein, and Comstock. U.S. Department
of HEW, 1971.
95

96
Gerbner, George, "The Two Worlds of Violence:‘ Television
and Reality," Mass Media and'Violence, ed: Lange,
Baker and Ball. U.S. Government Printing Office,
1969.
Greenberg, Bradley S., "Gratifications and Motivations of
Television Viewing for British Children" (1973).
Greenberg, Bradley and Joseph Dominick, "Television Be-
havior Among Disadvantaged Children," Use of Mass
Media by the Urban Poor, ed. Greenberg and Dervin,
New York: Praeger Publishers, 1970.
Greenberg, Bradley, P. Ericson, and M. Vlahos, “Children's
Television Behavior as Perceived by Mother and
Child," Television and Social Behavior, ed. Rubin-
stein, Comstock and Murray, U.S. Department of HEW,
1971.
Greenberg, Bradley S. and Byron Reeves, "Children and the
Perceived Reality of Television" (March, 1974).
Herzog, Herta, "Modivations and Gratifications of Daily
Serial Listeners," Radio Research, 1942-1943, ed.
Paul Lazarfield and Frank Stanton, New York: 1944.
Katzman, Natan, "Developmental Interactions with the Ef-
fects of Television" (1971).
Katzman, Natan, "Television Soap Operas: What's Been Going
on Anyway," Public Opinion Quarterly, #36, 1972-73.
Kinser, Nora Scott, "Soap Sin in the Afternoon," Psychology
Today, August 1973, pp. 46-48.
LaPota, Margherite and Bruce LaPota, "Studying the Soap
Opera," English Journal, April 1973.
"Profile: Iona Phillips," Journal of Broadcasting, 6
November 1972, p. 75.
"Real Drama in Daytime: The Networks' Battle for Domi-
nance," Journal of Broadcasting, 2 July 1973,
pp. 17-19.
97
Rosengren, Karl E., "Uses and Gratifications: An Over-
view," Department of SociologYi University of Lund
(mimeo), 1972.
Rosengren, K. E. and S. Windahl, "Mass Media Consumption
as a Functional Alternative," in D. McQuail (ed.),
op. cit.

HICHIGQN STATE UNIV. LIBRARIES
ill||llllll|||||||1|||N|||H||||||||H||l|||||||||l||||l|l|||||
31293104228550