Embed Size (px)
Citation preview

ESTUDIOS MONETARIOS Y FINANCIEROS
THE IMPACT OF FINANCIAL VARIABLES ON FIRMS’ REAL DECISIONS: EVIDENCE FROM SPANISH FIRM-LEVEL DATA
Ignacio Hernando
Carmen Martínez-Carrascal
WORKSHOP ON CORPORATE FINANCE AND MONETARY POLICY
15-16 May 2006

2ESTUDIOS MONETARIOS Y FINANCIEROS
INTRODUCTION
Financial position of the corporate sector may influence the performance of the real economy and the stability of the financial system
In its turn, the financial position of the corporate sector is relevant to determine the magnitude of the effects of monetary policy shocks
Adjustment by companies as a result of monetary policy shift can potentially involve a wide range of activities, but their response might depend on the degree of financial pressure they face
Distribution of financial position matters. Financial fragility of certain firms are not offset by soundness of others. The effect of aggregate financial indicators on business activity in estimates at macro level has been elusive.
Aim of this paper: describing aspects of the financial situation of the corporate sector in Spain and analyzing how companies adjust investment and employment to variations in financial pressure

3ESTUDIOS MONETARIOS Y FINANCIEROS
KEY ISSUES OF THE PAPER
I. Overall picture of the financial position of Spanish non-financial firms- Substantial cross-sectional dispersion in terms of the degree of financial tightness
II. The impact of financial position on business activity. - Financial position, proxied by alternative financial variables, matters for business activity
III. Shape of the relationship- The impact is non-linear and becomes more intense when financial pressure exceeds a certain threshold
IV. Construction of composite indicators for the impact of corporate financial health on real decisions- Indicators based on aggregate data may not be reliable enough to capture the impact of corporate financial health on real decisions
4ESTUDIOS MONETARIOS Y FINANCIEROS
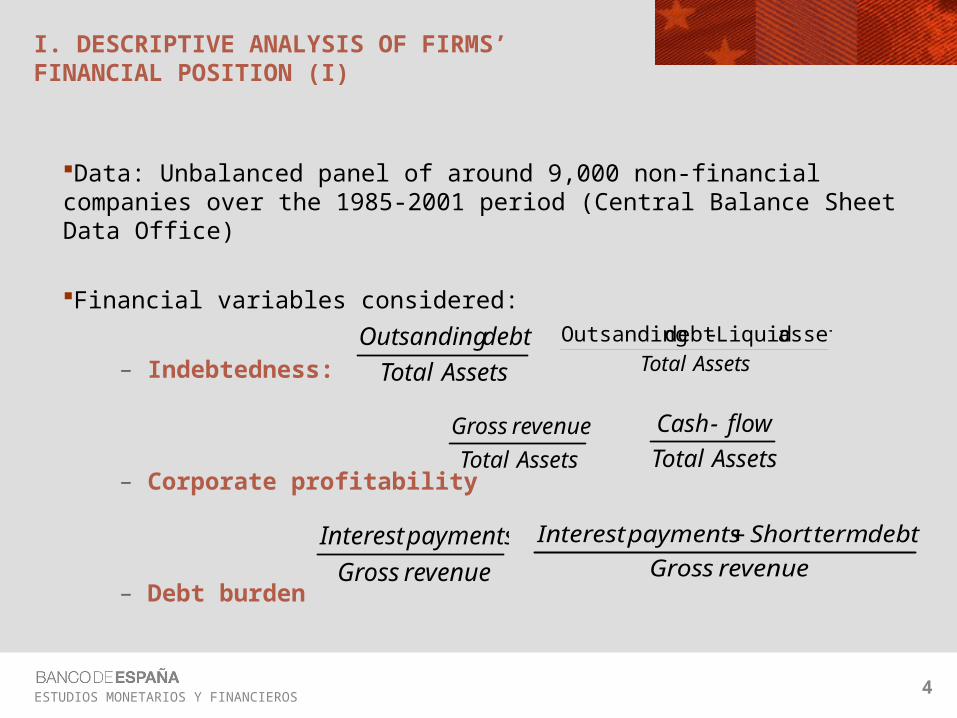
I. DESCRIPTIVE ANALYSIS OF FIRMS’ FINANCIAL POSITION (I)
Data: Unbalanced panel of around 9,000 non-financial companies over the 1985-2001 period (Central Balance Sheet Data Office)
Financial variables considered:
– Indebtedness:
– Corporate profitability
– Debt burden
AssetsTotal
assetsLiquid-debtOutsanding
AssetsTotal
revenueGross
revenueGross
debttermShortpaymentsInterest
AssetsTotal
debtOutsanding
AssetsTotal
flow-Cash
revenueGross
paymentsInterest

5ESTUDIOS MONETARIOS Y FINANCIEROS
I. DESCRIPTIVE ANALYSIS OF FIRMS’ FINANCIAL POSITION (II)
0
15
30
45
60
85 87 89 91 93 95 97 99 01
p25 p50 p75
DEBT / TOTAL ASSETS
%
0
10
20
30
40
85 87 89 91 93 95 97 99 01
p25 p50 p75
GROSS REVENUE / TOTAL ASSETS
%
Substantial cross-sectional variation in the distribution of Spanish firms for indebtedness, profitability and debt burden indicators
0
5
10
15
20
25
85 87 89 91 93 95 97 99 01
p25 p50 p75CASH FLOW / TOTAL ASSETS
%
-15
0
15
30
45
60
85 87 89 91 93 95 97 99 01
p25 p50 p75
NET DEBT / TOTAL ASSETS
%

6ESTUDIOS MONETARIOS Y FINANCIEROS
I. DESCRIPTIVE ANALYSIS OF FIRMS’ FINANCIAL POSITION (III)
0
15
30
45
60
75
85 87 89 91 93 95 97 99 01
p25 p50 p75
INTEREST DEBT BURDEN
%
0
100
200
300
400
85 87 89 91 93 95 97 99 01
p25 p50 p75TOTAL DEBT BURDEN
%

7ESTUDIOS MONETARIOS Y FINANCIEROS
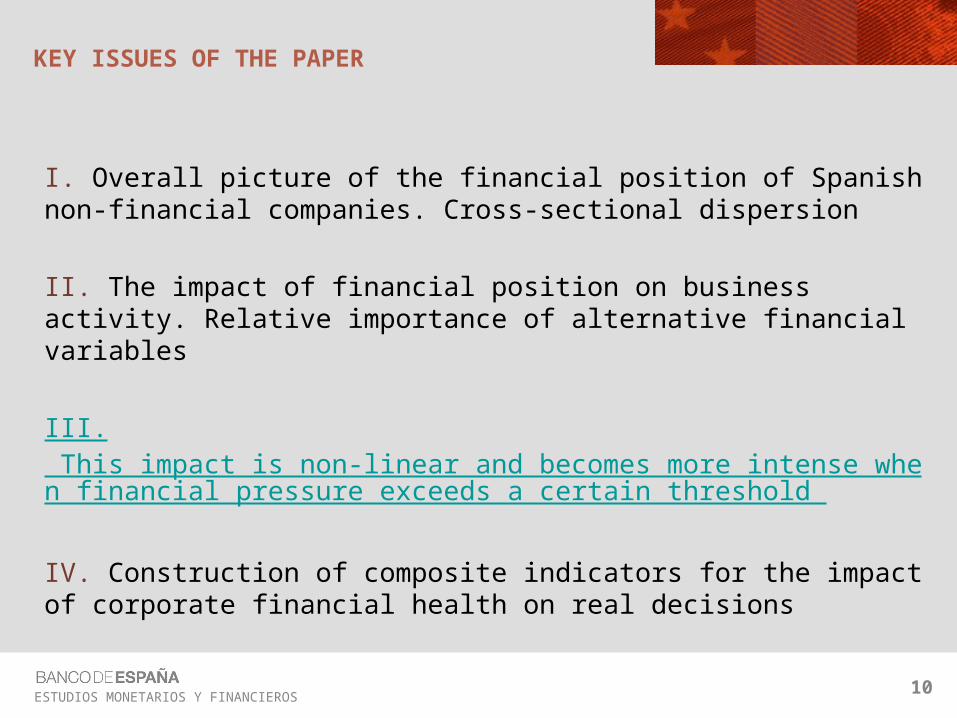
KEY ISSUES OF THE PAPER
I. Overall picture of the financial position of Spanish non-financial companies. Cross-sectional dispersion
II. The impact of financial position on business activity. Relative importance of alternative financial variables
III. This impact is non-linear and becomes more intense when financial pressure exceeds a certain threshold
IV. Construction of composite indicators for the impact of corporate financial health on real decisions

8ESTUDIOS MONETARIOS Y FINANCIEROS
II. THE IMPACT OF FINANCIAL POSITION ON INVESTMENT AND EMPLOYMENT DECISIONS
Estimation method: System- GMM
tittitititi
itii
ti
XykyyK
I
K
I,
',2,41,3,2
1,1
,
)(****
tittitititititiiti Xwwknn ,',,5,41,3,21,1, ****

9ESTUDIOS MONETARIOS Y FINANCIEROS
II. THE IMPACT OF FINANCIAL POSITION ON INVESTMENT AND EMPLOYMENT DECISIONS. EMPIRICAL RESULTS
When included one at a time, all financial indicators are significant
When simultaneously included, the indicators of debt-service burden are those that display a more robust effect
Preferred specifications:
– Investment: total debt burden, gross revenue over total assets and net debt over total assets
– Employment: total debt burden and gross revenue over total assets
10ESTUDIOS MONETARIOS Y FINANCIEROS
KEY ISSUES OF THE PAPER
I. Overall picture of the financial position of Spanish non-financial companies. Cross-sectional dispersion
II. The impact of financial position on business activity. Relative importance of alternative financial variables
III. This impact is non-linear and becomes more intense when financial pressure exceeds a certain threshold
IV. Construction of composite indicators for the impact of corporate financial health on real decisions

11ESTUDIOS MONETARIOS Y FINANCIEROS
III. a. NON-LINEAR LINK BETWEEN FINANCIAL POSITION AND INVESTMENT. DESCRIPTIVE EVIDENCE
5
10
15
20
25
30
35
86 89 92 95 98 01
High br Med br Low br INVESTMENT RATE - INTEREST DEBT BURDEN
%
0
5
10
15
20
25
30
35
86 89 92 95 98 01
High tdb Med tdb Low tdb
INVESTMENT RATE - TOTAL DEBT BURDEN
%

12ESTUDIOS MONETARIOS Y FINANCIEROS
III. b. NON-LINEAR LINK BETWEEN FINANCIAL POSITION AND EMPLOYMENT. DESCRIPTIVE EVIDENCE
-12
-8
-4
0
4
8
12
86 89 92 95 98 01
High br Med br
Low br
EMPLOYMENT GROWTH - INTEREST DEBT BURDEN
%
-12
-8
-4
0
4
8
12
86 89 92 95 98 01
High tdb Med tdb Low tdb
EMPLOYMENT GROWTH - TOTAL DEBT BURDEN
%

13ESTUDIOS MONETARIOS Y FINANCIEROS
III. c. NON-LINEAR LINK BETWEEN FINANCIAL POSITION AND INVESTMENT. EMPIRICAL RESULTS
titF
tiF
tiF
ti
tititi
itii
ti
DFDFDF
ykyyK
I
K
I
,100901,390751,27501,1
2,41,3,21,
1,
)(****
Degree of financial Debt burdenpressure
B/A (B-m)/A br tdb GR/A CF/A
LOW 0.072 -0.061 -0.081 -0.007 0.202 0.331
MODERATE -0.013 -0.147 -0.100 -0.005 0.662 3.470
HIGH -0.052 -0.127 -0.031 -0.004 0.658 0.890
Non-linear effects of financial variables on investment
Indebtedness Profitability

14ESTUDIOS MONETARIOS Y FINANCIEROS
KEY ISSUES OF THE PAPER
I. Overall picture of the financial position of Spanish non-financial companies. Cross-sectional dispersion
II. The impact of financial position on business activity. Relative importance of alternative financial variables
III. This impact is non-linear and becomes more intense when financial pressure exceeds a certain threshold
IV. Construction of composite indicators for the impact of corporate financial health on real decisions

15ESTUDIOS MONETARIOS Y FINANCIEROS
IV. COMPOSITE INDICATOR OF THE IMPACT OF FINANCIAL CONDITIONS ON INVESTMENT AND EMPLOYMENT
This indicator must take into account the following elements:–Cross-sectional dispersion in firms’ financial position–Differences across firms in the sensitivity of their real decisions to their financial position–Relative weight of each firm for the evolution of aggregate investment
Our preferred non-linear specifications include:– total debt-burden, net debt and gross revenue (investment)– total debt-burden and gross revenue (employment)
kti
k
kti XFCII ,, ˆ k
tik
kti XFCIE ,, ˆ

16ESTUDIOS MONETARIOS Y FINANCIEROS
IV. COMPOSITE INDICATOR OF THE IMPACT OF FINANCIAL CONDITIONS ON INVESTMENT
Figure 4COMPOSITE INDICATORS OF THE IMPACT OF FINANCIAL CONDITIONS ON
INVESTMENT
Median Weighted average 90th
50
100
150
200
250
300
85 87 89 91 93 95 97 99 01
50
100
150
200
250
300250
400
550
700
250
400
550
700
50100150200250300
85 87 89 91 93 95 97 99 01
50100150200250300
100300500700900
1,100
1003005007009001,100

17ESTUDIOS MONETARIOS Y FINANCIEROS
IV. COMPOSITE INDICATOR OF THE IMPACT OF FINANCIAL CONDITIONS ON EMPLOYMENT
Figure 4
COMPOSITE INDICATOR OF THE IMPACT OF FINANCIAL CONDITIONS ON EMPLOYMENT
Median Weighted average 90th
50
100
150
200
250
300
85 87 89 91 93 95 97 99 01
50
100
150
200
250
300
150
400
650
900
1,150
150
400
650
900
1,150
50100150200250300
85 87 89 91 93 95 97 99 01
50100150200250300
100300500700900
1,100
1003005007009001,100

18ESTUDIOS MONETARIOS Y FINANCIEROS
V. USES OF COMPOSITE INDICATORS OF THE IMPACT OF FINANCIAL CONDITIONS ON EMPLOYMENT AND INVESTMENT (I)
Regularly analyzed to assess investment prospects
–Updated using CBSO (annual and quarterly) data •Annual CBSO data: available with an approximate lag of 1 year.
Quarterly CBSO data: available with a lag of 1 quarter
•The annual database contains approximately 8000 firms per year. The quarterly database contains on average 900 firms per quarter•Large companies have a predominant weight

19ESTUDIOS MONETARIOS Y FINANCIEROS
V. USES OF COMPOSITE INDICATORS OF THE IMPACT OF FINANCIAL CONDITIONS ON EMPLOYMENT AND INVESTMENT (I)
Regularly analyzed to assess investment prospects
-200
-100
0
100
200
300
400
500
90 92 94 96 98 00 02 04 I II 2005
III IV
COMPOSITE INDICATOR OF FINANCIAL PRESSURE ON INVESTMENT
1990=100
-350
-200
-50
100
250
91 93 95 97 99 01 03 05
CONTRIBUTION OF INDEBTEDNESS
CONTRIBUTION OF DEBT-SERVICE BURDEN
CONTRIBUTION OF PROFITABILITY
TOTAL CHANGE IN THE INDICATOR
CHANGE IN COMPOSITE INDICATOR OF FINANCIAL PRESSURE ON INVESTMENT AND CONTRIBUTION OF ITS COMPONENTS

20ESTUDIOS MONETARIOS Y FINANCIEROS
V. USES OF COMPOSITE INDICATORS OF THE IMPACT OF FINANCIAL CONDITIONS ON EMPLOYMENT AND INVESTMENT (II)
-10
-5
0
5
10
15
20
95 96 97 98 99 00 01 02 03
Y
USER COST
CF
NON-EXPLAINED
INVESTMENT GROWTH RATE
QUARTERLY MODEL
%
Explanatory power to explain aggregate productive investment growth rate, using the quarterly macroeconometric model of the Spanish economyThe introduction of composite indicator results in a reduction of the non-explained component. The contribution of the rest of the variables remains broadly unchanged
-10
-5
0
5
10
15
95 96 97 98 99 00 01 02 03
Y
USER COSTCF
NON-EXPLAINEDC.INDICATOR
INVESTMENT GROWTH RATE
QUARTERLI MODEL, REESTIMATED INCLUDING COMPOSITE INDICATOR
%

21ESTUDIOS MONETARIOS Y FINANCIEROS
KEY FINDINGS
Substantial cross-sectional dispersion in terms of the degree of financial tightness
Financial position matters for business activity
This link is non-linear and becomes more intense when financial pressure exceeds a certain threshold
Indicators based on aggregate data are not reliable enough to capture the impact of corporate financial health on real decisions

ESTUDIOS MONETARIOS Y FINANCIEROS
THANK YOU FOR YOUR ATTENTION