Embed Size (px)
Citation preview
8/18/2019 Estudio de corrupcion en Europa
http://slidepdf.com/reader/full/estudio-de-corrupcion-en-europa 1/28
RegionalPolicy
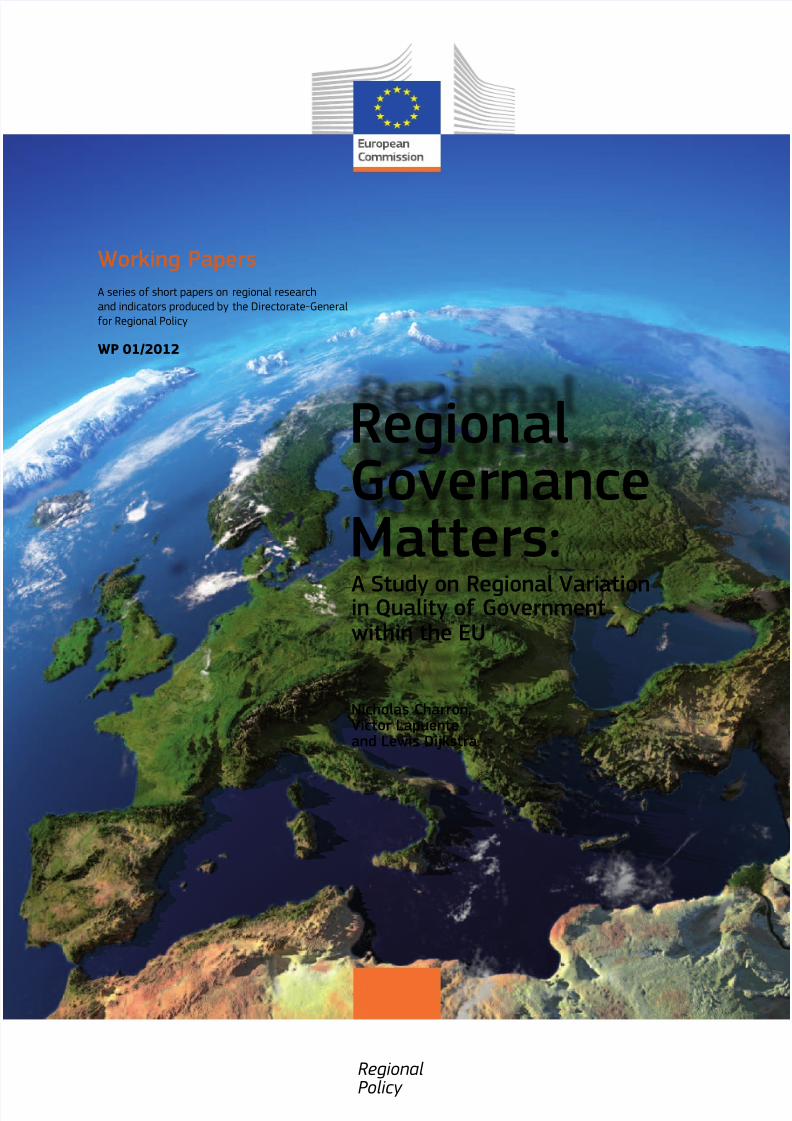
RegionalGovernanceMatters:A Study on Regional Variationin Quality of Governmentwithin the EU
Nicholas Charron,Victor Lapuenteand Lewis Dijkstra
Working Papers
A series of short papers on regional researchand indicators produced by the Directorate-Generalfor Regional Policy
WP 01/2012
8/18/2019 Estudio de corrupcion en Europa
http://slidepdf.com/reader/full/estudio-de-corrupcion-en-europa 2/28
> Abstract
This Working Paper presents novel data on the ‘quality of government’ (QoG) –understood as low corruption and as high protection of the rule of law, governmenteffectiveness and accountability – at both national and regional levels in the27 EU Member States. First, the Paper assesses the existing national-level dataon QoG for EU Member States, pointing out the three significantly different clustersof states that emerge, namely high-, medium- and low-QoG countries. Secondly, thePaper presents original sub-national-level data for 172 EU regions, based on a surveyof 34 000 residents across 18 countries. The two measures are then combined into
the ‘EU QoG Index’ (EQI), which shows notable cross-regional variations: whilst high-performing regions in Italy and Spain (e.g. Bolzano and Pais Vasco) rank amongst thebest EU regions, other regions in the same countries perform below the EU average.In addition, the Paper uses the new data to test five basic existing hypotheses on whysome polities have more QoG than others. This shows that the EQI is highly correlatedwith regional indicators of socio-economic development and levels of social trust, yetis statistically unrelated to variables such as population or area size. Finally, the dataalso indicates that political decentralisation is not consistently linked with greatervariation in QoG within the country or higher levels of QoG.
Disclaimer: This Working Paper has been written by Nicholas Charron and Victor
Lapuente (Gothenburg, Quality of Government Institute) and Lewis Dijkstra, European
Commission Directorate-General for Regional Policy (DG REGIO) and is intended to in-
crease awareness of the technical work being done by the staff of the Directorate-
General, as well as by experts working in association with them, and to seek com-
ments and suggestions for further analysis. The views expressed are the authors’
alone and do not necessarily correspond to those of the European Commission.
8/18/2019 Estudio de corrupcion en Europa
http://slidepdf.com/reader/full/estudio-de-corrupcion-en-europa 3/28
1 IntroductionThe principal aim of this paper is descriptive in nature – to present newly created dataon ‘quality of government’ (QoG) for the 27 EU Member States and 172 sub-nationalregions, primarily taken from the largest multi-country, sub-national level survey on QoGto date. In the first and primary part of the Paper, we provide a detailed account of theconstruction of the data, the robustness checks and show the final results, along withproviding the data for all countries and regions in the appendix, free for scholarly use.
Overall, the data show that even in a highly developed area such as the EuropeanUnion, significant QoG variation exists between and within countries – not onlybetween ‘new’ and ‘old’ Member States, but even among the original six countries
of the Union.
The secondary aim of the paper is to use the newly-created data to test severalhypotheses on the relationship between QoG and numerous commonly testednational-level correlates. Whilst the empirical section is admittedly modest,we emphasise such tests at the sub-national level were not possible before thecreation of this data. Overall, we believe that the data provided here significantlycontributes to our understanding of the surprisingly vast amount of QoG variationacross and within EU Member States and provides a valuable tool for researchers whoare interested in moving past national comparisons to more detailed, regional-levelstudies within the European Union.
> Contents 1 Introduction 1 2 Why study quality of government (QoG) in Europe? 2 3 Measuring QoG at the national level in Europe 3 4 Measuring QoG at the regional level in Europe 5 5 Combining the two levels of data – the EU QoG Index (EQI) 6 6 Five hypotheses on why some regions have better QoG 7 7 Results 10 8 Conclusions 15 9 References 16
APPENDIX 10 Description of sub-national survey 18 11 Description of variables & summary statistics 19
1REGIONAL GOVERNANCE MATTERS : A STUDY ON REGIO NAL VARIAT ION IN QUALITY OF GOVERNMENT WITHIN THE EU
8/18/2019 Estudio de corrupcion en Europa
http://slidepdf.com/reader/full/estudio-de-corrupcion-en-europa 4/28
developed countries, yet, at the same time, presentingnoticeable – and statistically significant – differences in QoG.[1] Secondly, this paper gathers data on both national and sub-national differences, uncovering how the latter tend to trumpthe former quite frequently – e.g. Italy’s Bolzano region ranksat the top 10 % of EU regions, whilst Campania is situatedamong the lowest performers in QoG.
The main findings of the paper are the following. First, we findthat there is significant variation in QoG across mainly fourmain cluster groups of states: the top performers are mostlyfrom the Scandinavian, Germanic and English speakingcountries; a second group is largely formed by the Mediterra-nean countries, together with Estonia and Slovenia; the thirdgroup consists of most of the ‘new’ EU Member States plus,notably, Italy and Greece; and a fourth group includes the twonewest Member States – Romania and Bulgaria. We find,however, that in several countries the QoG national-level data
offers a highly distorted picture due to the presenceof significant sub-national variations in QoG. Previous literaturehas pointed in that direction. For example, differences betweenNorthern and Southern Italy are widely known thanks to severalinfluential works (e.g. Putnam, 1993), and the divergencesbetween Flanders and Wallonia in Belgium, as well as theprovinces in Spain, are often debated. Yet such regionaldifferences in QoG in these two countries – and several others– have not been quantified throughout the EU in a systematicway. The most encompassing empirical studies of Europeanregional differences (e.g. Tabellini, 2005) have mostly reliedon income levels as proxies of the level of QoG in a region. Thedata presented in this paper – despite its cross-sectional naturegiven that this is the first time this information on QoGis gathered – is thus a pioneering effort to corroborate for thefirst time within-country QoG variations in most EuropeanMember States simultaneously.
In addition, the paper tests five basic hypotheses using thenewly created European Quality of Government Index (EQI).First, we hypothesise that the EQI will be strongly correlatedwith measures of economic and social development – suchas GDP per capita, health measures, and levels of education(H1). It is important to bear in mind that, as the previousliterature has noted, the causality can work in both directionsthanks to feedback effects, namely that QoG may be bothcause and consequence of these socio-economic variables.
Secondly, we test whether the size of a region – be it populationor area size – has any association with QoG levels (H2). Thirdly,based on numerous national level studies, we hypothesise thatsocial trust will be positively related with the EQI (H3). Finally,we hypothesise that various types of political decentralisation– in the form of federalism or regional administrative authority– will be associated with greater degrees of disparity of QoGamongst regions within a country (H4) or systematically linkedwith country-levels of QoG (H5). Similar to the literature,we find strong evidence for H1 and H3, yet no empiricalevidence of H2 and, contrary to the extensive literatureon decentralisation and QoG, no evidence for H4 or H5.
2 Why study qualityof government (QoG)
in Europe?During the past two decades, numerous studies have indicatedthat QoG is a major determinant of many variables associatedwith the well-being of individuals within a country. Thisliterature emphasises the importance of how a governmentdelivers its policies, instead of what a government delivers –that is, the size or ‘quantity’ of government. And, in particular,the focus is on the extent to which a government delivers itspolicies – irrespective of their nature and degree or provision –in an effective and impartial way and without corruption.Evidence of such attention in the way a government performsits tasks can be found not only in the rise of academic
publications with a focus on this topic, along with the interestfrom international organisations (IO’s) such as the World Bankand the United Nations, which have increasingly underlined thevalue of good governance and sound institutions froma development perspective (Holmberg, Rothstein andNasiritousi, 2009).
This has, in turn, given rise to a recent surge in new datacreation, quantifying aspects of QoG, and, in particular, its mostmeasurable components (even if the measures are subjectiveor perception-based), such as the lack/control of corruption, thestrength of the rule of law, and bureaucratic qualityor ‘government effectiveness’. There is such a high correlationamongst these cross-country indicators that comparativescholars have coined the term ‘quality of government’to encapsulate the concept of a government that it is impartial,efficient and non-corrupt (Rothstein and Teorell, 2008).Countries with a high QoG score higher in almost all dimensionsrelated to the welfare of their citizens (Holmberg, Rothstein andNasiritousi, 2009). QoG has been found – in an extensive andgrowing literature – to lead to outcomes such as bettereconomic performance (Knack and Keefer, 1995; Mauro, 1995;Mo, 2001), higher environmental sustainability (Morse, 2006;Welsch, 2004), lower income inequality and poverty (Gupta,Davoodi, and Alonso-Terme, 1998), better education and healthoutcomes (Mauro, 1998), higher levels of subjective happiness(Frey and Stutzer, 2000), and lower probabilities of civil armed
conflict (Öberg and Melander, 2010).
Despite the importance of these findings, the data within thissub-field is still relatively underdeveloped. One of the majorshortcomings is that most data and research related to QoGhas focused exclusively on the national level, with a particularfocus on developing countries. The two implicit assumptionsin the extant research efforts to gather data on QoG have thusbeen that national differences matter more than sub-nationalones and that, across similar Western democracies, thedifferences in QoG are fairly minor. This Paper challenges bothassumptions. First, we focus exclusively on the 27 MemberStates of the European Union, arguably all moderately to highly
1. In this sense, the paper follows the growing body of recommendations by the European Commission regarding the importance of investing in QoG across manyEU Member States. Regarding the strategies to overcome the economic-financial crisis, it has recently been argued that ‘strengthening institutional and adminis-trative capacity can underpin structural adjustments and foster growth and jobs – and in turn significantly improve the quality of public expenditure.’ (EuropeanCommission 2010a).
2
8/18/2019 Estudio de corrupcion en Europa
http://slidepdf.com/reader/full/estudio-de-corrupcion-en-europa 5/28
data on which it is built, along with a relatively clear descriptionof the conceptual meaning of each concept and the methodologyused to create each variable. Fourthly, the theoretical scopeof each QoG concept is wide rather than narrow. We believe thatunless specified, all aspects of corruption, rule of law, etc. shouldbe included rather than focusing on narrow aspects alone. Thisallows for more information to be included, which is good for reli-ability checks of the data, for example.
As far as the underlying data indicators are concerned for eachpillar, the number of sources vary from country to country in thedataset covering all countries in the world (some small islandstates have only one source for a given pillar, for example, whilesome states have more than 15). However, the advantage of theEU sample is that there are at least nine common sources foreach individual data indicator of QoG for the WGI, and in thecase of Rule of Law (RL), there are at least 12 for all countries[2].The sources of the underlying data are mainly from ‘risk
assessment’ institutes or ‘expert’ surveys, yet they do alsocontain NGO assessments such as Reporters Sans Frontiers andFreedom House, along with data from government agencies andcitizen-based survey data, such as the Gallop World Poll [3] ,
reducing the likelihood that a country’s score was driven by onesource or, moreover, that a country’s score was exclusivelyinfluenced by business interests [4].
We ranked the 27 EU Member States according to each of thefour areas of QoG listed above. All underlying data for the WGI,along with the weighting schemes use by KKM, are availablefreely online [5]. However, we were uncertain about the robust-ness of the data. We therefore took all data used to constructthese four QoG indices for the year 2008, replicated the originalresults, and conducted extensive sensitivity tests and internal/external consistency checks on each of the four areas of QoG.After running a total of 264 simulations, whereby we alteredthe original weighting scheme, aggregation method andremoved individual data sources one at a time, we found thedata to be remarkably robust to changes, along with beingstrongly internally consistent [6]. After confirming the robustnessof the original estimates for each of the four composite indices,we then combined the four indices to create a combined,national-level ‘QoG index’. The results of this index can be seenin Table 1.
We used cluster analysis to assess the national level variance
in QoG across EU Member States. According to the WGI’s ownmargins of error, the QoG estimates between countries suchas Denmark and Finland, or the Czech Republic and Hungary areindistinguishable. The cluster groupings can therefore serveas a helpful tool to identify EU Member States that sharecommon challenges to building QoG at the national level.We employed hierarchical clustering using Ward’s method andsquared Euclidian distancing for the four pillars of QoGto identify the number of appropriate cluster groupings.Although distinguishing the number of groups in this typeof analysis can be arbitrary at times, we found the most
The remainder of the paper is structured as follows. First,we begin the measurement of QoG within the EU witha national-level assessment, using existing data at the nationallevel. Next, we describe the regional level survey undertakenin 172 EU regions from the largest 18 EU Member States.Subsequently, we combine national and regional QoG data intothe full index (e.g. the EQI) for the entire EU. Next, we test thehypotheses discussed above with the EQI. We conclude withseveral suggestions of important empirical puzzles that couldbe addressed in the future using this new data.
3 Measuring QoG at thenational level in Europe
According to the existing contemporary, national-level data,QoG, or ‘good governance’ is on average higher for EU MemberStates as compared with other world regions. This in andof itself is not surprising, but a closer look reveals, however,that there is significant variation amongst many of the MemberStates of the EU, which we discuss in this section.
As noted, a proliferation of QoG-type data has emerged sincethe mid-1990s, measuring such concepts as corruption, ruleof law and others at the national level. Many of the indicatorscover most or all EU Member States, such as TransparencyInternational’s ‘Corruption Perception Index’ (CPI), the ‘Inter-national Country Risk Guide’ (ICRG), or the World EconomicForum’s 'business leader survey on corruption and bureaucraticeffectiveness', to name a few. But in the end, one source mustbe selected. After reviewing all available QoG indicatorscovering EU Member States, we find that the World Bank’s‘World Governance Indicators’ (WGI) data (Kaufmann, Kraay andMastruzzi 2009 – henceforth ‘KKM’) would be the mostappropriate source on which to build an indicator of QoG forEU Member States. First, as opposed to only focusing on oneparticular concept of QoG, such as corruption, it covers fourmain, inter-related ‘pillars’ of QoG that we consider highlysalient:
1. Control of Corruption
2. Rule of Law
3. Government Effectiveness
4. Voice & Accountability
Secondly, the WGI covers all EU Member States for at least10 years going back to the mid 1990s, and is now publishedannually. Thirdly, it is a ‘composite index’ and it is transparentin the way that it is constructed – publishing freely all underlying
2. The exceptions here are Cyprus, Luxembourg, and Malta, for which some sources were missing.
3. For a full description of the WGI composite indicators, their construction and underlying data, see Kaufmann, Kraay and Mastruzzi (2009).
4. For a more in depth debate on this topic, see Kurtz and Shrank (2007) and Kaufmann et al. (2007).
5. http://info.worldbank.org/governance/wgi/index.asp
6. For a more in depth look at the results of the sensitivity test, please see Charron (2010).
REGIONAL GOVERNANCE MATTERS: A STUDY ON REGIO NAL VARIATION IN QUALITY OF GOVERNMENT WITHIN THE EU 3
8/18/2019 Estudio de corrupcion en Europa
http://slidepdf.com/reader/full/estudio-de-corrupcion-en-europa 6/28
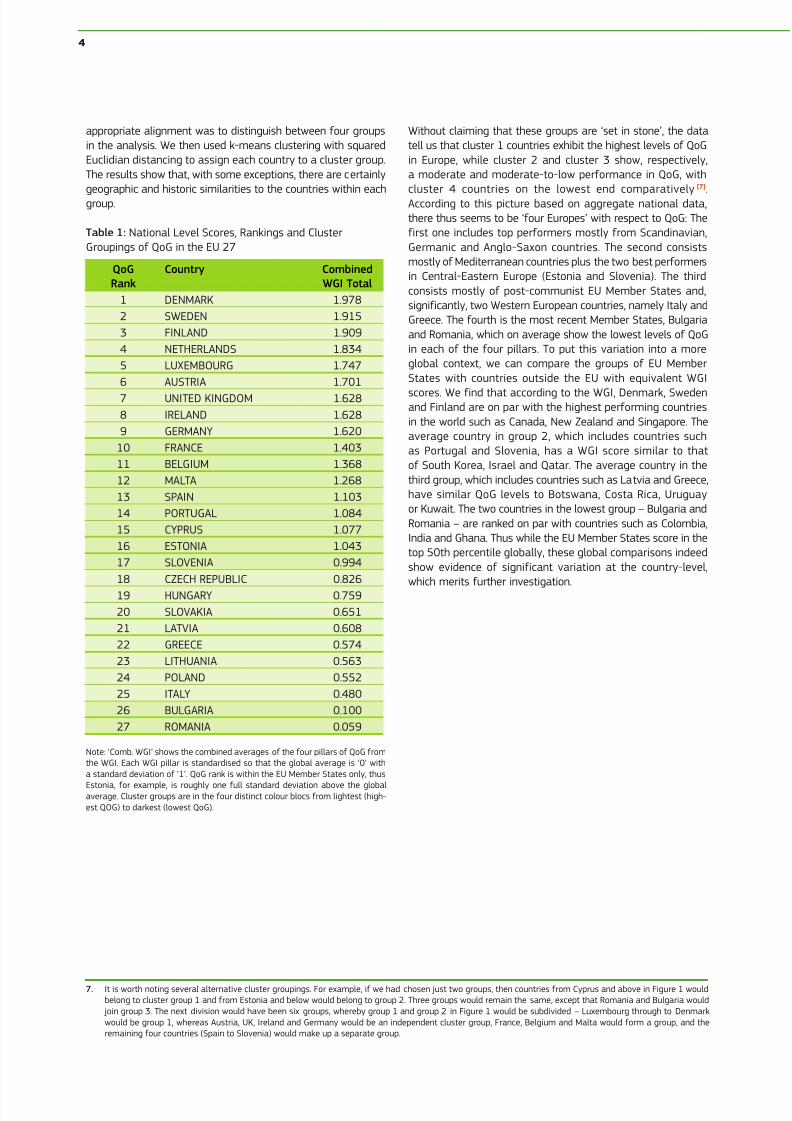
Without claiming that these groups are ‘set in stone’, the datatell us that cluster 1 countries exhibit the highest levels of QoGin Europe, while cluster 2 and cluster 3 show, respectively,a moderate and moderate-to-low performance in QoG, withcluster 4 countries on the lowest end comparatively [7].According to this picture based on aggregate national data,there thus seems to be ‘four Europes’ with respect to QoG: Thefirst one includes top performers mostly from Scandinavian,Germanic and Anglo-Saxon countries. The second consistsmostly of Mediterranean countries plus the two best performersin Central-Eastern Europe (Estonia and Slovenia). The thirdconsists mostly of post-communist EU Member States and,significantly, two Western European countries, namely Italy andGreece. The fourth is the most recent Member States, Bulgariaand Romania, which on average show the lowest levels of QoGin each of the four pillars. To put this variation into a moreglobal context, we can compare the groups of EU MemberStates with countries outside the EU with equivalent WGI
scores. We find that according to the WGI, Denmark, Swedenand Finland are on par with the highest performing countriesin the world such as Canada, New Zealand and Singapore. Theaverage country in group 2, which includes countries suchas Portugal and Slovenia, has a WGI score similar to thatof South Korea, Israel and Qatar. The average country in thethird group, which includes countries such as Latvia and Greece,have similar QoG levels to Botswana, Costa Rica, Uruguayor Kuwait. The two countries in the lowest group – Bulgaria andRomania – are ranked on par with countries such as Colombia,India and Ghana. Thus while the EU Member States score in thetop 50th percentile globally, these global comparisons indeedshow evidence of significant variation at the country-level,which merits further investigation.
appropriate alignment was to distinguish between four groupsin the analysis. We then used k-means clustering with squaredEuclidian distancing to assign each country to a cluster group.The results show that, with some exceptions, there are certainlygeographic and historic similarities to the countries within eachgroup.
Table 1: National Level Scores, Rankings and ClusterGroupings of QoG in the EU 27
QoG
Rank
Country Combined
WGI Total
1 DENMARK 1.978
2 SWEDEN 1.915
3 FINLAND 1.909
4 NETHERLANDS 1.834
5 LUXEMBOURG 1.747
6 AUSTRIA 1.701
7 UNITED KINGDOM 1.628
8 IRELAND 1.628
9 GERMANY 1.620
10 FRANCE 1.403
11 BELGIUM 1.368
12 MALTA 1.268
13 SPAIN 1.103
14 PORTUGAL 1.084
15 CYPRUS 1.077
16 ESTONIA 1.043
17 SLOVENIA 0.994
18 CZECH REPUBLIC 0.826
19 HUNGARY 0.759
20 SLOVAKIA 0.651
21 LATVIA 0.608
22 GREECE 0.574
23 LITHUANIA 0.563
24 POLAND 0.552
25 ITALY 0.480
26 BULGARIA 0.100
27 ROMANIA 0.059
Note: ‘Comb. WGI’ shows the combined averages of the four pillars of QoG fromthe WGI. Each WGI pillar is standardised so that the global average is ‘0’ witha standard deviation of ‘1’. QoG rank is within the EU Member States only, thus
Estonia, for example, is roughly one full standard deviation above the globalaverage. Cluster groups are in the four distinct colour blocs from lightest (high-est QOG) to darkest (lowest QoG).
7. It is worth noting several alternative cluster groupings. For example, if we had chosen just two groups, then countries from Cyprus and above in Figure 1 wouldbelong to cluster group 1 and from Estonia and below would belong to group 2. Three groups would remain the same, except that Romania and Bulgaria would join group 3. The next division would have been six groups, whereby group 1 and group 2 in Figure 1 would be subdivided – Luxembourg through to Denmarkwould be group 1, whereas Austria, UK, Ireland and Germany would be an independent cluster group, France, Belgium and Malta would form a group, and theremaining four countries (Spain to Slovenia) would make up a separate group.
4
8/18/2019 Estudio de corrupcion en Europa
http://slidepdf.com/reader/full/estudio-de-corrupcion-en-europa 7/28
for example, residents in eastern Germany may compare thequality and impartiality of their services to a different standardthan residents of western Germany. For the time being,however, these questions are the only regional data availableand they cannot be benchmarked against other indicators.
We have tested the data to see whether certain groups withina region have a very different opinion. In the sensitivity analysis,we have tested whether excluding certain demographiccategories of respondents, including those with higher education,significantly altered the regional scores. Overall, the impact wasrelatively limited. When the opinion of respondents with highereducation was excluded, several Polish regions improved theirscore significantly, but there was no systematic effect. Therefore,we conclude that in Poland the judgement differs substantiallybetween the respondents with a tertiary education and thosewith secondary education or less, but that this is not the casein all countries. Some categories could not be excluded, such
as urban or rural residents, as this would exclude the entirepopulation of a single region. As a consequence, we could not testwhether urban residents judge services in their regionin a different way than rural residents.
The administrative and political responsibility of the regions forthese three public services varies in different countries and thusmay have proven problematic for this data gathering. However,we argue otherwise. We seek to capture all regional variationwithin a country and, as noted in the literature (e.g. Tabellini,2005), numerous empirical indications and much anecdotalevidence suggest that the provision and quality of publicservices controlled by a powerful central government cannonetheless vary substantially across regions.
Furthermore, regions have become more important in the EUin terms of expenditure and authority. Public expendituremanaged by regional authorities in the EU has grown substantiallyfrom 18 % of total public expenditure in 1995 to 32 % in 2008(European Commission, 2010b). In addition, a recent study(Hooghe et al., 2010) shows how over the past 40 years, theauthority of regions in Europe has grown. Finally, a large shareof EU cohesion policy funding is managed by the regionsthemselves. Therefore, regions are becoming more importantactors and in the cases where they are currently merely statisticalunits [11] they are likely to become more relevant in the future.
The regional data combine 16 survey questions about QoG in theregion. To construct the regional index, we followed carefully theguidelines expressed in the Handbook on Constructing CompositeIndicators (2008). Although we checked the robustness of ourindex, testing alternative methods to building the data,we constructed the index as follows. First, all 16 QoG questions
4 Measuring QoG at theregional level in Europe
While certainly relevant as a starting point, the national levelcluster groups do not tell the whole story. National-level datahas of course proliferated in recent years, yet measuring QoGat the regional level within most countries is ‘unchartedterritory’, let alone measuring regional QoG in a multi-countrycontext. Several recent surveys have been launchedby Transparency International in Mexico and India to buildmeasurements of citizen perceptions of corruption at theregional level. However, in most countries, in particular thosein the Europe, such data do not exist and those that do aremore narrowly focused on capturing corruption, mostly in Italy(Del Monte and Papagni, 2007; Golden and Picci, 2005).
To add to the necessary nuance to the national-level WGI data,we take advantage of data acquired for a large, EuropeanCommission-funded project on measuring QoG within the EU[8].We began with a survey of approximately 34 000 EU citizens,which constitutes the largest survey ever undertakento measure QoG at the sub-national level to date. A regional-level QoG index score for 172 NUTS 1 and NUTS 2 regionswithin 18 EU Member States was built based on surveyquestions on citizen perception of QoG [9]. As a complimentto national-level QoG data, our citizen-based data offersa source of information that is not subject to the commoncriticism that QoG data is biased toward ‘business friendly’environments (see Kurtz and Shrank, 2007). A more detaileddescription of the survey is located in the appendix.
To capture the most relevant sub-national variation in QoGpossible, we focused on three public services that are oftenfinanced, administered or politically accounted for by sub-national authorities, either at regional, county or local level:education, healthcare and law enforcement. [10] We askedrespondents to rate these three public services with respectto three related concepts of QoG – the quality , the impartiality and the level of corruption of said services.
Such a survey assumes that respondents will use the samereference framework (or at least all respondents in a singlecountry) as we use the regional figures to modulate the
national score, see below. Some respondents, however, may usea different reference framework. For example, people witha higher level of education may hold services up to a higherstandard. Recent changes in the service or events may alsoinfluence the judgements (see Kahneman, 2011). In somecases, the history of the region may also shape expectations,
8. ‘Measuring Quality of Government and Sub-national Variation’ Report for the EU Commission of Regional Development, European Commission Directorate-General Regional Policy, Policy Development Directorate, 2010.
9. ‘Nomenclature of Territorial Units for Statistics’ (NUTS) 1 regions are used in Germany, UK, Sweden, Hungary, Greece, Netherlands and Belgium. NUTS 2 regionsare used in Italy, Spain, Portugal, Denmark, Czech Republic, Poland, Romania, Bulgaria, Slovakia, France, and Austria.
10. We inquired after the respondents’ recent contact with these three public services and found that 60 % and 78 % had personal contact with education and healthservices respectively in the past 12 months, while about 25 % of the total respondents had direct contact with law enforcement services. The complete survey,
as well as the number of respondents per country and the respondents’ experiences with the three public services in question can be found in the appendix.
11. For example, in the recent 2007 Danish Municipal Reform, Denmark’s former 16 counties were replaced with the five NUTS 2 regions, all now having electedregional governments with near exclusive political and administrative power over the healthcare system, along with transportation and other local policy areas.A similar type of reform was made in Poland in 1999, as the elected sub-regions were drawn around the EU Commission’s NUTS 2 level regions in preparationfor EU membership. For more information on Denmark’s reform, see: http://www.regioner.dk/; for more on Poland’s reform, see: Ferry (2003).
REGIONAL GOVERNANCE MATTERS: A STUDY ON REGIO NAL VARIATION IN QUALITY OF GOVERNMENT WITHIN THE EU 5
8/18/2019 Estudio de corrupcion en Europa
http://slidepdf.com/reader/full/estudio-de-corrupcion-en-europa 8/28
are aggregated from the individual to the regional levelas a mean score. Next, the 16 regional scores are standardised,so as to have a common range via standardisation[12]. Then,we performed a factor analysis to see whether the 16 questionsform significant sub-groups in the data. We found three relevantgroups, which we label ‘pillars’ – questions pertainingto impartiality, corruption and quality – all constituted separatefactor components (media and election questions aligned withthe ‘quality’ pillar) [13]. Each variable is given equal weight withineach pillar. Finally, the three pillars were combined using equalweighting to form the regional index. We provide the regionalindex for each region in the appendix[14].
A quick examination of the data reveals fairly predictable patternsamong the regions with respect to QoG. All regions within the topperforming EU Member States with regard to the national QoGindex (Denmark, Sweden and Netherlands) are in the top 15 %of all 172 regions. Among the ‘new’ Member States, all but one
of the regions are in the bottom 50 % (i.e. have a score lowerthan ‘0’), with the only exceptions being Nord Vest (RO11)in Romania. In contrast, most of the EU-15 regions are in the top50 %, with Portugal and Greece being the only exceptions havingall of their respective regions under the mean. Moreover, severalof the regions in France and Italy are under the EU mean, with thelatter containing two in the bottom 10 of the sample.
As with the national-level data, we performed internalconsistently checks and a rigorous sensitivity test to theregional data. To test internal consistency of the 16 indicators,we used Chronbach’s Alpha correlation test, pairwisecorrelations and a principle component factor analysis [15].We then performed 62 simulations in which the sensitivityof the data was tested. We checked the robustness of the equalweighting scheme using factor weights instead. We substitutedthe additive method of aggregation with geometricaggregation, and normalised the data via a ‘min-max’ methodin place of standardisation. In addition, we removed eachindividual question one at a time, as well as whole question-groups (e.g. all questions pertaining to ‘quality’, ‘impartiality’or ‘corruption’). In addition, for several simulations,we re-aggregated the data from the individual level, wherebywe excluded certain demographic groups, such as men, highincome respondents, young respondents, higher educatedrespondents and those who did not have any interaction withany of the public services in question within the last 12 months.
We found that even in the most extreme scenarios, theSpearman Rank Coefficient never fell below 0.90 and that themedian shift in the rankings was never above 11 as comparedwith the original index. We found overall that the regional dataand scores are robust and internally consistent [16].
5 Combining the twolevels of data – the
EU QoG Index (EQI)Although the entire sample of respondents in the regional levelsurvey is large (34 000), the number of respondents per regionis on the smaller side (200). Thus we seek to add the country-context to each region’s QoG score, which we assume wouldalso be influenced by such factors as the national legal system,immigration, trade and security areas that are not capturedin the regional QoG data. Thus we add credible and robustobservations to the regional-level data to compensate for anyoutlying region or country in the regional survey (that couldbe the results of limited observations) while adding the‘national context’ of QoG. To accomplish this – along with
including the nine other smaller EU Member States in thesample – we combine the WGI external assessment with ourcitizen-based, regional-level data to create a comprehensiveEU QoG Index (EQI). Our aim was to come up with a methodthat fairly includes the omitted EU Member States from thesurvey while simulateneously maintinnig the richness of thewithin-country variation in several of the countries surveyedin the regional-level study.
To calculate the score for each region and country, we take thecountry average from the WGI data from Table 1 andstandardise it for the EU sample. For countries outside of theregional survey, there is nothing to add to the WGI countryscore, thus the WGI data is used as the QoG estimate alone[17],and regional variation is unobserved.
For the countries with regional data, we take the nationalaverage based on the WGI and add the within-country variancebased on the regional-level data described in the previoussections. Simply speaking, we calculate a national, population-weighted average of the regional scores for each of the18 countries in the survey. We then subtract this nationalaverage score from each region’s individual QoG score in thecountry. This shows whether a region is above or below itsnational average and by how much. This figure is then addedto the national level WGI data, so each region has an adjustedscore, centred on the WGI. The formula employed is the
following:
( )countryY ountryY regionXinccountryY ountryY regionXinc
CRqog RqogWGI EQI +=
12. For example, some questions range from 0-10, others 0-3 and others are dichotomous. To combine two or more indicators into a composite index, the data mustbe adjusted to have a common range.
13. To determine the number of factor groupings, we followed the Kaiser criteria – whereby a significant group must have an Eigenvalue greater than ‘1’ and thesum total of all significant factors must equal 60 % or greater of the total variation.
14. The 16 individual indicators along with the three pillars can be freely downloaded at: (reference hidden for anonymity).
15. Chronbach’s Alpha coefficient of reliability was 0.94, while 89 % of the pairwise correlations among the 16 questions were positive and significant. The principlecomponent analysis (PCA) demonstrated that the questions factored together according to QoG concepts of corruption, impartiality and quality.
16. As noted in the Handbook of Constructing Composite Indicators, it is important to check the interaction effects of each of these adjustments, thus for exampletesting the removal of the ‘corruption’ pillar in all possible combinations of weighting, aggregation, and normalisation of the data. For a more detailed accountof the robustness checks, (Charron et al., 2010).
17. The score is slightly changed due to the re-standardisation when the national and regional level estimates are combined, so as to set the final EQI’s mean to ‘0’and standard deviation to ‘1’.
6
8/18/2019 Estudio de corrupcion en Europa
http://slidepdf.com/reader/full/estudio-de-corrupcion-en-europa 9/28
where ‘EQI’ is the final score from each region or country in theEQI, ‘WGI’ is the World Bank’s national average for each country,‘Rqog’ is each region’s score from the regional survey and‘CRqog’ is the country average (weighted by regionalpopulation) of all regions within the country from the regionalsurvey. In keeping with the same scale as the WGI data, the EQIis standardised so that the mean is ‘0’ with a standarddeviation of ‘1’.
Although the national-level data and regional-level data areindeed directed at different levels of government – the WGItaps into the quality of national public sector, whilst the regionalsurvey was explicitly asking respondents about their regionalservices – we argue that these two measures are indeed similarenough to combine. First and most obviously, they both captureaspects of QoG, such as corruption, quality of services,impartiality, and rule of law. Whilst the national data mightbe focused on several sectors of the national bureaucracy that
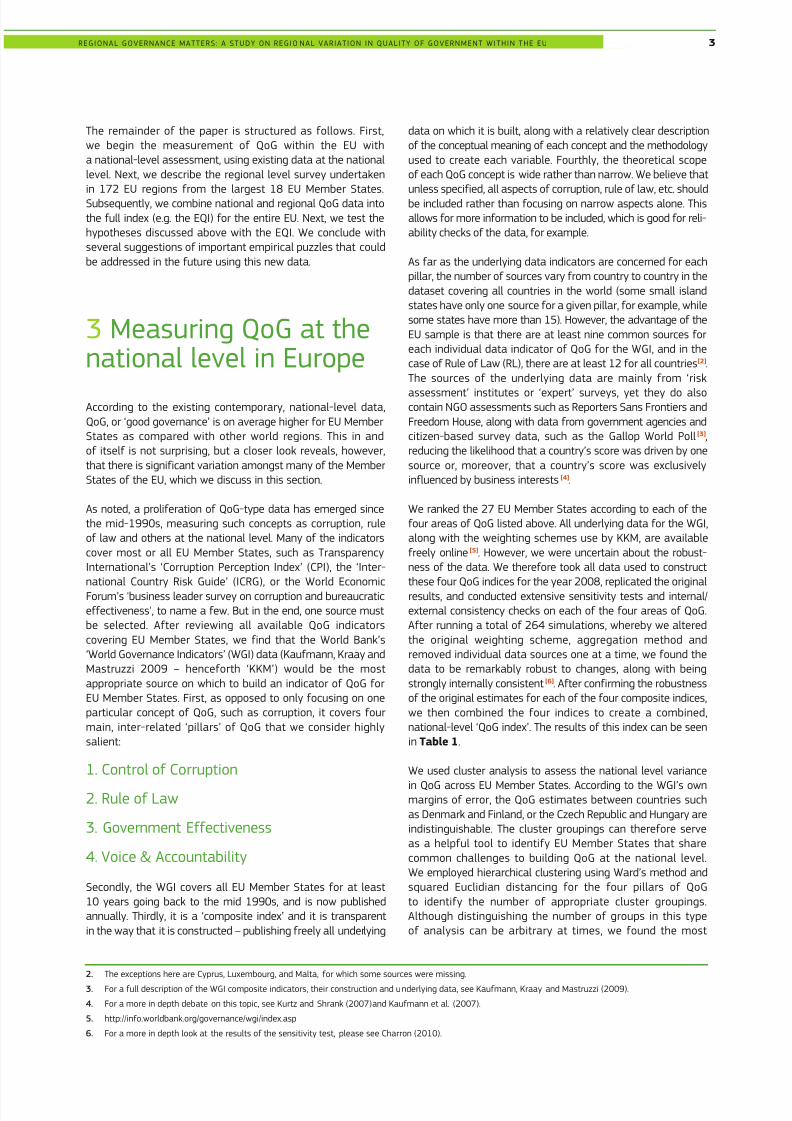
are not measured by the regional-level data – e.g. defence,immigration, etc. – we do not find this problematic. Whileadministrative and fiscal responsibilities vary from regionto region in the EU, such areas of the public sector are outof the realm of all regional governments and thus it is mostappropriate that we do not include them in any regional studies.Secondly, the WGI data are robust, well-established, andinternationally used measures and are thus suited to estimatethe country-level scores. In adjusting the national level scoresof the EU Member States, we sacrifice none of the rich sub-national variation from the regional level survey data. Finally,in using the WGI as an ‘anchor’, so to speak, we canretroactively adjust data if in future rounds of regional datacollection, additional countries or regions are added.
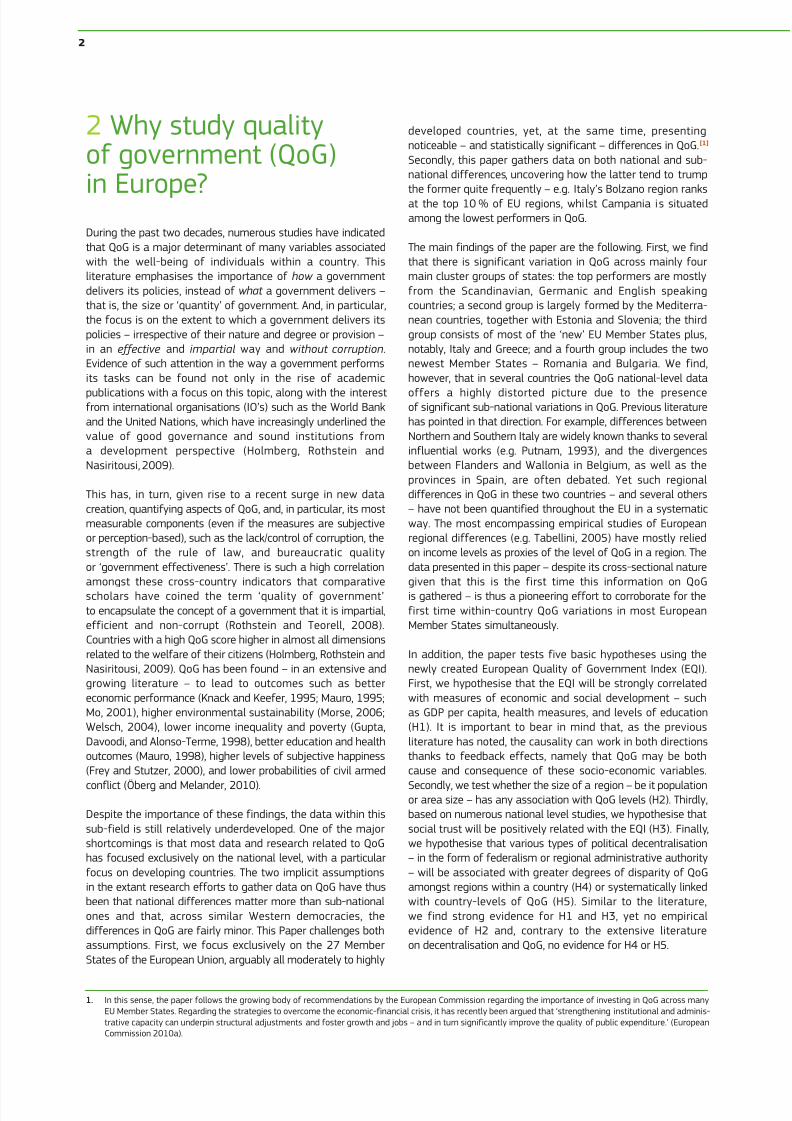
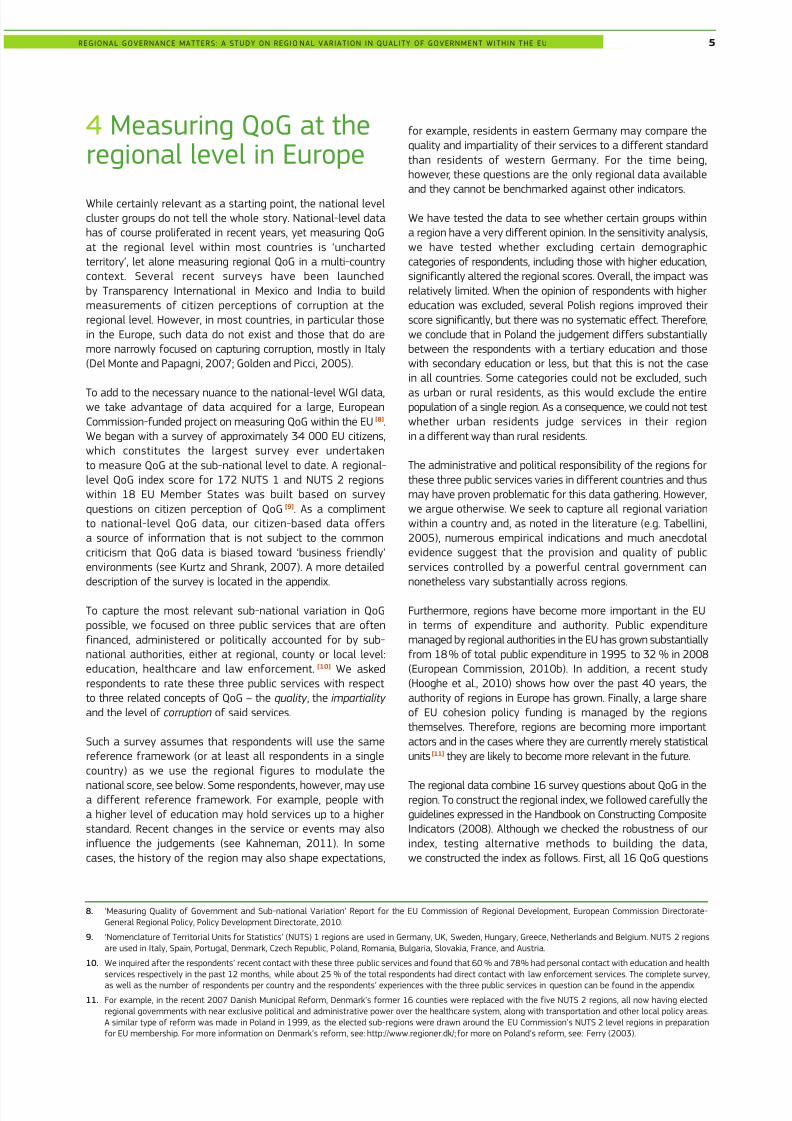
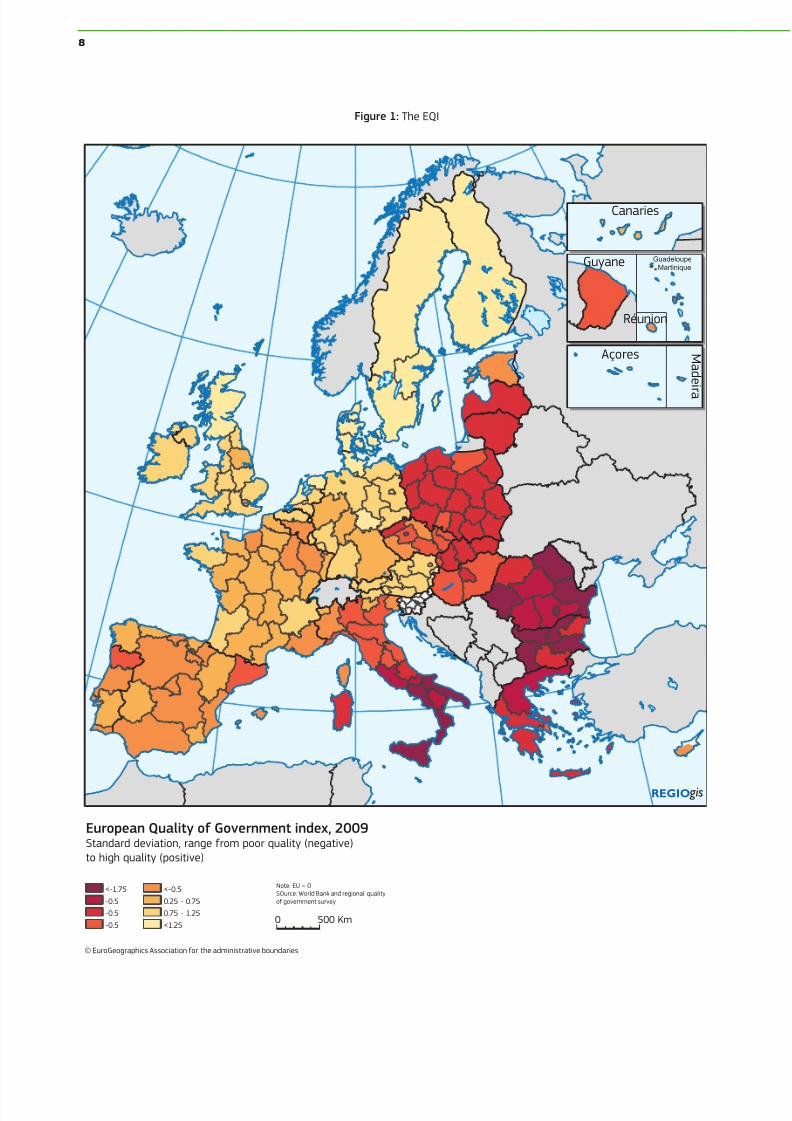
Figure 1 shows the combined data between the WGI national-level QoG scores and the regional QoG data. Figure 2 shows thenational averages with the within-country range of scores. A fulllist of scores for each region and country is located in theappendix in rank order. The data show that 11 of theEU-15 countries have all their regions and/or national scoresabove the EU average, while all regional and national-levelscores for the ‘New’ Member States (NMS) are under the meanaverage [18]. Five EU-15 countries – Italy, Spain, France, Belgiumand Portugal – contain regions that are both above and belowthe mean score, while Greece is the only EU-15 country to haveall of its regions below the mean level of QoG in the EU. Among
the NMS, the regional ranks are all below the EU mean, with thehighest ranking region being Jihozápad (CZ03) from the CzechRepublic (-0.05).
To facilitate reliable comparisons across regions, we constructa margin of error at the 95 % confidence level. This levelequates to the probability that a margin of error around thereported QoG estimate for each region would include the ‘true’
value of QoG or, in other words, that the margin of error tellsus that we can say with about 95 % confidence that a region’sestimate of QoG can be found within a plus/minus 1 marginof error [19]. While not exactly a ‘margin of error’ in a traditionalsense, the range expresses the uniformity around whichrespondents ranked their region’s QoG in the 16 questions. Thusthe regions that have the largest margins of error are onesin which respondents expressed a relatively large gap betweentwo or more sets of questions for a service or concept (suchas education or ‘impartiality’). For example, most respondentsin Spanish regions believed their public services were amongthe most impartial in Europe, yet they ranked them belowaverage on corruption questions. The lowest margin of errorbelongs to the Polish region of Kujawsko-Pomorskie (0.166),meaning that respondents ranked their regions veryconsistently across all 16 questions. Danish and Polish regionson the whole have the tightest confidence intervals, whileSpanish, Romanian and Czech regions tend to have the widest
margins. All margins of errors around the final EQI estimatesare found in the appendix [20].
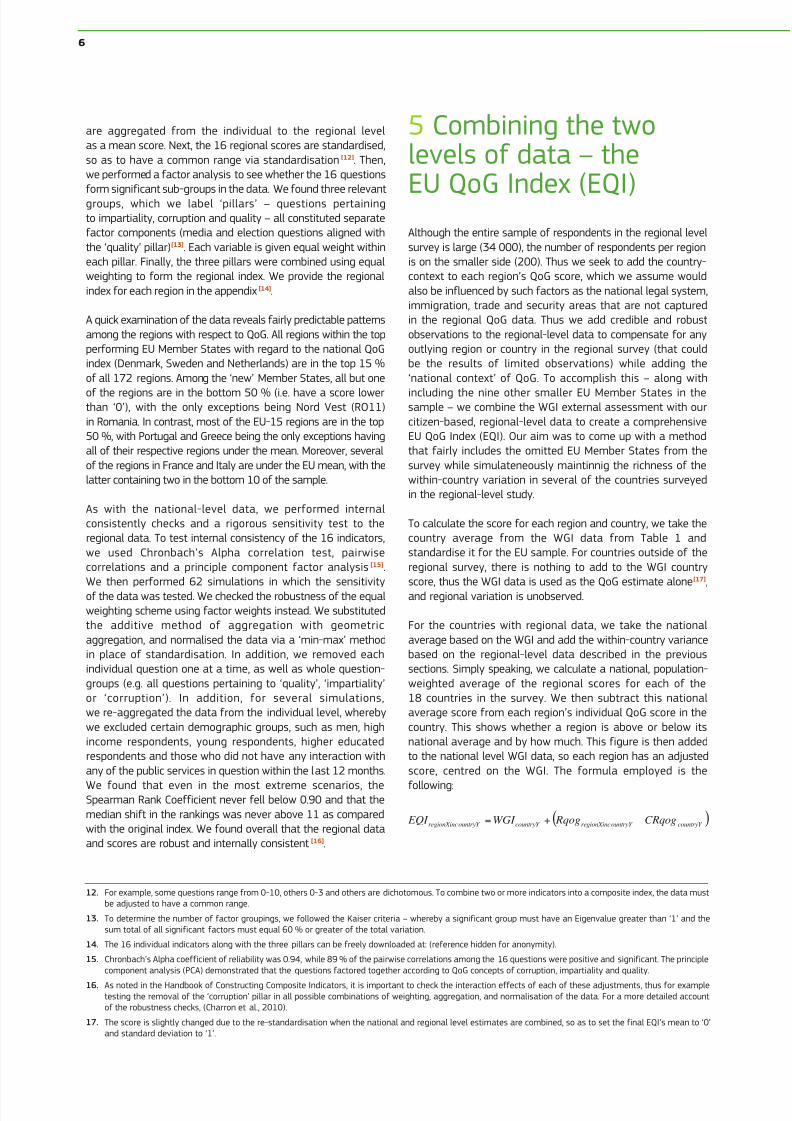
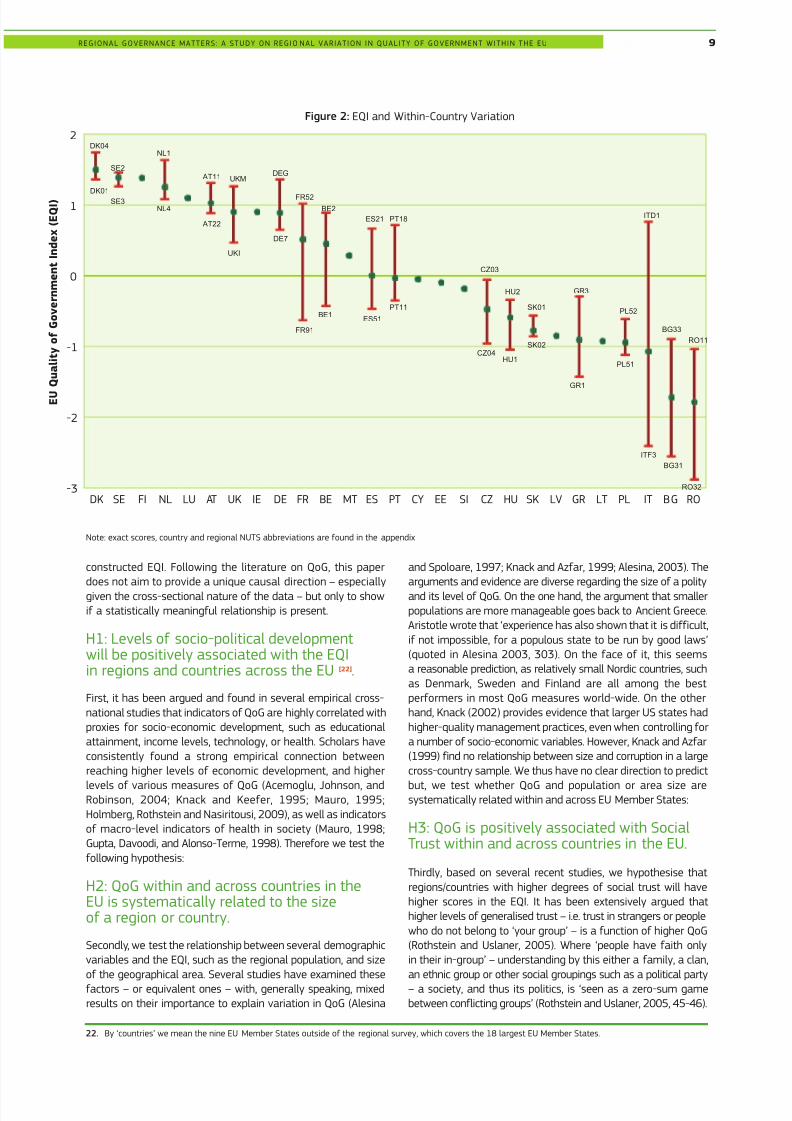
Interestingly, the data show that within-country QoG variationis at times equally or more important than cross-countryvariation. For example, Figure 2 shows the rank-order of EUMember States (again, using the WGI, national assessmentas the country mean). For example, the gap between Bolzano(ITD1) to Campania (ITF3) in the data is much larger than thenthe gap of the national averages between Denmark andPortugal. Furthermore, while the national gap between Bulgariaand Romania at the national level is negligible, their nationalscores are noticeably lower than the national scores of otherstates such as Slovakia, Poland, Italy and Greece. However, thetop region from each country, Nord Vest (RO11) in Romania andSeveroiztochen (BG33) in Bulgaria, are statistically indistin-guishable from average ranking regions within those other fourcountries. It is noteworthy that the EQI can be employedin cross-sectional analysis only at the regional level at thispoint, yet one can employ the WGI combined national-levelindex to make comparisons over time[21].
6 Five hypotheses
on why some regionshave better QoG
In this section, we seek to discover some general patternsof QoG variation within and across countries by testing fiveprevailing hypotheses in the literature using the newly
18. However, on specific combined pillars, such as rule of law or government effectiveness, several regions in the Czech Republic are above the EU mean score.
19. We know from basic statistical probability that in a sample ‘x’, 95 % of the area of a basic normal Bell curve are between our estimate ( µ) 1.96+/- the standarderror around µ. We calculate the standard error as: S.E. = . The margin of error for each individual region is based around the QoG estimate: 1.96+/ withN = 16, because there are 16 indicators in the QoG index which have been aggregated from the survey data. Each region thus has their own individual margin
of error based on the consistency of the estimates for each of the 16 aggregated questions in the survey. We end up with an average margin of error of 0.338,or about one third of a full standard deviation, with a minimum of 0.166 to a maximum of 0.705.
20. In addition to the standardised scale for the EQI, we also normalise the data to range from 0-100. We thank an anonymous reviewer at Regional Studies forthis suggestion.
21. The next round of data collection at the regional level is scheduled for 2013, thus making a limited over-time comparison possible by 2014.
REGIONAL GOVERNANCE MATTERS: A STUDY ON REGIO NAL VARIATION IN QUALITY OF GOVERNMENT WITHIN THE EU 7
8/18/2019 Estudio de corrupcion en Europa
http://slidepdf.com/reader/full/estudio-de-corrupcion-en-europa 10/28
Guadeloupe
Martinique
REGIO gis
Note: EU = 0
SOurce: World Bank and regional quality
of government survey
<-1.75
-0.5
-0.5
-0.5
<-0.5
0.25 - 0.75
0.75 - 1.25
<1.250 500 Km
© EuroGeographics Association for the administrative boundaries
Canaries
Guyane
Açores
Réunion
M a d e
i r a
European Quality of Government index, 2009Standard deviation, range from poor quality (negative)
to high quality (positive)
Figure 1: The EQI
8
8/18/2019 Estudio de corrupcion en Europa
http://slidepdf.com/reader/full/estudio-de-corrupcion-en-europa 11/28
constructed EQI. Following the literature on QoG, this paperdoes not aim to provide a unique causal direction – especiallygiven the cross-sectional nature of the data – but only to showif a statistically meaningful relationship is present.
H1: Levels of socio-political developmentwill be positively associated with the EQIin regions and countries across the EU [22].
First, it has been argued and found in several empirical cross-national studies that indicators of QoG are highly correlated withproxies for socio-economic development, such as educationalattainment, income levels, technology, or health. Scholars haveconsistently found a strong empirical connection betweenreaching higher levels of economic development, and higher
levels of various measures of QoG (Acemoglu, Johnson, andRobinson, 2004; Knack and Keefer, 1995; Mauro, 1995;Holmberg, Rothstein and Nasiritousi, 2009), as well as indicatorsof macro-level indicators of health in society (Mauro, 1998;Gupta, Davoodi, and Alonso-Terme, 1998). Therefore we test thefollowing hypothesis:
H2: QoG within and across countries in theEU is systematically related to the sizeof a region or country.
Secondly, we test the relationship between several demographicvariables and the EQI, such as the regional population, and sizeof the geographical area. Several studies have examined thesefactors – or equivalent ones – with, generally speaking, mixedresults on their importance to explain variation in QoG (Alesina
and Spoloare, 1997; Knack and Azfar, 1999; Alesina, 2003). Thearguments and evidence are diverse regarding the size of a polityand its level of QoG. On the one hand, the argument that smallerpopulations are more manageable goes back to Ancient Greece.Aristotle wrote that ‘experience has also shown that it is difficult,if not impossible, for a populous state to be run by good laws’(quoted in Alesina 2003, 303). On the face of it, this seemsa reasonable prediction, as relatively small Nordic countries, suchas Denmark, Sweden and Finland are all among the bestperformers in most QoG measures world-wide. On the otherhand, Knack (2002) provides evidence that larger US states hadhigher-quality management practices, even when controlling fora number of socio-economic variables. However, Knack and Azfar(1999) find no relationship between size and corruption in a largecross-country sample. We thus have no clear direction to predict
but, we test whether QoG and population or area size aresystematically related within and across EU Member States:
H3: QoG is positively associated with SocialTrust within and across countries in the EU.
Thirdly, based on several recent studies, we hypothesise thatregions/countries with higher degrees of social trust will havehigher scores in the EQI. It has been extensively argued thathigher levels of generalised trust – i.e. trust in strangers or peoplewho do not belong to ‘your group’ – is a function of higher QoG(Rothstein and Uslaner, 2005). Where ‘people have faith onlyin their in-group’ – understanding by this either a family, a clan,an ethnic group or other social groupings such as a political party– a society, and thus its politics, is ‘seen as a zero-sum gamebetween conflicting groups’ (Rothstein and Uslaner, 2005, 45-46).
DK04
BE2
BE1
FR52
FR91
DE7
DEG
UKI
UKM
AT22
AT11
NL4
NL1
SE3
SE2
DK01
SK02
SK01
HU1
HU2
CZ04
CZ03
PT11
PT18
ES51
ES21
PL51
PL52
GR1
GR3
BG33
ITF3
ITD1
RO32
RO11
BG31
-3
-2
-1
0
1
2
DK SE FI NL LU AT UK IE DE FR BE MT ES PT CY EE SI CZ HU SK LV GR LT PL IT BG RO
E U
Q u a l i t y o f G o v e r n m e n t I n d e x ( E Q I )
Figure 2: EQI and Within-Country Variation
Note: exact scores, country and regional NUTS abbreviations are found in the appendix
22. By ‘countries’ we mean the nine EU Member States outside of the regional survey, which covers the 18 largest EU Member States.
REGIONAL GOVERNANCE MATTERS: A STUDY ON REGIO NAL VARIATION IN QUALITY OF GOVERNMENT WITHIN THE EU 9
8/18/2019 Estudio de corrupcion en Europa
http://slidepdf.com/reader/full/estudio-de-corrupcion-en-europa 12/28
In these conditions, citizens feel less attached to their politicalcommunities than to a particular social group and thus less eagerto contribute to the provision of general public goods, suchas paying taxes, respecting and protecting public spaces and, veryimportantly, engaging in social and political mobilisations askingfor improvements in quality of government. Generally speaking,free-riding becomes more frequent at all social levels. In turn,public authorities lack both adequate resources and incentivesto deliver policies, consolidating a ‘vicious cycle’. We thus test thefollowing hypothesis:
H4: Greater levels of political decentralisationwill be associated with higher levelsof within-country variance of QoG.
H5: Greater levels of political decentralisationwill systematically impact the level of QoGat the country-level.
Finally, we test whether if there is an empirical link between thelevel of political decentralisation and/or federalism and theamount of within-country variation in QoG as well as the level of QoG itself across countries. Although mostly untestedempirically, due to a lack of empirical data at the regional level,several scholars have asserted that greater levels of decen-tralisation be associated with larger disparities from regionto region with respect to variables such as bureaucratic qualityor corruption in the public sector (Tanzi, 2001). In other words,when regions gain more decision-making control, the strongerones will perform better and weaker ones will sink even deeper,creating larger gaps within decentralised states than in centralisedones. Furthermore, several studies have tested whetherdecentralisation leads to higher or lower QoG across countries,with several arguing that political decentralisation and/orfederalism creates greater problems of collective action and morecumbersome decision-making rules (Gerring and Thacker, 2004),while others such as Lijphart (1977) and Watts (1999) argue thatgreater vertical power sharing in the form of decentralisationor federalism would lead to better QoG outcome. We thus test twohypotheses regarding the impact of decentralisation over within-country variance and over levels of QoG:
7 ResultsWe present the results in two steps, first with bivariate scat-terplots then with multivariate OLS with country fixed effectsfor the five hypotheses. Whilst admittedly simplistic and unableto determine causal direction, we argue that as a ‘first cut’analysis with the EQI, the straight-forward scatterplots andbasic fixed effects regressions are quite revealing.
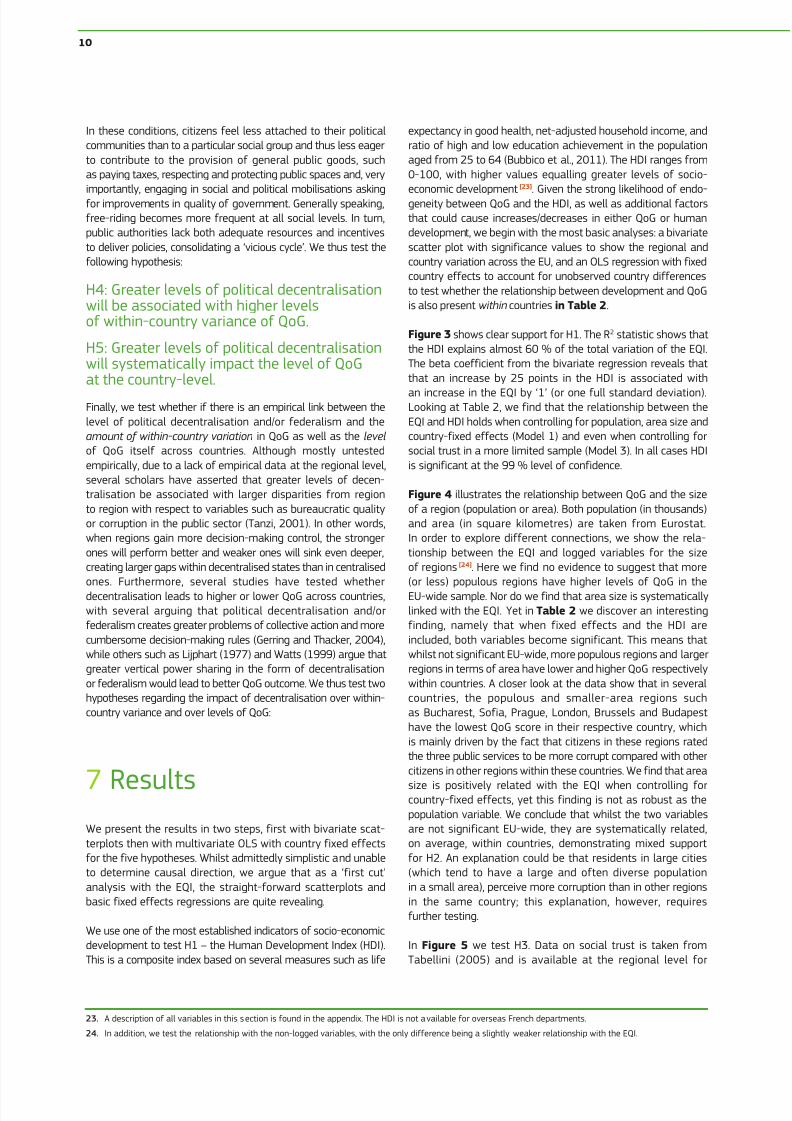
We use one of the most established indicators of socio-economicdevelopment to test H1 – the Human Development Index (HDI).This is a composite index based on several measures such as life
expectancy in good health, net-adjusted household income, andratio of high and low education achievement in the populationaged from 25 to 64 (Bubbico et al., 2011). The HDI ranges from0-100, with higher values equalling greater levels of socio-economic development [23]. Given the strong likelihood of endo-geneity between QoG and the HDI, as well as additional factorsthat could cause increases/decreases in either QoG or humandevelopment, we begin with the most basic analyses: a bivariatescatter plot with significance values to show the regional andcountry variation across the EU, and an OLS regression with fixedcountry effects to account for unobserved country differencesto test whether the relationship between development and QoGis also present within countries in Table 2.
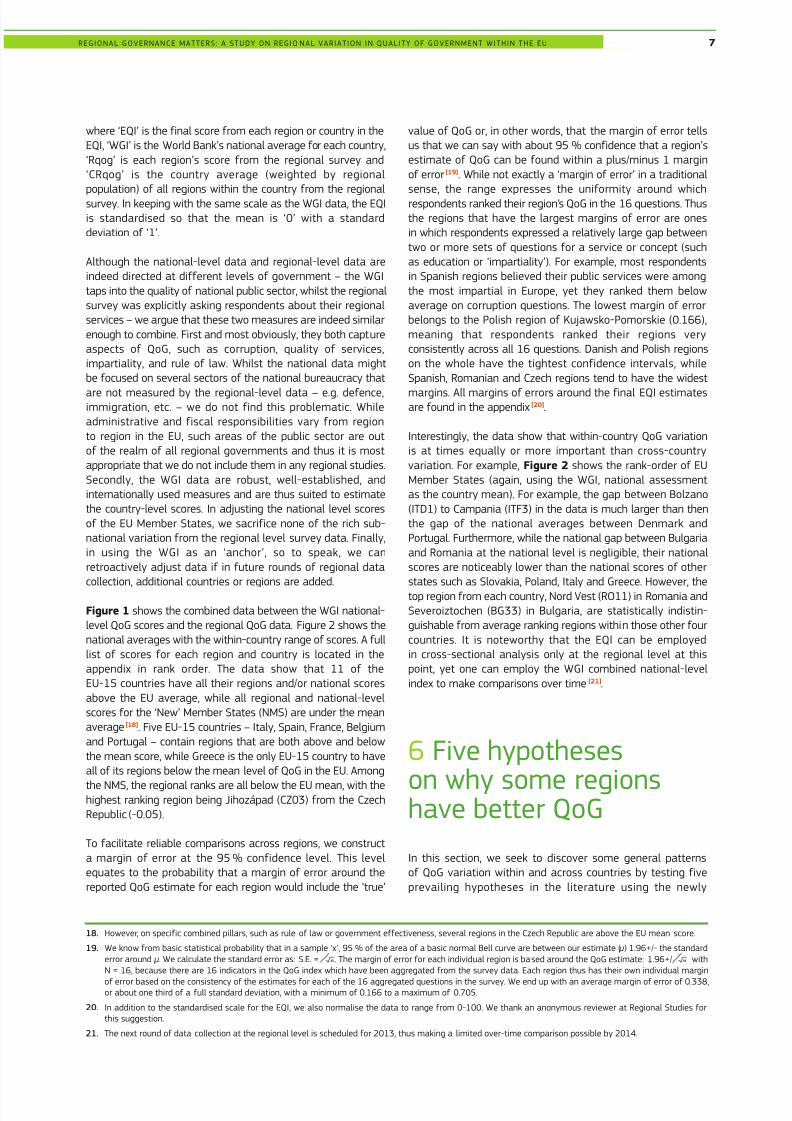
Figure 3 shows clear support for H1. The R2 statistic shows thatthe HDI explains almost 60 % of the total variation of the EQI.The beta coefficient from the bivariate regression reveals thatthat an increase by 25 points in the HDI is associated with
an increase in the EQI by ‘1’ (or one full standard deviation).Looking at Table 2, we find that the relationship between theEQI and HDI holds when controlling for population, area size andcountry-fixed effects (Model 1) and even when controlling forsocial trust in a more limited sample (Model 3). In all cases HDIis significant at the 99 % level of confidence.
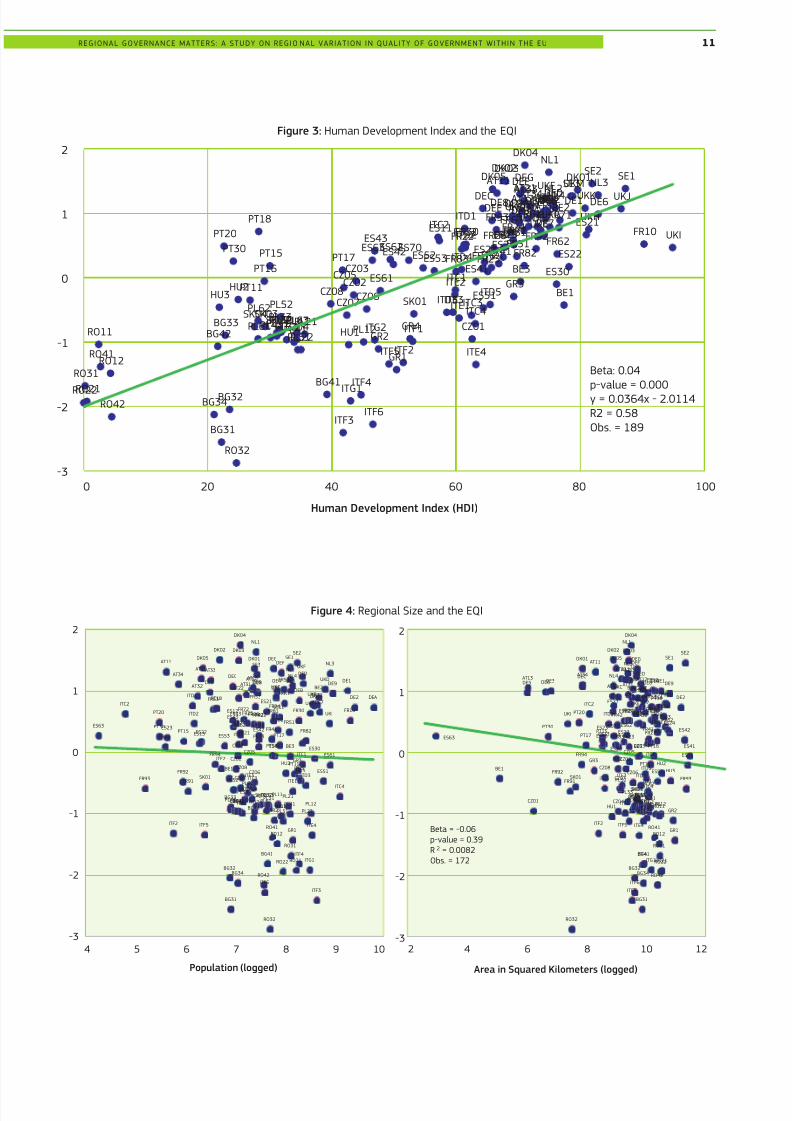
Figure 4 illustrates the relationship between QoG and the sizeof a region (population or area). Both population (in thousands)and area (in square kilometres) are taken from Eurostat.In order to explore different connections, we show the rela-tionship between the EQI and logged variables for the sizeof regions [24]. Here we find no evidence to suggest that more(or less) populous regions have higher levels of QoG in theEU-wide sample. Nor do we find that area size is systematicallylinked with the EQI. Yet in Table 2 we discover an interestingfinding, namely that when fixed effects and the HDI areincluded, both variables become significant. This means thatwhilst not significant EU-wide, more populous regions and largerregions in terms of area have lower and higher QoG respectivelywithin countries. A closer look at the data show that in severalcountries, the populous and smaller-area regions suchas Bucharest, Sofia, Prague, London, Brussels and Budapesthave the lowest QoG score in their respective country, whichis mainly driven by the fact that citizens in these regions ratedthe three public services to be more corrupt compared with othercitizens in other regions within these countries. We find that area
size is positively related with the EQI when controlling forcountry-fixed effects, yet this finding is not as robust as thepopulation variable. We conclude that whilst the two variablesare not significant EU-wide, they are systematically related,on average, within countries, demonstrating mixed supportfor H2. An explanation could be that residents in large cities(which tend to have a large and often diverse populationin a small area), perceive more corruption than in other regionsin the same country; this explanation, however, requiresfurther testing.
In Figure 5 we test H3. Data on social trust is taken fromTabellini (2005) and is available at the regional level for
23. A description of all variables in this section is found in the appendix. The HDI is not available for overseas French departments.
24. In addition, we test the relationship with the non-logged variables, with the only difference being a slightly weaker relationship with the EQI.
10
8/18/2019 Estudio de corrupcion en Europa
http://slidepdf.com/reader/full/estudio-de-corrupcion-en-europa 13/28
AT11
AT12AT13
AT21
AT22AT31 AT32
AT33
AT34
BE1
BE2
BE3
BG31
BG32
BG33
BG34
BG41
BG42CZ01
CZ02
CZ03
CZ04
CZ05
CZ06CZ07
CZ08
DK01DK02DK03
DK04
DK05
DE1
DE2
DE3DE4DE5 DE6
DE7
DE8DE9
DEADEB
DEC DEDDEE
DEFDEG
FR10
FR21
FR22
FR23
FR24FR25FR26
FR30
FR41
FR42FR43FR51
FR52
FR53 FR61
FR62
FR63FR71
FR72FR81
FR82FR83
GR1
GR2
GR3
GR4HU1
HU2HU3
ITC1
ITC2
ITC3ITC4
ITD1
ITD2
ITD3
ITD4
ITD5
ITE1
ITE2
ITE3
ITE4
ITF1
ITF2
ITF3
ITF4
ITF5
ITF6
ITG1
ITG2
NL1
NL2NL3
NL4
PL11PL12
PL21
PL22
PL31PL32PL33PL34PL41
PL42PL43PL51
PL52
PL61
PL62
PL63
PT11
PT15
PT16PT17
PT18
PT20
PT30
RO11
RO12
RO21RO22
RO31
RO32
RO41
RO42
SK01
SK02SK03SK04
ES11ES12
ES13
ES21
ES22ES23ES24
ES30ES41
ES42
ES43
ES51
ES52ES53
ES61
ES62ES63 ES70
SE1SE2
SE3
UKCUKD
UKE
UKF
UKG UKH
UKI
UKJUKK
UKL
UKM
UKN
Beta: 0.04
p-value = 0.000
y = 0.0364x - 2.0114
R2 = 0.58
Obs. = 189
Human Development Index (HDI)
-3
-2
-1
0
1
2
0 80 10020 40 60
AT11
AT12AT13
AT21
AT22AT31AT32
AT33AT34
BE1
BE2
BE3
BG31
BG32
BG33
BG34
BG41
BG42
CZ01
CZ02
CZ03
CZ04
CZ05
CZ06
CZ07
CZ08
DK01
DK02 DK03
DK04
DK05
DE1
DE2
DE3DE4DE5 DE6
DE7
DE8 DE9
DEA
DEB
DECDED
DEE
DEFDEG
FR10
FR21
FR22
FR23
FR24
FR25FR26FR30
FR41
FR42FR43
FR51
FR52
FR53FR61
FR62
FR63FR71
FR72 FR81
FR82
FR83
FR91
FR92
FR93
FR94
GR1
GR2
GR3
GR4
HU1
HU2
HU3
ITC1
ITC2
ITC3
ITC4
ITD1
ITD2
ITD3
ITD4
ITD5
ITE1
ITE2
ITE3
ITE4
ITF1
ITF2
ITF3
ITF4
ITF5
ITF6
ITG1
ITG2
NL1
NL2
NL3
NL4
PL11
PL12
PL21
PL22
PL31PL32
PL33
PL34PL41
PL42PL43
PL51
PL52
PL61
PL62
PL63
PT11
PT15
PT16
PT17
PT18
PT20
PT30
RO11
RO12
RO21RO22
RO31
RO32
RO41
RO42
SK01
SK02
SK03SK04
ES11ES12
ES13
ES21
ES22ES23
ES24
ES30ES41
ES42
ES43
ES51
ES53
ES61
ES62ES63 ES70
SE1
SE2
SE3
UKC
UKD
UKE
UKF
UKGUKH
UKI
AT11
AT12AT13
AT21
AT22AT31AT32
AT33AT34
BE1
BE2
BE3
BG31
BG32
BG33
BG34
BG41
BG42
CZ01
CZ02
CZ03
CZ04
CZ05
CZ06
CZ07
CZ08
DK01
DK02 DK03
DK04
DK05
DE1
DE2
DE3 DE4DE5 DE6
DE7
DE8 DE9
DEA
DEB
DECDED
DEE
DEFDEG
FR10
FR21
FR22
FR23
FR24
FR25 FR26FR30
FR41
FR42 FR43
FR51
FR52
FR53FR61
FR62
FR63FR71
FR72FR81
FR82FR83
FR91
FR92
FR93
FR94
GR1
GR2
GR3
GR4HU1
HU2
HU3
ITC1
ITC2
ITC3
ITC4
ITD1
ITD2
ITD3
ITD4
ITD5
ITE1
ITE2
ITE3
ITE4
ITF1
ITF2
ITF3
ITF4
ITF5
ITF6
ITG1
ITG2
NL1
NL2NL3
NL4
PL11
PL12
PL21
PL22
PL31PL32
PL33
PL34PL41
PL42PL43
PL51
PL52
PL61
PL62
PL63
PT11
PT15
PT16
PT17
PT18
PT20
PT30
RO11
RO12
RO21RO22
RO31
RO32
RO41
RO42
SK01
SK02
SK03SK04
ES11ES12
ES13
ES21
ES22ES23
ES24
ES30ES41
ES42
ES43
ES51
ES53
ES61
ES62
ES63
ES70
SE1SE2
UKC
UKD
UKE
UKF
UKG UKH
UKI
-3
-2
-1
0
1
2
4 5 6 7 8 9 10
Population (logged)
Beta = -0.06
p-value = 0.39
R
Obs. = 172
-3
-2
-1
0
1
2
2 4 6 8 10 12
Area in Squared Kilometers (logged)
2 = 0.0082
Figure 3: Human Development Index and the EQI
Figure 4: Regional Size and the EQI
REGIONAL GOVERNANCE MATTERS: A STUDY ON REGIO NAL VARIATION IN QUALITY OF GOVERNMENT WITHIN THE EU 11
8/18/2019 Estudio de corrupcion en Europa
http://slidepdf.com/reader/full/estudio-de-corrupcion-en-europa 14/28
Table 2: Impact of HDI, Population, Area and Trustwith Country Fixed Effects on the EQI
1 2 3
HDI 0.02** 0.03**
(0.003) (0.007)
Trust 0.03** 0.008
(0.004) (0.31)
Population -0.28** -0.27** -0.36**
(0.001) (0.002) (0.000)
Area 0.13** 0.09 0.18**
(0.002) (0.08) (0.005)
Country effects
AUSTRIA .56**
BELGIUM -0.01 0.32 0.04
BULGARIA -1.29**
CZECH REPUBLIC -0.30
DENMARK 1.06**
FRANCE 0.12
GERMANY 0.79** .15** .16**
GREECE -0.94**
HUNGARY -0.02
ITALY -0.82** -0.97** -0.74**
NETHERLANDS 1.02** 0.84** 0.81**
POLAND -0.46*
PORTUGAL 0.61* 0.26 1.04**
ROMANIA -0.75*
SLOVAKIA -0.41*
SWEDEN 0.62**
UNITED KINGDOM 0.65** .93** .61**
Constant -0.31 0.37 -1.08
0.49 0.48 0.11
obs 169 73 73Rsq. 0.87 0.75 0.79
Note: OLS regression with fixed country effects, Spain used as reference group.HDI is 'Human Development Index’ (0-100), Population and area are loggedvalues. ‘Trust’ is only available for Belgium, Germany (western regions), Italy,Netherlands, Portugal, Spain, and UK.
** p<.01, *p<.05
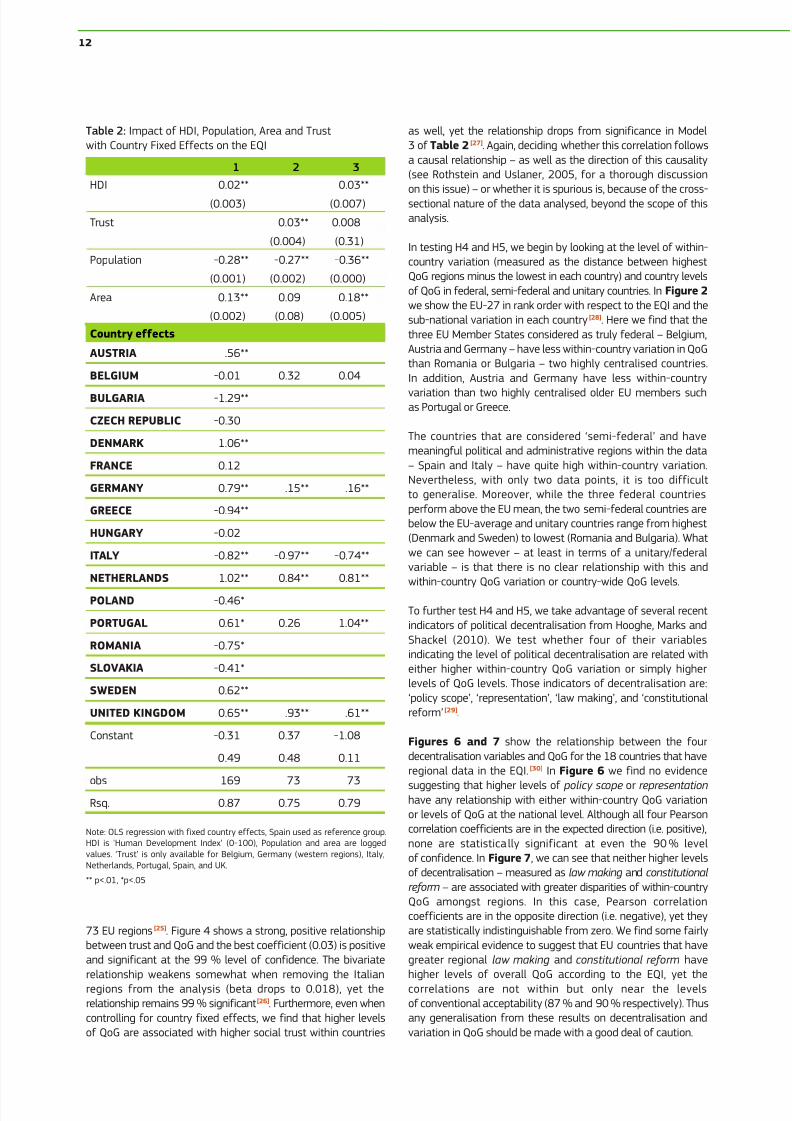
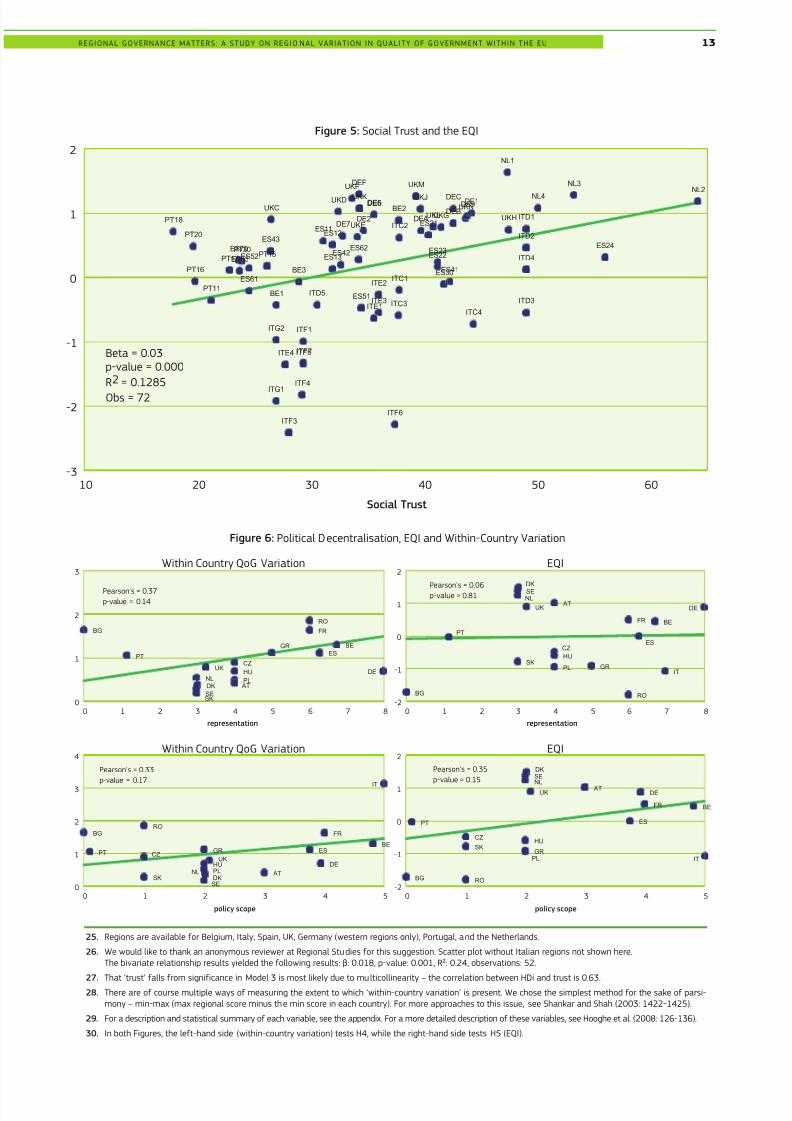
73 EU regions [25]. Figure 4 shows a strong, positive relationshipbetween trust and QoG and the best coefficient (0.03) is positiveand significant at the 99 % level of confidence. The bivariaterelationship weakens somewhat when removing the Italianregions from the analysis (beta drops to 0.018), yet therelationship remains 99 % significant[26]. Furthermore, even whencontrolling for country fixed effects, we find that higher levelsof QoG are associated with higher social trust within countries
as well, yet the relationship drops from significance in Model3 of Table 2 [27]. Again, deciding whether this correlation followsa causal relationship – as well as the direction of this causality(see Rothstein and Uslaner, 2005, for a thorough discussionon this issue) – or whether it is spurious is, because of the cross-sectional nature of the data analysed, beyond the scope of thisanalysis.
In testing H4 and H5, we begin by looking at the level of within-country variation (measured as the distance between highestQoG regions minus the lowest in each country) and country levelsof QoG in federal, semi-federal and unitary countries. InFigure 2
we show the EU-27 in rank order with respect to the EQI and thesub-national variation in each country [28]. Here we find that thethree EU Member States considered as truly federal – Belgium,Austria and Germany – have less within-country variation in QoGthan Romania or Bulgaria – two highly centralised countries.In addition, Austria and Germany have less within-country
variation than two highly centralised older EU members suchas Portugal or Greece.
The countries that are considered ‘semi-federal’ and havemeaningful political and administrative regions within the data– Spain and Italy – have quite high within-country variation.Nevertheless, with only two data points, it is too difficultto generalise. Moreover, while the three federal countriesperform above the EU mean, the two semi-federal countries arebelow the EU-average and unitary countries range from highest(Denmark and Sweden) to lowest (Romania and Bulgaria). Whatwe can see however – at least in terms of a unitary/federalvariable – is that there is no clear relationship with this andwithin-country QoG variation or country-wide QoG levels.
To further test H4 and H5, we take advantage of several recentindicators of political decentralisation from Hooghe, Marks andShackel (2010). We test whether four of their variablesindicating the level of political decentralisation are related witheither higher within-country QoG variation or simply higherlevels of QoG levels. Those indicators of decentralisation are:‘policy scope’, ‘representation’, ‘law making’, and ‘constitutionalreform’ [29].
Figures 6 and 7 show the relationship between the fourdecentralisation variables and QoG for the 18 countries that haveregional data in the EQI. [30] In Figure 6 we find no evidence
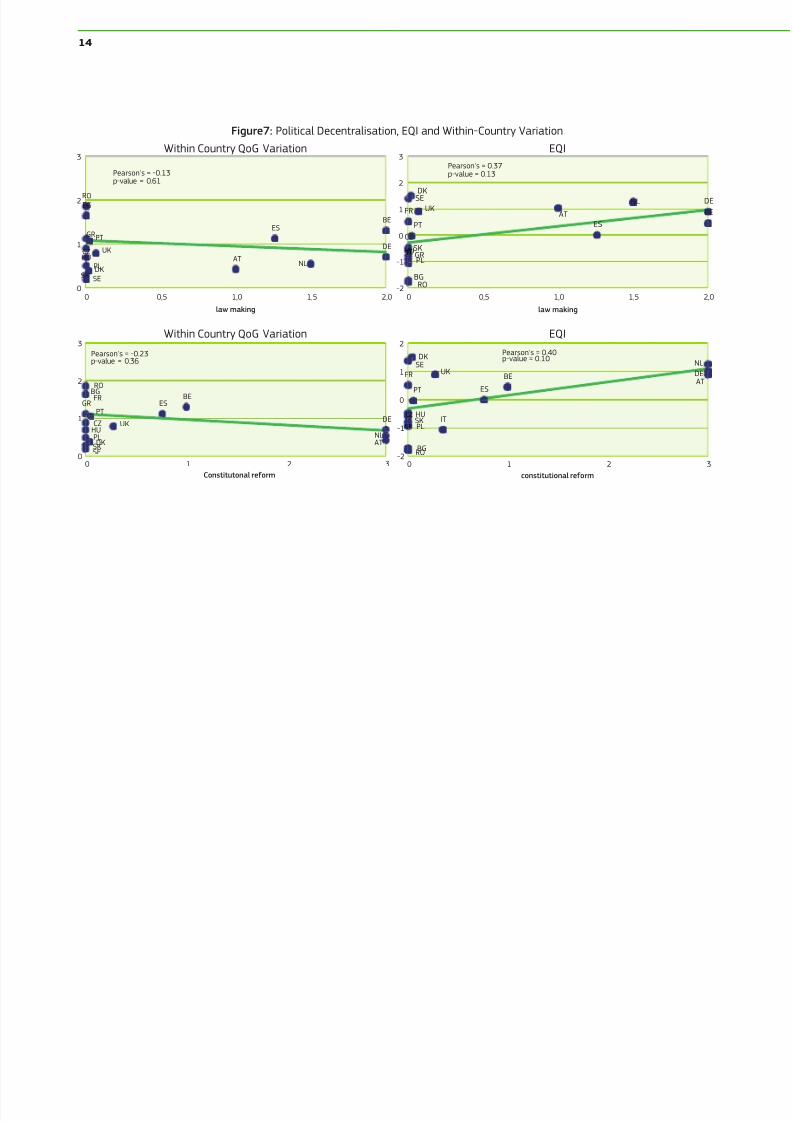
suggesting that higher levels of policy scope or representationhave any relationship with either within-country QoG variationor levels of QoG at the national level. Although all four Pearsoncorrelation coefficients are in the expected direction (i.e. positive),none are statistically significant at even the 90 % levelof confidence. In Figure 7, we can see that neither higher levelsof decentralisation – measured as law making and constitutional
reform – are associated with greater disparities of within-countryQoG amongst regions. In this case, Pearson correlationcoefficients are in the opposite direction (i.e. negative), yet theyare statistically indistinguishable from zero. We find some fairlyweak empirical evidence to suggest that EU countries that havegreater regional law making and constitutional reform havehigher levels of overall QoG according to the EQI, yet thecorrelations are not within but only near the levelsof conventional acceptability (87 % and 90 % respectively). Thusany generalisation from these results on decentralisation andvariation in QoG should be made with a good deal of caution.
12
8/18/2019 Estudio de corrupcion en Europa
http://slidepdf.com/reader/full/estudio-de-corrupcion-en-europa 15/28
PT18
PT20
PT16
PT11
PT17
ES70
ES53
PT30
ES61
ES52PT15
ES43
UKC
ITG1
ITG2
BE1
ITE4
ITF3
BE3
ITF4
ITF1
ITF2ITF5
ITD5
ES11ES12
ES13
UKD
ES42
DE7
UKF
UKE
ES62
DEF
UKK
ES51
DE2
DE5DE6
ITE1
ITE2
ITE3
ITF6
ITC3
BE2
ITC1
ITC2
UKM
UKJ
DEAES21
UKL
ES22ES23
UKG
ES30ES41
DEB
DEC
UKNDE9DE1
ITC4
NL1
UKH ITD1
ITD2
ITD3
ITD4
NL4
NL3
ES24
NL2
Beta = 0.03
p-value = 0.000
R2 = 0.1285
Obs = 72
-3
-2
-1
0
1
2
10 20 30 40 50 60
Social Trust
AT
BE
BG
CZ
DK
FR
DE
GR
HU
IT
NL
PL
PT
RO
SK
ES
SE
UK
AT
BE
BG
CZ
DK
FR
DE
GR
HU
NL PL
PT
RO
SK
ES
SE
UK
AT
BE
BG
CZ
DK
FR
DE
GR
HU
IT
NL PL
PT
RO
SK
ES
SE
UK
AT
BE
BG
CZ
DK
FR
DE
GR
HU
IT
NL
PL
PT
RO
SK
ES
SE
UK
Pearson's = 0.06
p-value = 0.81Pearson's = 0.37
p-value = 0.14
Pearson's = 0.33
p-value = 0.17
Pearson's = 0.35
p-value = 0.15
-2
-1
0
1
2
0 1 2 3 4 5 6 7 8
representation
0
1
2
3
0 1 2 3 4 5 6 7 8
representation
0
1
2
3
4
0 1 2 3 4 5
policy scope
-2
-1
0
1
2
0 1 2 3 4 5
policy scope
EQIWithin Country QoG Variation
EQIWithin Country QoG Variation
Figure 5: Social Trust and the EQI
Figure 6: Political Decentralisation, EQI and Within-Country Variation
25. Regions are available for Belgium, Italy, Spain, UK, Germany (western regions only), Portugal, and the Netherlands.
26. We would like to thank an anonymous reviewer at Regional Studies for this suggestion. Scatter plot without Italian regions not shown here.The bivariate relationship results yielded the following results: β: 0.018, p-value: 0.001, R²: 0.24, observations: 52.
27. That ‘trust’ falls from significance in Model 3 is most likely due to multicollinearity – the correlation between HDi and trust is 0.63.28. There are of course multiple ways of measuring the extent to which ‘within-country variation’ is present. We chose the simplest method for the sake of parsi-
mony – min-max (max regional score minus the min score in each country). For more approaches to this issue, see Shankar and Shah (2003: 1422-1425).
29. For a description and statistical summary of each variable, see the appendix. For a more detailed description of these variables, see Hooghe et al. (2008: 126-136).
30. In both Figures, the left-hand side (within-country variation) tests H4, while the right-hand side tests H5 (EQI).
REGIONAL GOVERNANCE MATTERS: A STUDY ON REGIO NAL VARIATION IN QUALITY OF GOVERNMENT WITHIN THE EU 13
8/18/2019 Estudio de corrupcion en Europa
http://slidepdf.com/reader/full/estudio-de-corrupcion-en-europa 16/28
ATBE
BG
CZ
DK
FR DE
GR
HUIT
NL
PL
PT
RO
SK
ES
SE
UK
AT BE
BG
CZ
DK
FR
DE
GRHUIT
NL
PL
PT
RO
SK
ES
SE
UK
AT
BE
BG
CZ
DK
FR
DE
GR
HUNLPL
PT
RO
SK
ES
SE
UK
AT
BEBG
CZ
DK
FR
DE
GR
HUNLPL
PT
RO
SK
ES
SE
UK
constitutional reformConstitutonal reform
Pearson's = 0.40p-value = 0.10
Pearson's = 0.37p-value = 0.13
law making
Pearson's = -0.13p-value = 0.61
law making
Pearson's = -0.23p-value = 0.36
-2
-1
0
1
2
0 1 2 3
-2
-1
0
1
2
3
0 0,5 1,0 1,5 2,00
1
2
3
0 0,5 1,0 1,5 2,0
0
1
2
3
0 1 2 3
EQIWithin Country QoG Variation
EQIWithin Country QoG Variation
Figure7: Political Decentralisation, EQI and Within-Country Variation
14
8/18/2019 Estudio de corrupcion en Europa
http://slidepdf.com/reader/full/estudio-de-corrupcion-en-europa 17/28
8 Conclusions
The original data and analysis presented in this paper makeseveral contributions to the literature. First and foremost,we have mapped the differences in perceived levels of qualityof government among 172 EU regions based on the perceptionof citizens, which, in combination with the external, largelyexpert assessment of the national-level data, represents themost encompassing data to date on sub-national variationin corruption or good-governance variables. We believe that thispaper and data may be highly valuable to both scholars andpractitioners alike focusing on a wide range of topics regardinggovernance in Europe. For example, a region with a low QoGin the EU will not be able to use the cohesion policy funds in anefficient and effective manner. Such a region may remain stuckin low growth and low QoG equilibrium, while the regional gov-ernment remains to some degree sheltered from the financial
consequences of low QoG through continuing support from theEU. This may explain why the reform of EU cohesion policy putsa greater emphasis on creating the right conditions for develop-ment as an important prerequisite to (continue to) receive fund-ing (European Commission, 2010b).
Finding the right mix of incentives and policies that improveQoG in lagging regions could make a substantial contributionto higher growth in those regions and thus to more convergencebetween EU regions. The data presented here can serve asa valuable benchmark to monitor changes in governance at thenational and regional level in the EU.
This paper has found a notable amount of variation bothbetween and within EU Member States. A first group of Northern Europeancountries tend to show the highest levels of QoG. They distinguishthemselves from the following three groups on the ladder: thesecond group encompasses most Southern-Mediterranean states– together with Estonia and Slovenia – with moderate levelsof QoG; the third group covers most of ‘new’ Member States thatdemonstrate moderate to low levels of QoG; the fourth groupconsists of the two newest Member States that have the lowestlevels of QoG in the EU. Significant within-country variations canbe found in federal or semi-federal nations such as Italy, Belgiumor Spain, but also, noticeably, in more centralised ones, suchas Portugal, Romania or Bulgaria. Other countries, suchas Denmark, Poland, Austria or Slovakia show very little variation
across regions.
We tested five hypotheses that could help to explain someof the variation in QoG found between and within EU MemberStates. We found strong empirical evidence that the HDI is posi-tively related to our indicator of QoG – both within and acrosscountries in the EU. We found similar evidence with respectto our variable for social trust. On H2, we found a more nuancedrelationship – the EQI had no statistical relationship eitherwithin or across the full sample, yet when accounting for coun-try-fixed effects, we found robust evidence to suggest thatmore populous (regions with greater area size) have lower(higher) QoG within countries themselves on average, whichmay imply that QoG is lower in the large cities in a country.
Most surprising, given the sizeable literature on the conse-quences of federalism for governance, was the lack of a relation-ship between a relatively large number of proxies for political
decentralization and QoG. We hypothesised that countries withgreater degrees of political decentralisation would exhibit higherdegrees of within-country variation of QoG for their respectiveregions. We found no such evidence using several differentmeasures of political decentralisation. Furthermore, there is noempirical pattern between decentralisation and country-levelsof QoG according to the EQI – decentralised and/or federal coun-tries are not more or less likely to have higher levels of aggregateQoG relative to more unitary/centralised states within the EU.
One explanation could be that variation within a countryis linked to variation in both political decision-making (aswe would expect in federal/more politically decentralised coun-tries) and the quality of implementation of a (theoretically) cen-trally administered service, which has been relativelyoverlooked in the theoretical literature on federalism. For exam-ple, even though a country such as Romania is highly politicallycentralised, certain regions may have developed specific pat-
terns of policy implementation (e.g. more merit-based and lesspatronage-based public organisations), which may play a deci-sive role in the quality of their public services. The only consist-ent pattern is that irrespective of decentralisation, the countriesin the highest cluster group all have relatively low within-coun-try QoG variation – even Germany and Austria, which are fed-eral countries.
The findings presented in this paper open the door to severalrelevant questions that could be explored in future research. Forinstance, which cultural legacies, economic variables or institu-tional factors may explain the notable regional differenceson governance? Which consequences – for example, in termsof fostering entrepreneurial activity – are evident among thebest performing regions in QoG in comparison with beingamongst the worst? The data presented here can thus be of usefor scholars addressing these questions in fields as diverseas comparative political economy, EU studies, federalism,decentralisation and regional politics or comparative publicadministration. In addition, with regions playing such a growingrole in the provision of public services and being the recipientsof large transfers – at national level in many EU MemberStates, but also at European level through the EU DevelopmentFunds – the data presented here can serve as an initial toolof empirical assessment for practitioners interested in regionaldevelopment policy and aid allocation.
Based on the findings of this Paper, we would like to concludeby underscoring the importance of focusing on QoG not onlyin developing regions of the world but inside the EU. As thisPaper has shown, too many EU residents still report to havefirst hand experience of corruption and discrimination and theshare of residents confronted with these issues is far higherin some regions and countries. Despite the methodologicalproblems always inherent to capture a concept such as ‘goodgovernance’, our preliminary data indicate that QoG in theEU seems to vary to a very large extent both between countriesand between regions within these countries. In addition, thoseregions where QoG is perceived to be low by their own citizensare those regions that perform the worst in the standard indica-tors of human development. A tentative normative conclusionwould thus be that – apart from the existing transfer policies –a joint and targeted effort to improve QoG in those regions withlower levels could substantially improve the economic prospectsof these regions and the lives of their residents.
REGIONAL GOVERNANCE MATTERS: A STUDY ON REGIO NAL VARIATION IN QUALITY OF GOVERNMENT WITHIN THE EU 15
8/18/2019 Estudio de corrupcion en Europa
http://slidepdf.com/reader/full/estudio-de-corrupcion-en-europa 18/28
9 References
■ Acemoglu, Daron, Johnson, Simon & Robinson, James A. 2004. ‘Institutions asthe Fundamental Cause of Long-Run Growth’, CEPR Discussion Papers 4458.
■ Alesina, Alberto. 2003. ‘The size of countries: Does it matter?’ Journal of the European Economic Association 1, no. 2-3: 301-316.
■ Alesina, A., & Spoalare, E. 1997. ‘On the number and size of nations’.Quarterly Journal of Economics, November.
■ Bubbico, R., & Dijkstra, L. 2011. ‘The European Regional Human Development and Human Poverty Indices’.European Union Regional Focus 02/2011. http://ec.europa.eu/regional_policy/information/focus/index_en.cfm
■ Charron, N., Lapuente, V. & Rothstein, B. 2010.Measuring the quality of government and subnational variation.
Report for European Commission, Directorate-General for Regional Policy.http://ec.europa.eu/regional_policy/information/studies/index_en.cfm#2
■ Del Monte, A. & Papagni, E. 2007. ‘The determinants of corruption in Italy: Regional panel data analysis’.European Journal of Political Economy 23(2): 379-396.
■ European Commission. 2010a. The EU Budget review. COM(2010) 700. Brussels.
■ European Commission. 2010b. The fifth Report on economic, social and territorial cohesion.
Publications Office of the EU, Luxembourg.
■ Frey, Bruno S., & Stutzer, A. 2000. ‘Happiness, Economy and Institutions’.The Economic Journal 110(466): 918-938.
■ Gerring, J. & Thacker, S. C. 2004. ‘Political institutions and corruption: the role of unitarismand parliamentarism’. British Journal of Political Science, 34(2), 295-330.
■ Golden, Miriam A. & Lucio Picci. 2005. ‘Proposal for a new measure of corruption,illustrated with Italian data’. Economics and Politics, vol. 17 (1): 37-75.
■ Gupta S., Davoodi, H.R., Alonso-Terme, R. 1998. ‘Does corruption affect income inequalityand poverty?’ Work. Pap. No. 98/76 (May), Int. Monetary Fund,Washington, DC.
■ Holmberg, Sören, Rothstein, Bo & Nasiritousi, Naghmeh. 2009. ‘Quality of Government:What You Get’. Annual Review of Political Science Vol. 12: 135-161.
■ Hooghe, Liesbet, Marks, Gary & Schakel, Arjan H. 2010. The Rise of Regional Authority:
A Comparative Study of 42 Democracies, London: Routledge.
■ Inglehart, Ronald. 2000. ‘Globalization and Post-Modern Values.’ The Washington Quarterly. vol 23 (1): 215-228.
■ Kahneman, Daniel. 2011. Thinking, Fast and Slow. New York: Farar, Straus and Giroux.
■ Kaufmann, Daniel, Kraay, Aart & Mastruzzi, Massimo. 2009. ‘Governance Matters VIII:Aggregate and Individual Governance Indicators for 1996-2008’. World Bank Policy Research Working Paper No. 4978. Washington, D.C.
■ Knack, Stephen. 2002. ‘Social Capital and the Quality of Government: Evidence from the States’. American Journal of Political Science Vol. 46, (4): 772-785.
■ Knack, Stephen, & Keefer, Philip. 1995. ‘Institutions and Economic Performance: Cross-Country TestsUsing Alternative Institutional Measures’. Economics and Politics 7 (3):207-27.
■ Knack, Stephen & Azfar, Omar. 1999. ‘Are larger countries really more corrupt?’.Policy Research Working Paper Series 2470. World Bank.
■ Kurtz, M.J. & Schrank, A. 2007. ‘Growth and Governance: Models, Measures, and Mechanisms’. Journal of Politics. Vol. 69 (2).
16
8/18/2019 Estudio de corrupcion en Europa
http://slidepdf.com/reader/full/estudio-de-corrupcion-en-europa 19/28
■ Lijphart, Arend. 1977. Democracy in Plural Societies. New Haven, CT: Yale University Press.
■ Longstreth, M. & Shields, T. 2009. ‘A Comparison of Within Household Random
■ Selection Methods for Random Digit Dial Surveys’. Paper presented at the annual meeting of the American Association ForPublic Opinion Association, Fontainebleau Resort, Miami Beach, FL.
■ Mauro, Paolo. 1995. ‘Corruption and growth’. Q. J. Econ. 110:681–712.
■ Mauro, Paolo. 1998. ‘Corruption and composition of government expenditure’. J. Public Econ. 69:263–79.
■ Mo, Pak Hung. 2001. ‘Corruption and economic growth’. J. Comp. Econ. 29:66–79.
■ Morse, S. 2006. ‘Is corruption bad for environmental sustainability?A cross-national analysis.’ Ecology and Society 11(1): 22.
■ Putnam, Robert D. (with Leonardi, Robert & Nanetti, Raffaella Y.). 1993. Making Democracy Work.
Civic traditions in modern Ital y, Princeton, NJ: Princeton University Press.
■ Rothstein, Bo & Uslaner, Eric. 2005. ‘All for all: Equality and social trust.’World Politics 58(1): 41–73.
■ Rothstein, Bo & Teorell, Jan. 2008. ‘What Is Quality of Government? A Theory of Impartial Government Institutions.’Governance: An International Journal of Policy, Administration and Institutions 21(2):165-190.
■ Tanzi, Vito. 2001. ‘Pitfalls on the Road to Fiscal Decentralization’,Carnegie Endowment
for International Peace Working Paper , 19, Washington, D.C.: Carnegie Endowment.
■ Tabellini, Guido. 2005. ‘Culture and Institutions: Economic Development in the Regions of Europe’.IGIER Working Paper No. 292. Available at SSRN: http://ssrn.com/abstract=754086
■ Transparency International. 2006. Global Corruption Report 2006 . London: Pluto.
■ Watts, Ronald L. 1999. Comparing federal systems. 2nd ed. Kingston, Ontario:Queen’s University and McGill-Queen’s University Press.
■ Welsch, H. 2004. ‘Corruption, growth, and the environment: a cross-country analysis’.Environ. Dev. Econ. 9:663–93.
■ Öberg, Magnus & Melander, Erik. 2010. ‘Autocracy, Bureaucracy, and Civil War’. APSA 2010 Annual Meeting Paper .
REGIONAL GOVERNANCE MATTERS: A STUDY ON REGIO NAL VARIATION IN QUALITY OF GOVERNMENT WITHIN THE EU 17
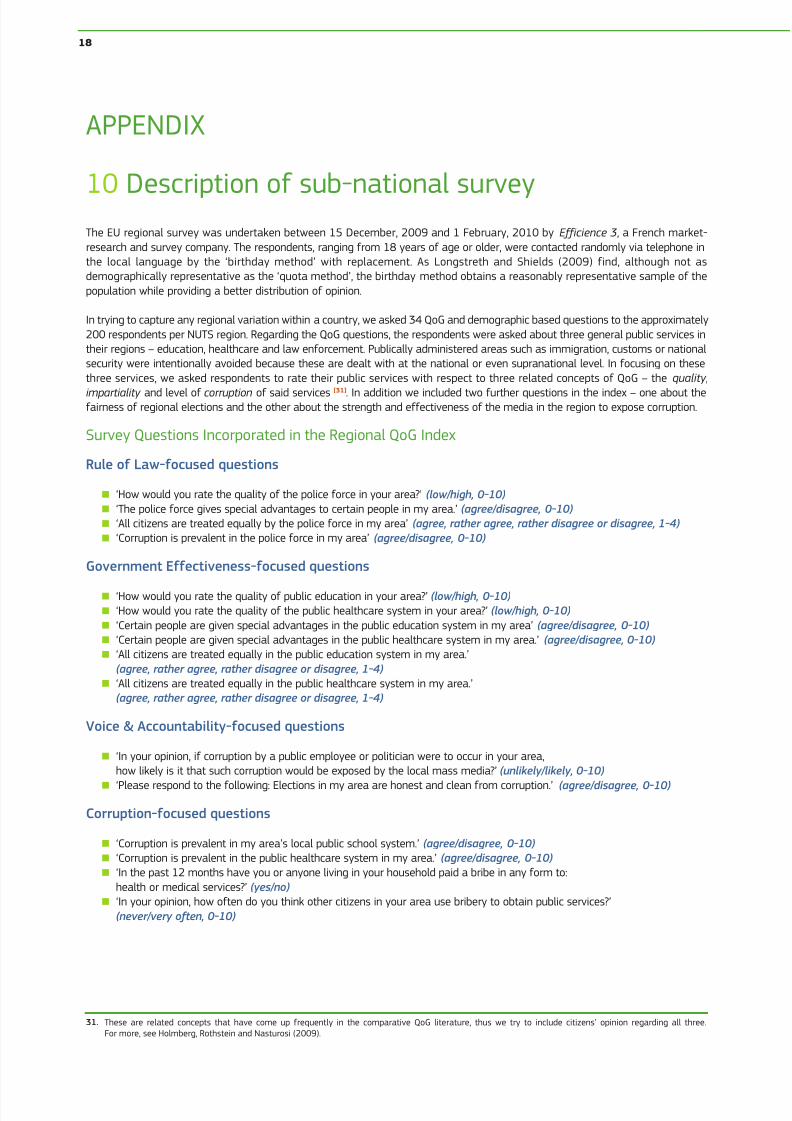
8/18/2019 Estudio de corrupcion en Europa
http://slidepdf.com/reader/full/estudio-de-corrupcion-en-europa 20/28
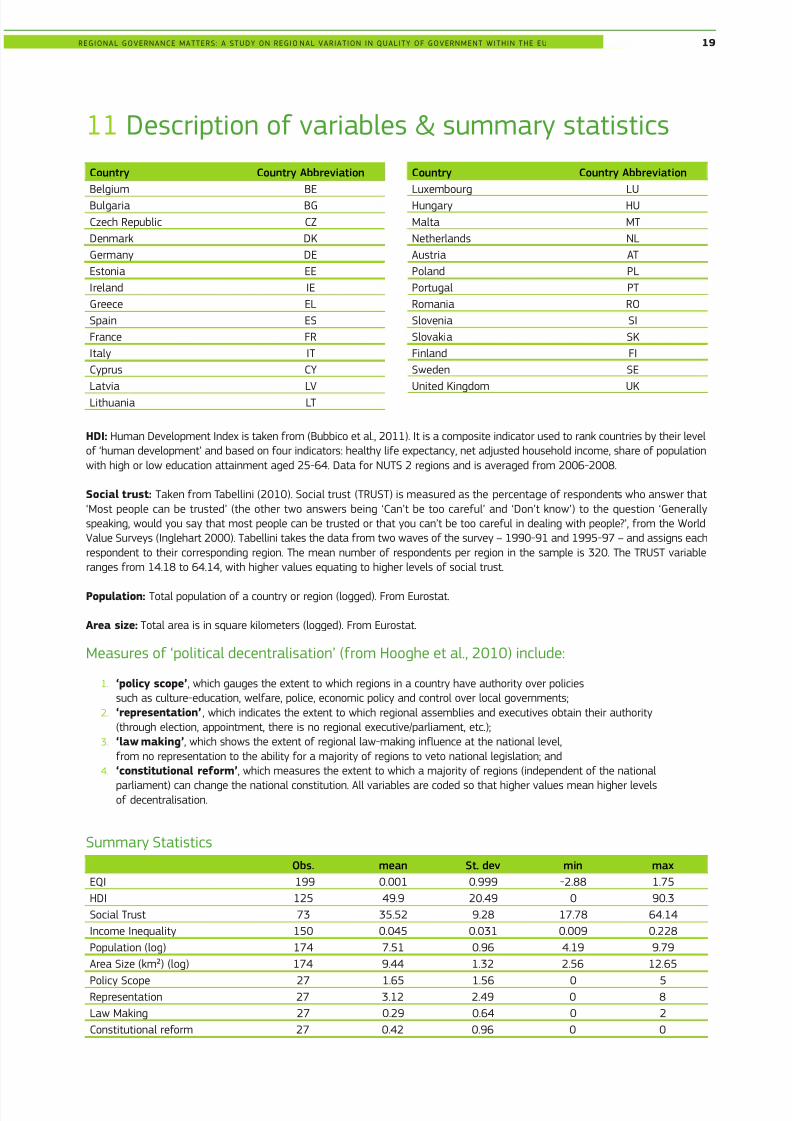
8/18/2019 Estudio de corrupcion en Europa
http://slidepdf.com/reader/full/estudio-de-corrupcion-en-europa 21/28
11 Description of variables & summary statistics
HDI: Human Development Index is taken from (Bubbico et al., 2011). It is a composite indicator used to rank countries by their levelof ‘human development’ and based on four indicators: healthy life expectancy, net adjusted household income, share of populationwith high or low education attainment aged 25-64. Data for NUTS 2 regions and is averaged from 2006-2008.
Social trust: Taken from Tabellini (2010). Social trust (TRUST) is measured as the percentage of respondents who answer that‘Most people can be trusted’ (the other two answers being ‘Can’t be too careful’ and ‘Don’t know’) to the question ‘Generallyspeaking, would you say that most people can be trusted or that you can’t be too careful in dealing with people?’, from the WorldValue Surveys (Inglehart 2000). Tabellini takes the data from two waves of the survey – 1990-91 and 1995-97 – and assigns eachrespondent to their corresponding region. The mean number of respondents per region in the sample is 320. The TRUST variableranges from 14.18 to 64.14, with higher values equating to higher levels of social trust.
Population: Total population of a country or region (logged). From Eurostat.
Area size: Total area is in square kilometers (logged). From Eurostat.
Measures of ‘political decentralisation’ (from Hooghe et al., 2010) include:
1. ‘policy scope’, which gauges the extent to which regions in a country have authority over policiessuch as culture-education, welfare, police, economic policy and control over local governments;
2. ‘representation’ , which indicates the extent to which regional assemblies and executives obtain their authority(through election, appointment, there is no regional executive/parliament, etc.);
3. ‘law making’, which shows the extent of regional law-making influence at the national level,from no representation to the ability for a majority of regions to veto national legislation; and
4. ‘constitutional reform’, which measures the extent to which a majority of regions (independent of the national
parliament) can change the national constitution. All variables are coded so that higher values mean higher levelsof decentralisation.
Summary Statistics
Obs. mean St. dev min max
EQI 199 0.001 0.999 -2.88 1.75
HDI 125 49.9 20.49 0 90.3
Social Trust 73 35.52 9.28 17.78 64.14
Income Inequality 150 0.045 0.031 0.009 0.228
Population (log) 174 7.51 0.96 4.19 9.79
Area Size (km²) (log) 174 9.44 1.32 2.56 12.65
Policy Scope 27 1.65 1.56 0 5Representation 27 3.12 2.49 0 8
Law Making 27 0.29 0.64 0 2
Constitutional reform 27 0.42 0.96 0 0
Country Country Abbreviation
Belgium BE
Bulgaria BG
Czech Republic CZ
Denmark DK
Germany DE
Estonia EE
Ireland IE
Greece EL
Spain ES
France FR
Italy IT
Cyprus CY
Latvia LV
Lithuania LT
Country Country Abbreviation
Luxembourg LU
Hungary HU
Malta MT
Netherlands NL
Austria AT
Poland PL
Portugal PT
Romania RO
Slovenia SI
Slovakia SK
Finland FI
Sweden SE
United Kingdom UK
REGIONAL GOVERNANCE MATTERS: A STUDY ON REGIO NAL VARIATION IN QUALITY OF GOVERNMENT WITHIN THE EU 19
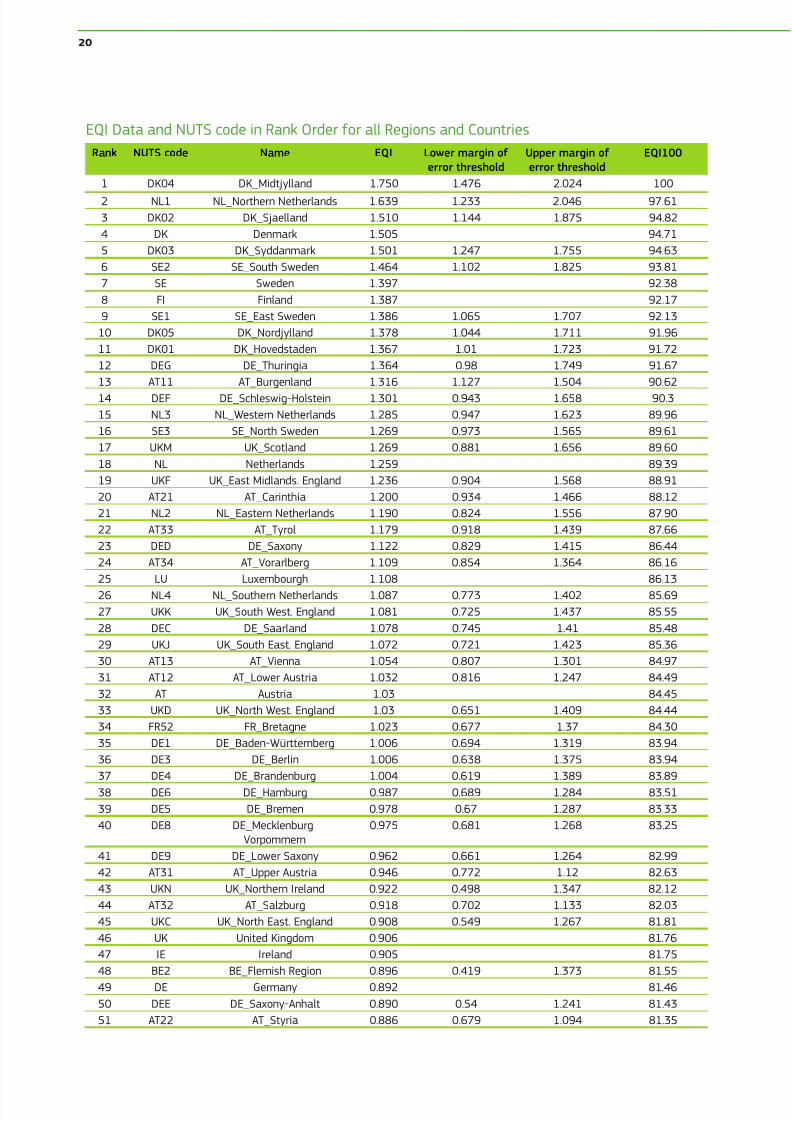
8/18/2019 Estudio de corrupcion en Europa
http://slidepdf.com/reader/full/estudio-de-corrupcion-en-europa 22/28
EQI Data and NUTS code in Rank Order for all Regions and Countries
Rank NUTS code Name EQI Lower margin of
error threshold
Upper margin of
error threshold
EQI100
1 DK04 DK_Midtjylland 1.750 1.476 2.024 100
2 NL1 NL_Northern Netherlands 1.639 1.233 2.046 97.613 DK02 DK_Sjaelland 1.510 1.144 1.875 94.82
4 DK Denmark 1.505 94.71
5 DK03 DK_Syddanmark 1.501 1.247 1.755 94.63
6 SE2 SE_South Sweden 1.464 1.102 1.825 93.81
7 SE Sweden 1.397 92.38
8 FI Finland 1.387 92.17
9 SE1 SE_East Sweden 1.386 1.065 1.707 92.13
10 DK05 DK_Nordjylland 1.378 1.044 1.711 91.96
11 DK01 DK_Hovedstaden 1.367 1.01 1.723 91.72
12 DEG DE_Thuringia 1.364 0.98 1.749 91.67
13 AT11 AT_Burgenland 1.316 1.127 1.504 90.62
14 DEF DE_Schleswig-Holstein 1.301 0.943 1.658 90.3
15 NL3 NL_Western Netherlands 1.285 0.947 1.623 89.96
16 SE3 SE_North Sweden 1.269 0.973 1.565 89.61
17 UKM UK_Scotland 1.269 0.881 1.656 89.60
18 NL Netherlands 1.259 89.39
19 UKF UK_East Midlands. England 1.236 0.904 1.568 88.91
20 AT21 AT_Carinthia 1.200 0.934 1.466 88.12
21 NL2 NL_Eastern Netherlands 1.190 0.824 1.556 87.90
22 AT33 AT_Tyrol 1.179 0.918 1.439 87.66
23 DED DE_Saxony 1.122 0.829 1.415 86.44
24 AT34 AT_Vorarlberg 1.109 0.854 1.364 86.16
25 LU Luxembourgh 1.108 86.13
26 NL4 NL_Southern Netherlands 1.087 0.773 1.402 85.69
27 UKK UK_South West. England 1.081 0.725 1.437 85.55
28 DEC DE_Saarland 1.078 0.745 1.41 85.48
29 UKJ UK_South East. England 1.072 0.721 1.423 85.36
30 AT13 AT_Vienna 1.054 0.807 1.301 84.97
31 AT12 AT_Lower Austria 1.032 0.816 1.247 84.49
32 AT Austria 1.03 84.45
33 UKD UK_North West. England 1.03 0.651 1.409 84.44
34 FR52 FR_Bretagne 1.023 0.677 1.37 84.30
35 DE1 DE_Baden-Württemberg 1.006 0.694 1.319 83.94
36 DE3 DE_Berlin 1.006 0.638 1.375 83.94
37 DE4 DE_Brandenburg 1.004 0.619 1.389 83.89
38 DE6 DE_Hamburg 0.987 0.689 1.284 83.51
39 DE5 DE_Bremen 0.978 0.67 1.287 83.33
40 DE8 DE_Mecklenburg-Vorpommern
0.975 0.681 1.268 83.25
41 DE9 DE_Lower Saxony 0.962 0.661 1.264 82.99
42 AT31 AT_Upper Austria 0.946 0.772 1.12 82.63
43 UKN UK_Northern Ireland 0.922 0.498 1.347 82.12
44 AT32 AT_Salzburg 0.918 0.702 1.133 82.03
45 UKC UK_North East. England 0.908 0.549 1.267 81.81
46 UK United Kingdom 0.906 81.76
47 IE Ireland 0.905 81.75
48 BE2 BE_Flemish Region 0.896 0.419 1.373 81.55
49 DE Germany 0.892 81.4650 DEE DE_Saxony-Anhalt 0.890 0.54 1.241 81.43
51 AT22 AT_Styria 0.886 0.679 1.094 81.35
20
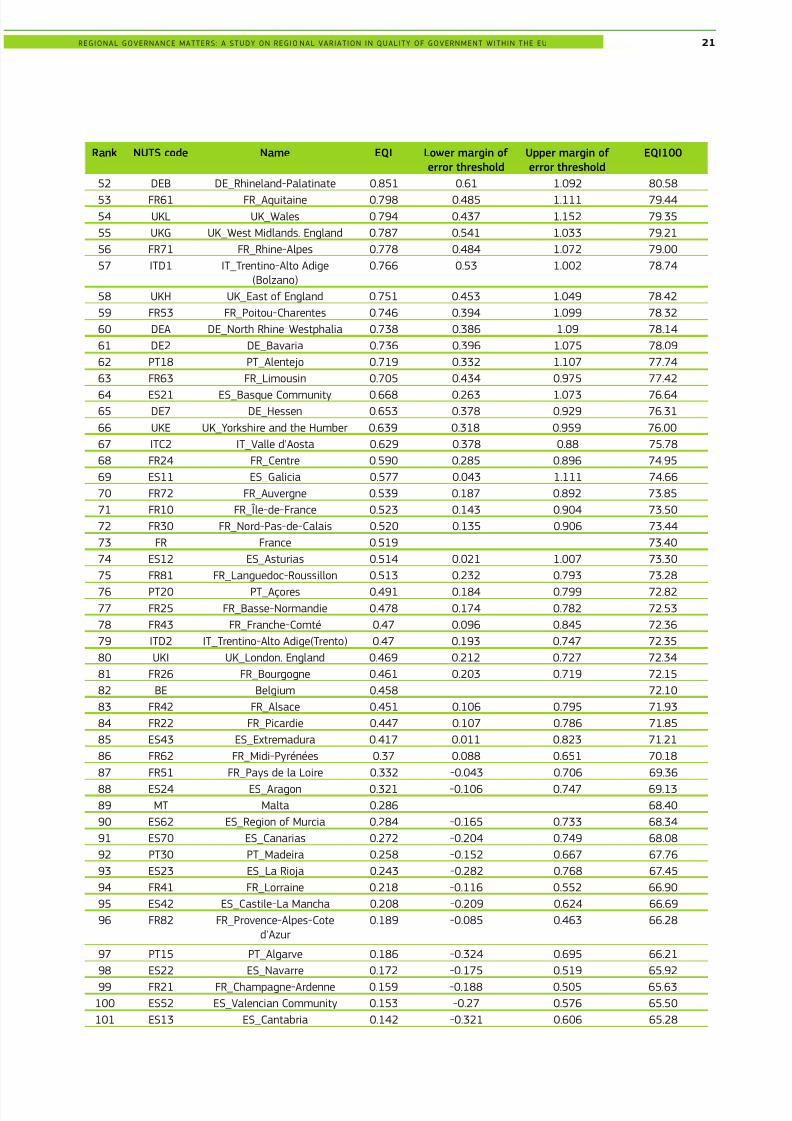
8/18/2019 Estudio de corrupcion en Europa
http://slidepdf.com/reader/full/estudio-de-corrupcion-en-europa 23/28
Rank NUTS code Name EQI Lower margin of
error threshold
Upper margin of
error threshold
EQI100
52 DEB DE_Rhineland-Palatinate 0.851 0.61 1.092 80.58
53 FR61 FR_Aquitaine 0.798 0.485 1.111 79.4454 UKL UK_Wales 0.794 0.437 1.152 79.35
55 UKG UK_West Midlands. England 0.787 0.541 1.033 79.21
56 FR71 FR_Rhine-Alpes 0.778 0.484 1.072 79.00
57 ITD1 IT_Trentino-Alto Adige(Bolzano)
0.766 0.53 1.002 78.74
58 UKH UK_East of England 0.751 0.453 1.049 78.42
59 FR53 FR_Poitou-Charentes 0.746 0.394 1.099 78.32
60 DEA DE_North Rhine-Westphalia 0.738 0.386 1.09 78.14
61 DE2 DE_Bavaria 0.736 0.396 1.075 78.09
62 PT18 PT_Alentejo 0.719 0.332 1.107 77.74
63 FR63 FR_Limousin 0.705 0.434 0.975 77.42
64 ES21 ES_Basque Community 0.668 0.263 1.073 76.6465 DE7 DE_Hessen 0.653 0.378 0.929 76.31
66 UKE UK_Yorkshire and the Humber 0.639 0.318 0.959 76.00
67 ITC2 IT_Valle d'Aosta 0.629 0.378 0.88 75.78
68 FR24 FR_Centre 0.590 0.285 0.896 74.95
69 ES11 ES_Galicia 0.577 0.043 1.111 74.66
70 FR72 FR_Auvergne 0.539 0.187 0.892 73.85
71 FR10 FR_Île-de-France 0.523 0.143 0.904 73.50
72 FR30 FR_Nord-Pas-de-Calais 0.520 0.135 0.906 73.44
73 FR France 0.519 73.40
74 ES12 ES_Asturias 0.514 0.021 1.007 73.30
75 FR81 FR_Languedoc-Roussillon 0.513 0.232 0.793 73.28
76 PT20 PT_Açores 0.491 0.184 0.799 72.8277 FR25 FR_Basse-Normandie 0.478 0.174 0.782 72.53
78 FR43 FR_Franche-Comté 0.47 0.096 0.845 72.36
79 ITD2 IT_Trentino-Alto Adige(Trento) 0.47 0.193 0.747 72.35
80 UKI UK_London. England 0.469 0.212 0.727 72.34
81 FR26 FR_Bourgogne 0.461 0.203 0.719 72.15
82 BE Belgium 0.458 72.10
83 FR42 FR_Alsace 0.451 0.106 0.795 71.93
84 FR22 FR_Picardie 0.447 0.107 0.786 71.85
85 ES43 ES_Extremadura 0.417 0.011 0.823 71.21
86 FR62 FR_Midi-Pyrénées 0.37 0.088 0.651 70.18
87 FR51 FR_Pays de la Loire 0.332 -0.043 0.706 69.36
88 ES24 ES_Aragon 0.321 -0.106 0.747 69.1389 MT Malta 0.286 68.40
90 ES62 ES_Region of Murcia 0.284 -0.165 0.733 68.34
91 ES70 ES_Canarias 0.272 -0.204 0.749 68.08
92 PT30 PT_Madeira 0.258 -0.152 0.667 67.76
93 ES23 ES_La Rioja 0.243 -0.282 0.768 67.45
94 FR41 FR_Lorraine 0.218 -0.116 0.552 66.90
95 ES42 ES_Castile-La Mancha 0.208 -0.209 0.624 66.69
96 FR82 FR_Provence-Alpes-Coted'Azur
0.189 -0.085 0.463 66.28
97 PT15 PT_Algarve 0.186 -0.324 0.695 66.21
98 ES22 ES_Navarre 0.172 -0.175 0.519 65.92
99 FR21 FR_Champagne-Ardenne 0.159 -0.188 0.505 65.63100 ES52 ES_Valencian Community 0.153 -0.27 0.576 65.50
101 ES13 ES_Cantabria 0.142 -0.321 0.606 65.28
REGIONAL GOVERNANCE MATTERS: A STUDY ON REGIO NAL VARIATION IN QUALITY OF GOVERNMENT WITHIN THE EU 21
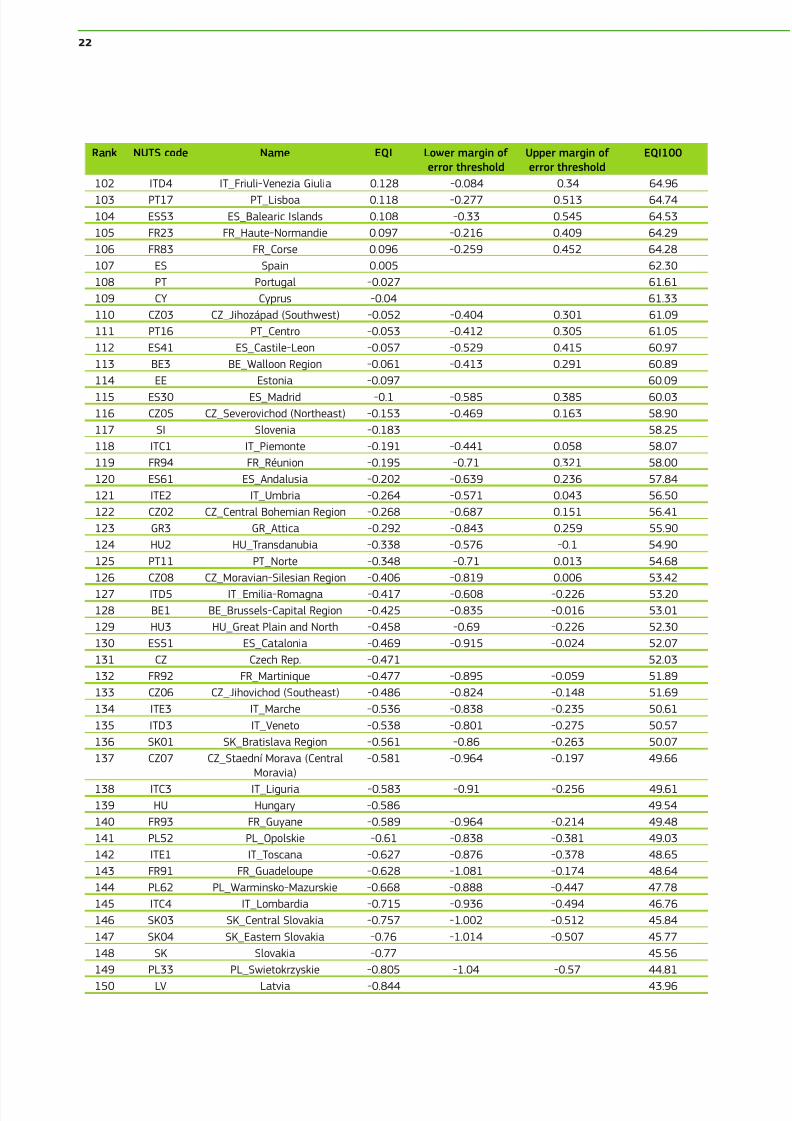
8/18/2019 Estudio de corrupcion en Europa
http://slidepdf.com/reader/full/estudio-de-corrupcion-en-europa 24/28
Rank NUTS code Name EQI Lower margin of
error threshold
Upper margin of
error threshold
EQI100
102 ITD4 IT_Friuli-Venezia Giulia 0.128 -0.084 0.34 64.96
103 PT17 PT_Lisboa 0.118 -0.277 0.513 64.74104 ES53 ES_Balearic Islands 0.108 -0.33 0.545 64.53
105 FR23 FR_Haute-Normandie 0.097 -0.216 0.409 64.29
106 FR83 FR_Corse 0.096 -0.259 0.452 64.28
107 ES Spain 0.005 62.30
108 PT Portugal -0.027 61.61
109 CY Cyprus -0.04 61.33
110 CZ03 CZ_Jihozápad (Southwest) -0.052 -0.404 0.301 61.09
111 PT16 PT_Centro -0.053 -0.412 0.305 61.05
112 ES41 ES_Castile-Leon -0.057 -0.529 0.415 60.97
113 BE3 BE_Walloon Region -0.061 -0.413 0.291 60.89
114 EE Estonia -0.097 60.09
115 ES30 ES_Madrid -0.1 -0.585 0.385 60.03116 CZ05 CZ_Severovichod (Northeast) -0.153 -0.469 0.163 58.90
117 SI Slovenia -0.183 58.25
118 ITC1 IT_Piemonte -0.191 -0.441 0.058 58.07
119 FR94 FR_Réunion -0.195 -0.71 0.321 58.00
120 ES61 ES_Andalusia -0.202 -0.639 0.236 57.84
121 ITE2 IT_Umbria -0.264 -0.571 0.043 56.50
122 CZ02 CZ_Central Bohemian Region -0.268 -0.687 0.151 56.41
123 GR3 GR_Attica -0.292 -0.843 0.259 55.90
124 HU2 HU_Transdanubia -0.338 -0.576 -0.1 54.90
125 PT11 PT_Norte -0.348 -0.71 0.013 54.68
126 CZ08 CZ_Moravian-Silesian Region -0.406 -0.819 0.006 53.42
127 ITD5 IT_Emilia-Romagna -0.417 -0.608 -0.226 53.20128 BE1 BE_Brussels-Capital Region -0.425 -0.835 -0.016 53.01
129 HU3 HU_Great Plain and North -0.458 -0.69 -0.226 52.30
130 ES51 ES_Catalonia -0.469 -0.915 -0.024 52.07
131 CZ Czech Rep. -0.471 52.03
132 FR92 FR_Martinique -0.477 -0.895 -0.059 51.89
133 CZ06 CZ_Jihovichod (Southeast) -0.486 -0.824 -0.148 51.69
134 ITE3 IT_Marche -0.536 -0.838 -0.235 50.61
135 ITD3 IT_Veneto -0.538 -0.801 -0.275 50.57
136 SK01 SK_Bratislava Region -0.561 -0.86 -0.263 50.07
137 CZ07 CZ_Staední Morava (CentralMoravia)
-0.581 -0.964 -0.197 49.66
138 ITC3 IT_Liguria -0.583 -0.91 -0.256 49.61139 HU Hungary -0.586 49.54
140 FR93 FR_Guyane -0.589 -0.964 -0.214 49.48
141 PL52 PL_Opolskie -0.61 -0.838 -0.381 49.03
142 ITE1 IT_Toscana -0.627 -0.876 -0.378 48.65
143 FR91 FR_Guadeloupe -0.628 -1.081 -0.174 48.64
144 PL62 PL_Warminsko-Mazurskie -0.668 -0.888 -0.447 47.78
145 ITC4 IT_Lombardia -0.715 -0.936 -0.494 46.76
146 SK03 SK_Central Slovakia -0.757 -1.002 -0.512 45.84
147 SK04 SK_Eastern Slovakia -0.76 -1.014 -0.507 45.77
148 SK Slovakia -0.77 45.56
149 PL33 PL_Swietokrzyskie -0.805 -1.04 -0.57 44.81
150 LV Latvia -0.844 43.96
22
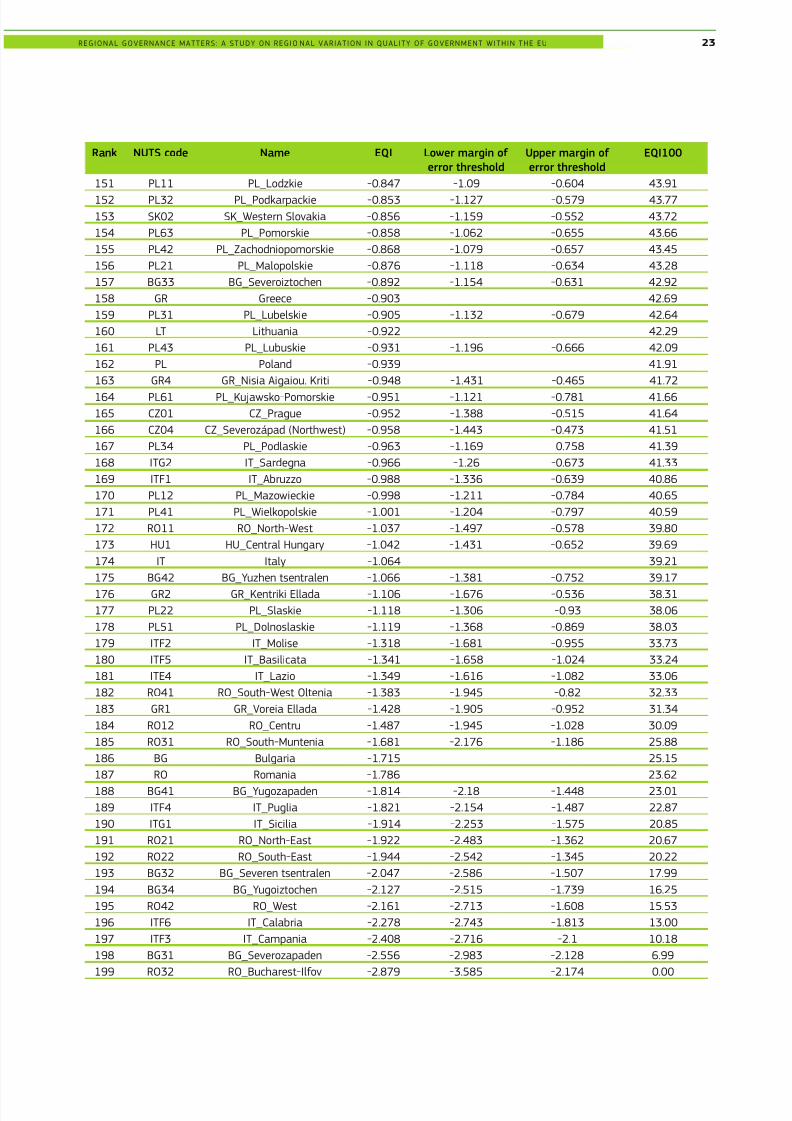
8/18/2019 Estudio de corrupcion en Europa
http://slidepdf.com/reader/full/estudio-de-corrupcion-en-europa 25/28
Rank NUTS code Name EQI Lower margin of
error threshold
Upper margin of
error threshold
EQI100
151 PL11 PL_Lodzkie -0.847 -1.09 -0.604 43.91
152 PL32 PL_Podkarpackie -0.853 -1.127 -0.579 43.77153 SK02 SK_Western Slovakia -0.856 -1.159 -0.552 43.72
154 PL63 PL_Pomorskie -0.858 -1.062 -0.655 43.66
155 PL42 PL_Zachodniopomorskie -0.868 -1.079 -0.657 43.45
156 PL21 PL_Malopolskie -0.876 -1.118 -0.634 43.28
157 BG33 BG_Severoiztochen -0.892 -1.154 -0.631 42.92
158 GR Greece -0.903 42.69
159 PL31 PL_Lubelskie -0.905 -1.132 -0.679 42.64
160 LT Lithuania -0.922 42.29
161 PL43 PL_Lubuskie -0.931 -1.196 -0.666 42.09
162 PL Poland -0.939 41.91
163 GR4 GR_Nisia Aigaiou. Kriti -0.948 -1.431 -0.465 41.72
164 PL61 PL_Kujawsko-Pomorskie -0.951 -1.121 -0.781 41.66165 CZ01 CZ_Prague -0.952 -1.388 -0.515 41.64
166 CZ04 CZ_Severozápad (Northwest) -0.958 -1.443 -0.473 41.51
167 PL34 PL_Podlaskie -0.963 -1.169 -0.758 41.39
168 ITG2 IT_Sardegna -0.966 -1.26 -0.673 41.33
169 ITF1 IT_Abruzzo -0.988 -1.336 -0.639 40.86
170 PL12 PL_Mazowieckie -0.998 -1.211 -0.784 40.65
171 PL41 PL_Wielkopolskie -1.001 -1.204 -0.797 40.59
172 RO11 RO_North-West -1.037 -1.497 -0.578 39.80
173 HU1 HU_Central Hungary -1.042 -1.431 -0.652 39.69
174 IT Italy -1.064 39.21
175 BG42 BG_Yuzhen tsentralen -1.066 -1.381 -0.752 39.17
176 GR2 GR_Kentriki Ellada -1.106 -1.676 -0.536 38.31177 PL22 PL_Slaskie -1.118 -1.306 -0.93 38.06
178 PL51 PL_Dolnoslaskie -1.119 -1.368 -0.869 38.03
179 ITF2 IT_Molise -1.318 -1.681 -0.955 33.73
180 ITF5 IT_Basilicata -1.341 -1.658 -1.024 33.24
181 ITE4 IT_Lazio -1.349 -1.616 -1.082 33.06
182 RO41 RO_South-West Oltenia -1.383 -1.945 -0.82 32.33
183 GR1 GR_Voreia Ellada -1.428 -1.905 -0.952 31.34
184 RO12 RO_Centru -1.487 -1.945 -1.028 30.09
185 RO31 RO_South-Muntenia -1.681 -2.176 -1.186 25.88
186 BG Bulgaria -1.715 25.15
187 RO Romania -1.786 23.62
188 BG41 BG_Yugozapaden -1.814 -2.18 -1.448 23.01189 ITF4 IT_Puglia -1.821 -2.154 -1.487 22.87
190 ITG1 IT_Sicilia -1.914 -2.253 -1.575 20.85
191 RO21 RO_North-East -1.922 -2.483 -1.362 20.67
192 RO22 RO_South-East -1.944 -2.542 -1.345 20.22
193 BG32 BG_Severen tsentralen -2.047 -2.586 -1.507 17.99
194 BG34 BG_Yugoiztochen -2.127 -2.515 -1.739 16.25
195 RO42 RO_West -2.161 -2.713 -1.608 15.53
196 ITF6 IT_Calabria -2.278 -2.743 -1.813 13.00
197 ITF3 IT_Campania -2.408 -2.716 -2.1 10.18
198 BG31 BG_Severozapaden -2.556 -2.983 -2.128 6.99
199 RO32 RO_Bucharest-Ilfov -2.879 -3.585 -2.174 0.00
REGIONAL GOVERNANCE MATTERS: A STUDY ON REGIO NAL VARIATION IN QUALITY OF GOVERNMENT WITHIN THE EU 23

8/18/2019 Estudio de corrupcion en Europa
http://slidepdf.com/reader/full/estudio-de-corrupcion-en-europa 26/28

8/18/2019 Estudio de corrupcion en Europa
http://slidepdf.com/reader/full/estudio-de-corrupcion-en-europa 27/28

8/18/2019 Estudio de corrupcion en Europa
http://slidepdf.com/reader/full/estudio-de-corrupcion-en-europa 28/28