Embed Size (px)
Citation preview

lable at ScienceDirect
Estuarine, Coastal and Shelf Science 160 (2015) 10e21
Contents lists avai
Estuarine, Coastal and Shelf Science
journal homepage: www.elsevier .com/locate/ecss
Environmental factors affecting methane distribution and bacterialmethane oxidation in the German Bight (North Sea)
Roman Osudar a, *, Anna Matou�s�u b, c, 1, Mashal Alawi d, 2, Dirk Wagner d, 3,Ingeborg Bussmann e, 4
a Alfred Wegener Institute, Helmholtz Centre for Polar and Marine Research, Research Unit Potsdam, Telegrafenberg, 14473 Potsdam, Germanyb University of South Bohemia, Faculty of Science e Dept. of Ecosystem Biology, Branisovska 31, 37005 �Cesk�e Bud�ejovice, Czech Republicc Biology Centre of the Czech Academy of Sciences, Institute of Hydrobiology, Na Sadkach 7, 37005 �Cesk�e Bud�ejovice, Czech Republicd GFZ German Research Centre for Geosciences, Section 4.5 Geomicrobiology, Telegrafenberg, 14473 Potsdam, Germanye Alfred Wegener Institute, Helmholtz Centre for Polar and Marine Research, Marine Station Helgoland, Kurpromenade 201, 27498 Helgoland, Germany
a r t i c l e i n f o
Article history:Received 14 July 2014Accepted 22 March 2015Available online 3 April 2015
Keywords:methanotrophyestuaryElbe River
* Corresponding author.E-mail addresses: [email protected] (R. Osuda
(A. Matou�s�u), [email protected] (M. Alawde (D. Wagner), [email protected] (I. Bussm
1 Tel.: þ420387775834.2 Tel.: þ4933128828818.3 Tel.: þ49 331 288 28800.4 Tel.: þ49 4725 8193230.
http://dx.doi.org/10.1016/j.ecss.2015.03.0280272-7714/© 2015 The Authors. Published by Elsevier
a b s t r a c t
River estuaries are responsible for high rates of methane emissions to the atmosphere. The complexityand diversity of estuaries require detailed investigation of methane sources and sinks, as well as of theirspatial and seasonal variations. The Elbe river estuary and the adjacent North Sea were chosen as thestudy site for this survey, which was conducted from October 2010 to June 2012. Using gas chroma-tography and radiotracer techniques, we measured methane concentrations and methane oxidation(MOX) rates along a 60 km long transect from Cuxhaven to Helgoland. Methane distribution wasinfluenced by input from the methane-rich mouth of the Elbe and gradual dilution by methane-depletedsea water. Methane concentrations near the coast were on average 30 ± 13 nmol L�1, while in the opensea, they were 14 ± 6 nmol L�1. Interestingly, the highest methane concentrations were repeatedlydetected near Cuxhaven, not in the Elbe River freshwater end-member as previously reported. Though,we did not find clear seasonality we observed temporal methane variations, which depended on tem-perature and presumably on water discharge from the Elbe River. The highest MOX rates generallycoincided with the highest methane concentrations, and varied from 2.6 ± 2.7 near the coast to0.417 ± 0.529 nmol L�1 d�1 in the open sea. Turnover times varied from 3 to >1000 days. MOX rates werestrongly affected by methane concentration, temperature and salinity. We ruled out the supposition thatMOX is not an important methane sink in most of the Elbe estuary and adjacent German Bight.© 2015 The Authors. Published by Elsevier Ltd. This is an open access article under the CC BY-NC-ND
license (http://creativecommons.org/licenses/by-nc-nd/4.0/).
1. Introduction
Methane is the most abundant organic gas in the atmosphere.Being a potent greenhouse gas, it plays an important role inwarming the Earth's atmosphere (Kirschke et al., 2013). Its contri-bution to global warming is attenuated by comparatively lowconcentrations and short lifetime in the atmosphere. Methane hasthe second-largest radiative forcing of the long-lived greenhouse
r), [email protected]), [email protected]).
Ltd. This is an open access article u
gases, after CO2 (Ramaswamy et al., 2001). The atmospheric con-centration of methane has increased to a level unprecedented in atleast the last 800,000 years (Stocker et al., 2013). Its average con-centration nowadays is around 1.8 ppm (Kirschke et al., 2013).Changes in methane concentration, which are defined by the bal-ance between sources and sinks of methane, have led to in-vestigations on the microbial-driven methane cycle in variousenvironments.
About 60% of the methane released to the atmosphere is fromanthropogenic sources such as agriculture, waste treatment,biomass burning, and fossil fuels. The remaining 40% originatesfrom natural sources, mainly wetlands (Kirschke et al., 2013).Among these sources, the world's oceans contribute <0.1e10% ofthe methane emissions (Scranton and McShane, 1991; Bates et al.,1996; Middelburg et al., 2002; Conrad, 2009). Digestive tracts ofzooplankton (Bianchi et al., 1992; De Angelis and Lee, 1994), and
nder the CC BY-NC-ND license (http://creativecommons.org/licenses/by-nc-nd/4.0/).

R. Osudar et al. / Estuarine, Coastal and Shelf Science 160 (2015) 10e21 11
organic particulate matter (Karl and Tilbrook, 1994) are the mainmethane sources in the open ocean. However, about 75% of globaloceanic methane emission occurs in shelf areas and estuaries(Bange et al., 1994; Bange, 2006). The main sources of methane inthese areas are sediments, adjacent rivers, tidal flats, and marshes(Bange et al., 1994; Bange, 2006; Abril et al., 2007; Grunwald et al.,2009; Bussmann, 2013). Sedimentary release of methane whichfollows methanogenesis (Koch et al., 2009; Bussmann, 2013) andabiotic methane production (Hovland et al., 1993) is supplementedwith lateral methane transport. Water discharge from rivers, aswell as tidal influence, are factors that greatly control methanedistribution (Rehder et al., 1998; Grunwald et al., 2009). Thus, theseareas represent diverse and complex hydro-dynamic systems. Be-sides, estuarine systems are subject to significant seasonal changes(Sansone et al., 1998; Middelburg et al., 2002; Abril and Borges,2005), a factor which is not considered in many studies. Bacterialmethane oxidation, along with degasing and dilution of methane-rich water, are also important factors controlling methane distri-bution in the water column (Grunwald et al., 2009). Up to 80e90%of the available methane can be metabolized and thereby disposedof by bacterial methane oxidation in the freshwater (Reeburghet al., 1993; Gu�erin and Abril, 2007). In the marine environment,however, methane oxidation (MOX) rates are in general lower(Valentine et al., 2001; Mau et al., 2013). Though, knowledge onbacterial methane oxidation in the water column rapidly improves,MOX rates measurements in estuaries are still scarce. Additionally,an improved knowledge of the environmental factors controllingbacterial methane oxidation and the physiological properties ofthese organisms is crucial and this topic needs further investigation(Valentine, 2011; Mau et al., 2013).
The objectives of this study were to describe the spatial andseasonal variations of methane in the German Bight, near the Elbeestuary. The methane concentration, as well as several hydro-chemical parameters from the bottom and surface waters, weremeasured over a period of two years along a 60 km long transect inthe German Bight. Along with temperature, the concentrations ofinorganic nutrients (ammonium, nitrite, nitrate, phosphate, andsilicate) and suspended particulate matter (SPM) were measured.Salinity was an especially important parameter, as it is a directindicator of the extent of water discharge of the Elbe River. The aimof this study was to bring the importance of bacterial methaneoxidation as a significant methane sink into focus. Therefore, wemade highly sensitive radiotracer measurements to estimate MOXrates in the water column (Valentine et al., 2001). Only on the basisof these comprehensive examinations we were able to determinethe main environmental factors that control methane distributionand MOX rates.
2. Materials and methods
2.1. Study area
The North Sea (including its estuaries and fjords) has a surfacearea of about 750,000 km2 and a volume of about 94,000 km3
(Commission, 2000). The non-tidal circulation of the North Sea isdominated by a cyclonic residual current. Water from the Atlantic(Fair Isle Current, Shetland Flow) flows southward along the Britishcoast and returns northward, together with influxes from the En-glish Channel and various rivers along the coasts of theNetherlands, Germany, and Denmark (Rehder et al., 1998). TheGerman Bight is the south-eastern bight of the North Sea, boundedby the Netherlands and Germany to the south, and Denmark andGermany to the east (the Jutland peninsula). To the north and west,it is bounded by the Dogger Bank. The depths in this area varymainly from 20 to 40 m (Czitrom et al., 1988). The German Bight
consists mainly of a mixture of the Central (Southern) North Seawater masses and continental coastal waters (Becker et al., 1992).The water column in the central (southern) North Sea can bestratified into two slightly different layers (Czitrom et al., 1988;Becker et al., 1992). Inshore water did not show any stratificationin either summer or winter. Freshwater discharge from the Elbe andWeser rivers causes a large salinity contrast near the shore (Czitromet al., 1988). Analysis of horizontal density gradients did not show aclear annual cycle either near the shore or offshore (Czitrom et al.,1988). Surface sediments affected by tidal or residual current, waveaction, and heavy bottom trawling are very mobile (ICES, 1988;Becker et al., 1992).
The Elbe is one of the major rivers of central Europe, with a totalcatchment area of about 150,000 km2. It runs from the Czech Re-public through Germany, and reaches the German Bight in itsnorth-eastern region, near Cuxhaven. The Elbe's mean annualdischarge at the river mouth is 860 m3 s�1. The discharge regime ismainly controlled by rainfall and snowmelt, therefore it peaks inApril/May (Simon, 2005).
2.2. Water sampling
Samples were collected for 2 years from 2010 to 2012. Elevenone-day sampling cruises took place on the 7.10, 8.12 in 2010, 12.01,2.03, 4.05, 6.07, 29.09 in 2011 and 11.01, 29.02, 28.03, 11.06 in 2012.All sampling procedures and some of the processing of the sampleswere done on board the research vessels ‘Uth€orn’ and ‘LudwigPrandtl’. Seven sampling stations were distributed along the Hel-golandeCuxhaven transect (Fig. 1). The names of the stations weredetermined by their distance from the northernmost coastal pointnear Cuxhaven, so the most south-eastern stationwas denoted ‘Seakilometre (Sk) 1’, and the most north-western, near Helgoland, ‘Sk59’. We determined stations Sk 1, Sk 14, and Sk 20 to be ‘coastalstations’, and stations Sk 27, Sk 32, Sk 49, and Sk 59 to be ‘marinestations’. Water samples were collected with Niskin bottles fromthewater surface (1m below the surface) and from the bottom (1mabove the bottom).
2.2.1. Oceanographic parametersWater temperaturewasmeasured tomonitor seasonality during
the study period. Salinity was measured to account for the pro-portion of freshwater from the Elbe River in North Sea water. Ox-ygen concentration was measured to investigate its effect on MOXrate, and accordingly, on methane distribution. During the Prandtlcruises, temperature, salinity, and oxygen in thewater columnweremeasured immediately after sampling on board using a UniversalPocket Meter (Multi 340i) with precisions of 1% for salinity, 0.1 �Cfor temperature, and 0.5% for oxygen. Salinity was measured inmS cm�1, and then converted according to the Practical SalinityScale. For the Uth€orn cruises, a sea-bird CTD sensor wasmounted tothe water sampling rosette. In July 2011, temperature measure-ments were notmade due to technical problems. Thus, we obtainedtemperature data from the database of the River Basin CommunityElbe (RBC Elbe; in German, ‘Flussgebietsgemeinschaft (RBC) Elbe;http://www.fgg-elbe.de/elbe-datenportal.html). These data werecollected near Cuxhaven two days before our cruise. Comparisonsof RBC measurements with ours for other months did not revealany significant difference (±1 �C). These data from July wereexcluded from the comparison of temperatures on the surface andon the bottom, but were used for the correlation analysis betweentemperature and other factors.
2.2.2. Suspended particulate matter (SPM)Sampled water was filtered using pre-washed and pre-weighed
GFC filters (Whatman TM), which were afterwards dried for 24

Fig. 1. Map of the German Bight with sampling stations along the CuxhaveneHelgoland transect.
R. Osudar et al. / Estuarine, Coastal and Shelf Science 160 (2015) 10e2112
hours at 60 �C and weighed again. Water volumes varied from 100to 250 ml, depending on turbidity. Filtration was done on boardright after collecting water samples. The other procedures weredone in the laboratory.
2.2.3. Inorganic nutrient analysisSamples for inorganic nutrients (NO2, NO3, NH4, PO4) and sili-
cate concentrations were taken after sampling for methane andMOX rates. During the Prandtl cruises, sampled water was filteredwith GFC filters (Whatman TM), transferred into 50 ml Falcontubes, and frozen until further analysis in the laboratory. Samplingduring the Uth€orn cruises and analysis of all the samples wasperformed by Karen Wiltshire's group (Wiltshire, 2011, 2012)following the technique described by Grasshoff et al. (1983).Nutrient analysis was performed only for surface waters.
2.3. Methane concentration
We measured methane concentrations along the transect indifferent months to assess seasonal and spatial variations. Rightafter sampling collected water was transferred, bubble-free, into120 ml glass serum bottles. The bottles were rinsed with
approximately two volumes of sample water, capped with blackrubber stoppers, and sealed with an aluminium crimp.
To eliminate agents (such as soap) that inhibit methane oxida-tion, the glass bottles had beenwashed and soaked in 3% HCl for 12hours, and then soaked in distilled water overnight. The stoppershad been autoclaved for 20 min at 120 �C three times, and thenrinsed with distilled water.
To determine methane concentrations, samples from eachdepth and each stationwere collected in single (MarcheSeptember2011) or duplicate bottles (October 2010eJanuary 2011, Januar-yeJune 2012).
Immediately after filling the bottles, samples were poisonedwith 0.3 ml of 25% H2SO4 (samples from marine stations) or 0.3 mlof 5N NaOH (samples from coastal stations) to prevent methaneoxidation. Poisoning agents were chosen according to the results ofpreliminary testing of the efficiency of both chemicals in marineand brackish water (Bussmann et al., 2015). Methane concentra-tions were measured using a headspace technique, by adding 10 mlof N2 according to McAuliffe (1971). Three 0.1 ml headspace ali-quots from each sample were analysed with a gas chromatograph(GC 2014; Shimadzu) equipped with a flame ionization detectorand a molecular sieve column (Hay Sep N, 80/100, Alltech). The

R. Osudar et al. / Estuarine, Coastal and Shelf Science 160 (2015) 10e21 13
temperatures of the oven, the injector, and detector were 40, 120,and 160 �C, respectively. The carrier gas (N2) flowwas 20 ml min�1.The gas flow of the FID was 40 ml min�1 for H2 and 400 ml min�1
for synthetic air. Gas standards (Air Liquide) with concentrations of10 and 100 ppm methane were used for calibration. The mea-surement error of the GC was less than 5%.
Equilibrium concentrations were calculated according the for-mula proposed by Wiesenburg and Guinasso Jr (1979). Data on themethane concentration in the atmosphere were obtained from theMace Head Atmospheric Research Station, located on the westcoast of Ireland (http://agage.eas.gatech.edu). Saturation rates werecalculated as the ratio between observed methane concentrationsin the water column and equilibrium concentrations with respectto the ambient methane concentrations in the atmosphere, multi-plied with 100%.
2.4. Methane oxidation (MOX) rate
In addition to the chemical parameters, we also measured themicrobial methane oxidation, as a possible important methanesink. Samples for MOX rates were collected from each depth andeach station in triplicate bottles. According to Bussmann et al.(2015) the coefficient of variation in this case is about 23 ± 11% atlow activities (<10 nmol L�1d�1) and 7 ± 5% at higher activities(>10 nmol L�1d�1). MOX rates were measured following radio-tracer techniques using tritiated methane (American RadiolabeledChemicals, 20 Ci mmol�1) according to a method modified fromValentine et al. (2001). A diluted tracer (0.1 ml) was added to thesamples (2 kBq ml�1). Samples were vigorously shaken and incu-bated for 24 h in the dark at near in situ temperatures. After incu-bation, methane oxidation was stopped by adding 0.3 ml of 25%H2SO4 (for marine station samples) or 5N NaOH (for coastal stationsamples). Controls were stopped before the addition of the tracer.
Under oxic conditions methane is oxidized according thefollowing reaction:
CH4 þ 2O2 / CO2 þ 2H2O (1)
The consumption of tritiated methane (C*H4) leads to the pro-duction of tritiated water (*H2O) and to the decrease of radioactivetracer in the gas phase:
C*H4 þ 2O2 / CO2 þ 2*H2O (2)
Then, the total radioactivity (3HeCH4 and 3HeH2O) added to thesample, and the fraction of the labelled gas oxidized or producedwater (3HeH2O) have to be measured. To determine the totalradioactivity of the sample, the sample bottle is opened, and 2ml ofthe subsample is mixed with a 5 ml scintillation cocktail. Todetermine the radioactivity of the tritiated water, the rest of thesample was sparged with air to expel all methane. Bottles werethen half emptied, a long needle was inserted to the bottom of thebottle, and the sample was purged with air for 30 min. Two mlwater aliquots after sparging were mixed with 5 ml of the scintil-lation cocktail (Ultima Gold LLT, Perkin Elmer) and analysed on aliquid scintillation counter (Tri-Carb® 2910 TR, Perkin Elmer) usingdecays per minute (dpm) values. The MOX rate in nmol L�1 d�1 wascalculated by taking the ratio of the produced radioactive water tothe amount of added tracer (r ¼ *H2O/C*H4, in dpm) and multi-plying it with the ambient methane concentration ([CH4] innmol L�1) and correcting for the incubation time (t in d) (Valentineet al., 2001)
MOX ¼ r� ½CH4�=t (3)
The turnover time (tt in days) is the time it would take to oxidizeall themethane at a givenMOX rate. It was calculated as the inverseof the ratio (r), corrected for the incubation time (t). Thus, thisparameter is independent of the ambient methane concentration,and gives a good measure of the methanotrophic potential (Heintzet al., 2012).
However, there might be some *H2O which was not the result ofmethane oxidation but was a contamination of the tracer. The *H2Ofrom the killed controls reveals this value. In marine waters, about0.06% of the injected tracer was found to be ‘abiotic water’. Infreshwater, the percentage increased to about 0.62%. The value of*H2O were corrected for this ‘abiotic’ water.
2.5. Statistical analysis
For comparison of surface and bottom values and for compari-son of values at different stations (spatial variation), we used apaired t-test in the case of a normal distribution, and a non-parametric Wilcoxon signed- rank test when a normality test(ShapiroeWilk) failed. Marine and coastal stations were analysedseparately. When no significant difference between data sets wasfound, the respective data were pooled. To investigate the depen-dence of methane concentration, turnover time, and MOX rate onhydrographical and chemical factors such as temperature, salinity,methane, phosphate, oxygen, and SPM, we performed simple linearregression analyses. If the linear correlation was not significant, weperformed a Spearman rank order correlation analysis, whichshows if variables are related monotonically, i.e. an increase of onevariable causes an increase/decrease of the other variable. TheSpearman correlation coefficient (rs) is defined as the Pearsoncorrelation coefficient between the ranked variables. For a sampleof size n, the n raw scores Xi, Yi are converted to ranks xi, yi, and rs iscomputed as:
rs ¼P
iðxi � xÞðyi � yÞffiffiffiffiffiffiffiffiffiffiffiffiffiffiffiffiffiffiffiffiffiffiffiffiffiffiffiffiffiffiffiffiffiffiffiffiffiffiffiffiffiffiffiffiffiffiffiffiffiPiðxi � xÞ2Piðyi � yÞ2
q : (4)
Calculations were performed using SigmaPlot for WindowsVersion 11.0 software.
3. Results
3.1. Oceanographic parameters
No significant difference between surface and bottom temper-ature was observed (paired t-test, n ¼ 39, p ¼ 0.917), so the datawere pooled. The lowest temperatures were measured in January2011, with an average of 2.6 ± 1.2 �C. The highest temperature(19.0 ± 1.4 �C) was observed in September 2011.
Surface water generally had a lower salinity than bottom water(paired t-test, n ¼ 49, p < 0.001). The stratification of the watercolumn was most pronounced from June to September. Due to theinput of freshwater from the Elbe River, salinity increased withdistance from the shore. This is well illustrated by two independentsampling campaigns in the summer (July 2011) and winter(February 2012) (Fig. 2). For all sampling dates, at marine station Sk59, the average salinity was 32.2 ± 1.0, while coastal station Sk 1had an average salinity of 16.3 ± 5.7. The lowest salinity at thisstation (7.8) was detected in September 2011, and the highestsalinity at this station (24.7) was detected in June 2012.
3.2. Suspended particulate matter, oxygen and inorganic nutrients
Values for SPM ranged from 8 to 167 mg L�1, but neither sea-sonal nor spatial (along the transect) differences could be detected.
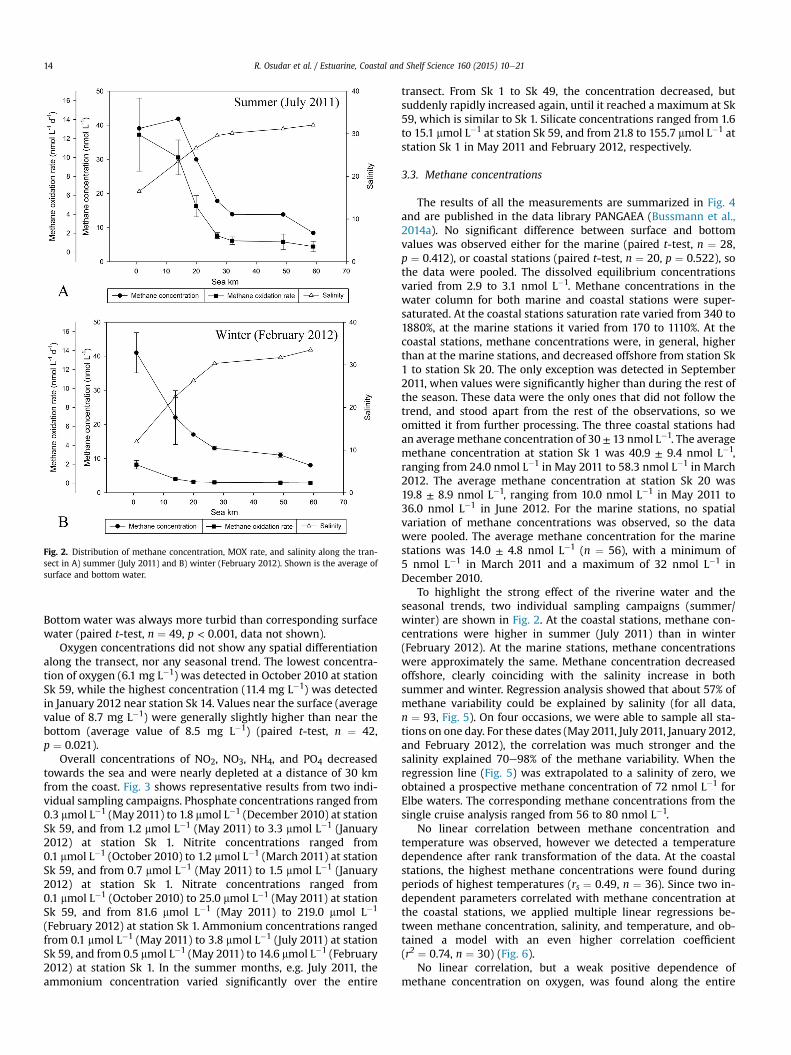
Fig. 2. Distribution of methane concentration, MOX rate, and salinity along the tran-sect in A) summer (July 2011) and B) winter (February 2012). Shown is the average ofsurface and bottom water.
R. Osudar et al. / Estuarine, Coastal and Shelf Science 160 (2015) 10e2114
Bottom water was always more turbid than corresponding surfacewater (paired t-test, n ¼ 49, p < 0.001, data not shown).
Oxygen concentrations did not show any spatial differentiationalong the transect, nor any seasonal trend. The lowest concentra-tion of oxygen (6.1 mg L�1) was detected in October 2010 at stationSk 59, while the highest concentration (11.4 mg L�1) was detectedin January 2012 near station Sk 14. Values near the surface (averagevalue of 8.7 mg L�1) were generally slightly higher than near thebottom (average value of 8.5 mg L�1) (paired t-test, n ¼ 42,p ¼ 0.021).
Overall concentrations of NO2, NO3, NH4, and PO4 decreasedtowards the sea and were nearly depleted at a distance of 30 kmfrom the coast. Fig. 3 shows representative results from two indi-vidual sampling campaigns. Phosphate concentrations ranged from0.3 mmol L�1 (May 2011) to 1.8 mmol L�1 (December 2010) at stationSk 59, and from 1.2 mmol L�1 (May 2011) to 3.3 mmol L�1 (January2012) at station Sk 1. Nitrite concentrations ranged from0.1 mmol L�1 (October 2010) to 1.2 mmol L�1 (March 2011) at stationSk 59, and from 0.7 mmol L�1 (May 2011) to 1.5 mmol L�1 (January2012) at station Sk 1. Nitrate concentrations ranged from0.1 mmol L�1 (October 2010) to 25.0 mmol L�1 (May 2011) at stationSk 59, and from 81.6 mmol L�1 (May 2011) to 219.0 mmol L�1
(February 2012) at station Sk 1. Ammonium concentrations rangedfrom 0.1 mmol L�1 (May 2011) to 3.8 mmol L�1 (July 2011) at stationSk 59, and from 0.5 mmol L�1 (May 2011) to 14.6 mmol L�1 (February2012) at station Sk 1. In the summer months, e.g. July 2011, theammonium concentration varied significantly over the entire
transect. From Sk 1 to Sk 49, the concentration decreased, butsuddenly rapidly increased again, until it reached a maximum at Sk59, which is similar to Sk 1. Silicate concentrations ranged from 1.6to 15.1 mmol L�1 at station Sk 59, and from 21.8 to 155.7 mmol L�1 atstation Sk 1 in May 2011 and February 2012, respectively.
3.3. Methane concentrations
The results of all the measurements are summarized in Fig. 4and are published in the data library PANGAEA (Bussmann et al.,2014a). No significant difference between surface and bottomvalues was observed either for the marine (paired t-test, n ¼ 28,p ¼ 0.412), or coastal stations (paired t-test, n ¼ 20, p ¼ 0.522), sothe data were pooled. The dissolved equilibrium concentrationsvaried from 2.9 to 3.1 nmol L�1. Methane concentrations in thewater column for both marine and coastal stations were super-saturated. At the coastal stations saturation rate varied from 340 to1880%, at the marine stations it varied from 170 to 1110%. At thecoastal stations, methane concentrations were, in general, higherthan at the marine stations, and decreased offshore from station Sk1 to station Sk 20. The only exception was detected in September2011, when values were significantly higher than during the rest ofthe season. These data were the only ones that did not follow thetrend, and stood apart from the rest of the observations, so weomitted it from further processing. The three coastal stations hadan averagemethane concentration of 30 ± 13 nmol L�1. The averagemethane concentration at station Sk 1 was 40.9 ± 9.4 nmol L�1,ranging from 24.0 nmol L�1 in May 2011 to 58.3 nmol L�1 in March2012. The average methane concentration at station Sk 20 was19.8 ± 8.9 nmol L�1, ranging from 10.0 nmol L�1 in May 2011 to36.0 nmol L�1 in June 2012. For the marine stations, no spatialvariation of methane concentrations was observed, so the datawere pooled. The average methane concentration for the marinestations was 14.0 ± 4.8 nmol L�1 (n ¼ 56), with a minimum of5 nmol L�1 in March 2011 and a maximum of 32 nmol L�1 inDecember 2010.
To highlight the strong effect of the riverine water and theseasonal trends, two individual sampling campaigns (summer/winter) are shown in Fig. 2. At the coastal stations, methane con-centrations were higher in summer (July 2011) than in winter(February 2012). At the marine stations, methane concentrationswere approximately the same. Methane concentration decreasedoffshore, clearly coinciding with the salinity increase in bothsummer and winter. Regression analysis showed that about 57% ofmethane variability could be explained by salinity (for all data,n ¼ 93, Fig. 5). On four occasions, we were able to sample all sta-tions on one day. For these dates (May 2011, July 2011, January 2012,and February 2012), the correlation was much stronger and thesalinity explained 70e98% of the methane variability. When theregression line (Fig. 5) was extrapolated to a salinity of zero, weobtained a prospective methane concentration of 72 nmol L�1 forElbe waters. The corresponding methane concentrations from thesingle cruise analysis ranged from 56 to 80 nmol L�1.
No linear correlation between methane concentration andtemperature was observed, however we detected a temperaturedependence after rank transformation of the data. At the coastalstations, the highest methane concentrations were found duringperiods of highest temperatures (rs ¼ 0.49, n ¼ 36). Since two in-dependent parameters correlated with methane concentration atthe coastal stations, we applied multiple linear regressions be-tween methane concentration, salinity, and temperature, and ob-tained a model with an even higher correlation coefficient(r2 ¼ 0.74, n ¼ 30) (Fig. 6).
No linear correlation, but a weak positive dependence ofmethane concentration on oxygen, was found along the entire

Fig. 3. Distribution of inorganic nutrients in A) summer (July 2011) and B) winter (February 2012). Shown are only data from surface water.
R. Osudar et al. / Estuarine, Coastal and Shelf Science 160 (2015) 10e21 15
transect (rs ¼ 0.37, n ¼ 80). We also found a strong correlationbetween concentrations of methane and inorganic nutrients,except NO2 (rs varied from 0.43 to 0.66 depending on the inorganicnutrient). However, we assumed that this was mainly due to theinput of nutrient-rich waters from the mouth of the Elbe, as salinityand inorganic nutrient concentrationswere also strongly correlated(r2 for different mineral nutrients varied from 0.46 to 0.87).
No linear correlation between SPM andmethane concentrationswas found. Moderate negative dependencewas indicated after ranktransformation of the marine data. Thus, we can state that at themarine stations, the highest methane concentrations were found atthe lowest SPM values (rs ¼ �0.45, n ¼ 54).
3.4. Methane oxidation rate
The results of all the measurements are summarized in Fig. 7and are published in the data library PANGAEA (Bussmann et al.,2014a). No significant differences between surface and bottomvalues were observed either for the coastal stations (paired t-test,n ¼ 18, p ¼ 0.154), or for the marine stations (paired t-test, n ¼ 28,p ¼ 0.290), so the data were pooled. At the coastal stations, MOXrates were in general higher than at the marine stations, anddecreased offshore from station Sk 1 to station Sk 20. The coastal
stations had an average MOX rate of 2.6 ± 2.7 nmol L�1d�1. Theaverage MOX rate at station Sk 1 (nearest the coast) was5.26 ± 4.72 nmol L�1d�1, ranging from 0.78 nmol L�1d�1 in June2012 to 16.5 nmol L�1d�1 in July 2011. The average MOX rate atstation Sk 20 was 0.97 ± 1.85 nmol L�1d�1, ranging from0.04 nmol L�1d�1 in May 2011 to 5.81 nmol L�1d�1 in July 2011. Theaverage MOX rate for the marine stations was0.417 ± 0.529 nmol L�1d�1, with a minimum of 0.009 nmol L�1d�1
in February 2012 and a maximum of 1.96 nmol L�1d�1 in July 2011.For the turnover time no significant differences between surface
and bottom values were observed either for coastal stations (pairedt-test, n ¼ 18, p ¼ 0.182), or marine stations (paired t-test, n ¼ 28,p ¼ 0.136). Thus, the data were pooled. The coastal stations had anaverage turnover time of 64 ± 75 days. The average turnover time atstation Sk 1 was 16 ± 15 days, with a minimum of 3 days in July2011 and a maximum of 56 days in June 2012. The average turnovertime at station Sk 20 was 120 ± 92 days, with a minimum of 5 daysin July 2011 and a maximum of 293 days in October 2010. Theaverage turnover time for the marine stations was 196 days, with aminimum of 9 days in July 2011 and a maximum of 1049 days inFebruary 2012. To highlight the strong effect of the riverine waterand the seasonal trends, two individual sampling campaigns(summer/winter) are shown in Fig. 2. MOX rates along the transect

Fig. 4. Methane concentration along the transect during the whole period of investi-gation (surface and bottom).
Fig. 5. Linear regression between salinity and methane concentration. Empty circlesindicate outliers, which were excluded from regression analysis (measurements fromSeptember 2011).
Fig. 6. Methane distribution at the coastal stations according to salinity and temper-ature. Multiple linear regression: CH4 ¼ 55.798 þ (1.697*Temperature) e
(1.709*Salinity); r2 ¼ 0.737.
Fig. 7. MOX rates along the transect during the whole period of investigation (surfaceand bottom).
R. Osudar et al. / Estuarine, Coastal and Shelf Science 160 (2015) 10e2116
generally followed a trend similar to the methane concentrationsand salinity. However, MOX rates were significantly lower inwinter(February 2012) than in summer (July 2011), especially at thecoastal stations.
Because of great variability in the turnover times andMOX rates,linear regression analysis did not reveal clear results. Therefore, werank transformed the data and performed Spearman rank ordercorrelation tests (Table 1). The tests showed that the variability ofthe turnover time was influenced by methane concentration(rs ¼ �0.60, n ¼ 94) in a negative way, i.e. highest turnover times(the slowest rates) were found at lowest methane concentrations.Salinity influenced the variability of the turnover time in a positiveway (rs ¼ 0.56, n ¼ 91), especially in the coastal area (rs ¼ 0.64,n ¼ 37), i.e. highest turnover times were found at highest salinities.Turnover time was moderately correlated in a negative way with
temperature (rs ¼ �0.46, n ¼ 86), i.e. highest turnover times werefound at lowest temperatures. Thus, we found that turnover timewas correlated to a greater or lesser extent with three factors:methane concentration, salinity, and temperature.
Because of the dilution of the methane-rich freshwater, wemostly found low methane concentrations at high salinities. Toexclude this interaction, and to check for the ‘real’ influence ofsalinity on MOX rate and turnover time, we grouped the methaneconcentrations, according to their frequency distribution, to lowmethane concentrations (<15 nmol L�1, n ¼ 37), medium methaneconcentrations (15e30 nmol L�1, n ¼ 41), and high methane con-centrations (>30 nmol L�1, n ¼ 21, Table 1). Only when methane

Table 1Spearman rank correlation of the turnover time and MOX rates with hydrographic parameters.
Dependent parameter Independent parameter Spearman rank order correlation Comments
Turnover time Methane concentration �0.60Salinity þ0.56 Due to co-correlation of salinity with methane, methane
data were grouped, then only with methane >30 nmol L�1,salinity influences turnover time with rs ¼ 0.39
Temperature �0.46MOX rate Methane Concentration n. d.
Salinity �0.66 Due to co-correlation of salinity with methane, methanedata were grouped, than only with methane >30 nmol L�1,salinity influences MOX with rs ¼ - 0.34
Temperature þ0.43
n.d. e not determined.
R. Osudar et al. / Estuarine, Coastal and Shelf Science 160 (2015) 10e21 17
concentrations were high (>30 nmol L�1), MOX rate and theturnover time (rank transformed data) were correlated withsalinity (rs ¼ 0.39 and 0.34, respectively). At lower methane con-centrations, these parameters were independent of salinity. Thus at‘high’methane concentrations, salinity had a negative effect on theturnover time and MOX rate. At lower methane concentrations, themost important factor for the turnover time was simply themethane concentration.
The same tendency was observed for MOX rates (Table 1), whichwere negatively correlated with salinity (rs ¼ �0.66, n ¼ 92), butpositively correlated with methane concentration (rs ¼ 0.78,n ¼ 94) and temperature (rs ¼ 0.43, n ¼ 87), i.e. highest MOX rateswere detected at lowest salinities and highest methane concen-trations and temperatures. However, the correlation between MOXrate and methane concentration should be viewed with caution,because MOX rate calculations are dependent on methaneconcentrations.
MOX rates were correlated with phosphate concentrations(rs ¼ 0.54, n ¼ 42), but phosphate was strongly correlated withsalinity. Therefore, to circumvent the co-correlation of phosphateand salinity, we grouped the salinity data into meso-, poly-, andeuhaline (5e18, 18e30, and >30; (Caspers, 1959). For each of thesesalinity groups, no influence of phosphate on turnover time orMOXrate was observed (rank transformed data). No influence of theother inorganic nutrients, SPM, or oxygen onMOX rates or turnovertimes could be detected by statistical analyses.
4. Discussion
Methane distribution is defined as the balance betweenmethane sources and sinks. Estuaries are one of the main sources ofmethane in the North Sea. They, in turn, are supplied with methaneby riverine input, tidal flats, and marshes (Rehder et al., 1998;Middelburg et al., 2002; Abril and Borges, 2005; Grunwald et al.,2009). The main methane sinks are represented by the dilution ofmethane-rich waters with methane-depleted waters, outgassing,and bacterial methane oxidation (Scranton and McShane, 1991).
Methane concentrations were monitored over two years along atransect from the Elbe estuary towards the German Bight. Thehighest methane concentrations were detected near the coast (thefirst coastal station, Sk 1). Methane concentrations for the next20 km offshore, decreased until they reached a plateau, and did notsignificantly vary any further (20e60 km). Therefore, we canconclude that in terms of methane distribution, the direct impactzone of the Elbe riverine waters is in the range of 20 km from theriver mouth in Cuxhaven. The coastal stations (1e20 km from thecoast) had an average methane concentration of 30 ± 13 nmol L�1,comparable with the measurements of Rehder et al. (1998), whichwere in the range of 10e40 nmol L�1. Methane concentrations atthe marine stations were on average 14 ± 6 nmol L�1. These
concentrations are slightly higher than those reported by Rehderet al. (1998), but remarkably lower than values reported byGrunwald et al. (2009), which were around 200 nmol L�1 nearHelgoland. In general, methane concentrations in the Elbe estuaryand in the German Bight are comparable with those measured inother estuaries (de Angelis and Scranton, 1993; Abril and Iversen,2002; Middelburg et al., 2002; Silvennoinen et al., 2008; Zhanget al., 2008; Grunwald et al., 2009) and open ocean locations(Kelley, 2003; Mau et al., 2013) (Table 2).
For all stations and at all times the water was supersaturatedwith methane (170e1880 %), thus the German Bight acts as amethane source to the atmosphere both at the coastal and at theopen sea part.
As was done in previous studies, we extrapolated methaneconcentration at zero salinity using a linear correlation model. InMarch and June 2012, we had the opportunity to also sample waterfrom the Elbe River itself. These data are published in the PANGAEAdata base (Bussmann et al., 2014b). Thus, we were able to examinethe actual riverine input more closely (Fig. 8). At salinities of 10e15,methane concentrations were 65 ± 5 nmol L�1 (Bussmann et al.,2014b), which is very close to our interpolated value of72 nmol L�1. The corresponding stations EC-719 and EC-724 areclose to the port of Cuxhaven. In contrast, the real riverine methaneconcentrations with salinities <5 (river stations EC-679, 699 and709) were much lower (26 ± 8 nmol L�1).
This shows that the Elbe is not the main methane source in theestuary, and that the mixing model can only be applied at salinities10e15. Thus, application of extrapolating approaches as proposedby Rehder et al. (1998) is not possible.
Middelburg et al. (2002) measured a significantly highermethane concentration of 111 nmol L�1 at zero salinity in 1997.However, as thewater quality in the Elbe has improved over the last20 years (Amann et al., 2012), the methane concentration may havedecreased. Besides, Middelburg et al. (2002) made measurementsduring only one sampling campaign in April, and as we have shown,methane concentrations are subject to significant temporal varia-tions (this will be discussed later).
Explanations for the methane increase near Cuxhaven are: a)increased methane production in the underlying sediment, b)lateral input. Additionally, we would expect decreased methaneoxidation in the estuary in comparison with the freshwater end-member (discussed later). Methane is mostly produced in anoxicsediment zones, from where it can diffuse into the overlying watercolumn. Our comparison of bottom and surface waters gave noindication of strong methane production in the sediments. Thesediment in this area is supposed to be very coarse due to thestrong currents, and even though methanogenesis also occurs inoxygenated, organic-rich sediments just several cm under thesediments surface (Deborde et al., 2010), we did not observe astrong direct sedimentary input. This is in agreement with the

Table 2Methane concentrations and MOX rates, measured in different estuaries and in the open ocean.
Location Methane concentrations (nmol L�1) MOX rates (nmol L�1d�1) Reference
EstuariesElbe (German Bight) 3e60 0.01e17 This studyElbe 4e111 n.m. (Middelburg et al., 2002)North Sea around Helgoland 200 n.m. (Grunwald et al., 2009)Southern Bight (North Sea) 3e22 <<1.3 (Scranton and McShane, 1991)Ems 91e51 n.m. (Middelburg et al., 2002)Thames 5e273 n.m. (Middelburg et al., 2002)Rhine 4.1e1437 n.m. (Middelburg et al., 2002)Scheldt 20e485 n.m. (Middelburg et al., 2002)Loire 16e671 n.m. (Middelburg et al., 2002)Gironde 4e559 n.m. (Middelburg et al., 2002)Douro 15e128 n.m. (Middelburg et al., 2002)Sado 37e40 n.m. (Middelburg et al., 2002)Hudson river estuary 48e858 0.1e68 (de Angelis and Scranton, 1993)Randers Fjord, Denmark 28e420 <0.2e15.2 (Abril and Iversen, 2002)Bay of Temmesjoki River (Baltic Sea) 62e588 n.m. (Silvennoinen et al., 2008)Estuary of the Yangtze River 3e89 n.m. (Zhang et al., 2008)
Open oceanGulf of Mexico 10e343 0e57 (Kelley, 2003)Cape Lookout Bight 18e246 0 (Kelley, 2003)Arctic fjord Storfjorden 5e80 0e3 (Mau et al., 2013)
n.m. e not measured.
R. Osudar et al. / Estuarine, Coastal and Shelf Science 160 (2015) 10e2118
observation made by Scranton and McShane (1991), who statedthat sandy sediments of the North Sea are not a significant methanesource.
Tidal flats in the North Sea are known to be active sites ofmineralization of organic material, which eventually leads tomethane accumulation. Due to advective flow in the tidal areas,which is of special importance in permeable sandy sediments, porewaters enriched in re-mineralized nutrients and methane areactively released from sediments into the overlying water column(Beck and Brumsack, 2012; Segarra et al., 2013). As Cuxhaven issurrounded by tidal flats, we assume a strong lateral input ofmethane from these tidal flats.
Fig. 8. Methane concentrations with corresponding salinities. Circles indicate riverstations (Bussmann et al., 2014b), and squares indicate coastal stations from this study,both for March and June 2012. The triangles represent the values from all marinestations from this study.
Other potential methane sources are inputs from other riversdraining into the estuary, and sewage discharge. The Oste, a smallriver which flows into the North Sea near Cuxhaven, has low watervelocities and therefore could have much higher methane con-centrations. However, no data were available for this river. Awastewater treatment plant in Cuxhaven, as well as industrial ac-tivity, could lead to additional input of organics whichmight triggerin situ methane production both in sediments and in the watercolumn. Input of inorganic nutrients was also detectable in thehydrochemical data; the phosphate and nitrate concentrationswere especially high at the nearby station. We can thus concludethat the Elbe River gets enriched with methane at its mouth due toadditional methane sources, whereby methanogenesis might alsoplay an important role. Furthermore, water in the estuary getsdiluted with methane-depleted water from the North Sea. The lastsection of the transect represents North Sea water almost exclu-sively, and methane concentrations there do not vary significantly.
We expected a seasonality for our methane concentration data,with higher methane concentrations in summer and low ones inwinter. However, we could not find any clear seasonal pattern,which may be also due to the too large sampling intervals. But asseasonality is also reflected in changing temperatures, we couldfind a correlation with water temperature. The effect of tempera-ture on methane production has been shown for many aquaticsystems (Pulliam, 1993; Bange et al., 1994; Duc et al., 2010; Loftonet al., 2014), including river and estuary systems (Fedorov et al.,2003). Enhanced methane production in the warmer months isknown for various river and estuary systems, such as the Don River,with the Taganrog Bay in the Sea of Azov, Russia (Fedorov et al.,2003), and the Baltic Sea (Bange et al., 1994). Clear seasonalitywith increased methane in the summer and autumn was alsoshown for the Rhine estuary (Middelburg et al., 2002). However, inthe Scheldt and Gironde estuaries, seasonality was not pronounced(Middelburg et al., 2002), nor in Humber estuary, where methaneconcentrations were lowest in the summer (Upstill-Goddard et al.,2000). In our investigation, moderate correlation of methane con-centration with temperature was shown, but only for the coastalstations (rs ¼ 0.49). Absence of the correlation at the marine sta-tions can be explained by insignificant methane production andrather stable temperature regimes in the open sea and sediments.

R. Osudar et al. / Estuarine, Coastal and Shelf Science 160 (2015) 10e21 19
Further on, we have to consider that a seasonality of methaneconcentrations could also originate from variation in the Elbewater discharge. As discussed before, methane distribution alongthe transect was correlated with salinity. Finally, a multiple linearregression combining salinity and temperature as parametersaffecting the methane concentration explained 74% of themethane distribution. Water discharge measured at Neu Darchaufrom September 2010 to June 2012 ranged from 300 to3500 m3 s�1 (River Basin Community Elbe, http://www.fgg-elbe.de). Indeed, during the entire period of our sampling campaignat station Sk 1, the salinity varied widely from 8 to 25. However,we did not manage to find a strong correlation between waterdischarge and methane variations. This can be partly explained bythe remoteness between Neu Darchau and station Sk1. Addition-ally, tides are likely to also be a significant factor affecting short-term methane distribution, as shown in previous studies(Grunwald et al., 2009). However, in our investigation, we did nothave enough information to correlate methane concentration withthe tidal surge.
MOX rates, as well as turnover times, were calculated to assessthe role of methane oxidation as a methane sink, and to define itsrole in methane distribution. The highest MOX rates were found atthe coastal stations (2.6 ± 2.7 nmol L�1d�1), and the lowest MOXrates were found at the marine stations (0.4 ± 0.5 nmol L�1d�1).Despite the importance of methane oxidation processes in thewater column, very few measurements have been made in estu-aries. MOX rates in the Hudson estuary (in the salt intrusion area)varied from 0.1 to 68 nmol L�1d�1 (de Angelis and Scranton, 1993).In the Randers fjord MOX rates reached 15 nmol L�1d�1 (Abril andIversen, 2002). Summarized data on aerobic methane oxidation inocean waters from different locations show that MOX rates aregenerally in the range of 0.001e10 nmol L�1d�1 (Kelley, 2003; Mauet al., 2013). MOX rates measured at different estuaries and in theopen ocean are summarized in Table 2. Thus, our measurementsalong the entire transect are in the same range of MOX rates inother aquatic environments.
For the southeast coast of the North Sea a flushing time of 11days and for the central North Sea of 40 days is given by Ilyina et al.(2006). Our average turnover times for the coastal stations andmarine stations were 64 days and 196 days, respectively. Thus, thewater masses are faster exported than MOX could consume themethane. Scranton and McShane (1991), who studied methanedistribution in the Southern Bight (North Sea) also came to aconclusion that bacterial methane oxidation was not a significantmethane sink. However, a more detailed modelling would benecessary to adequately address the question if methane oxidationis a significant methane sink in the Elbe estuary and adjacentGerman Bight.
Microbial activities are often controlled by substrate concen-tration, following the enzyme kinetics as described by MichaelisMenten. In our case this means, that with increasing methaneconcentration the MOX rate also increases, until (enzyme) satura-tion is reached and no further increase of MOX can be observed. Todescribe this phenomenon and make it comparable betweendifferent studies, the parameter Vmax and Km are used to describethe maximal velocity and the half saturation concentration(Lehninger, 1985). Unfortunately, to our knowledge there are nokinetic studies on marine methanotrophs, which usually endure atlow methane concentrations. Recent studies from arctic lakesreveal Km from 4 to 10 mM (Lofton et al., 2014) and the review fromHanson and Hanson (1996) gives a Km of 1 mM. In a study on thekinetics of cultured methanotrophic strains under low methaneconcentration (10e100 ppm), it was shown that these strains,which have a Kmwithin the above described range, are able to growunder these limiting conditions (Knief and Dunfield, 2005). In our
study, natural methane concentrations ranged from 3 to58 nmol L�1, which are concentrations well below half saturation.Thus we assume that the methanotrophic population of the NorthSea is strongly limited bymethane concentration and an increase inmethane concentration would lead to increased activity. With ourdata we did not calculate such a relation between methane con-centration and MOX rate due to methodological restraints (theMOX rate is calculated by multiplying the ratio of consumed tracerwith the methane concentration). But even when setting theserestraints apart only a weak correlation was observed.
The effect of salt as a chemical agent inhibiting methaneoxidation in freshwater has been shown before (de Angelis andScranton, 1993). The changing salinity likely causes osmotic stressfor freshwater methanotrophic bacteria (Hanson and Hanson,1996). At the same time, most studies report that microbialmethane oxidation is already significantly reduced at salinities <10(Abril and Borges, 2005), whereas in our investigation, high MOXrates (17 nmol L�1 d�1) were detected even at a salinity of 17. Ourresults show that salinity, as such, only has a (negative) effect whenmethane concentrations are >30 nmol L�1. Thus, we conclude that,at the coastal stations, the negative effect of osmotic stress iscounteracted by the positive effect of high methane concentrationsin the estuary. An explanationmight be that microorganisms whichare frequently exposed to changing salinity (like the Elbe estuary,due to the significant influence of tides) are adapted to changingsalinities. However, it remains unclear as to what extent freshwateror marine methanotrophic bacteria participate in methaneoxidation.
Our results show that temperature also has a moderate effect onmethane oxidation. Thus, the lowest turnover times and highestMOX rates were detected during the highest temperatures. This isin contrast with observations made by Lofton et al. (2014), whostates that temperature can influence methane oxidation only insubstrate-saturated environment.
Another factor which can stimulate methane oxidation isturbidity or SPM. It was mentioned before that SPM can serve as avehicle for methanogens, and the same principle can be applied tomethane-oxidizing microorganisms (Middelburg et al., 2002; Abrilet al., 2007). In vitro experiments showed that removal of particlessmaller than 11 mm can decrease the MOX rate by 50% (de Angelisand Scranton, 1993). In our study, we did not detect any correlationof turnover times/MOX rates with SPM. The easiest explanationswould be that stronger factors (such as methane concentration andtemperature) simply suppressed the influence of SPM.
Oxygen is another important factor for methane oxidation.Summarized data on oxygen half-saturation constants for aerobicmethane oxidation (the concentration at which the growth rate ofbacteria reaches the half-maximum) show a wide range, from 0.14to 58 mM (Gu�erin and Abril, 2007). Oxygen concentrationsmeasured along the transect in our study were within this range,thus oxygen was never a limiting factor, and no correlation withmethane oxidation was detected.
Methanotrophs are regarded as slow growing bacteria, andhence tend to lose out on nutrients to faster growing heterotrophs.Besides, some mineral nutrients, like ammonium, are known toinhibit methane oxidation (Alam and Jia, 2012) while others, likephosphate, increase MOX rates (Boiesen et al., 1993). Also, theavailability of nitrogen can become a limiting factor for the growthof methanotrophs in nitrogen-limited environments (Bodelieret al., 2000). In our study, large quantities of inorganic nutrients,were brought to the German Bight from the mouth of the Elbe, thusproviding all the inorganic nutrients needed for intensive methaneoxidation. However, we did not detect any correlation betweenMOX rates and any mineral nutrients at the marine stations. Due tolow MOX rates at the marine stations, the supply of inorganic
R. Osudar et al. / Estuarine, Coastal and Shelf Science 160 (2015) 10e2120
nutrients was still sufficient, and thus did not influence themethanotrophy.
5. Conclusion
We observed a wide variation of methane concentration in thewater column along a 60 km transect from Cuxhaven to Helgoland.Highest concentrations were detected near the coast, where thewater is enriched with methane by river water and lateral sources.Over the next 20 km, in the direction of Helgoland, we observeddecrease in methane concentration due to dilution with methane-depleted sea water from the German Bight. The last 40 km of thetransect represents seawater almost exclusively, with a consistentlylow methane concentration. We also discovered that most of themethane in the Elbe estuary does not come from the Elbe Riveritself, as was thought before, but from an area near Cuxhaven. Thus,the conservative mixing model, which describes methane distri-bution as a simple dilution of methane-rich freshwater from theriver withmarinewater, is only applicable at salinities >10. Possiblemethane sources near Cuxhaven are input from small rivers, andmethane rich tidal flats.
Though we did not find any clear seasonal pattern, samplingthrough the year also enabled us to discover that the methanedistribution in the Elbe estuary was subject to significant temporalchanges. We assume that these changes were controlled by theinteraction of Elbe water discharge and methane concentrations inthe mouth of the Elbe, which were higher in the warmer seasons.More information on the tidal surge, as well as the current regimewould be useful for a better interpretation of the methane varia-tions. However in the present study we could show that salinityexplained about 57% of the methane variability.
Methane oxidation measurements were made in this area forthe first time during at least the last 10 years. We discovered thatmethane oxidation was likely not a significant methane sink inmost of the Elbe estuary. However, more data on water residencetime is needed to make definite conclusions. The main factorsaffecting methanotrophic activity were methane concentration,salinity, and temperature. However, further kinetic studies wouldbe useful to gain more insight into the influence of methane con-centrations on MOX.
Acknowledgements
Many thanks are given to the scientific parties and crews of theresearch vessels Prandtl and Uth€orn. We thank K.W. Klings forexcellent technical assistance and the group of Prof. Wiltshire (K.Carstens) for providing hydrographic and chemical data. The workof A.M. was funded by the DAAD, by the Grant Agency of the CzechRepublic (Grant no. 13-00243S) and a grant of the Faculty of Sci-ence, University of South Bohemia (GAJU 04-145/2013/P).
References
Abril, Commariew, Guerin, 2007. Enhanced methane oxidation in an estuarineturbidity maximum. Limnol. Oceanogr. 52, 6.
Abril, G., Borges, A., 2005. Carbon dioxide and methane emissions from estuaries.In: Tremblay, A., Varfalvy, L., Roehm, C., Garneau, M. (Eds.), Greenhouse GasEmissions d Fluxes and Processes. Springer, Berlin Heidelberg, pp. 187e207.
Abril, G., Iversen, N., 2002. Methane dynamics in a shallow non-tidal estuary(Randers Fjord, Denmark). Mar. Ecol. Prog. Ser. 230, 171e181.
Alam, M.S., Jia, Z., 2012. Inhibition of methane oxidation by nitrogenous fertilizersin a paddy soil. Front. Microbiol. 3.
Amann, T., Weiss, A., Hartmann, J., 2012. Carbon dynamics in the freshwater part ofthe Elbe estuary, Germany: implications of improving water quality. Estuar.Coast. Shelf Sci. 107, 112e121.
Bange, H., Bartell, U., Rapsomanikis, S., Andreae, M.O., 1994. Methane in the Balticand North Seas and a reassessment of the marine emissions of methane. Glob.Biogeochem. Cycles 86, 465e480.
Bange, H.W., 2006. Nitrous oxide and methane in European coastal waters. Estuar.Coast. Shelf Sci. 70, 361e374.
Bates, T.S., Kelly, K.C., Johnson, J.E., Gammon, R.H., 1996. A reevaluation of the openocean source of methane to the atmosphere. J. Geophys. Res. Atmos. 101,6953e6961 (1984e2012).
Beck, M., Brumsack, H.-J., 2012. Biogeochemical cycles in sediment and water col-umn of the Wadden Sea: the example Spiekeroog Island in a regional context.Ocean Coast. Manag. 68, 102e113.
Becker, G., Dick, S., Dippner, J., 1992. Hydrography of the german bight. Mar. Ecol.Prog. Ser. MESEDT 91.
Bianchi, M., Marty, D., Teyssie, J.-L., Fowler, S., 1992. Strictly aerobic and anaerobicbacteria associated with sinking particulate matter and zooplankton fecal pel-lets. Mar. Ecology-Progress Ser. 88, 55e60.
Bodelier, P.L.E., Roslev, P., Henckel, T., Frenzel, P., 2000. Stimulation by ammonium-based fertilizers of methane oxidation in soil around rice roots. Nature 403,421e424.
Boiesen, A., Arvin, E., Broholm, K., 1993. Effect of mineral nutrients on the kinetics ofmethane utilization by methanotrophs. Biodegradation 4, 163e170.
Bussmann, I., 2013. Distribution of methane in the Lena Delta and Buor-Khaya Bay,Russia. Biogeosciences 10, 4641e4652.
Bussmann, I., Matousu, A., Osudar, R., Mau, S., 2015. Assessment of the radio 3H-CH4 tracer technique to measure aerobic methane oxidation in the water col-umn. Limnol. Oceanogr. Methods (in press).
Bussmann, I., Osudar, R., Matousu, A., 2014a. Methane Concentrations and MethaneOxidationRates fromOct 2010-Jun2012onaTransect fromCuxhaven toHelgoland,North Sea, Germany. Alfred Wegener Institute for Polar and Marine Research -Biological Institute Helgoland. http://dx.doi.org/10.1594/PANGAEA.833798.
Bussmann, I., Osudar, R., Matousu, A., 2014b. Methane Concentrations and MethaneOxidation Rates from Oct 2010-March 2012 in the Elbe Estuary, from Hamburgto Cuxhaven, Germany. Alfred Wegener Institute for Polar and Marine Research- Biological Institute Helgoland. http://dx.doi.org/10.1594/PANGAEA.833923.
Caspers, H., 1959. Vorschl€age Einer Brackwassernomenklatur. Int. Rev. gesamtenHydrobiol. Hydrogr. 44, 313e315.
Commission, O., 2000. Quality Status Report 2000, Region IIeGreater North Sea.OSPAR Commission, London, p. 136.
Conrad, R., 2009. The global methane cycle: recent advances in understanding themicrobial processes involved. Environ. Microbiol. Reports 1, 285e292.
Czitrom, S.P.R., Bud�eus, G., Krause, G., 1988. A tidal mixing front in an area influ-enced by land runoff. Cont. Shelf Res. 8, 225e237.
De Angelis, M.A., Lee, C., 1994. Methane production during zooplankton grazing onmarine phytoplankton. Limnol. Oceanogr. 39, 1298e1308.
de Angelis, M.A., Scranton, M.I., 1993. Fate of methane in the Hudson River andestuary. Glob. Biogeochem. cycles 7, 509e523.
Deborde, J., Anschutz, P., Gu�erin, F., Poirier, D., Marty, D., Boucher, G., Thouzeau, G.,Canton, M., Abril, G., 2010. Methane sources, sinks and fluxes in a temperatetidal Lagoon: the Arcachon lagoon (SW France). Estuar. Coast. Shelf Sci. 89,256e266.
Duc, N., Crill, P., Bastviken, D., 2010. Implications of temperature and sedimentcharacteristics on methane formation and oxidation in lake sediments.Biogeochemistry 100, 185e196.
Fedorov, Y.A., Khoroshevskaya, V., Tambieva, N., 2003. Variations in methane con-centrations in the water of the Don River and Taganrog Bay under the effect ofnatural factors. Water Resour. 30, 81e85.
Grasshoff, K., Ehrhardt, M., Kremling, K., 1983. Methods of Seawater Analyses, vol.511. Verlag Chemie, Weinheim, Germany, pp. 342e355.
Grunwald, M., Dellwig, O., Beck, M., Dippner, J.W., Freund, J.A., Kohlmeier, C.,Schnetger, B., Brumsack, H.-J., 2009. Methane in the southern North Sea:sources, spatial distribution and budgets. Estuar. Coast. Shelf Sci. 81, 445e456.
Gu�erin, F., Abril, G., 2007. Significance of pelagic aerobic methane oxidation in themethane and carbon budget of a tropical reservoir. J. Geophys. Res. Bio-geosciences (2005e2012) 112.
Hanson, R.S., Hanson, T.E., 1996. Methanotrophic bacteria. Microbiol. Rev. 60,439e471.
Heintz, M., Mau, S., Valentine, D., 2012. Physical control on methanotrophic po-tential in waters of the Santa Monica Basin, Southern California. Limnol. Oce-anogr. 57, 420e432.
Hovland, M., Judd, A.G., Burke Jr., R., 1993. The global flux of methane from shallowsubmarine sediments. Chemosphere 26, 559e578.
ICES, 1988. Report of the Study Group on the Effects of Bottom Trawling. Interna-tional Council for the Exploration of the Sea.
Ilyina, T., Pohlmann, T., Lammel, G., Sündermann, J., 2006. A fate and transportocean model for persistent organic pollutants and its application to the NorthSea. J. Mar. Syst. 63, 1e19.
Karl, D.M., Tilbrook, B.D., 1994. Production and transport of methane in oceanicparticulate organic matter. Nature 368, 732e734.
Kelley, C., 2003. Methane oxidation potential in the water column of two diversecoastal marine sites. Biogeochemistry 65, 105e120.
Kirschke, S., Bousquet, P., Ciais, P., Saunois, M., Canadell, J.G., Dlugokencky, E.J.,Bergamaschi, P., Bergmann, D., Blake, D.R., Bruhwiler, L., 2013. Three decades ofglobal methane sources and sinks. Nat. Geosci. 6, 813e823.
Knief, C., Dunfield, P.F., 2005. Response and adaptation of different methanotrophicbacteria to low methane mixing ratios. Environ. Microbiol. 7, 1307e1317.
Koch, K., Knoblauch, C., Wagner, D., 2009. Methanogenic community compositionand anaerobic carbon turnover in submarine permafrost sediments of the Si-berian Laptev Sea. Environ. Microbiol. 11, 657e668.
R. Osudar et al. / Estuarine, Coastal and Shelf Science 160 (2015) 10e21 21
Lehninger, A., 1985. Principles of Biochemistry, 1982. Worth, New York,pp. 372e373.
Lofton, D.D., Whalen, S.C., Hershey, A.E., 2014. Effect of temperature on methanedynamics and evaluation of methane oxidation kinetics in shallow ArcticAlaskan lakes. Hydrobiologia 721, 209e222.
Mau, S., Blees, J., Helmke, E., Niemann, H., Damm, E., 2013. Vertical distribution ofmethane oxidation and methanotrophic response to elevated methane con-centrations in stratified waters of the Arctic fjord Storfjorden (Svalbard, Nor-way). Biogeosciences 10, 6267e6278.
McAuliffe, C., 1971. G.C. determination of solutes by multiple phase equilibrium.Chem. Tech. 46.
Middelburg, J., Nieuwenhuize, J., Iversen, N., Høgh, N., de Wilde, H., Helder, W.,Seifert, R., Christof, O., 2002. Methane distribution in European tidal estuaries.Biogeochemistry 59, 95e119.
Pulliam, W.M., 1993. Carbon dioxide and methane exports from a southeasternfloodplain swamp. Ecol. Monogr. 29e53.
Ramaswamy, V., Boucher, O., Haigh, J., Hauglustine, D., Haywood, J., Myhre, G.,Nakajima, T., Shi, G., Solomon, S., 2001. Radiative forcing of climate. Clim. chang.349e416.
Reeburgh, W., Whalen, S., Alperin, M., 1993. The Role of Methylotrophy in the GlobalMethane Budget. Microbial Growth on C1 Compounds, pp. 1e14.
Rehder, G., Keir, R.S., Suess, E., Pohlmann, T., 1998. The multiple sources and pat-terns of methane in North Sea waters. Aquat. Geochem. 4, 403e427.
Sansone, F., Rust, T., Smith, S., 1998. Methane distribution and cycling in TomalesBay, California. Estuaries 21, 66e77.
Scranton, M.I., McShane, K., 1991. Methane fluxes in the southern North Sea: therole of European rivers. Cont. Shelf Res. 11, 37e52.
Segarra, K., Samarkin, V., King, E., Meile, C., Joye, S., 2013. Seasonal variations ofmethane fluxes from an unvegetated tidal freshwater mudflat (HammersmithCreek, GA). Biogeochemistry 115, 349e361.
Silvennoinen, H., Liikanen, A., Rintala, J., Martikainen, P.J., 2008. Greenhouse gasfluxes from the eutrophic Temmesjoki River and its Estuary in the Limi-nganlahti Bay (the Baltic Sea). Biogeochemistry 90, 193e208.
Simon, M., 2005. Die Elbe und ihr Einzugsgebiet: ein geographisch-hydrologischerund wasserwirtschaftlicher Überblick (Internat. Komm. zum Schutz der Elbe).
Stocker, T.F., Dahe, Q., Plattner, G.-K., 2013. Climate change 2013: the physical sci-ence basis. In: Working Group I Contribution to the Fifth Assessment Report ofthe Intergovernmental Panel on Climate Change. Summary for Policymakers(IPCC, 2013).
Upstill-Goddard, R.C., Barnes, J., Frost, T., Punshon, S., Owens, N.J., 2000. Methane inthe southern North Sea: low-salinity inputs, estuarine removal, and atmo-spheric flux. Glob. Biogeochem. Cycles 14, 1205e1217.
Valentine, D.L., 2011. Emerging topics in marine methane biogeochemistry. Annu.Rev. Mar. Sci. 3, 147e171.
Valentine, D.L., Blanton, D.C., Reeburgh, W.S., Kastner, M., 2001. Water columnmethane oxidation adjacent to an area of active hydrate dissociation, Eel riverBasin. Geochim. Cosmochim. Acta 65, 2633e2640.
Wiesenburg, D.A., Guinasso Jr., N.L., 1979. Equilibrium solubilities of methane,carbon monoxide, and hydrogen in water and sea water. J. Chem. Eng. Data 24,356e360.
Wiltshire, K.H., 2011. Helgoland Transects Elbe, 2010. Alfred Wegener Institute forPolar and Marine Research e Biological Institute, Helgoland. Unpublisheddataset #755887.
Wiltshire, K.H., 2012. Helgoland Transects Elbe, 2011. Alfred Wegener Institute forPolar and Marine Research e Biological Institute, Helgoland. Unpublisheddataset #775484.
Zhang, G., Zhang, J., Ren, J., Li, J., Liu, S., 2008. Distributions and sea-to-air fluxes ofmethane and nitrous oxide in the North East China Sea in summer. Mar. Chem.110, 42e55.