Embed Size (px)
Citation preview

SARA DIANA MOREIRA PEREIRA
Estrogenic exposure impacts in the frequency and stereological
parameters of both induced preneoplastic liver lesions and
normal hepatocytes of the brown trout
Dissertação de Candidatura ao grau de
Mestre em Oncologia submetida ao Instituto de
Ciências Biomédicas de Abel Salazar da
Universidade do Porto.
Orientador – Eduardo Jorge Sousa da Rocha
Categoria – Professor Catedrático
Afiliação – Instituto de Ciências Biomédicas
Abel Salazar da Universidade do Porto.


“Caímos, levantamos. Não é opção permanecermos sentados e desenlaçar as mãos, porque o
maior poder é acreditar e renascer.”


AG
RA
DE
CIM
EN
TO
S
V
AGRADECIMENTOS
À minha mãe, Maria do Céu Alves Moreira Pereira, por tudo, pela pessoa que sou hoje.
Ao meu orientador, Professor Doutor Eduardo Rocha, pela exigência, pela partilha de co-
nhecimentos, pelos ensinamentos fundamentais, pelas valiosas sugestões, pela motiva-
ção contínua e por contribuir para a minha evolução, enquanto estudante e profissional.
Às duas técnicas principais do Laboratório de Histologia e Embriologia do ICBAS, Fernanda
Malhão e Célia Lopes, por todo o apoio e amizade, pela partilha de conhecimentos e
permanente incentivo.
À minha colega Júlia Azevedo, com quem fiz equipa no projeto mais vasto em que se in-
tegra a dissertação, pela partilha de esforços e dados, numa complementaridade de ação.
À minha amiga e colega, Ana Isabel Cardoso, pela amizade e ajuda nunca negada.
Às minhas amigas, Carla Silva e Zélia Lopes, que me acompanharam desde o início desta
jornada e me apoiaram diariamente, ouvindo desabafos e nunca me deixando desistir.
Aos meus amigos e colegas da Ala 6, em especial, à Cristina Mota, Ana Rodrigues e Lea
Oliveira, pelas conversas repletas de otimismo e companheirismo.
Ao Professor Doutor Luís Vieira, pela preocupação e apoio contínuos.
Às minhas amigas e colegas Ana Fernandes e Ana Caramelo pela ajuda durante os proce-
dimentos laboratoriais e apoio.
À minha família e amigos, por me ajudarem a manter o equilíbrio físico e psicológico.
A todos aqueles que acreditaram em mim, mesmo quando eu própria duvidei e vacilei.


RE
SU
MO
VII
RESUMO
Introdução — O fígado é um órgão vital que desempenha funções fulcrais que mantêm o
ser vivo e saudável. O cancro do fígado é a terceira causa mundial mais comum de morte
por cancro, sendo a quinta e a sétima forma desta patologia mais frequentemente diag-
nosticada no homem e na mulher, respetivamente. Em Portugal, a incidência de mortali-
dade aumentou entre 2006 e 2012, sendo o alcoolismo e a Hepatite B as causas associ-
adas. Os métodos de diagnóstico, tratamento e prevenção do cancro de fígado têm evo-
luído e se tornado mais eficientes. As neoplasias hepáticas podem ocorrer em toda a
filogenia, desde do peixe ao ser humano. O Homem e outros seres vivos estão, perma-
nentemente, expostos a químicos, entre eles, os xenoestrogénios, compostos capazes de
replicar a ação dos estrogénios e de interferir em vias celulares, podendo, inclusive, pro-
mover a hepatocarcinogénese. No entanto, alguns autores afirmam que os estrogénios
podem ter efeito protetor a nível hepático, naquele e noutros processos. Os focos de alte-
rações celulares (FAC) são lesões consideradas pré-neoplásicas, capazes de progredir
para tumores benignos ou malignos. Os FAC destacam-se do parênquima normal como
agregados hepatócitos com características morfológicas e de coloração atípicas. Neste
trabalho experimental, pretendemos avaliar os tipos histológicos de FAC, prevalência e
vários parâmetros estereológicos, depois de uma exposição a um estímulo estrogénico,
de modo a analisar a capacidade de iniciação/promoção deste tipo de influência.
Materiais e Métodos — A indução da hepatocarcinogénese foi realizada em embriões de
truta fário, usando o N-metil-N'-nitro-N-nitrosoguanidina (MNNG) como iniciador. Quatro
grupos de peixes foram expostos a etanol salino (veículo solvente), 5 µg/L de 17β-
estradiol (E2), 50 µg/L de E2 e a 500 µg/L de uma mistura de dois alquilfenóis. Um quinto
grupo, não exposto qualquer composto, foi mantido nas mesmas condições. Para a clas-
sificação histopatológica de lesões e estimativa da sua prevalência, fragmentos dos fíga-
dos extraídos foram fixados e rotineiramente processados para coloração com hematoxi-
lina-eosina. Foram também efetuadas três colorações histoquímicas (ácido periódico
Schiff (PAS), azul da Prússia de Perls, e vermelho de Sírius) e conduzidos dois estudos
imunohistoquímicos, com anticorpos contra E-caderina e “CYP1A”. Para a avaliação qua-
litativa, foi implementado um ensaio cego, primeiro recorrendo a microscopia ótica e pos-
teriormente a um sistema de digitalização de lâminas (Olympus VS110); o mesmo foi
também utilizado para executar medições e estimar densidades volumétricas (VV). Outros
parâmetros estereológicos foram estimados, utilizando um posto de trabalho controlado
pelo programa CAST-Grid. Para manuseamento de resultados e análise estatística, foram
utilizados os programas Microsoft Excel 2010, VassarStats e STATISTICA 12.

RE
SU
MO
VIII
Resultados — Os peixes do controlo branco (não iniciados com MNNG) não apresenta-
ram qualquer tipo de lesões hepáticas. Por outro lado, em todos os grupos iniciados com
MNNG foram encontrados FAC basofílicos (bFAC), anfofílicos (aFAC) e eosinofílicos
(eFAC). Relativamente à prevalência, 100% dos peixes do grupo E2 50 µg/L tinham FAC.
O grupo com a menor proporção foi o E2 5 µg/L. Em todos os grupos, o tipo mais fre-
quente de FAC foi o basofílico, à exceção do E2 50 µg/L, e o menos comum o eosinofíli-
co. A média do VV (bFAC) no fígado atingiu os valores mais altos em todos os grupos —
exceto no E2 50 µg/L, onde o VV (aFAC) foi o mais elevado — revelando que o bFAC
atinge a extensão máxima. No que diz respeito ao VV do somatório dos FAC no fígado [VV
(Total FAC)] e do parênquima total alterado [VV (PTA)], foi no E2 50 µg/L que se eviden-
ciou quase o triplo do segundo grupo mais elevado. Nos volumes celular e nuclear do
hepatócito, comparando o parênquima com e sem lesões, o controlo branco apresentou
em todos os parâmetros os valores mais baixos e deferiu dos outros quatro grupos com
lesão. No que respeita aos volumes celular e nuclear do hepatócito, no bFAC, o E2 50
µg/L e os alquilfenóis produziram os valores mais elevados, contrariamente ao E2 5 µg/L
que promoveu os mais baixos. Observando os resultados do aFAC, a concentração de
E2 50 µg/L tendeu a induzir os valores mais elevados e a de E2 5 µg/L os mais baixos.
Os FAC foram negativos para as colorações de Perls, e quanto ao vermelho de Sírius
verificámos que o estroma perisinusoidal no parênquima normal não diferia em espessura
quando comparado com o do FAC. Finalmente, no PAS notámos que, na maioria dos
casos, os hepatócitos constituintes dos FAC continham menos teor glicogénico quando
comparados com o parênquima adjacente. Quanto à imunoreatividade da E-caderina,
verificou-se um sinal negativo em todos os tipos de FAC, quando comparado com o pa-
rênquima adjacente. No caso CYP1A registámos um padrão heterógeno.
Discussão, Conclusão e Perspetivas — As lâminas virtuais e a respetiva análise de
imagem provaram ser uma ferramenta rápida e precisa em termos de diagnóstico. Ficou
claro que a estimulação estrogénica pode agir como promotora quando administrada em
altas doses, sendo o E2 ainda mais efectivo, quando comparado com a mistura de alquil-
fenóis. Analisando os resultados dos alquilfenóis — apesar do potencial estrogénico da
mistura usada ser menor do que o do E2 5 µg/L — sugerimos que este possa despoletar
outros mecanismos celulares, acabando por originar um maior impacto. Os resultados do
E2 5 µg/L apontaram para um potencial efeito protector dos estrogénios, o que vai de
encontro ao conceito de hormése (efeitos biológicos diferenciais, derivados da exposição
a mais baixos níveis). A classificação dos FAC foi, em alguns casos, dificultada pela hete-
rogeneidade do parênquima e tivemos mesmo a necessidade de introduzir um novo con-
ceito — o Pré-FAC — associado, presumidamente, a estádios iniciais dos FAC. Os nos-
sos dados remetem para a importância do diagnóstico dos subgrupos, sendo a sua clas-
sificação e caracterização aspetos essenciais. Os diferentes fenótipos verificados nas

RE
SU
MO
IX
análises imuno- e histoquímicas indicam um cenário morfofuncional múltiplo, que falhou
em clarificar a linha evolutiva dos diversos FAC. No que respeita a características de he-
patócitos do parênquima normal, as diferenças encontradas entre o controlo branco e os
outros grupos indicam que a presença de FAC está associada a alterações no parênqui-
ma aparentemente normal. Este facto tem potencial para ser usado como mais um ele-
mento de detecção de processos de carcinogénese, antes da emergência da neoplasia.
Estudos futuros sobre este tipo de alterações hepatocelulares e de lesões pré-neoplásicas,
nomeadamente a nível molecular, podem ajudar a caracterizar de forma mais detalhada a
emergência e progressão dos FAC. Os resultados deste trabalho contribuíram para me-
lhor compreensão das respostas hepáticas à exposição química com iniciadores neoplá-
sicos, seguida de estímulo estrogénico, chamando a atenção para potenciais riscos para
as espécies em contacto com estes compostos, incluindo o Homem.


AB
ST
RA
CT
XI
ABSTRACT
Introduction — The liver is a vital organ with a wide range of functions that keep animals
alive and healthy. Liver cancer is the third most common cause of death from malignant
neoplasms worldwide, being the fifth and seventh most frequently diagnosed cancer in
men and women, respectively. In Portugal, the incidence and mortality increased between
2006 and 2012, being alcoholism and infection with hepatitis B associated causes. In par-
allel, there are growingly efficient approaches for diagnosis, treatment and prevention of
liver cancer. Hepatic neoplasms occur across phylogeny, from fish to Man. Humans and
wildlife are now continuously exposed to a myriad of chemicals, like xenoestrogens, com-
pounds able to mimic estrogens action and interfere with key cellular processes that lead
to hepatocarcinogenesis. Yet, some authors claim that estrogens may have a protector
hepatic effect. Foci of cellular alterations (FCA) are preneoplastic lesions capable of pro-
gressing, increasing the risk of developing benign or malignant tumors. FCA stand out
from the normal parenchyma as aggregates of hepatocytes with abnormal morphology
and staining features. In this experimental work we detected and evaluated FCA histologi-
cal types, prevalence and several stereological parameters, after exposure to estrogenic
stimuli, in order to analyze the initiation/promotion capacity of such type of influence.
Materials and Methods — Hepatocarcinogenesis induction was made in brown trout em-
bryos, using N-methyl-N’-nitro-N-nitrosoguanidine (MNNG) as the initiator agent. Four fish
groups were exposed to ethanol saline (dissolving vehicle), 5 µg/L of 17β-estradiol (E2),
50 µg/L of E2 and 500 µg/L of a mixture of two alkylphenols. For histopathological classifi-
cation of the lesions and estimation of their prevalence, livers fragments were fixed and
routinely processed for hematoxylin–eosin staining. Also, three histochemistry stainings
were made (period acid-Schiff (PAS), Perls’ Prussian blue and Sirius red) and two im-
munostaining studies were conducted, with antibodies against E-cadherin and CYP1A.
For qualitative assessment, a blind assay was implemented, first resourcing to optical
microscopy and then to an Olympus VS110 virtual slide scanning system; also used for
area measurements to estimate volume densities. Other stereological parameters were
estimated using a workstation controlled by the software CAST-Grid. For data handling
and statistical analysis, we used Microsoft Excel 2013, VassarStats and STATISTICA 12.
Results — Fish from the blank (non-MNNG initiated) control did not have any sort of liver
lesions. By the contrary, basophilic, amphophilic and eosinophilic FCA were found in all
the MNNG initiated groups. Regarding the prevalence, the E2 50 µg/L group reached a
remarkable result, with 100% of fish having FCA, and the group with the lowest % value
was the E2 5 µg/L. In all groups, the most frequent FCA type was the basophilic, except in
the E2 50 µg/L, and the less common the eosinophilic. The mean VV (bFCA) in the liver

AB
ST
RA
CT
XII
reached the highest values in all groups — except in the E2 50 µg/L group, where the VV
(aFCA) was greater — revealing that the bFCA attained maximum spreading. Concerning
the VV of all FCA together in the liver [VV (Total FCA)], and that of the total altered paren-
chyma [VV (TAP)], the E2 50 µg/L group reached almost the triple of the second highest
group. As to the cell and nuclear volumes of the hepatocyte, comparing parenchyma with
and without lesions, the Blank Control group presented in all the parameters the lowest
values and differed from the other four groups with lesions. Additionally, regarding the cell
and nuclear volumes of the hepatocyte within the bFCA, E2 50 µg/L and Alkylphenols
achieved the highest values, contrary to E2 5 µg/L, that presented the lowest. Observing
the results from aFCA, E2 50 µg/L tends to promote the higher values and E2 5 µg/L the
lowest. The FCA were negative for Perls’, and the Sirius red showed the delicate peris-
inusoidal stroma did not differ in thickness in the FCA compared with non-lesioned areas.
PAS showed that in most cases there was less glycogen within the FCA hepatocytes,
when compared with the close parenchyma. Finally, we saw a negative pattern regarding
E-cadherin immunoreactivity, within all FCA types, when compared to the normal paren-
chyma, while for CYP1A we verified heterogeneity in the immunostaining patterns.
Discussion, Conclusion and Perspectives — The virtual slides and related image anal-
ysis proved to be valuable for a faster and accurate diagnosis. It was clear that estrogenic
stimulation can act as a promoter when administrated in high doses, being E2 even more
effective compared with the alkylphenols mixtures. Observing the results of Alkylphenols,
despite its lowest estrogenic potential compared with E2 5 µg/L, we considered that it may
trigger other cellular mechanisms besides estrogenicity, ending up causing more impacts.
The E2 5 µg/L outcomes pointed for a potential protector effect of estrogens, which is in
line with the concept of hormesis (differential low dose-response phenomena). The classi-
fication of FCA was, in some cases, hampered by the parenchyma heterogeneity and we
even felt the need to introduce a new concept — Pre-FCA — associated to the presuma-
bly earliest stages of FCA. Data backs the importance of sub-groups diagnosis, being the
FCA classification and characterization an essential aspect. The different phenotypes veri-
fied in the histochemical and immunochemistry analyses pointed to a multiple morpho-
functional scenario, that failed in clarify the evolution line of the diverse FCA. The differ-
ences between hepatocytes from blank control and the other groups, regarding the paren-
chyma comparison, indicated that changes can occur in the apparently normal parenchy-
ma, adjacent to FCA. This fact has potential to be used as one early signal that neoplastic
lesions may be emerging or do already exist. Future studies of these kinds of early pre-
sumptive preneoplastic changes and also lesions, especially at a molecular level, should
help to characterize with more detail the FCA. Overall, the findings of this work contributed
to enrich the understanding of liver responses after exposure to a neoplastic initiator
chemical agent followed by chronic estrogenic stimulation, and draw attention to potential
risks for species in contact with these compounds, including Humans.

IND
EX
XIII
INDEX
AGRADECIMENTOS ....................................................................................................... V
RESUMO ........................................................................................................................ VII
ABSTRACT ..................................................................................................................... XI
INDEX ........................................................................................................................... XIII
TABLES INDEX ............................................................................................................. XV
FIGURES AND GRAPHS INDEX ................................................................................. XVII
INTRODUCTION .............................................................................................................. 3
LIVER CANCER ............................................................................................................... 3
Epidemiologic background ................................................................................................ 3
Portuguese context ........................................................................................................... 4
Etiology and risk factors .................................................................................................... 6
Diagnosis .........................................................................................................................10
Treatment ........................................................................................................................10
Prevention .......................................................................................................................11
ENVIRONMENT AND CHEMICAL CARCINOGENESIS .................................................12
Animal models in (chemical) carcinogenesis – From mouse to trout ................................14
Influence of xenoestrogens in cancer and specifically in liver cancer ...............................17
Estrogens: the other side of the coin ....................................................................................... 20
PRE-NEOPLASTIC LIVER LESIONS - FOCI OF CELLULAR ALTERATIONS (FCA) .........21
FCA — Histological types ................................................................................................22
Clear cell foci ............................................................................................................................ 23
Vacuolated foci ......................................................................................................................... 24
Eosinophilic foci ........................................................................................................................ 24
Basophilic foci ........................................................................................................................... 24
Amphophilic foci....................................................................................................................... 25
The progression and fate of FCA .....................................................................................25
OBJECTIVES ..................................................................................................................26
MATERIALS AND METHODS ........................................................................................29
EXPERIMENTAL SET UP AND ASSAY .........................................................................29
HISTOLOGY ...................................................................................................................29
IND
EX
XIV
QUALITATIVE ANALYSIS AND STEREOLOGY ............................................................30
NORMAL PARENCHYMA: WITHOUT LESIONS VS WITH LESIONS ...........................31
STATISTICAL ANALYSIS...............................................................................................33
HISTOCHEMISTRY .........................................................................................................33
IMMUNOHISTOCHEMISTRY ..........................................................................................34
RESULTS ........................................................................................................................37
GENERAL QUALITATIVE FINDINGS .............................................................................37
PREVALENCE ................................................................................................................37
RELATIVE VOLUMES OF THE LESIONS ......................................................................45
NORMAL PARENCHYMA: WITHOUT LESIONS VS WITH LESIONS ...........................47
ALTERED PARENCHYMA: VOLUME PARAMETERS OF bFCA AND aFCA ..................50
HISTOCHEMISTRY .........................................................................................................54
IMMUNOHISTOCHEMISTRY ..........................................................................................57
DISCUSSION ..................................................................................................................65
OPTICAL MICROSCOPY VS DIGITAL MICROSCOPY ..................................................65
BASELINE RATE AND PROMOTION EFFECT ..............................................................66
PRE-INITIAL FOCI (PRE-FCA) .......................................................................................70
DIAGNOSIS AND IMAGING ANALYSIS: DIFFICULTIES AND FINDINGS ....................71
THE NORMAL PARENCHYMA.......................................................................................72
ALTERED PARENCHYMA: VOLUME PARAMETERS OF bFCA AND aFCA ..................73
HISTOCHEMISTRY .........................................................................................................74
IMMUNOHISTOCHEMISTRY ..........................................................................................75
CONCLUSION AND PERSPECTIVES ............................................................................79
ACKNOWLEDGEMENTS TO FUNDING AGENCIES .....................................................85
REFERENCES ................................................................................................................89

TA
BL
E I
ND
EX
XV
TABLES INDEX
Table 1- Prevalence of each type of foci of cellular alteration (FCA) and Pre-FCA in the
different groups (n=426). ..................................................................................................41
Table 2- Significance of the difference (p-values) of the prevalences of foci of cellular
alteration (FCA) and Pre-FCA between groups, under the VassarStats test. ..................41
Table 3- Significance of the difference (p-values) between groups, regarding the
prevalence of FCA combinations, under the VassarStats test. ........................................44
Table 4- Descriptive statistical data from each group, regarding the relative volumes (%)
of the lesions, considering the liver as reference space (fish, n = 426). ............................45
Table 5- Significance of the difference (p-values) between groups, under the Mann-
Whitney test, considering the relative volumes of foci of cellular alteration (FCA) and Pre-
FCA ................................................................................................................................46
Table 6 – Descriptive summary of the statistics of the relative volumes (VV).* ..................47
Table 7 –Parenchyma descriptive statistical data from each experimental group, including
blank control, regarding the liver cell body and nuclear volume-related parameters (fish, n
= 100) ..............................................................................................................................48
Table 8 – Significance of the difference (p-values) between experimental groups, under
the Newman-Keuls test, regarding the liver cell body and nuclear volume-related
parameters in the normal parenchyma. ............................................................................49
Table 9- Descriptive statistical data from basophilic foci of cellular alteration (bFCA),
regarding the liver cell body and nuclear volume-related parameters and sinusoid and
nucleus relative volumes (fish, n = 20). ......................................................................52
Table 10- Descriptive statistical data from amphophilic foci of cellular alteration (aFCA),
regarding the liver cell body and nuclear volume-related parameters and sinusoid and
nucleus relative volumes, (fish, n = 20). ........................................................................53


FIG
UR
ES
AN
D G
RA
PH
S I
ND
EX
XVII
FIGURES AND GRAPHS INDEX
Figure 1 Hematoxylin and Eosin staining. Basophilic FCA (delimited in A and detailed in
B); amphophilic FCA (delimited in C and detailed in D) composed of hepatocytes with
cytoplasmic basophilia and eosinophilia; eosinophilic FCA (delimited in A and detailed in
B), presenting an acidophilic staining. Bars: A- 100 µm; B- 50 µm; C- 200 µm; D- 50 µm;
E- 200 µm; F- 100 µm. .....................................................................................................38
Figure 2 Hematoxylin and Eosin staining. Clear cell foci (delimited in A and in detailed in
B) with hepatocytes with a faint pink colour and central nucleus; vacuolated FCA
(delimited in C and in detailed in D) an evidently vacuolated cytoplasm and an
eccentrically displaced nucleus; Pre-FCA (delimited in E and in detailed in F) with a mild
tinctorial change regarding the hepatocytes but with neither a trabecular aspect nor
increased vascularization. Bars: A- 100 µm; B- 50 µm; C- 100 µm; D- 50 µm; E- 100 µm;
F- 50 µm. .........................................................................................................................39
Figure 3 Hematoxylin and Eosin staining. Hepatocellular adenoma (delimited in A and in
detailed in B), well delimited from the parenchyma, depicting evident cellular and nuclear
atypia and pleomorphism (*binuclear cell). Liver displaying a widespread abnormal pattern
with heterogeneity (C and in detailed in D), where all the parenchyma seems to have
turned into an enormous FCA. Bars: A- 500 µm; B- 100 µm; C- 500 µm; D- 200 µm. ......40
Graphs 1-4 - Prevalence of different foci of cellular alteration (FCA) combinations in the
four groups. .....................................................................................................................43
Figure 4 Perls’ staining. The FCA (delimited in A and detailed in B) marked negatively for
ferric salts. Bars: A- 200 µm; B- 100 µm. .........................................................................54
Figure 6 Sirius red staining. General overview of an adenoma (delimited in A), along with
some details (B-E), and exemplificative images of the normal parenchyma nearby (F-I).
The adenoma blood vessels (*) seem slightly more thickened as to the collagen content of
their wall/perisinusoidal space, than in those (arrows) of the surrounding parenchyma (F-
I). Bars: A – 500 µm; B to H - 50 µm, except C- 100 µm. .................................................55
Figure 7 PAS Staining. Two amphophilic FCA (delimited in A and C and detailed in B and
D) that present less glycogen within hepatocytes when comparing with the hepatocellular
load in the surrounding parenchyma. Bars: A – 200 µm; B - 50 µm; C – 200 µm; D - 50
µm. ..................................................................................................................................56
Figure 8 PAS Staining. Two amphophilic FCA (delimited in A and C and detailed in B and
D) that present more glycogen compared with the surrounding parenchyma, contrary to
the observed in Figure 8. In the amphophilic FCA in C, two staining compartments are
seen simultaneously: one in the center of the FCA (*), staining somewhat more close to
the surrounding parenchyma, and other, at the FCA border (matching to a more basophilic
periphery in Hematoxylin and Eosin staining), presenting more glycogen than the
surrounding parenchyma. Bars: A- 200 µm; B 50 µm; C- 200 µm; D- 50 µm. ...................56

FIG
UR
ES
AN
D G
RA
PH
S I
ND
EX
XVIII
Figure 9 PAS Staining. The eosinophilic FCA at the top (delimited in A and detailed in B),
the basophilic FCA in the middle (delimited in C and detailed in D), and the adenoma on
the bottom (delimited in E and detailed in F), all present less glycogen compared with the
adjacent normal parenchyma. Bars: A- 200 µm, B- 50 µm, C- 200 µm, D – 50 µm, E- 500
µm, F - 100 µm. ..............................................................................................................57
Figure 10 E-cadherin immunoreactivity in FCA (delimited in A and detailed in B). In the
latter, it becomes evident the nearly absence of staining comparing with the surrounding
parenchyma (specially, close to blood vessels); a feature apparently similar in all the FCA
types. Bars: A- 200 µm; B- 100 µm. .................................................................................58
Figure 11 Hematoxylin and Eosin staining (delimited FCA in A,C and E) and
CYP1A immunoreactivity (delimited FCA in B,D and F) in amphophilic FCA. There is
heterogeneity between the depicted FCA, with distinct patterns of staining reactivity, going
from very slight (B), to moderated (D), and even to very intense (F). Bars: A to F- 20 µm.
........................................................................................................................................59
Figure 12 Hematoxylin and Eosin staining (delimited FCA in A, C and E) and CYP1A
immunoreactivity (delimited FCA in B, D and F) in eosinophilic FCA. These type of FCA
present heterogeneity, less pronounced than in the amphophilic FCA, with a slight (B) to
moderate intensity (D). Bars: A to D- 20 µm. ....................................................................60
Figure 13 Hematoxylin and Eosin staining (delimited FCA in A and C) and
CYP1A immunoreactivity (delimited FCA in B and D) in basophilic FCA. This type of FCA
presents a weak signal when compared with the amphophilic and eosinophilic FCA. Bars:
A to D- 20 µm. .................................................................................................................61

INT
RO
DU
CT
ION


INT
RO
DU
CT
ION
3
INTRODUCTION
LIVER CANCER
Epidemiologic background
The liver is a remarkable organ with major relevance in maintaining homeostasis
and proper functioning of the whole organism, and therefore it has been a study target to
scientists, not for decades, but actually for centuries (Bryan, 1930; Loukas et al, 2011).
Among its main functions, we can describe: the metabolism of lipids, carbohydrates and
proteins; storage of glycogen, vitamins and iron; detoxification of noxious chemicals and
bile production. In the liver, the nutrients absorbed in the digestive tract are processed and
stored to be used by other organs, functioning as an interface between the digestive sys-
tem and the blood. When the liver is injured, several extra hepatic organs may be affected
secondarily — and even compromised — by alterations in the levels of metabolites levels
that it regulates (Arias et al, 2009).
In economically developed countries, cancer is the leading cause of death and the
second one in developing countries. The incidence of cancer is increasing in economically
developing countries as a result of population aging and growth as well as, gradually, due
to an adoption of cancer-associated lifestyle choices including smoking, drinking, physical
inactivity, and ‘westernized’ diets (which include excessive red meat, sugary desserts,
high-fat foods, and refined grains) (Jemal et al., 2011). In men, liver cancer is the fifth
most frequently diagnosed cancer worldwide (523,000 cases/y, 7.9% of all cancers), being
the second most frequent cause of death by cancer. In women, it is the seventh most
commonly diagnosed cancer (226,000 cases/y, 6.5% of all cancers) and the sixth leading
cause of cancer death. Liver cancer has a high mortality rate; the geographic distribution
of mortality is similar to that of incidence. An estimated 748,300 new liver cancer cases
and 696,000 cancer deaths occurred worldwide in 2008 (478,000 in men and 218,000 in
women), being half of these cases and deaths estimated to occur in China. Because of its
high fatality (overall ratio of mortality to incidence of 0.93), liver cancer is the third most
common cause of death from cancer worldwide (Ferlay et al., 2010; Jemal et al., 2011).
The most common histological type of liver malignant neoplasm is hepatocellular
carcinoma (HCC), accounting from 70% to 85% of the total liver cancer burden worldwide.
Other forms include: (i) childhood hepatoblastoma, and (ii) adult cholangiocarcinoma
(originating from the intrahepatic biliary ducts) and (iii) angiosarcoma (from the intrahepat-
ic blood vessels) (Chuang et al., 2009; Jemal et al., 2011; Serag, 2012). HCC carcino-
genesis is a complex process that involves several modifications in the molecular path-

INT
RO
DU
CT
ION
4
ways and genetic alterations, which ultimately lead to malignant transformation and dis-
ease progression (Sanyal et al., 2010).
About 80% of HCC cases occur in Sub-Saharan Africa and in Eastern Asia, with
typical incidence rates of more than 20 per 100,000 individuals (Serag, 2012). This dis-
turbing scenario is most likely due to: 1) failure to recognize and follow the high-risk indi-
viduals; 2) high prevalence of specific risk factors in the populations; 3) lack of medical
expertise and facilities for early diagnosis; and 4) the absence of an effective treatment
after diagnosis. Other important factors include: 5) poor compliance, with inadequate at-
tendance or absent in surveillance programs and thus late discovery of patients with al-
ready severe tumor status; 6) low awareness of the benefits of HCC treatment and pre-
vention actions; and 7) screening depreciation by some physicians (Ferenci et al., 2010).
Southern European countries (such as Spain, Italy, and Greece) tend to have mid-
incidence levels (10.0 to 20.0 per 100,000 individuals), whereas North America, South
America, Northern Europe, and Oceania have a low incidence of HCC (<5.0 per 100,000
individuals). Recent decreases in the incidence of HCC were reported in high-incidence
areas, like among Chinese populations living in Hong Kong, Shanghai, and Singapore; the
incidence in Japan also is decreasing. This is probably due to the hepatitis B virus (HBV)
vaccine, since, as of 2008, a total of 177 countries (91%) had introduced the HBV vaccine
into their national infant immunization schedules. In 2006, only 27% of infants worldwide
received the first dose within 24 hours post birth, as recommended by the World Health
Organization (WHO). On the other hand, cases of HCC are increasing in low-incidence
areas such as the United States, Canada and Central Europe, possibly due to the obesity
epidemic and the rise in hepatitis C virus (HCV) infection through continued transmission
by injection drug users (Jemal et al., 2011; Serag, 2012).
As stated by Serag (2012), HCC is not frequently detected at the first 4 decades of
life, except in populations characterized by a hyperendemic HBV infection. The mean ag-
es of diagnosis with HCC were 55–59 years in China and 63–65 years in Europe and
North America. In low-risk populations, the highest incidence of HCC is among individuals
aged 75 or older. HCC is predominant among men, with the highest male:female ratios
found in areas of high incidence (overall sex ratio male:female is 2.4) (Ferlay et al, 2010).
Portuguese context
Unfortunately, we have been witnessing the beginning of alcohol consumption at
very early ages, the generalization of overconsumption in girls and the frequent adoption
of "binge drinking" (drunkenness). Alcohol is related with several diseases, however, in
Portugal, it has been having a high impact in alcoholic cirrhosis and deaths from road ac-

INT
RO
DU
CT
ION
5
cidents, particularly in young people (Marinho, 2008). In the top of the 20 countries with
highest beverage-specific adult per capita consumption, Portugal occupies the third place
regarding the wine consumption, being also considered the wine producers with a high
level of production (World Health Organization, 2004). The alcohol consumption in Portu-
gal is 15% higher than in the rest of Europe and it is estimated that there are approximate-
ly 1 million alcoholics or excessive alcohol drinkers in Portuguese population (Mota et al,
2010). In Portugal, adult per capita consumption of alcohol is mainly characterized by
consumption of wine, followed by beer and the total adult per capita consumption of pure
alcohol in Portugal rounds the 14.6 liters. Concerning the mortality rates, from death
causes where alcohol is one of the underlying risk factors, liver cirrhosis clearly stands out
(World Health Organization, 2004 and 2010). On the other hand, the hepatic cirrhosis, one
of the most serious consequences of alcoholism, was estimated to be the tenth leading
cause of death and about two-thirds of the cirrhosis cases were rated as of alcoholic etiol-
ogy. In line with the cirrhosis, in the same year, 329 Portuguese died with hepatocellular
carcinoma (Marinho, 2008). In Portugal the legal age for alcohol consumption is 16 years,
but consume before age 18 increases the risk of addiction and studies show that 40% of
young people who start drinking excessively at age 13 are alcohol dependent and in Por-
tugal people start drinking too early, exactly at an average age 13 (Marinho, 2008).
Another serious situation that calls urgent attention is the phenomena occurring in
Portugal and in Europe called the “feminization of alcoholism”, namely because girls, at
least as to spirits, are drinking (at least) as much as boys. This sudden increase in alco-
holic liver disease among women showed their susceptibility to the hepatotoxic effects of
alcohol. Women tended to present more severe liver disease than men, particularly alco-
holic hepatitis, after a shorter period of excessive drinking and at a lower daily alcohol
intake. Differences in body size and composition (% of water, for example) may be partly
responsible for the greater susceptibility of women, but differences in immune reactivity
between the sexes may also play a part (Mota et al., 2010; Marinho, 2008).
Besides alcoholism, the infection with hepatitis B virus (HBV) is also a public
health problem in Portugal, despite its prevalence is relatively low: approximately 1%.
However, a national serological survey in 2004 pointed to 0.36% individuals chronically
infected with HBV (Mota et al., 2010). In Portugal, the second leading cause of hepatic
disease is viral hepatitis. The mortality from liver cirrhosis has approximately 2,500 cases
per year and according to statistics of the hospitals, 15% to 20% of patients with liver cir-
rhosis are infected with HBV (Mota et al., 2010). Fortunately, the vaccination is obligatory
for all newborns in Portugal since 2000 and the 2nd and 3rd doses are given at 2 and 6
months of age respectively (National Vaccination Program since January 1, 2012)

INT
RO
DU
CT
ION
6
Using the National Cancer Register as a database of all malignant tumors in the
population residing in Portugal, in 2006, we can verify: an annual incidence of 3.94, with
the registration of 417 cases (1.1%) — 316 males and 101 females, and an annual mortal-
ity of 6.51, with a record of 689 deaths (3.2%) — 491 males and 198 females (Registo
Oncológico Nacional 2006, 2012). Consulting the datasheet of GLOBOCAN, we can see
that the estimated liver cancer incidence in Portugal, regarding the year of 2012, is 2.7
(772 cases) in men against 16.1 (293318 cases) in China; in women is 1.1 (232 cases)
against 8.2 (101452) in China. The estimated liver cancer mortality in men is 4.6 (655
deaths) against 19.7 (281802 cases) in China and in women is 2.6 (253 deaths) against
13.1 (101401 deaths) in China. Comparing the result sets of the two years, we can con-
clude that the number of cases and mortality increased, supporting the need of new pre-
vention and early diagnosis approaches.
The most recent epidemiological data on cancer in Portugal is the 2011 Oncologic
Registry of the Portuguese Oncology Institute Porto (Registo Oncológico 2011, 2013),
where we can observe that of the 53 malignant liver tumors registered (0.75%), 36 were of
male and 17 were of female patients and that the age groups more affected were 55-59
and 65-69. The number of metastatic tumors (16 in 53) is the highest value, suggesting
late diagnosis, which decreases efficacy of the treatment and the chance of patient sur-
vival (Hemming et al, 2001; Llovet and Bruix, 2003). With concern to the histological
types, 7 were clinically diagnosed as malignant, 14 as cholangiocarcinoma, 29 as hepato-
cellular carcinoma (this being the most frequent type, in line to what is verified worldwide),
and 3 as other tumors.
Etiology and risk factors
There are multiple etiologic factors involved in liver pathological process, leading to
HCC, and all of them depend on the geographic location, which has a direct impact on the
characteristics of the patients, influencing the disease course and therefore making HCC
an extremely complex condition associated with a poor prognosis (Sanyal et al., 2010).
Chronic infection with hepatitis B virus (HBV), hepatitis C virus (HCV) or both is the
most common cause of HCC worldwide. HBV and HCV promote cirrhosis, which is found
in 80%–90% of patients with HCC (Serag, 2012). These two viruses account for 78%
(HBV, 53%; HCV, 25%) of the total liver cancer deaths globally, with the estimates by re-
gion varying from about 64% in the Americas to about 90% in Japan and Singapore
(Jemal et al., 2010). Approximately 5% of the world population (350 to 400 million people)
is chronically infected with HBV; 75% of infected people are Asian, with a lower preva-
lence (0.3%– 1.5%) in Western countries (Serag, 2012).

INT
RO
DU
CT
ION
7
HBV is a partially double-stranded DNA-containing virus belonging to the
Hepadnaviridae family, and its infection can induce HCC through both direct and indirect
pathways (Sanyal et al., 2010). HBV infection starts by inducing hepatocyte injury and
chronic necroinflammation, with subsequent hepatocyte proliferation, fibrosis, and cirrho-
sis. The continuous regeneration in cirrhosis causes an increase in the liver cell turnover
and an accumulation of mutations in the host genome that can result in genetic altera-
tions, chromosomal rearrangements, activation of oncogenes, and inactivation of tumor
suppressor genes. However, HBV can also leads to HCC in the absence of cirrhosis
through a direct oncogenic effect, since it is able to integrate its DNA into host cells and
act as a mutagenic agent, causing secondary chromosomal rearrangement and increas-
ing genomic instability (Azam and Koulaouzidis, 2008; Sanyal et al., 2010).
HCV infection causes chronic inflammation, cell death, proliferation, but when re-
lated to HCC is found almost exclusively in patients with cirrhosis. Thus, the risk for de-
veloping HCC is higher in HCV-infected patients, and it depends on the degree of liver
fibrosis at the time of HCV infection (Sanyal et al., 2010). HCV belongs to the Hepacivirus
genus of the Flaviviridae family. Until now, there is no evidence to support that HCV inte-
grates into the cellular genome or has another direct role in the molecular pathogenesis of
HCC. On the other hand, HCC can develop via HCV induced chronic liver injury, pro-
gressing to fibrosis and cirrhosis (Hamilton et al., 2000; Sanyal et al., 2010).
Alcohol-induced liver injury is a leading cause of liver cirrhosis among Western
populations, being the most important HCC risk. The excessive alcohol consumption in-
creases the risk of HCC, primarily, through the development of cirrhosis. It has been sug-
gested that heavy alcohol consumption of > 80 g/d ethanol for at least 5 years increases
the risk of HCC by nearly fivefold. The risk seems to be proportional to the amount of al-
cohol consumed. In addition to a daily dose response, persistent consumption can cause
long-term effect on the risk of HCC occurrence. An association between genetic polymor-
phisms of the enzymes participating in the metabolic pathway of ethanol and the in-
creased risk of HCC in heavy alcohol drinkers has been also proposed as a mechanism
leading to HCC (Blonski et al., 2010). In addition, Chuang et al (2009) suggested that
HCV infection can accelerate the progress of alcoholic liver disease and lead to the de-
velopment of HCC at a younger age among drinkers than among non-drinkers. Therefore,
the authors concluded that alcoholic cirrhosis may assume a greater relevance as one of
the risk factors for HCC in populations with low prevalence of HBV and HCV infection and
low exposure to aflatoxins, such as North America and Northern Europe.
Based on the stated above, there is no doubt that cirrhosis increases significantly
the risk of HCC development. Cirrhosis develops following long periods of chronic liver
disease and is characterized by a decrease in hepatocyte proliferation, which points to an

INT
RO
DU
CT
ION
8
exhaustion of the regenerative capacity of the liver. During this pathological process, we
can verify an increase in fibrous tissue and a destruction of liver cells, providing the nec-
essary background for development of cancerous nodules (Sanyal et al., 2010). There-
fore, the persistent infection of HCV and chronic alcoholism leads to the development of
cirrhosis due to perpetual and impaired wound-healing process and during which, the re-
peated repair and regeneration process, can cause genomic aberrations and mutations,
promoters of carcinogenesis. We must be aware that in old individuals this can be even
more problematic, since, due to the aging, the ability of precise DNA repair is depleted,
contributing to cellular aberration (Tsuchishima et al., 2013). Liver cirrhosis can have a
significant impact on liver reserve and is often an integral part of the morbidity and mortali-
ty associated with HCC, reason why the presence and severity of cirrhosis must be diag-
nosed in all patients in order to assess prognosis and decide the appropriated treatment
measures (Sanyal et al., 2010).
Iron is also relevant, as its altered metabolism seen in hereditary hemochromatosis
(HH) is responsible for the excess storage of that metal in the liver and the subsequent
development of liver dysfunction. According to Blonski et al. (2010), several population-
based and case-control studies have demonstrated that HH clearly confers an elevated
risk for the development of HCC. However, the effect of iron excess appears to be inde-
pendent from development of cirrhosis and may interact with alcohol and HBV/HCV infec-
tions (Chuang et al., 2009).
In Southern China and sub- Saharan Africa, dietary ingestion of high levels of afla-
toxin may present a special environmental hazard, particularly in persons chronically in-
fected with HBV (Xia et al, 2013). Aflatoxin B1 (AFB1) is a mycotoxin produced by fungi of
the genus Aspergillus (Aspergillus flavus and Aspergillus parasiticus) that grows readily
on cereals, peanuts and other vegetables stored under conditions of high temperature and
humidity. In animals, AFB1 is a proven powerful hepatocarcinogen, leading the Interna-
tional Agency for Research on Cancer to classify it as a carcinogen. Once ingested, AFB1
is metabolized to an active intermediate, which binds to DNA and cause genetic and epi-
genetic alterations, including the mutation of the p53 and p16 tumor suppressor genes
and DNA hypermethylation. The carcinogenic role of aflatoxins, in particular of AFB1, has
therefore been confirmed and shown to be independent from — and to interact with — that
exerted by HBV infection (Chuang et al., 2009; Blonski et al., 2010; Sanyal et al., 2010;
Serag, 2012).
Other factors have also been incriminated in HCC, including dietary factors, obesi-
ty, diabetes and long-term use of oral contraceptives, as we can verify in the further ex-
amples. As to diet, there is evidence supporting that consumption of yogurt and milk as
well as vitamin supplements offers a protective effect against HCC (Blonski et al., 2010).

INT
RO
DU
CT
ION
9
Several data also have been reported on a potentially favorable effect of coffee on liver
function and liver diseases, including liver cancer (Chuang et al., 2009), by reducing the
risk of cirrhosis, however the involved mechanisms still unclear. Coffee drinking also might
protect against HCC by reducing levels of insulin and thereby the risk for type 2 diabetes,
a risk factor for fatty liver disease, cirrhosis, and HCC (Serag, 2012).
Diabetes, a condition closely associated with obesity (nowadays recognized as a
significant risk for the development of several types of cancers), has been proposed as a
risk factor for both chronic liver disease and HCC. The potential mechanism from obesity
and diabetes to HCC may be through fatty liver or non-alcoholic fatty liver disease
(NAFLD) (Chuang et al., 2009). Sanyal et al (2010) described that NAFLD occurs in the
absence of alcohol use, although the hepatic histology seems to be similar to the one ob-
served in alcoholic hepatitis, with histological alterations including hepatic steatosis, in-
flammation, hepatocyte injury and fibrosis. NAFLD pathological process comprises a dif-
ferent conditions, at first with the presence of fat alone, then plus inflammation, fat plus bal-
looning degeneration, and non-alcoholic steatohepatitis (NASH), the latter being the most
serious form of NAFLD. This ultimate stage, through a process of chronic inflammation
and subsequent hepatic fibrosis, can lead to cirrhosis, which itself is an independent risk
factor for the development of HCC (Sanyal et al., 2010). Despite all this, the impact of
NASH on the incidence of HCC may well be underestimated (Blonski et al., 2010).
The use of combined estrogen–progestogen oral contraceptives (OCs) significantly
increases the risk of liver adenomas, and is associated with the risk of HCC, although the
absolute risk is likely to be small and has been shown in populations at low HBV risk
(Chuang et al., 2009). However, as described by Blonski et al. (2010), benign liver tumors
were hardly observed in young women before the widespread use of oral contraceptives.
He also points to the fact that OCs therapy can to be associated with the development of
benign liver tumors (hepatic hemangioma, hepatocellular adenoma or focal nodular hy-
perplasia) and even of malignant liver tumors, hypothesis that needs to be confirm with
further research. The same author states that it is not frequent malignant transformation
occur within the context of hepatic adenomas and that it is unclear whether the use of
OCs influences the possibility of developing adenoma its malign transformation. To evalu-
ate further the risk of HCC in the setting of OCs use, several observational studies have
been conducted, however, based on its results, it was not possible to achieve a final con-
clusion regarding the association between OCs, the risk of HCC and how such risk is
modified by duration of OCs use (Maheshwari et al, 2007).
Finally, there is a risk of developing liver cancer by exposures to chemical agents,
especially in occupational settings, with both hepatocellular carcinoma and angiosarcoma

INT
RO
DU
CT
ION
10
being associated with diverse “culprit compounds”, even if epidemiological evidence is not
always clear (Bosetti et al., 2003; Uccello et al., 2012); this aspect is further explored below.
Diagnosis
Long-term survival requires the detection of small tumors, often present in asymp-
tomatic individuals, which may be not willing to invasive therapeutic options. Surveillance
of high-risk individuals for HCC is commonly performed using the serum marker alfafeto-
protein (AFP) often in combination with ultrasonography. Diagnosis of HCC often requires
more sophisticated imaging modalities such as computerized tomography (CT) scan and
magnetic resonance imaging (MRI) (Bialecki and Bisceglie, 2005). However, it is sufficient
to establish a diagnosis of HCC combining the finding of: the classic appearance on one
of the imaging modalities (large and/or multifocal hepatic mass with arterial hypervascular-
ity); and elevated serum AFP, against a background of chronic (generally asymptomatic),
generally cirrhotic-stage liver disease. The standardization of diagnosing HCC by non-
invasive imaging has allowed earlier HCC detection and has facilitated the implementation
of surveillance programs (Cabrera and Nelson, 2010; Ferenci et al., 2010).
The definitive diagnosis of HCC depends on histological examination of lesions,
especially in AFP-negative patients. Ultrasound- or CT-guided percutaneous biopsy offers
sufficient tissue for histological diagnosis and the risk of bleeding or seeding of tumor cells
along the needle tract is minimal. In patients with significantly elevated AFP levels who
are potentially eligible for HCC resection or liver transplantation, liver biopsy is not sug-
gested due to the risk of tumor cells spreading before surgery (Hamilton and Aaltonen,
2000).
Treatment
According to Ferenci et al. (2010), treatment approaches depend on the disease
stage at diagnosis (liver function, tumor size, and the presence or absence of metastatic
lesions or vascular invasion) and on access to complex treatment regimens. However,
most of the treatment options are expensive and/or require specialized centers and, unfor-
tunately, advanced disease is not curable, being its management expensive and only
marginally effective in increasing quality-adjusted life years. In most cases, curative treat-
ments are not feasible, limiting the options to palliation. The screening of high-risk popula-
tions is the only way of detecting tumors at a stage at which they are capable of being
treated.

INT
RO
DU
CT
ION
11
There are several potentially curative treatment modalities available for patients
with early stage HCC, including: surgical resection (patients without advanced cirrhosis
and with well-preserved liver function and normal portal pressure), liver transplantation
(HCC patients with decompensated cirrhosis), and local ablation (patients who are not
candidates for surgical treatment) (Kanwal et al., 2012).
The tumor biology of HCC and the co-existing cirrhosis make drug development
more difficult. Fortunately, over the past years, significant progress was made in the eluci-
dation of HCC molecular pathogenesis, which led to the development of molecular-
targeted agents such as sorafenib (Cabrera and Nelson, 2010). As chemotherapy can
reactivate the virus in HBV carriers, patients with HBV or HCV require antiviral therapy to
control viral replication and improve cirrhosis-related outcomes (Sanyal et al., 2010).
Prevention
As stated by Jemal et al. (2011), “A significant proportion of the worldwide burden
of cancer could be prevented through the application of existing cancer control
knowledge, and by implementing programs for tobacco control, vaccination (for liver and
cervical cancers), and early detection and treatment, as well as public health campaigns
promoting physical activity and healthier dietary patterns”. From this basis we can think of
numerous ways to avoid liver cancer, at least for most known etiologies. For instance, one
effective strategy for reducing the risk of HCC is the vaccination against viral hepatitis
(HBV). In contrast to HBV, no vaccine is available against HCV. Therefore, its prevention
measures include screening of blood, organ, tissue, and semen donors for antibodies to
HCV and implementing proper infection control practices during all medical, surgical, and
dental procedures (Ferenci et al., 2010; Jemal et al., 2010). Another relevant prevention
method and probably undervalued, is the health education about viral hepatitis, where
should be emphasizing the ways in which it is possible for the disease to spread in rela-
tion to, as described/grouped by Ferenci et al. (2010): local practices involving blood-
blood contact (circumcision, scarification, tribal marks, and tattoos); care of open sores
and marks after multiple-use tooth extraction equipment; and reuse of needles.
In the cases where the vaccination is not available, prevention procedures include,
among other, screening of donor’s blood for antibodies to HCV and instituting adequate
infection control practices during medical procedures (Jemal et al., 2011). It is also essen-
tial to implement sanitary conditions and reduce the contamination of food with aflatoxins
through adequate food storage system (Chuang et al., 2009). Control of alcohol drinking
and tobacco smoking, adoption of a balanced diet and a not sedentary life to decrease the
levels of obesity, represent others factors to consider (Chuang et al., 2009).

INT
RO
DU
CT
ION
12
It cannot be also forgotten that screening should be encouraged, mainly in regions
in which it is possible to offer curative treatment for HCC. The main risk factors for HCC
are well known, and this allows cost-effective surveillance, being the screening for early
detection of HCC recommended for the groups of high-risk patients. Surveillance must
involve the establishment of screening tests, screening intervals, diagnostic criteria, and
recall procedures (Ferenci et al., 2010).
ENVIRONMENT AND CHEMICAL CARCINOGENESIS
Despite the considerable efforts to decrease environmental pollution, one of the
most serious “worldwide sicknesses” caused by humankind, what we still witness every
day is the continuous and often uncontrolled introduction of new compounds in living and
working environments. The complexity of these problems is huge, but as Fucic et al.
(2012) stated: “The balance between needs of a fast growing human population and tech-
nology/science development is questionable, partially as a consequence that the available
knowledge is not always applied in an efficient way as it should be”.
In the last century, numerous agents have been associated as causes of several
diseases, including cancer, which allow researchers to identify pathological pathways and
point new ways of prevention and treatment. Regarding the pollution related agents, the
solution clearly passes through reducing the pollution and preventing exposure. However,
despite all the scientific advances, including the significant information collected due to the
development of molecular biology techniques, several fundamental questions about the
environmental threats to human health are still without answers (Fucic et al., 2012).
Thus, people (and a vast range of animals, including vertebrates) are continuously
exposed exogenously to varying amounts of chemicals that have been shown to have
carcinogenic or mutagenic properties, reason why over the last decades, scientists have
been studying the impact that these noxious and toxic substances have on human (and
animal) health. Humans are never exposed to only one chemical, by the contrary, every
time they come into contact with a myriad of compounds, which may be absorbed into our
bodies and are never fully eliminated (Yardley, 2004). All of this is caused by our industri-
alized society that has an excessive abundance of toxic chemicals being used in daily
basis in food and environment, everything into an attempt to control nature, for instance
with uncountable pesticides and herbicides or overuse of lasting food. In addition, safety
analysis/toxicity tests conducted on these chemicals are typically done on one single
chemical at a time and do not investigate the cumulative impact numerous chemicals
have in our bodies over many years (Yardley, 2004; Wogan et al., 2004).

INT
RO
DU
CT
ION
13
The influence of the environment can be seen in the differences in cancer rates
throughout the world and the change in cancer rates when groups of people move from
one country to another, indicating that different environmental exposures are linked to
specific types of cancer. As previously stressed, the good news is that a large number of
cancers can be prevented by avoiding risk factors (National Cancer Institute, 2003).
Regarding the chemical carcinogenesis, and according to Bailey et al., 1987;
Rotchell et al, 2008; Vincent and Gatenby, 2008; Irigaray and Belpomme, 2010) there is
an inherent progress that comprises three sequential and successive steps across phy-
logeny — initiation, promotion and progression — being the carcinogens able of assume
different roles:
Initiators can be defined as carcinogens capable to induce a first “driver” mu-
tation in a dividing cell, through direct or indirect mutagenesis, leading to emergence of a
primary clone of mutated cells with a permanent genomic damage. Therefore, initiation
is an irreversible mutation in the DNA of a somatic cell, inducible by experimentation that
confers a permanent increase in susceptibility to cancer formation. Carcinogen exposure
regimes given to fish, for instance, often involve larval and juvenile stages, which are
characterized by rapid growth and sensitivity to such compounds, probably due to very
fast cell division in growing tissues. The morphologic indicator of initiation in liver is the
formation of the so-called foci of cellular alteration (FCA), as will be approached further
on. Although necessary, initiation, the first carcinogenesis step or stage, is not a suffi-
cient condition for the development of the tumor;
Tumor promoters can be classified as non-genotoxic carcinogens that typically
do not directly affect DNA and have an effect that is actually reversible, depending on
the exposure interval. They are capable of causing clonal expansion of initiated cells, by
inducing proliferation of mutated cells, preventing these from apoptotic loss and provid-
ing the acquisition and preservation of additional genetic and/or epigenetic changes. In
the context of liver carcinogenesis, the initiated cells (focal clones) show preferential
growth when compared to nonfocal tissue nearby. In promotion, the so-called reversible
stage of neoplasia, cell proliferation is required for clonal expansion of initiated cells;
Finally, tumor progressors can be considered carcinogens that advance mu-
tated cells from promotion to progression, allowing premalignant mutated cells to irre-
versibly acquire the phenotype of fully malignant cells. Progression can involve the ac-
cumulation of further genetic alterations in a population of initiated cells that have been
provided a growth advantage through promotion. Tumor cell heterogeneity may serve as
evidence of progression, which can result from genetic instability acquired during tumor
progression. If genetic instability is ongoing, these cells are mutated at rates in excess of
those of the surrounding tissue producing subclones — and some of these would be ex-
INT
RO
DU
CT
ION
14
pected to have adaptations that give them a selective advantage. For instance, they
could develop mechanisms to avoid the host’s immune defense system and/or obtain in-
creased invasive capacity, thus enabling the tumor to extend, invade and metastasize.
Animal models in (chemical) carcinogenesis – From mouse to trout
Biomedical research depends on the use of both animal testing and specific animal
models to understand the pathogenesis of human diseases at a cellular and molecular
level and to provide systems for developing and testing new therapies and chemicals. For
many years, animals with cancer have been used as model systems for studying a wide
variety of neoplasms that also occur in human beings. Animals with spontaneously-
developing cancers that are prevalent also in humans, such as lymphoma, bladder can-
cer, and melanoma, are vital resources that facilitate investigations regarding the diseases
pathogenesis and response to treatment (LeRoy, 2013; Lieschke et al., 2007).
Mammalian models, like the mouse, have been pre-eminent in comprehending
human diseases, mainly because of the striking homology between mammalian genomes
and the many similarities observed from anatomy to cell biology and physiology. Ad-
vanced transgenic approaches using dominantly acting disease-causing transgenes have
allowed the creation of mouse models that accurately replicate the pathology of human
diseases, being the generation of cancer models through the tissue-specific expression of
oncogenes a noteworthy example. Furthermore, the development of specific allelic modifi-
cations through gene targeting by homologous recombination has become the mouse the
most broadly used model of human disease (Lieschke et al., 2007).
The history of chemical carcinogenesis is characterized by key epidemiologic ob-
servations, but where animal experiments have also an essential role in the identification
of cancer-causing chemicals. However, after the verification of carcinogenesis at the cellu-
lar level as irreversible process, the target is now the mechanisms by which chemicals
cause cancer and the molecular changes that lead to tumor progression (Loeb and Harris,
2008). Thus, the next step, after the identification of chemical carcinogens in the environ-
ment and occupational settings related to cancer, is the generation of biological markers
to assess altered metabolic pathways and the implementation of new targets for therapy
(Loeb and Harris, 2008). For this, experimental carcinogenesis studies in vivo are essen-
tial. Fishes have being playing a role in this step, since they have received considerable
attention as animal models for the study of chemical carcinogenesis among aquatic toxi-
cologists and cancer biology groups. In addition to generating concern for the health of
specific water populations, the epizootics of cancers in free-living fishes have presented
themselves as useful “laboratories” for exploring chemically mediated carcinogenesis, in
real-world complex scenarios that are relevant to human exposures (Rotchell et al., 2008).

INT
RO
DU
CT
ION
15
Several small fish species have been excellent models for the screening of carcinogens
that are very cost and time effective relative to standard in vivo rodent exposures. Bio-
chemical and molecular mechanisms studies about the metabolism of carcinogens, DNA
damage and repair, and oncogene activation in small and larger fish species, have re-
vealed that many features of these processes are qualitatively shared among fish and
mammalian models, though important, oftentimes species-specific differences have been
observed as well (Rotchell et al., 2008). The rapid advancement of molecular biology is
accelerating the elucidation of these similarities and differences, and their underlying ba-
sis. Relatedly, fish comprise definitely the most diverse class of vertebrates and thus pro-
vide a vast resource for studies in comparative biology (Rotchell et al., 2008).
While fishes have been proposed as valid models in cancer research, one remain-
ing question is how similar are fish and human tumors at the molecular level. Fortunately,
in a very recent study, Lam et al. (2013) performed a comparative analysis of microarray
data from zebrafish liver tumors with those from four human tumor types, and the results
were really interesting, revealing molecular conservation at various levels between the fish
and human tumors. Therefore, based on gene ontology annotation of the putative human
homologs mapped to Zebrafish Liver Tumor Differentially Expressed Gene (ZLTDEGS), a
large number of genes coding for proteins involved in cell cycle/proliferation, apoptosis,
DNA replication and repair, metastasis and cytoskeletal organization, protein synthesis
and liver-specific functions were deregulated, indicating that the zebrafish liver tumors
possess the general molecular hallmarks of human cancer. The results even suggest that
there exist molecular similarities between zebrafish and human liver tumors that extends
to tumor progression. In the end, this singular study provides strong molecular evidence
highlighting the potential of zebrafish for modeling human liver cancer (Lam et al., 2013).
According to Rotchell et al. (2008) and the New Jersey Association for Biomedical
Research (2012), the first event that triggered and supported the use of the trout as model
was in early 1961, when an outbreak of liver cancer among middle-aged rainbow trout
raised in fisheries that began to spread, bordering rapidly on epidemic proportions. The
alarmed fish farm owners blamed everything from pesticides to water sources, and only
later it was suspected about the food and realized that aflatoxins in pelleted hatchery
foods were the cause of the liver tumors. Both humans and rainbow trout are susceptible
to a byproduct of Aspergillus molds, the aflatoxin B1, a potent carcinogen, as previous
cited. Only then scientists recognized the potential of this accidental discovery and these
epizootics of liver neoplasms became the first instance in which the occurrence of fish
tumors led to the recognition of a new family of chemical carcinogens. After this, world
watched the beginning to a rapid succession of investigations of neoplasms in fish up to
the present time.

INT
RO
DU
CT
ION
16
Thus, if liver cancer could be consistently induced in rainbow trout after exposure
to environmental carcinogens that also affect humans, like aflatoxin B1, it could effectively
make liver cancer subjects more available for a wide a potentially wide range of studies.
Therefore, the rainbow trout has been evaluated experimentally, being a highly sensitive
animal for the detection and bioassay of the hepatocarcinogenic action of chemicals, all
studies indicating that it is an ideal species for the analysis of the histo- and cytogenesis,
additionally being perhaps, as recently investigated, a multi-organ carcinogenesis model
(Rotchell et al., 2008; New Jersey Association for Biomedical Research, 2012).
Although being different from humans in many ways, rainbow trout, as other fishes,
share key similarities in both patterns of gene expression and mutations that precede
cancer and metabolic systems. There are several studies supporting this fact and that
over the years have shown that many mechanisms important to carcinogenesis are similar
in trout and mammals, e.g., pathways for metabolic activation, production of mutagenic
DNA adducts, activation of oncogenes, etc. (Williams et al., 2003). Rainbow trout is actu-
ally viewed as an ideal model in liver disease because it presents advantages like: its rela-
tively inexpensive character allows the significant increase of the study cases, since its
purchase and per diem costs are a fraction of that spent with rodents; remarkable sensitiv-
ity to a number of human carcinogens; and, not less importantly, it has a low spontaneous
tumor incidence (approximately 0.1%) (Williams et al., 2003; William et al., 2009). Besides
AFB1, other environmental chemicals, like mycotoxins, polyhalogenated biphenyls (PCBs)
and other aryl hydrocarbon receptor (AHR) ligands, promote liver cancer in trout, causing
for instance, oxidative stress (Williams, 2012). Finally, natural estrogens, xenoestrogens
(“xeno” means “foreign”, so xenoestrogens refers to “foreign estrogens”), and phytoestro-
gens (plant-derived xenoestrogens) can be liver tumor promoters in this model as well
(Williams, 2012).
In summary, the low husbandry costs, the quickly maturation, which facilitates the
production of large numbers of fairly uniform animals, the high responsiveness and low
background incidence of this trout tumor model makes it an excellent choice for conduct-
ing statistically challenging studies. Besides that, fish liver histopathology is a very useful
biomarker of contaminant exposure and a notable tool in chemical toxicity and carcino-
genicity testing, serving this animal model as environmental indicator as well as surrogate
for human health problems (Dyk et al., 2012; Hobbie et al., 2012).
If the rainbow trout is a well-established model organism for experimental cancer
research, the other common salmonids are not properly explored yet, such as the case of
brown trout (Salmo trutta), originally an European species (Lerceteau-Köhler et al., 2013).
Yet, this trout species is also readily available and is viewed as having a major economic
and scientific relevance from a long time (Baglinière, 1999), besides it use as bioindicator

INT
RO
DU
CT
ION
17
species or as experimental organism (e.g., Havelková et al., 2008; Valton et al., 2013).
The first published data on liver carcinogenesis using brown trout appeared only recently
(Santos et al., 2013), and so much remains to be explored with this promising “brown trout
European cancer model” that could complement the “rainbow trout USA cancer model”.
Influence of xenoestrogens in cancer and specifically in liver cancer
Over the past years, environmental health and oncology have demonstrated an in-
creasing interest in estrogens as evolutionary conserved molecules, since, thanks to its
endocrine, paracrine, and neurotransmitting activity, estrogens role is not limited to the
regulation of the reproductive system. The distribution of estrogens receptors in mamma-
lian tissues suggests that it could have a significant role in regulating a number of path-
ways during growth, differentiation and development (Fucic et al., 2012). This fact is a
consequence of the estrogens capacity to regulate transcriptional activation of several
molecules involved in key cellular processes such as generation of immune responses,
cell proliferation and apoptosis through functional receptors localized in various sub-
cellular organelles (Kalra et al., 2008). Additionally, these steroid hormones are critical
regulators of various physiological processes in other tissues, so called nonclassical es-
trogen targets (bone, liver, kidney, cardiovascular system, spleen, lung, and brain). The
majority of the biological estrogens action in humans and other vertebrates is mediated by
two distinct, differentially expressed intracellular receptors, estrogen receptor alpha (ERα)
and estrogen receptor beta (ERβ), which are considered uncommonly receptors, having
affinity with environmental contaminants and pharmaceuticals (Benninghoff and Williams,
2008). The composition of estrogens includes a total of nine chemically different steroids,
being the three major ones the 17β-estradiol (E2), estrone (E1), and estriol (E3) (Chang et
al., 2011).
Every day, during their normal routine, population is exposed to a number of hor-
monally active compounds, introduced in the living environment in the last few decades,
being the majority of them xenoestrogens. Polycyclic aromatic hydrocarbons (PAH), pesti-
cides, polychlorinated biphenyl (PCB), dichlorodiphenyl-trichlorethane (DDT), some drugs,
cotinine, phytoestrogens, mycotoxins, bisphenol A, phthalates, alkylphenols, and metal-
loestrogens are the examples of some chemicals that mimic oestrogen action, affect its
levels, or bind to its receptors (Yardley, 2004). So, this leads to the possibility of these
estrogen mimickers interfere with the natural and normal circulating level of estrogens;
disrupt hormone balance and menstrual cycles; affect prostate health; contribute to prob-
lems with fibroids, endometriosis, uterine cysts, and polycystic ovary syndrome; and dam-
age ova and sperm (Yardley, 2004).

INT
RO
DU
CT
ION
18
Xenoestrogens are also present in a number of substrates such as cigarette
smoke, automobile exhaust, chemical industry pollutants, grilled meat, volcano dust, for-
est fire smoke, milk, water, and cosmetic products (e.g., parabens, cyclosiloxanes) (Fucic
et al., 2012). Some of these products are not biodegradable and remain in our environ-
ment for long periods of time, and the danger is its introduction into the food chain and
eventually its consumption by larger animals and humans (Yardley, 2004). Several animal
species have been suffering from reproductive complications over years, which clearly
assume high proportions in polluted areas (Fucic et al., 2012; Ptak et al., 2013). As to
humans, individual jobs can put them in risk because in certain occupations they are more
likely to come into contact with and absorb specific toxicants: carpenters, auto mechanics,
photographers, staff in the clothing and textile industry, workers involved in manufacturing
synthetic hormones, laboratory technicians, commercial fisherman, painters, furniture
workers, dentists, farmers administering hormones to livestock, electrical workers, potters
and radiologists (Yardley et al., 2004).
Human and animal exposures to xenoestrogens have been associated to liver
cancer, besides the reproductive system implications, with the development of abnormali-
ties and risk increase of breast and ovary (Benninghoff and Williams, 2008). In fact, there
are new evidences confirming xenoestrogens strong impact on carcinogenesis, by its in-
volvement in key cellular processes such as apoptosis, cell cycle, proliferation, oxidative
stress and inflammation (Kalra et al., 2008; Fucic et al., 2012). Therefore, xenoestrogens
can play a critical role in the etiology since the binding to the ERα/β receptors, amplifies
signals in either genomic, nongenomic, or mitochondrial ER-mediated signaling pathways
that lead to increased cell proliferation and inhibition of apoptosis and consequently to
uncontrolled cell division and tumor promotion (Chang et al., 2011). In other hand, the
products of estrogen metabolism, mainly occurred in the liver, damage DNA by forming
adducts and oxidized bases, provoking mutations in oncogenes and tumor suppressor
genes that normally control cell growth and proliferation (Ptak and Gregoraszczuk, 2013).
As described by Ptak and Gregoraszczuk (2013), the classic estrogen receptors
(ERs) are nuclear hormone receptors that act as transcription factors, regulating genes
implicated several processes like homeostasis, development and metabolism. The classic
mechanism of ER action implicates the binding of ER to its ligand, leading to the receptor
dimerization, interaction with consensus estrogen-response elements (EREs), and re-
cruitment of transcriptional co-regulators, which results in the formation of a complex that
modulates the transcription of estrogen target genes. Microarray studies have been identi-
fied numerous genes with diverse functions in energy production, cell growth, cell cycle
regulation, and cytoskeleton organization, whose expression is induced or repressed by
estrogen (Ptak and Gregoraszczuk, 2013). Because of its ability to regulate gene expres-

INT
RO
DU
CT
ION
19
sion, estrogens can function as a potent stimulus for proliferation and inhibition of apopto-
sis, which may lead to the development of cancer, including HCC, where assumes a rele-
vant role in accelerating hepatocarcinogenesis and tumor progression. The mechanisms
may vary, and may involve the Bcl-2 family of proteins, which regulates one of the key
steps in the conserved apoptotic pathway; among the members of this family, Bcl-2 and
Bcl-xL act as inhibitors of apoptosis. Ethinyl estradiol (EE2), a common component of
OCs because it is a synthetic mimic of the major endogenous estrogen in humans, i.e.,
17β-estradiol (E2), is known to increase the levels of Bcl-2 protein in cultured female rat
hepatocytes (Kalra et al., 2008; Ptak and Gregoraszczuk, 2013).
Moreover, ER signaling can also result from a ligand-dependent, non-genomic (ex-
tra-nuclear) way, which involves the activation of other signal transduction pathways that
leads to fast responses to estrogens exposure. This mechanism is not yet fully under-
stood, but is potentially mediated by a membrane-associated receptor and can involve the
activation of the mitogen-activated protein kinase (MAPK) or phosphoinositide-3-kinase
(PI3) kinase signaling cascades, fluctuations in intracellular calcium, or stimulation of
cAMP production, being MAPK and PI3 pathways responsible for cell proliferation and cell
survival (Ptak et al., 2013). Deregulations of cell proliferation, differentiation, and apopto-
sis may allow the emergence of mutations in proto-oncogenes and tumor suppressor
genes to survive and expand clonally (Ptak and Gregoraszczuk, 2013).
This possible convergence of genomic and non-genomic actions at multiple re-
sponse elements provides an extremely fine degree of control for the regulation of tran-
scription for ERs and the crosstalk between the genomic ER signaling cascades and ki-
nase transduction pathways has a significant implication as a valuable therapeutic target
to control ER-mediated cell proliferation and tumor growth (Chang et al., 2011).
In addition to genomic and non-genomic actions of estrogen mediated by nuclear
and membrane ER, mitochondria has also recently been identified as important target of
estrogen and ERs, since both ERα and ERβ have been reported to be present in the mi-
tochondria of human HepG2 cells (Kalra et al., 2008). The mitochondrial genome has
been shown to contain sequences that have partial homology to the estrogen responsive
elements and results even suggest that estradiol is directly involved in the regulation of
mitochondrial RNA transcription. The regulation of apoptosis and oxidative metabolism by
estrogens in mitochondria also undertakes a role in the normal liver and in the develop-
ment of HCC (Kalra et al., 2008).
Regarding the genotoxic effects via oxidative estrogen metabolism, Chang et al
(2011) referred that the estrogen metabolites react with DNA leading to the mutations re-
sponsible for the initiation of cancer, being quinoids and hydroxyl radicals generated dur-
ing the oxidative estrogen metabolism responsible for inducing oxidative DNA damage.

INT
RO
DU
CT
ION
20
Thus, as cited earlier, there is a possibility for the involvement of OCs in liver neo-
plasia, since nuclear ERs are present in the hepatocytes and are increased in HCC, point-
ing for a hormonal responsiveness of hepatic neoplastic tissue (Maheshwari et al., 2007).
In this context, estrogens may cause liver neoplasia by increasing proliferation and spon-
taneous mutations rates. Estrogenic direct genotoxicity is also possible because physio-
logically achievable concentrations of estrogen or estrogen metabolites have been shown
to generate reactive oxygen species (ROS), which can increase genomic instability (Okoh
et al, 2011). Its metabolites, quinones, cause the formation of DNA adducts, depurination,
lipid-derived aldehyde-DNA adducts, and aneuploidy (Maheshwari et al., 2007; Fucic et
al., 2012).
Additionally, recent in vitro study also suggests the ER involvement in many cellu-
lar events both connected as well as in interaction with viral proteins in hepatitis B virus
(HBV) and hepatitis C virus (HCV)-induced HCC (Kalra et al., 2008).
Estrogens: the other side of the coin
As emphasized by Shimizu and Ito (2007), clinical observations and death statis-
tics support that chronic hepatitis C and B seem to progress more rapidly in males than in
females, and that cirrhosis is mostly a disease of men and postmenopausal women. Dif-
ferences in the social environment and lifestyle of men and women may be involved in the
basic mechanisms underlying the sex-associated differences of these chronic liver dis-
eases, since, in general, it is more probably that men come into contact with a hepatitis
virus and have an problematic addiction to drinking. Those authors also affirm that even
environmental features of the male gender may lead to a greater preponderance towards
nutritional and exercise problems for men. However, it cannot be forgotten that some
mechanisms of the sex-associated differences may be based on biological factors, includ-
ing estrogenic effects of female sex hormones, rather than on gender differences in the
social environment and lifestyle.
In contrast with the data stated above, other studies (Mendelsohn and Karas,
1999; Omoya et al, 2001; Tian et al, 2012) highlighted the protective role of estrogens in
several pathologies, including HCC. They suggested that estradiol treatment, for instance,
can reduce hepatic steatosis and restore the impairment in mitochondrial and peroxisomal
fatty acid β-oxidation in aromatase-deficient mice which lack intrinsic ability to produce
estrogens. Furthermore, estradiol treatment was also shown to result in a dose dependent
suppression of hepatic fibrosis in hepatic fibrosis models of male rats (Kalra et al., 2008).
INT
RO
DU
CT
ION
21
It was noteworthy to Shimizu et al. (2007) that E2 and its derivatives (namely 2-
hydroxyestradiol) are strong endogenous antioxidants that reduce lipid peroxide levels in
the liver and serum. In the work, those authors suggest that E2 may protect hepatocytes
from oxidative damage, inflammatory cell injury and cell death by induction of Bcl-2 ex-
pression, and by preventing macrophage accumulation and inhibiting proinflammatory
cytokine production. In short, the study demonstrated that E2 production and ER status
may play a role in hepatic defense and even have beneficial properties on the progression
of chronic liver disease. However, it should be noted that, for further experiences, the ad-
ministration of E2 per se in women poses some potential risks, including breast cancer
and endometrial abnormalities, for the individual but also even for offspring generations
initially noted more recently emphasized too (Shimizu et al., 2007; de Assis et al., 2012).
Form the above, it seems crucial to proceed with the liver studies in the context of
sex hormones and their receptors and understand the true role of the estrogens in hepatic
disease and what differentiates the carcinogenic effect from the protective roles.
PRE-NEOPLASTIC LIVER LESIONS - FOCI OF CELLULAR ALTERATIONS (FCA)
In 1935, Sasaki and Yoshida were the first ones to verify that FCA precede the oc-
currence of chemically induced liver tumors and ever since that they have been centers of
interest. FCA have been considered as the earliest emerging distinct phenotypic paren-
chymal changes indicating carcinogenic response in chemical liver carcinogenesis. There-
fore, these preneoplastic lesions have no neoplastic nature but are capable to increased
risk of developing into either benign or malignant tumors through an ordered sequence of
phenotypically distinct lesions, and may be used to determine thresholds of effects of both
genotoxic and non-genotoxic carcinogens (Enzmanna et al., 2013).
Banasch et al. (2003) sustained that there is not any hepatocarcinogenic agent
which does not elicit FCA (in the original named foci of altered hepatocytes – FAH), nor is
there any model of hepatocarcinogenesis without formation of these lesions prior to the
manifestation of benign or malignant hepatocellular neoplasms. This presumption is
based on the phenotypically similar preneoplastic lesions identified in human chronic liver
diseases associated with, or predisposing to, HCC, irrespective of their etiology including
chronic viral infections and a few defined chemicals. The striking similarities in the pheno-
type of FCA across all species investigated appears to be of relevant advantage for both
mechanistic studies and the extrapolation of observations in animals to human beings
besides the well-known obstacles in interspecies comparisons of toxicodynamics, toxi-
cogenomics, and pathobiological processes. Lesions that resemble FCA have been ob-
served fortuitously in the liver of women with long-term use of oral contraceptives and in

INT
RO
DU
CT
ION
22
other pathologic conditions, particularly in the context of genetic hemochromatosis (Su et
al., 1997; Banasch et al., 2003).
The detection of phenotypically similar FCA in several animal models and in the
human liver does not only favors extrapolations from data across species, but, in our view,
also opens new perspectives for secondary prevention of human HCC. Anyway, FCA as
exactly seen in rats and other are now resonated as counterparts of human liver cell dys-
plasias, named as small vs large cell changes (Thoolen et al., 2012). Thus, besides the
discovery of risk factors for neoplastic development, which is a prerequisite for primary
prevention of cancer, the detection of preneoplastic alterations in the human liver is a
premise for new approaches to secondary prevention of hepatic cancer (Banasch et al.,
2003).
Hepatic FCA in fishes are included in a range of toxicopathic neoplastic, putative
pre-neoplastic, and non-neoplastic lesions that have been studied in connection with the
use of histological/histochemical biomarkers of toxic injury, dysfunction, and carcinogenesis
(Feist et al., 2004). Considering that field and experimental studies have consistently
demonstrated causal associations between exposure to xenobiotics and the development
of FCA, along with other toxicopathic hepatic lesions, such lesion represent sensitive and
reliable biomarkers not only of one individual condition but they more broadly often serve
to assess the health of wild fish populations or even as proxies of the ecological status
(Feist et al., 2004).
FCA — Histological types
The continuous pathological process of hepatic neoplasia leads to the proliferation
acceleration and formation of monoclonal populations: this is the hallmark of all prene-
oplastic lesions and takes place also in HCC. Thus, liver FCA represent the first discrete
step, morphologically identifiable, in the possible evolution to carcinoma, since it is com-
posed by differentiated hepatocytes that have acquired molecular aberrations and
changed their metabolic properties, a kind of instability that may allow the progress to ma-
lignant, as mentioned before (Avellini et al., 2013).
FCA stand out as aggregates of hepatocytes with abnormal morphology and stain-
ing characteristics, which differentiate them from the surrounding parenchyma. In fish —
and following the same general criteria as defined for rat and mouse — all categories can
be (at least in theory) recognized using the following general morphological criteria (Feist
et al.,2004; Koehler, 2004; Blazer et al., 2006; Thoolen et al., 2010; Laroche et al., 2013):
Focal lesion of ten or more cells in diameter with no upper size limits;
No evidence of compression of the surrounding tissue;

INT
RO
DU
CT
ION
23
Continuity of the tubular-like structure with the surrounding hepatic parenchyma
and normal trabecular architecture;
Trabecular aspect, due to the increasing of the vascularity and/or neoangiogenisis;
Mitotic figures, macrophage aggregates, exocrine pancreatic tissue and bile ducts
are were or absent;
Features of cellular atypia (particularly increased nuclear to cytoplasmic ratio, nu-
clear pleomorphism, nucleolar enlargement, or even the presence of coarsely
clumped chromatin) are not generally evident.
Lesions fulfilling the above morphological criteria can be further distinguished by
variations in their cytological appearance and staining properties in hematoxylin and eosin
stained (H&E) sections. Typically, authors divide the foci in clear, vacuolated, eosinophilic
and basophilic, irrespective of nuances and other potential classifications. Authoritative
descriptions of FCA can be found, e.g., in Boorman (1997), or Feist et al. (2004), or Koeh-
ler (2004), or Blazer et al. (2006). Based on these works, in the Sections below we sum-
marize the relevant features.
Clear cell foci
Clear cell foci consist of hepatocytes with diffusely pale and finely vacuolated cyto-
plasm, which can be recognized by the “ground glass” appearance. This is indicative of
increased glycogen storage within these cells. Hepatocyte nuclei in these foci are charac-
teristically centrally placed. Some authors also reported prominent cell membranes, which
can be confused with cytoplasmic content pressed to the periphery because of the vacu-
oles.
Occasionally, in these lesions the cytoplasm may be slightly eosinophilic, making it
difficult to distinguish them from an eosinophilic focus. The Periodic acid-Schiff (PAS)
technique, which demonstrates glycogen and other mucopolysaccharides, may be useful
for the correct diagnosis of certain clear cell foci. However, it should be remembered that
glycogen may be partially lost through the normal histological preparation process. Clear
continuity of the foci cells with the surrounding parenchyma is often difficult to visualize in
this lesion type, due to the constituent cells being frequently enlarged with cytoplasmic
vacuoles.
Apropos, it is relevant to point that the role of clear cell foci in hepatocarcinogenesis
is elusive and poorly described, although metabolic changes in carbohydrate metabolism
have been associated with HCCs in both humans and rodents (Thoolen et al., 2012).

INT
RO
DU
CT
ION
24
Vacuolated foci
Vacuolated cell foci are round to irregular, blend into the surrounding parenchyma
without compression, and contain hepatocytes with clear lipid cytoplasmic vacuoles of
varying sizes. As described above for glycogen, most lipids are lost during routine histo-
logical processing but can be demonstrated using frozen sections stained with (e.g.) Oil
Red O. Because cytoplasmic lipids are often present in a microvesicular form, at low
magnification the vacuolated foci may resemble the clear ones. As in these, the continuity
of vacuolated foci with the surrounding liver parenchyma may be difficult to discern. Unlike
hepatocytes in clear cell foci, the nuclei of hepatocytes in vacuolated foci tend to be dis-
placed eccentrically to the cell margins.
Eosinophilic foci
As described by Feist (2004), the slightly enlarged — despite no quantitative study
about this was made — and polygonal hepatocytes in this foci have affinity for eosin (aci-
dophilic staining), with their constituent hepatocytes appearing pale to dark pink in H&E
stained sections. This staining depends on the quality of the fixation of the tissue and the
degree of differentiation used during the staining procedure. Although the degree of eo-
sinophilia can vary, the foci should always appear relatively more eosinophilic than the
surrounding tissue. The cytoplasmic eosinophilia is indicative of proliferation of the smooth
endoplasmic reticulum within affected cells. There is little or no variation from normal cy-
tomorphology and there is an absence of basophilic cytoplasmic fibrils. The works cited
above for the other type of foci offer authoritative descriptions.
Basophilic foci
Basophilic foci form round to irregular clusters, and in some lesions constituent
cells may be smaller than adjacent ones. The basophilia of the altered cells is due to the
proliferation of rough endoplasmic reticulum and the cytoplasm is densely crowded by free
ribosomes. Although the degree of basophilia can vary, as for the eosinophilic foci, the
hepatocytes of the basophilic foci should always appear relatively more basophilic than
the surrounding tissue. Regarding the adjacent unaffected hepatic tissues, there is no
evidence of compression. Moreover, the observed of hepatocytes atypia is slight or inex-
istent, and mitotic figures are generally absent.

INT
RO
DU
CT
ION
25
Amphophilic foci
These foci contain hepatocytes with both eosinophilic and basophilic tinges in the
cytoplasm.
The progression and fate of FCA
After the emergence of FCA, the subsequent step (morphologically defined) is rep-
resented by the formation of dysplastic nodules. In these lesions, it is probable that genet-
ic and epigenetic mutations lead to a proliferative advantage for altered hepatocytes and
to the involvement of several regulatory pathways in simultaneous disorders favoring the
passage from dysplastic to neoplastic lesion. This way, the subsequent step is the devel-
opment of hepatocellular carcinoma, which can be further classified into well differentiat-
ed, moderately differentiated and poorly differentiated tumors (Avellini et al., 2013;
Youness et al., 2013).
Regarding the evolution of FCA themselves, Banasch et al (2003), Koehler (2004)
and Enzmanna et al. (2014) defended that the process implies a sequential morphological
changes of hepatocytes during the early phase of carcinogenesis. The earliest stage was
proposed to be the vacuolated/eosinophilic foci (glycogenotic clear and acidophilic
hepatocytes, showing a rich smooth endoplasmic reticulum). Consequentiality, supposed-
ly occur a transition to, or new formation of basophilic foci (glycogen-poor and homogene-
ously hepatocytes, rich in ribosomes). In these proposed sequence of events, the vacuo-
lated and eosinophilic foci are precursor lesions of basophilic foci. Furthermore, the ap-
pearance of a basophilic cell type is a preneoplastic stage, because this cell type persists
during cancer progression and is the main cell type in hepatocellular carcinomas. Summa-
rizing, there is evidence that an ordered sequence of phenotypically distinct lesions leads
from clear to basophilic cell foci and finally to tumors. However, from fish to humans there
is still controversy about the correct kinetics and fate of the pre-neoplastic hepatic chang-
es (Thoolen et al., 2012; Santos et al., 2013); thus calling for more studies.

INT
RO
DU
CT
ION
26
OBJECTIVES
1. To confirm the triggering of liver carcinogenesis in brown trout by the use of a simple
assay, based on bathing eye-egged embryos for 1 hour in solution of a reference genotox-
icant (MNNG), either or not followed by exposure to presumptive promoters;
2. To confirm the hypothesis that estrogenic stimuli can act as promoters of (at least) liver
pre-neoplastic lesions in brown trout, by chronically exposing initiated fish either to 17α-
estradiol or to a mixture of two industrial xenoestrogens of the alkylphenols family;
3. To diagnose the lesions that appeared after the experiment of initiation followed by ex-
posure to estrogens, and to estimate the sample prevalence of the lesions in each exper-
imental condition, for concluding about any sort of differential promotion effect;
4. To implement a stereological study targeting selected parameters that could clarify the
hypothesis that the different experimental conditions tested would induce various out-
comes, both as to the relative lesions extension in the liver and the structure of the
hepatocytes and capillary network integrating the anticipated various types of lesions;
5. To start investigating the hypothesis that the onset of a liver neoplastic process, and
presence of pre-neoplastic and/or neoplastic lesions, alter the parenchyma that seem oth-
erwise normal, to the point of impacting on size-related parameters of hepatocytes;
6. To contribute to the continuous effort of generating data that may be useful for the dif-
ferential diagnosis of the early lesions appearing during liver carcinogenesis in fish, name-
ly by combining standard staining with histochemistry and immunohistochemistry;
7. Finally, as an additional aim, we take the opportunity of this study to implement a paral-
lel diagnosis approach using conventional microscopy and whole digital slides, to see
whether or not the digital histology could match or surpass the standard approach.

MA
TE
RIA
LS
AN
D M
ET
HO
DS


MA
TE
RIA
LS
AN
D M
ET
HO
DS
29
MATERIALS AND METHODS
EXPERIMENTAL SET UP AND ASSAY
Hepatocarcinogenesis induction was made in brown trout (Salmo trutta f. fario)
embryos, and used N-methyl-N’-nitro-N-nitrosoguanidine (MNNG) as the initiator agent. In
summary, eyed-eggs were waterborne exposed to 50 ppm of MNNG (1 hour). Fish em-
bryos were then kept in standard hatching-incubator troughs for salmonids, under routine
husbandry conditions for trout, implying manual removal of any dead embryo, tank clean-
ing and continuous pristine freshwater supply. Eight-weeks later, 4 fish groups were ex-
posed (for 8 months) to the next nominal conditions: 1) 0.001% of ethanol saline (used as
dissolving vehicle for the other tested compounds) 2) 5 µg/L of 17β-estradiol (E2); 3) 50
µg/L of E2; 4) 500 µg/L of alkylphenol mixture (250 µg/L of nonylphenol + 250 µg/L of bu-
tylphenol). One additional group was formed, not exposed neither to MNNG (despite be-
ing subjected to the exact same manipulation, but only being exposed to water) initially
nor to any other compound; this made a complete blank control. All reagents used were
from Sigma-Aldrich.
Each condition was run in duplicate, in well-aerated tanks with dechlorinated high
quality filtered groundwater, closing the water-circuit, but keeping water circulation with a
pump and with the water continuously passing by sponge filter to remove particulate mat-
ter. Water parameters were monitored every other day to confirm they were under good
conditions for salmonids (Salmonid Water Quality Standards, 1988; Klontz, 1991). The
water was fully renewed every 48 hours, taking the opportunity to reconstitute the nominal
concentrations of each tested compound (inc. in the vehicle only group). In the end, and
after being captured with a fishnet, every fish was painless euthanatized with an overdose
of ethylene glycol monophenyl ether, within a well aerated 5 L plastic bucket. The fish
from the different groups did not differ in mass, weighing about 19 g (CV = 0.60).
The assay was made according to the European legislation, following guidelines of
the European Union Council and the national law.
HISTOLOGY
After death, each animal was immediately dissected to extract the liver. After exci-
sion, the organ was sliced into 2-4 mm thick slabs that were fixed for 24 h in 4% buffered
formaldehyde. Then, the slabs were routinely processed for paraffin embedding, sec-

MA
TE
RIA
LS
AN
D M
ET
HO
DS
30
tioned (≈ 4 µm in thickness) in a rotary microtome, stained with hematoxylin–eosin and
mounted with DPX (Sigma-Aldrich) for histopathological classification of the FCA, estimation
of their prevalence, and register of eventual other abnormal features. Slides were studied
at light microscopy (without the observer knowing the group) and, for archiving selected
representative lesions, images were taken with a color cooled digital microscope camera.
QUALITATIVE ANALYSIS AND STEREOLOGY
For qualitative assessment, a blind assay was implemented, where the observer
(Sara Pereira) did not know neither the slides identification nor to which group they be-
longed. The analysis was in two phases, being the first essential to pursue the second one:
(1) In the first one, using the optical microscope, the livers were classified regard-
ing the (1.1) seemingly normal parenchyma (basophilic, intermediate or vacuolated), (1.2)
number and phenotype of FCA (basophilic, amphophilic, eosinophilic, clear and vacuo-
lated cell), which were judged as FCA only when having the characteristics described in
the Introduction of this Dissertation, including having at least 12 cells observable, and
(1.3) preferential localization (none, perivascular or peripheral);
(2) In a second stage, the FCA were reanalyzed, concerning their type, targeting
also pre-lesions that, according to our criteria, could not be properly classified as FCA
(see Results), measuring the area of each and every lesion against the total area of all the
sections used per animal; by the Delesse principle, the relative areas are typically unbi-
ased estimates of the relative volumes (VV) (Howard and Reed, 2005).
The measurement of the areas was executed through scanned slides, which re-
sulted from the utilization of the Olympus VS110 virtual slide scanning system. Before
loading the slides into the device, they were carefully clean (because any residue could
interfere with the focus plan) and, consequently, with the final resolution of the digital im-
age. (One of the greater advantages of the used model is the 100-slide robotic loader for
automated scanning, so the slides can be selected sequentially and an integrated barcode
scanner ensures that metadata is automatically loaded and linked with each slide’s virtual
image. This particularity allowed us to program the machine for scanning overnight.) All
the slides previously diagnosed were scanned and all the sections of vehicle control, al-
kylphenols and E2 5 µg/L groups were analyzed, measuring both the total area and FCA
areas. Regarding the E2 50 µg/L group, and facing the higher frequency of lesions, de-
spite all slides were scanned, the sections to be measured were systematically selected
(with a random number for picking the first section); typically, half of the sections were
sampled for measurements of areas. These were made with two tools: a) free hand poly-
gon (the operator circumvents freely the area, used for the FCA); and b) magic hand (the

MA
TE
RIA
LS
AN
D M
ET
HO
DS
31
operator clicks in the section and the program automatically circumvents it, obtaining easi-
ly the total area). The values were exported to Microsoft Excel for required computations.
NORMAL PARENCHYMA: WITHOUT LESIONS VS WITH LESIONS
Another fundamentally interesting studied aspect herein was the search for even-
tual differences between the hepatocytes making the normal parenchyma of animals with-
out lesions (control group that was not exposed to MNNG) and those making the seem-
ingly normal hepatocellular parenchyma areas of fish with lesions (belonging to the re-
maining four groups). Three stereological parameters for sizing were estimated: (1) num-
ber-weighted volume of the hepatocyte - (hepatocyte), (2) number-weighted volume of
the hepatocyte nucleus (nucleus), and (3) volume-weighted volume of hepatocyte nu-
cleus – (nucleus). In all cases, we used a systematic sampling approach in the selec-
tion of the fields for the stereological analysis, which was performed with a workstation
that comprised a microscope (BX-50, Olympus equipped with a 100× oil immersion objec-
tive (NA 1.30, UPlan, Olympus), a CCD video camera (Sony) connected to a PC monitor
and a motorized stage (Prior) for stepwise displacements in x–y directions; the work-
station was controlled by the software CAST-Grid (Version 1.5, Olympus, Denmark).
The (hepatocyte) and (nucleus) were estimated using the nucleator in one
thin section method (Moller et al., 1990), previously validated for our material under study
(unpublished data). The nucleator method uses a fixed point which is sampled using the
disector principle (Sterio, 1984), which gives every particle no matter the size or shape an
equal probability of being sampled. It is an efficient way to estimate the number-weighted
mean volume, possessing the particles a single identifiable point-like inclusion — at the
cellular level, an ideal inclusion is the nucleolus. In this technique, an unbiased estimate of
the number-weighted mean volume is derived, based on one or two isotropic lines that are
drawn from the nucleolus to the nuclear or cellular border (central point to the particle
boundary) (Mayhew, 1992; Mayhew and Gundersen, 1996; Marcos et al, 2012). We used
herein a simplified procedure (“single-section nucleator”), based on the nucleator (with two
lines), in all liver cell for which the nucleolus (typically one) was evident in the thin section.
The adopted sampling step for the inherent meander sampling was X,Y = 900 µm, in are-
as of normal parenchyma, it was X = 60 µm and Y = 40 µm in smaller FCA (up to a sec-
tioned area of ≈ 80 000 µm2), and, at last, it was X = 120 µm and Y = 80 µm in other FCA.
From measurements of the isotropic lines, volumes were estimated by the next formula:
(
)

MA
TE
RIA
LS
AN
D M
ET
HO
DS
32
The (nucleus) was estimated by the point sampled intercept method (Gundersen
and Jensen, 1985). This parameter is useful for analyzing certain structural changes of
pathological processes, as alterations in the size and/or size distributions of cells and their
nuclei (Mayhew, 1992). Thereby, the method simultaneously quantifies the nuclear size
and pleomorphism, technically involving: sampling the particles (cells or nuclei) according
to their volume, by overlaying a grid of points at random; drawing of a line from the point
to the particle border, in an isotropic direction, for each particle hit by a point; drawing of a
second line in the opposite direction and measuring of both distances using a rule, in a
linear or a non-linear scale.) For the areas of normal parenchyma the sampling step was
set to X,Y = 1000 µm, for the small FCA (up to a sectioned area of ≈ 80 000 µm2) the setp
was X = 60 µm and Y = 40 µm, and, finally, for bigger FCA the step moment was X = 120
µm and Y=80 µm. Herein the all procedure was semi-automatically implemented via the
cited CAST-Grid system, being the volumes derived by the next formula:
(
)
In the end, and in order to obtain information about the nuclear size variation, the
coefficient of variation (CV) of the nucleus in the number-weighted distribution was given
according with the following formula (Gundersen and Jensen, 1985):
CV = √
In addition to the above volumes and related parameters, we also estimated herein
the relative volumes (VV) — also named volume densities — of the nuclei of the hepato-
cytes and of the sinusoidal lumina in relation to the FCA. This estimates we made using a
classical manual technique based on point counting (Thompson, 1930; in: Howard and
Reed, 2005). For this we also used the mentioned CAST-Grid system, were a virtual grid
with a total of 81 points was laid down over fields within the FCA (the reference space of
the estimates). From all the grid point only 9 were used just for the reference space. The
final estimates were computed using the following formula:
∑
∑
In the above formula, ∑P(structure of interest) corresponds to the point fallen over
either the nuclei of the sinusoidal lumina, summed across all fields of view, ∑P(reference
space) correspond to the points falling within the FCA, summed across all sampled fields,
and k is the ratio of the two-lattice gird point (ie, 9:81 points, providing a k of 9). The me-
ander sampling for the VV estimates followed a step of X = 60 µm and Y = 40 µm, for FCA
up to a sectioned area of ≈ 80 000 µm2, and X = 120 µm and Y= 80 µm, for larger FCA.

MA
TE
RIA
LS
AN
D M
ET
HO
DS
33
STATISTICAL ANALYSIS
The descriptive statistics was made using the Microsoft Excel. For the inferential
statistical analysis as to the prevalence of each type of FCA and FCA combinations per
group we used the VassarStats: Website for Statistical Computation (http://vassarstats.net/);
viz. the “Significance of the Difference Between Two Independent Proportions” test. All the
subsequent analyses were made with the software STATISTICA 12. As to the analyses of
the relative volumes, and because the data failed to show homogeneity of variances using
the Levene test, we executed the non-parametric Kruskal–Wallis test to verify whether or
not groups significantly differed. Planned comparisons of pairs of means were made with
the Mann–Whitney U-test. Concerning the study of the parenchyma parameters, we per-
form a parametric analysis, resourcing to Newman-Keuls test, after every significant one-
way ANOVA, to compare and identify means significantly different. In all tests we adopted
the typically standard significance level (α = 0.05).
HISTOCHEMISTRY
The procedures were applied to cases selected for having diverse types of lesions.
The fragments, routinely processed for paraffin embedding as described, were sectioned
at 4 µm of thickness, the resulting sections being deparaffinized and hydrated. Then, the
following histochemical stains were performed, as detailed below:
(1) Periodic acid-Schiff (PAS) staining: sections were oxidized with 0.5% periodic
acid solution (10 minutes) and placed in Schiff reagent (15 minutes). PAS diastase (PAS/D)
controls were implemented to confirm the presence of glycogen, treating the sections ini-
tially with amylase solution for 30 minutes at 37ºC. This latter technique in based on the
following principle: alpha-amylase, also known as diastase, is an enzyme that cleaves the
a-glucosidic 1-4 linkages of glycogen leading to the formation of maltose and dextrose
(water-soluble sugars). So, when sections are pre-exposed to diastase before the PAS
technique the glycogen within the tissue is broken down into maltose and dextrose, which
are dissolved and washed away when the section is rinsed sufficiently in tap water. Sub-
sequently, glycogen will be stained magenta on the PAS stained slide and will be absent
on the PAS/D stained slide;
(2) Perls’ Prussian blue staining: we placed the slides in a mixture of equal parts of
2% potassium ferrocyanide and 2% chloric acid, for 30 minutes at 60ºC, and then coun-
terstained with eosin, with a rapid emerge in the dye;

MA
TE
RIA
LS
AN
D M
ET
HO
DS
34
(3) Sirius red staining: we stained first with azure and Mayer’s haematoxylin and
then with picrosirius red, for one hour.
Irrespective of the technique, in the end all the slides were dehydrated in absolute
alcohol, cleared in xylene and mounted with DPX.
IMMUNOHISTOCHEMISTRY
The procedures were applied to cases selected for having diverse types of lesions.
Prior to immunohistochemistry, the sections with 4 µm of thickness were deparaffinized
and hydrated. An antigen retrieval-microwave method was performed, using: (1) citrate
buffer (pH 6), with a microwave at 600 W, during 2 min plus 2 x 4 min, for CYP1A immu-
nochemistry; (2) Tris-EDTA buffer (pH 9.0), with a microwave at 600 W, during 10 min
after boiling, for E-cadherin immunochemistry. Endogenous peroxidase was quenched by
treatment with a 3% H2O2 solution in methanol, for 10 min. After rising in PBS with Tween
0.05%, it was performed an avidin and biotin blocking step (Vector Labs kit), followed by
another rising with PBS and with BSA and then, to reduce non-specific binding, sections
were incubated in a blocking solution (Histostain-Plus kit, Invitrogen), for 1 hour. As to the
antibodies, sections were incubated overnight, at 4ºC, in a moist chamber, with the rabbit
anti-fish CYP1A peptide polyclonal antibody, CP-226 (Biosense Laboratories) and mono-
clonal mouse anti-human E-cadherin, clone NCH-38 (Dako).The CYP1A and E-cadherin
antibodies were used at a dilution of 1:200 and 1:100 and 1:50 respectively, in 0.01%
phosphate buffered saline (PBS, pH 7.5). After rising in PBS and incubation with a broad
spectrum secondary antibody (Histostain-Plus kit, Invitrogen) for 20 min, the sections
were rinsed and incubated with Streptavidin-HRP conjugate (Histostain-Plus kit, Invitro-
gen), for 20 min. After subsequent rinsing in PBS, the sections were incubated with
3,3´diaminobenzidine (DAB) (Zytomed Systems) for 2 min, and counterstained with hema-
toxylin. In the end, all the slides were dehydrated in absolute alcohol, cleared in xylene
and mounted with DPX.

RE
SU
LT
S


RE
SU
LT
S
37
RESULTS
GENERAL QUALITATIVE FINDINGS
Fish from the blank (non-MNNG initiated) control did not have any sort of liver le-
sions. By the contrary, basophilic (Figure 1, A and B), amphophilic (Figure 1, C and D)
and eosinophilic FCA (Figure 1, E and F) were found in all the MNNG initiated groups.
Vacuolated (Figure 2, C and D) and clear FCA (Figure 2, A and B) were also found, how-
ever, as 21% of the animals presented a hepatocellular parenchyma quite broadly vacuo-
lated, and 48% had an intermediate stage (i.e., cytoplasm between vacuolated and baso-
philic), the distinction between the foci and the normal tissue was very difficult and uncer-
tain; so we decided to focus our attention in the remaining types and do not advance with
further qualitative and quantitative analysis about vacuolated and clear FCA. These foci
were not accounted in the statistical analysis and will be analyzed in a next phase of the
all project. In addition to those well-defined FCA, irregular zones of identifiable cellular
degeneration also existed, resembling FCA but being distinctly undefined as to the tinge
and focal nature; thus being characterized by liver cells that had a different staining, but in
which more than 50% of the margins of the “cell group” were poorly defined, having a very
reduced or absent trabecular aspect, and, finally (contrary to is observed in well-defined
FCA) without being associated with perceivable sinusoidal enlargement. We did not find
mixed FCA (i.e., focal lesions with a region that could be seen as basophilic apart from
another with eosinophilic aspect). During analysis we discriminate an early stage of FCA,
a lesion that does not present yet all the features to be identified like FCA — such cases
were called Pre-FCA (Figure 2, E and F); and its differential diagnosis will be discussed
ahead. Besides FCA, we also diagnosed two cases of adenoma (Figure 3, A and B) in E2
50 µg/L group. We faced some difficulties in a few cases, derived from a generalized al-
teration, where either all the section or most of it seemed a huge FCA (Figure 3, C and D).
PREVALENCE
All the raw data and the derived prevalences for the studied lesions are given in
Table 1. Additionally, the significance of the differences between the groups is exposed in
Table 2. Regarding the prevalence, the E2 50 µg/L group reaches a remarkable result,
with 100% of fish having FCA, followed by the Alkylphenols group, then the Vehicle, and
finally, the E2 5 µg/L group; these three with similar percentages. The group with the low-
est % value is the E2 5 µg/L, with less than 50% of the animals detected with FCA.

RE
SU
LT
S
38
Figure 1 Hematoxylin and Eosin staining. Basophilic FCA (delimited in A and detailed in B); am-phophilic FCA (delimited in C and detailed in D) composed of hepatocytes with cytoplasmic baso-philia and eosinophilia; eosinophilic FCA (delimited in A and detailed in B), presenting an aci-dophilic staining. Bars: A- 100 µm; B- 50 µm; C- 200 µm; D- 50 µm; E- 200 µm; F- 100 µm.

RE
SU
LT
S
39
Figure 2 Hematoxylin and Eosin staining. Clear cell foci (delimited in A and in detailed in B) with hepatocytes with a faint pink colour and central nucleus; vacuolated FCA (delimited in C and in detailed in D) an evidently vacuolated cytoplasm and an eccentrically displaced nucleus; Pre-FCA (delimited in E and in detailed in F) with a mild tinctorial change regarding the hepatocytes but with neither a trabecular aspect nor increased vascularization. Bars: A- 100 µm; B- 50 µm; C- 100 µm; D- 50 µm; E- 100 µm; F- 50 µm.

RE
SU
LT
S
40
Figure 3 Hematoxylin and Eosin staining. Hepatocellular adenoma (delimited in A and in detailed in B), well delimited from the parenchyma, depicting evident cellular and nuclear atypia and pleo-morphism (*binuclear cell). Liver displaying a widespread abnormal pattern with heterogeneity (C and in detailed in D), where all the parenchyma seems to have turned into an enormous FCA. Bars: A- 500 µm; B- 100 µm; C- 500 µm; D- 200 µm.

RE
SU
LT
S
41
Table 1- Prevalence of each type of foci of cellular alteration (FCA) and Pre-FCA in the different groups (fish, n=426).
Group Fish (n)
Fish with FCA (n)
FCA (%)
bFCA (n)
bFCA (%)
aFCA (n)
aFCA (%)
eFCA (n)
eFCA (%)
Pre-FCA (n)
Pre-FCA (%)
VEHICLE CONTROL 112 73 65% 70 63% 26 23% 2 2% 36 32% ALKYLPHENOLS 111 76 68% 64 58% 42 38% 2 2% 63 57% E2 5 µg/L 110 54 49% 49 45% 12 11% - - 36 33%
E2 50 µg/L 93 93 100% 81 87% 88 95% 40 43% 79 85%
bFCA - Basophilic FCA. aFCA - Amphophilic FCA. eFCA - Eosinophilic FCA.
Table 2- Significance of the difference (p-values) of the prevalences of foci of cellular alteration (FCA) and Pre-FCA between groups,
under the VassarStats test.
Statistically significant differences (p 0.05) in bold. bFCA - Basophilic FCA. aFCA - Amphophilic FCA. eFCA - Eosinophilic FCA.
VEHICLE CONTROL
ALKYLPHENOLS
FCA 0.6017
bFCA 0.4605
aFCA 0.0177
eFCA 0.9928
Pre-FCA 0.0002 ALKYLPHENOLS
E2 5 µg/L
FCA 0.0154 FCA 0.0034
bFCA 0.0073 bFCA 0.0512
aFCA 0.0149 aFCA 0.0017
eFCA - eFCA -
Pre-FCA 0.9259 Pre-FCA 0.0003 E2 5 µg/L
E2 50 µg/L
FCA < 0.0002 FCA < 0.0002 FCA < 0.0002
bFCA < 0.0002 bFCA < 0.0002 bFCA < 0.0002
aFCA < 0.0002 aFCA < 0.0002 aFCA < 0.0002
eFCA < 0.0002 eFCA < 0.0002 eFCA -
Pre-FCA < 0.0002 Pre-FCA < 0.0002 Pre-FCA < 0.0002

RE
SU
LT
S
42
In all groups, except the E2 50 µg/L, the most frequent FCA type is the basophilic,
and the less common is the eosinophilic, being the E2 5 µg/L the only group without a
register of this type of FCA. In the E2 50 µg/L group, eosinophilic is also the less frequent
type, and it is the amphophilic that reaches the highest percentage. The E2 50 µg/L is also
the group with a higher rate of Pre-FCA, followed by the Alkylphenols group, and then E2
5 µg/L and Vehicle Control groups; the latter three having very approximated frequencies.
Concerning the significance of the difference between two groups (Table 2), taking
into account the prevalence of each type of FCA, in general we observed that every group
differs from the E2 50 µg/L group (p < 0.0002). The Vehicle Control and the Alkylphenols
groups did not differ from each other, except in the prevalence of aFCA and Pre-FCA, with
the Alkylphenols group achieving higher (significant) numbers. The E2 5 µg/L differs from
Vehicle Control and the Alkylphenols groups in every proportions of FCA, except in Pre-
FCA, where the result points to a similarity with Vehicle Control group; it was not possible
to compare the number of eFCA, since the E2 5 µg/L group did not present this type.
Another way to look at data is to organize the information as combined lesions
(Graphs 1-4). So, about the prevalence of different FCA combinations, we can state that
the percentage of animals with only bFCA reached the highest values in all groups, except
in the E2 50 µg/L group, where bFCA + aFCA is the most frequent combination. Since the
E2 50 µg/L group achieved 100% of fish with FCA, there were no fish with Pre-FCA only.
The Vehicle Control and E2 50 µg/L groups were the only ones that presented the
aFCA + eFCA combination. The presence of all types of FCA — bFCA + aFCA + eFCA —
in the same slide was observed in Alkylphenols and E2 50 µg/L groups. The E2 5 µg/L
group did not register the bFCA + eFCA combination; however, all the remaining groups
presented a single case of such a mixture. In all groups, the % of animals with detected
aFCA only is 3 to 7%, except for the Alkylphenols group that had 15%.
Regarding the significance of the difference between two groups (Table 3), and
considering the prevalence of FCA combinations in the four groups with lesions, the Vehi-
cle Control and the Alkylphenols groups did not differ from each other, except in the num-
ber of fish with aFCA only. The E2 5 µg/L group did not differ from the Vehicle Control and
from the Alkylphenols group, except in the number of fish with the combination bFCA +
aFCA. The E2 50 µg/L group differed from all the other groups regarding the number of
fish only with bFCA and with the combination bFCA + aFCA, but did not differ as to fish
both with aFCA only and with the combination bFCA + eFCA. The Vehicle Control and E2
50 µg/L groups were the only ones that presented the combination aFCA + eFCA, and
even so they differed from each other. The Alkylphenols and E2 50 µg/L groups were the
only ones that had the combination bFCA + aFCA+ eFCA, and also differed from each
other significantly.

RE
SU
LT
S
43
Graphs 1-4 - Prevalence of different foci of cellular alteration (FCA) combinations in the four groups.
Only Pre-FCA: presence of only Pre-FCA
Only bFCA: presence of only basophilic FCA
Only aFCA: presence of only amphophilic FCA
bFCA + aFCA: presence of basophilic and amphophilic FCA
bFCA + eFCA: presence of basophilic and eosinophilic FCA
bFCA+ aFCA + eFCA: presence of all FCA types
aFCA + eFCA: presence of amphophilic and eosinophilic FCA

RE
SU
LT
S
44
Table 3- Significance of the difference (p-values) between groups, regarding the prevalence of FCA combinations, under the Vas-
sarStats test.
Statistically significant differences (p 0.05) in bold. a Presence of basophilic FCA only;
b Presence of amphophilic FCA only; ;
c Presence of Pre-FCA only;
d Presence of all
FCA types; e Presence of basophilic and amphophilic FCA;
f Presence of basophilic and eosinophilic FCA;
g Presence of amphophilic and eosinophilic FCA.
VEHICLE CONTROL
ALKYLPHENOLS
Only bFCA a 0.0766
Only aFCA b 0.0055
Only Pre-FCA c 0.7897
bFCA + aFCA e 0.3236
bFCA + eFCA f 0.9952 ALKYLPHENOLS
E2 5 µg/L
Only bFCA a 0.6599 Only bFCA a 0.1845 Only aFCA b 0.2396 Only aFCA b 0.0805 Only Pre-FCA c 0.2146 Only Pre-FCA c 0.1347
bFCA + aFCA e 0.002 bFCA + aFCA e < 0.0002 E2 5 µg/L
E2 50 µg/L
Only bFCA a < 0.0002 Only bFCA a < 0.0002 Only bFCA a < 0.0002 Only aFCA b 0.1588 Only aFCA b 0.1618 Only aFCA b 0.7849 bFCA + aFCA + eFCA d - bFCA + aFCA + eFCA d < 0.0002 bFCA + aFCA + eFCA d - bFCA + aFCA e < 0.0002 bFCA + aFCA e 0.0017 bFCA + aFCA e < 0.0002 bFCA + eFCA f 0.8950 bFCA + eFCA f 0.8997 bFCA + eFCA f -
aFCA + eFCA g 0.0146 aFCA + eFCA g - aFCA + eFCA g -

RE
SU
LT
S
45
RELATIVE VOLUMES OF THE LESIONS
As we can see in Table 4, when comparing with the other lesions, the VV (bFCA)
average reached the highest values in all groups, except in E2 50 µg/L group, where the
VV (aFCA) was greater. Anyway, based solely on the maximum values, the aFCA were
the foci that attained more extension in all groups. On the contrary, the eFCA were the
foci less relatively voluminous, except, again, in the E2 50 µg/L group, where they even
exceeded the bFCA as to the maximum value; but not on average. Concerning the VV
both of all the FCA combined (Total FCA) and of the total altered parenchyma (TAP), i.e.,
considering both the Pre-FCA and FCA together, the E2 50 µg/L group reached more than
the quadruple of the second highest group, in line with the previous results; that is, be-
sides the prevalence of lesions, this group also excelled in extension.
Table 4- Descriptive statistical data from each group, regarding the relative volumes
(%) of the lesions, considering the liver as reference space (fish, n = 426).
VEHICLE CONTROL
ALKYLPHENOLS E2 5 µg/L E2 50 µg/L
Vv (bFCA) a
Average 0.36 0.40 0.18 0.55 Median 0.27 0.21 0.14 0.28
Min-Max 0.00-1.77 0.00-3.28 0.00-0.68 0.0-4.06
VV (aFCA) b
Average 0.15 0.00 0.07 1.49
Median 0.00 0.04 0.000 0.92 Min-Max 0.00-2.76 0.00-3.55 0.00-1.34 0.00-9.12
Vv (eFCA) c
Average 0.01 0.00 0.00 0.29 Median 0.00 0.00 0.000 0.00 Min-Max 0.00-0.22 0.00-0.04 0.00-0.00 0.00-4.79
Vv (Pre-FCA) d
Average 0.02 0.22 0.03 0.62 Median 0.00 0.05 0.017 0.38 Min-Max 0.00-0.24 0.00-0.78 0.00-0.45 0.00-5.76
VV (Total FCA) e
Average 0.50 0.40 0.26 2.33 Median 0.30 0.30 0.177 1.72 Min-Max 0.00-4.44 0.00-3.55 0.00-1.46 0.02-13.08
Vv (TAP) f
Average 0.52 0.62 0.29 2.95 Median 0.35 0.37 0.195 2.47
Min-Max 0.00-4.44 0.00-3.55 0.02-1.46 0.16-14.21
a Relative volume (VV) of basophilic foci of cellular alteration (FCA);
b VV of amphophilic FCA;
c VV of eosinophilic FCA;
d VV
of Pre-FCA; e VV of FCA;
f VV sum of all FCA types;
g VV of Total Altered Parenchyma (VV sum of all FCA types and Pre-
FCA)

RE
SU
LT
S
46
Table 5- Significance of the difference (p-values) between groups, under the Mann-Whitney U test, considering the relative volumes of
foci of cellular alteration (FCA) and Pre-FCA.
a Relative volume (VV) of basophilic foci of cellular alteration (FCA);
b VV of amphophilic FCA;
c VV of eosinophilic FCA;
d VV of Pre-FCA;
e VV of FCA;
f VV sum of all FCA types;
g VV of Total Altered Parenchyma (VV sum of all FCA types and Pre-FCA)
VEHICLE CONTROL
ALKYLPHENOLS
VV (bFCA) a 0,12
VV (aFCA) b 0.01
VV (eFCA) c 0.94
VV (Pre-FCA) d < 0.0002
VV (Total FCA) f 0.82
VV (TAP) g 0.319 ALKYLPHENOLS
E2 5 µg/L
VV (bFCA) a 0.00045 VV (bFCA) a 0.12
VV (aFCA) b 0.07 VV (aFCA) b < 0.0002
VV (eFCA) c 0.22 VV (eFCA) c 0.23
VV (Pre-FCA) d 0.06 VV (Pre-FCA) d 0.02
VV (Total FCA) f 0.00034 VV (Total FCA) f 0.0016
VV (TAP) g 0.00135 VV (TAP) g < 0.0002 E2 5 µg/L
E2 50 µg/L
VV (bFCA) a 0.94 VV (bFCA) a 0.15 VV (bFCA) a 0.0059
VV (aFCA) b < 0.0002 VV (aFCA) b < 0.0002 VV (aFCA) b < 0.0002
VV (eFCA) c < 0.0002 VV (eFCA) c < 0.0002 VV (eFCA) c < 0.0002
VV (Pre-FCA) d < 0.0002 VV (Pre-FCA) d < 0.0002 VV (Pre-FCA) d < 0.0002
VV (Total FCA) f < 0.0002 VV (Total FCA) f < 0.0002 VV (Total FCA) f < 0.0002
VV (TAP) g < 0.0002 VV (TAP) g < 0.0002 VV (TAP) g < 0.0002

RE
SU
LT
S
47
Table 6 – Descriptive summary of the statistics of the relative volumes (VV).*
Volumes Observations
Vv (bFCA)
Vehicle Control greater than E2 5 µg/L E2 5 µg/L smaller than E2 50 µg/L
Vv (aFCA) Vehicle control equal to E2 5 µg/L
Vv (eFCA) E2 50 µg/L higher than all groups Vehicle control equal to Alkylphenols and E2 5 µg/L Alkylphenols equal to E2 5 µg/L
Vv (Pre-FCA) Vehicle Control equal to E2 5 µg/L
Vv (Total FCA) Vehicle Control equal to Alkylphenols
Vv (TAP) Vehicle Control equal to Alkylphenols
* The results of non-parametric versus parametric analyses produce similar deductions. See Tables 4 and
5 for the data and also for the elucidation of the nomenclature.
Overall, and considering the volume densities, it seems to be a concordance
with the previous results regarding the prevalence of the lesions, since E2 50 µg/L dif-
fer from the other groups in all volumes, except in Vv (bFCA). The Alkylphenols group
presented equal volumes to Vehicle Control group, except in Vv (aFCA) and Vv (Pre-
FCA). The Vehicle Control and E2 5 µg/L groups differed in three volume — Vv (aFCA),
Vv (eFCA) an Vv (Pre-FCA) — and were equal in the other three. The Alkylphenols dif-
fer from E2 50 µg/L group, except in Vv (bFCA). The only groups that presented equal
values of Vv (Total FCA) and Vv (TAP) were Alkylphenols and Vehicle Control.
NORMAL PARENCHYMA: WITHOUT LESIONS VS WITH LESIONS
The volumes of the hepatocyte nucleus and of the all cell, along with the coeffi-
cient of variation, for cells in the parenchyma of animal with not lesions at all and in fish
displaying lesions are summarized in Tables 7 and 8. The Blank Control group pre-
sented in all the parameters the lowest values, regarding the averages, and it also dif-
fered from the other four groups with lesions, in all the parameters. The four groups
with lesions do not differ from each other, but, overall, they seem to show less interin-
dividual variability as noted by the CV of the three volumes. Irrespective of this, the CVn
() were exactly equal in all the groups (i.e., within a fish, the nuclei varied in the same
extent).

RE
SU
LT
S
48
Table 7 – Parenchyma descriptive statistical data from each experimental group, including blank control, regarding the liver cell body
and nuclear volume-related parameters (fish, n = 100)
Blank Control Vehicle Control Alkylphenols E2 5 µg/L E2 50 µg/L
(nucleus) a Average 55.5 71.6 71.3 72.8 70.8
Min- Max 42.6-70.7 61.0-92.0 61.9-80.3 67.2-78.8 64.2-78.4
Coefficient of variation 0.12 0.11 0.07 0.05 0.06
(hepatocyte) b Average 768,0 836.9 881.9 848.7 880.8
Min- Max 527.5-940.2 679.0-998.4 775.0-972.5 700.1-975.7 754.5-1066.3
Coefficient of variation 0.14 0.09 0.07 0.09 0.10
(nucleus) c Average 72.1 101.9 101.9 104.0 100.8
Min- Max 60.5-81.8 83.0-122.2 91.1-120.0 87.7-119.2 93.0-110.2
Coefficient of variation 0.08 0.12 0.09 0.08 0.05
CVn () d
Average 0.5 0.6 0.7 0.7 0.7
Min- Max 0.3-0.8 0.5-0.8 0.6-0.8 0.5-0.8 0.6-0.8
Coefficient of variation 0.08 0.08 0.08 0.08 0.08
a Number-weighted volume of the hepatocyte nucleus (µm
3)
b Number-weighted volume of the hepatocyte (µm
3)
c Volume -weighted volume of hepatocyte nucleus (µm
3)
d Coefficient of variation of the hepatocytes nucleus in the number-weighted distribution.

RE
SU
LT
S
49
Table 8 – Significance of the difference (p-values) between experimental groups, under the Newman-Keuls test, regarding the liver
cell body and nuclear volume-related parameters in the normal parenchyma.
a Number-weighted volume of the hepatocyte nucleus
b Number-weighted volume of the hepatocyte
c Volume -weighted volume of hepatocyte nucleus
d Coefficient of variation of the hepatocytes nucleus in the number-weighted distribution
BLANK CONTROL
VEHICLE CONTROL
(nucleus) a < 0.0002
(hepatocyte) b 0,0102
(nucleus) c < 0.0002
CVn (V) d < 0.001 VEHICLE CONTROL
ALKYLPHENOLS
(nucleus) a < 0.0002 (nucleus) a 0,8737
(hepatocyte) b < 0.001 (hepatocyte)
b 0,3225
(nucleus) c < 0.0002 (nucleus)
c 0,8534
CVn (V) d <0.01 CVn (V)
d 0,9737 ALKYLPHENOLS
E2 5 µg/L
(nucleus) a < 0.0002 (nucleus) a 0,5044 (nucleus) a 0,6856
(hepatocyte) b < 0.001 (hepatocyte)
b 0,6564 (hepatocyte)
b 0,4173
(nucleus) c < 0.0002 (nucleus)
c 0,7005 (nucleus) c 0,5367
CVn (V) d < 0.01 CVn (V)
d 0,9781 CVn (V)
d 0,8214 E2 5 µg/L
E2 50 µg/L
(nucleus) a < 0.0002 (nucleus) a 0,8980 (nucleus) a 0,7781 (nucleus) a 0,6828
(hepatocyte) b < 0.001 (hepatocyte)
b 0,2221 (hepatocyte)
b 0,9655 (hepatocyte)
b 0,2243
(nucleus) c < 0.0002 (nucleus)
c 0,7030 (nucleus) c 0,8375 (nucleus)
c 0,6358
CVn (V) d < 0.01 CVn (V)
d 0,8508 CVn (V)
d 0,9692 CVn (V)
d 0,9905

RE
SU
LT
S
50
ALTERED PARENCHYMA: VOLUME PARAMETERS OF bFCA AND aFCA
The volumes of the hepatocyte nucleus and of the all cell, along with the coeffi-
cient of variation of the nuclear volume, within the bFCA, are summarized in Tables 9
and 10. From these data, we found that relative to bFCA, the (nucleus) and the
(nucleus), E2 50 µg/L achieved the highest value, contrary to E2 5 µg/L, that presented
the lowest. In these two parameters, all the groups were statistically different from E2
50 µg/L.
Concerning (hepatocyte), we observed that the greatest volume is achieved
in the Alkylphenols group, and that the lowest belongs, again, to the E2 5 µg/L group.
For this volume, both the Alkylphenols and Vehicle Control groups were statistically
different from the E2 5 µg/L exposure.
As to the CVn (), the greater variability respecting the nucleus belongs to E2 50
µg/L group, being statistically different from the others; that even presented equal val-
ues.
Looking to the Ratio nucleus/cell (%), animals under E2 50 µg/L achieved the
highest value, while the Vehicle Control group presented the lowest. The latter and the
Alkylphenols groups were statistically different from both E2 50 µg/L and E2 5 µg/L,
being these last two also different between themselves.
As to the VV (sinusoid, bFCA), the mean values were quite alike among groups.
On the contrary, the VV (nuclei, bFCA) revealed significant differences among groups,
with a trend for higher values in the groups exposed to estrogenic stimuli. Indeed, the
E2 5 µg/L achieved the highest value, differing from those of the Alkylphenols and the
Vehicle Control groups, with the E2 50 µg/L fish also differing from those of Vehicle
Control.
Observing the results from aFCA described in Table 10, we verified that regard-
ing the (nucleus) and the (nucleus) the E2 50 µg/L tended to promote the higher
values and the E2 5 µg/L the lowest ones. Respecting the (nucleus), the E2 5 µg/L
and E2 50 µg/L conditions are statistically different.
Concerning the (hepatocyte), we observed that the most elevated volume
was seen in Alkylphenols group and the lowest belongs again in E2 5 µg/L group; also
similar to bFCA. In this case, Vehicle Control and Alkylphenols differ from E2 5 µg/L
group.
As to the CVn () — representing the volume variability in the number-weighted
distribution —, the E2 50 µg/L group showed the highest one, being statistically differ-

RE
SU
LT
S
51
ent from the other groups (that presented similar values). In general, the CVn () was
very high, with values always over 60%.
Like for the bFCA, in the aFCA the E2 50 µg/L achieved the highest value in the
Ratio nucleus/cell (%) — that is the same to say the VV (nucleus, hepatocyte) —, while
the Alkylphenols group presented the lowest one. Note that the E2 50 µg/L and E2 5
µg/L groups differ from the Alkylphenols; the Control had an intermediate value.
Looking to the volumetric densities, in VV (sinusoid, aFCA) the groups were not
statically different from each other. Both the E2 5 µg/L and E2 50 µg/L groups present-
ed the greater values of VV (nucleus, aFCA) and differed significantly from the Vehicle
Control, being Alkylphenols group placed in between.
It was not possible to accomplish a statistical analysis of eFCA, since the num-
ber of positive cases was only sufficient in E2 50 µg/L; which makes it impossible to
perform comparisons between all groups.

RE
SU
LT
S
52
Table 9- Descriptive statistical data from basophilic foci of cellular alteration (bFCA), regarding the liver cell body and nuclear vol-
ume-related parameters and sinusoid and nucleus relative volumes (fish, n = 20).
Vehicle Control Alkylphenols E2 5 µg/L E2 50 µg/L
(nucleus) a Average 97.7* 100.8
* 95.9
* 108.7
SD 7.2 6.9 11.9 9.08
(hepatocyte) b Average 886.8**
898.7**
78.1 845.0
SD 85.8 75.7 82.1 84.1
(nucleus) c Average 139.6* 143.1
* 136.4
* 162.6
SD 11.5 11.5 18.7 13.6
CVn () d Average 0.7* 0.7
* 0.7
* 0.7
SD 0.1 0.0 0.1 0.1
Ratio nucleus/cell (%) Average 11.1*/**
11.3*/ **
12.1* 12.9
**
SD 0.0 0.0 0.0 0.0
VV (sinusoid) (%) e Average 13.2 14.1 15.1 13.5 SD 0.0 0.0 0.0 0.0
VV (nucleus) (%) f Average 6.3 6.8**** 8.0
***/ **** 7.4
***
SD 0.0 0.0 0.0 0.0 SD- Standard Deviation
a Number-weighted volume of the hepatocyte nucleus (µm3)
b Number-weighted volume of the hepatocyte (µm3)
c Volume -weighted volume of hepatocyte nucleus (µm3)
d Coefficient of variation of the hepatocytes nucleus in the number-weighted distribution
e- Relative volume (sinusoid, reference space)
f- Relative volume (nucleus, reference space)
* statistically different from E2 50 µg/L group; p <0.01 in (nucleus); p <0.001 in (hepatocyte); p <0.05 in CVn () and ratio nucleus / cell ** statistically different from E2 5 µg/L group; p <0.01 in (hepatocyte); p <0.05 in the ratio nucleus / cell
*** statistically different from Vehicle Control (p <0.001) **** statistically different between themselves (p <0.001)
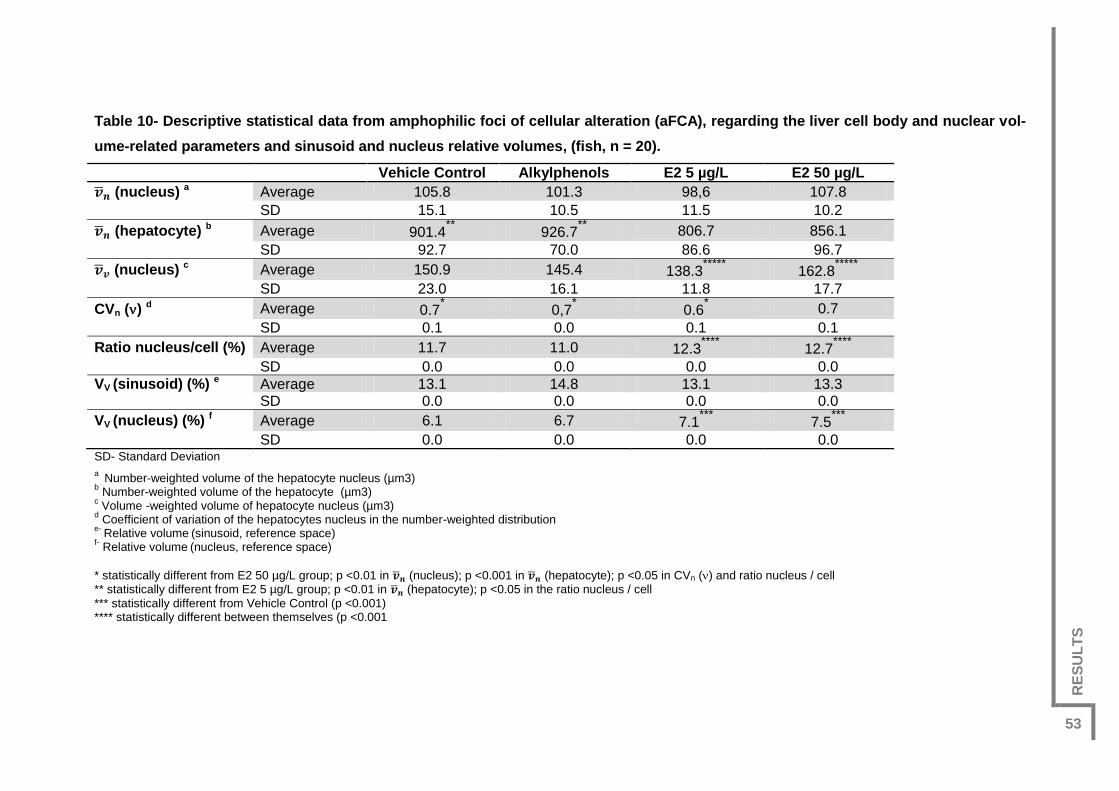
RE
SU
LT
S
53
Table 10- Descriptive statistical data from amphophilic foci of cellular alteration (aFCA), regarding the liver cell body and nuclear vol-
ume-related parameters and sinusoid and nucleus relative volumes, (fish, n = 20).
Vehicle Control Alkylphenols E2 5 µg/L E2 50 µg/L
(nucleus) a Average 105.8 101.3 98,6 107.8
SD 15.1 10.5 11.5 10.2
(hepatocyte) b Average 901.4**
926.7**
806.7 856.1
SD 92.7 70.0 86.6 96.7
(nucleus) c Average 150.9 145.4 138.3*****
162.8*****
SD 23.0 16.1 11.8 17.7
CVn () d Average 0.7* 0,7
* 0.6
* 0.7
SD 0.1 0.0 0.1 0.1
Ratio nucleus/cell (%) Average 11.7 11.0 12.3****
12.7****
SD 0.0 0.0 0.0 0.0
VV (sinusoid) (%) e Average 13.1 14.8 13.1 13.3 SD 0.0 0.0 0.0 0.0
VV (nucleus) (%) f Average 6.1 6.7 7.1***
7.5***
SD 0.0 0.0 0.0 0.0 SD- Standard Deviation
a Number-weighted volume of the hepatocyte nucleus (µm3)
b Number-weighted volume of the hepatocyte (µm3)
c Volume -weighted volume of hepatocyte nucleus (µm3)
d Coefficient of variation of the hepatocytes nucleus in the number-weighted distribution
e- Relative volume
(sinusoid, reference space)
f- Relative volume
(nucleus, reference space)
* statistically different from E2 50 µg/L group; p <0.01 in (nucleus); p <0.001 in (hepatocyte); p <0.05 in CVn () and ratio nucleus / cell ** statistically different from E2 5 µg/L group; p <0.01 in (hepatocyte); p <0.05 in the ratio nucleus / cell
*** statistically different from Vehicle Control (p <0.001) **** statistically different between themselves (p <0.001

RE
SU
LT
S
54
HISTOCHEMISTRY
A summary of the data is offered in Table 11. Overall, the Sirius red (Figures 5
and 6) and the PAS (Figures 7, 8 and 9) stainings evidenced that the parenchyma in
the FCA could be made histochemically distinguishable from the remaining liver muralium,
and that there was diversity as to the hepatocyte glycogen content for FCA of same
type. The Perls’ staining (Figure 4) did not evidenced the presence of ferric salts.
Table 11- Histochemistry expected outcomes and results.
Stain Expected outcome Result
Perls’
Ferric salts: blue
Nuclei: pink
Negative: absence of ferric salts.
Sirius red Collagen: red
Nuclei: brown
The delicate perisinusoidal stroma did not differ
in thickness within the FCA of the diverse types
and also in the surrounding normal parenchy-
ma; except in the case of one adenoma, where
we noted a slight increase.
PAS Glycogen: red/purple
Nuclei: blue
Heterogeneity between FCA of the same type,
observing in the majority of the cases less gly-
cogen within the FCA hepatocytes, when com-
paring with the surrounding parenchyma.
Figure 4 Perls’ staining. The FCA (delimited in A and detailed in B) marked negatively for ferric salts. Bars: A- 200 µm; B- 100 µm.

RE
SU
LT
S
55
Figure 5 Sirius red staining. Perisinusoidal collagen stains lightly, with a reddish tone. There are no differences between walls of the smaller blood vessels (*) within the FCA (delimited in A and detailed in B) and the ones (arrows) of the surrounding parenchyma (C-E). Bars: A- 200 µm; B to D- 50 µm.
Figure 6 Sirius red staining. General overview of an adenoma (delimited in A), along with some details (B-E), and exemplificative images of the normal parenchyma nearby (F-I). The adenoma blood vessels (*) look slightly more thickened — regarding the collagen content of their wall and/or perisinusoidal space — than in those (arrows) of the surrounding parenchyma (F-I). Bars: A – 500 µm; B to H - 50 µm, except C- 100 µm.
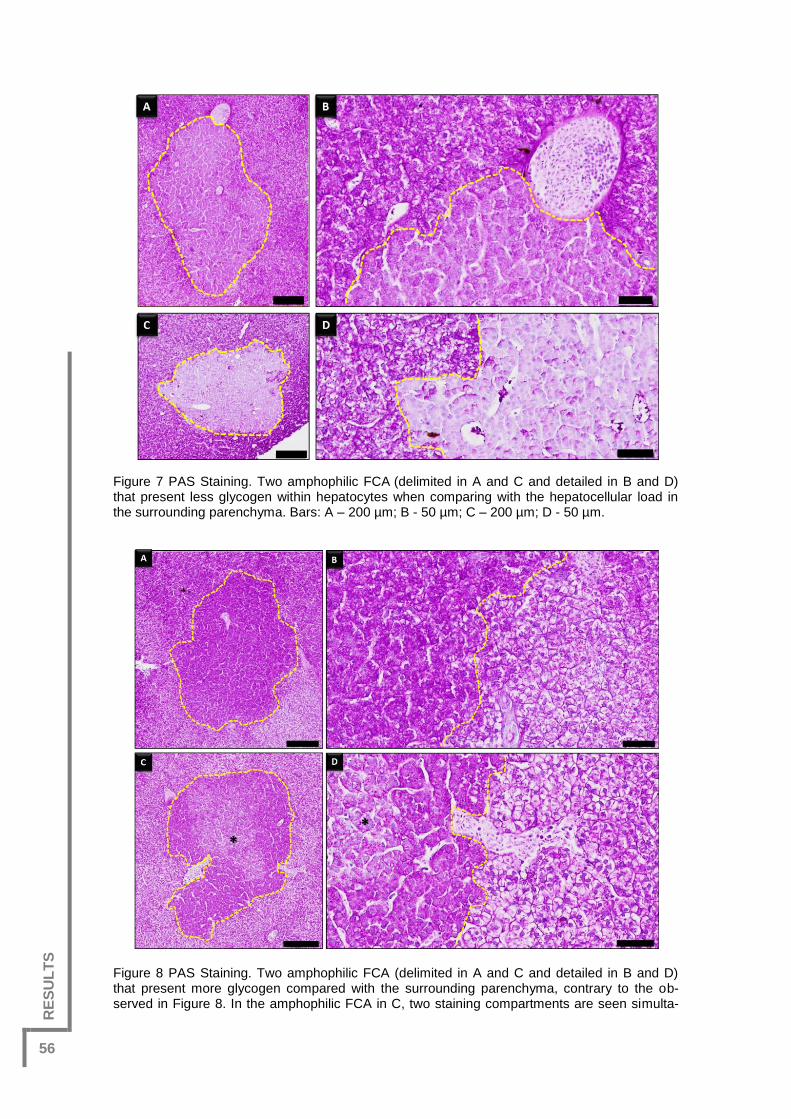
RE
SU
LT
S
56
Figure 7 PAS Staining. Two amphophilic FCA (delimited in A and C and detailed in B and D) that present less glycogen within hepatocytes when comparing with the hepatocellular load in the surrounding parenchyma. Bars: A – 200 µm; B - 50 µm; C – 200 µm; D - 50 µm.
Figure 8 PAS Staining. Two amphophilic FCA (delimited in A and C and detailed in B and D) that present more glycogen compared with the surrounding parenchyma, contrary to the ob-served in Figure 8. In the amphophilic FCA in C, two staining compartments are seen simulta-

RE
SU
LT
S
57
neously: one in the center of the FCA (*), staining somewhat more close to the surrounding parenchyma, and other, at the FCA border (matching to a more basophilic periphery in Hema-toxylin and Eosin staining), presenting more glycogen than the surrounding parenchyma. Bars: A- 200 µm; B 50 µm; C- 200 µm; D- 50 µm.
Figure 9 PAS Staining. The eosinophilic FCA at the top (delimited in A and detailed in B), the basophilic FCA in the middle (delimited in C and detailed in D), and the adenoma on the bottom (delimited in E and detailed in F), all present less glycogen compared with the adjacent normal parenchyma. Bars: A- 200 µm, B- 50 µm, C- 200 µm, D – 50 µm, E- 500 µm, F - 100 µm.
IMMUNOHISTOCHEMISTRY
Regarding E-cadherin immunoreactivity (Figure 10), we observed a “negative
pattern” (i.e., less staining intensity at the boundaries between individual hepatocytes)
within all the types of FCA, when compared to the surrounding parenchyma.

RE
SU
LT
S
58
Respecting CYP1A immunostaining, we noted heterogeneity among ampho-
philic FCA (Figure 11), with distinct patterns of immunoreactivity, going from very weak
to strong signal. Eosinophilic FCA (Figure 12) also presented heterogeneity, but less
pronounced than aFCA, with a slight to a moderated intensity. We detected the weaker
signal in basophilic FCA, which seem to present a more linear pattern (Figure 13).
Figure 10 E-cadherin immunoreactivity in FCA (delimited in A and detailed in B). In the latter, it becomes evident the nearly absence of staining comparing with the surrounding parenchyma (specially, close to blood vessels); a feature apparently similar in all the FCA types. Bars: A- 200 µm; B- 100 µm.

RE
SU
LT
S
59
Figure 11 Hematoxylin and Eosin staining (delimited FCA in A,C and E) and CYP1A immuno-reactivity (delimited FCA in B,D and F) in amphophilic FCA. There is heterogeneity between the depicted FCA, with distinct patterns of staining reactivity, going from very slight (B), to moderat-ed (D), and even to very intense (F). Bars: A to F- 20 µm.

RE
SU
LT
S
60
Figure 12 Hematoxylin and Eosin staining (delimited FCA in A, C and E) and CYP1A immunoreac-tivity (delimited FCA in B, D and F) in eosinophilic FCA. These type of FCA present heterogeneity, less pronounced than in the amphophilic FCA, with a slight (B) to moderate intensity (D). Bars: A to D- 20 µm.

RE
SU
LT
S
61
Figure 13 Hematoxylin and Eosin staining (delimited FCA in A and C) and CYP1A immunoreactivity (delimited FCA in B and D) in basophilic FCA. This type of FCA presents a weak signal when com-pared with the amphophilic and eosinophilic FCA. Bars: A to D- 20 µm.
.


DIS
CU
SS
ION


DIS
CU
SS
ION
65
DISCUSSION
OPTICAL MICROSCOPY VS DIGITAL MICROSCOPY
As Romer and Suster (2003) emphasized pathology professors have resorted
to traditional glass slides and standard microscopes for many decades. However, they
have faced some problems, because the slides are fragile and easy to break by care-
less students and difficult to duplicate, fading over time. Fortunately, e.g., according to
Dee (2006), virtual microscopy has revolutionized the teaching of microscopic patholo-
gy, since multiple medical schools have implemented this novel technology. Summariz-
ing, virtual microscopy is very attractive to professors because it nearly perfectly simu-
lates the plan and zoom features of traditional microscopy, and presents in addiction
numerous advantages like efficiency (adequate focus; proper condenser adjustment;
easier viewing technique), accessibility (rapid access anywhere and anytime with a
computer; one slide can be analyzed at the same time by several viewers), and, at last,
versatility of computer-assisted education.
It seems that the only disadvantage that really stands out is the expensive costs
for the acquisition and maintenance of equipment; despite in the experience of the His-
tology and Embryology Laboratory of the ICBAS he latter aspect is not particularly dif-
ferent from any other technically delicate equipment, like excellent microtomes and
research microscopes (Eduardo Rocha, personal communication). Accordingly, Dee
(2006) foresaw that costs would come down with innovation and competition among
the companies. Besides that, the students have to learn how to use a traditional micro-
scope, so the exclusive train with virtual microscopy is not recommended, despite stu-
dents had rated the quality of images and navigation of the virtual microscope equal to
or better than a real microscope (Harris et al, 2001).
Regarding the current routine diagnosis of pathological cases, several studies
already used the virtual microscopy, and the results pointed that the information with-
drawal of the imaging analysis is sufficient to make reliable diagnostic decisions and
compose complex diagnostic reports, where the accuracy of virtual microscopy can
match the glass slide microscopy (Gilbertson et al. 2006; Ficsor et al. 2008; Evered
and Dudding 2011). Pathologists also highlight the reduction in the time of diagnosis
and better image quality in frozen sections (Al-Janabi et al 2012). We cannot also for-
get that archived digital slides are a huge data warehouse containing valuable data for
the future (Al-Janabi et al 2012).

DIS
CU
SS
ION
66
As mentioned before, this work was divided in two phases, giving us the first
one an overview concerning the lesions behavior towards the chemicals administration,
which allowed us to plan the second one. In the end, we concluded that the FCA diag-
nosis based on virtual slides analysis was optimized, in speed, in commodity for the
observer, and in our view (despite no statistics were involved) rising its sensitivity and
specificity. In addition, the measurement tools provided by VS120-SL were definitely an
added value.
From our experience with this study, the virtual slide scans and attached image
analysis programs are clearly a valuable tool in this type of screening diagnosis and
quantification. It should be noted that virtual microscopy has been introduced in com-
parative pathology basically in the last decade (Dee, 2006), and research in fishes us-
ing this technology is still very rare; studies such us ours support and will encourage a
wider use of this approach.
BASELINE RATE AND PROMOTION EFFECT
The liver is a key target organ in preclinical toxicity and oncogenicity assess-
ment. Despite this fact, the importance of hepatic neoplastic lesions in animal models
has been questioned concerning their predictive value, since humans seem to be more
resistant to certain carcinogenic agents (Thoolen et al., 2012). Aside from the more or
less predictive value, it seems consensual that the early detection and interpretation of
proliferative and nonproliferative hepatic lesions can be relevant to explain how the
toxicity to the liver is considered to be the second most frequent cause of drug failure
(Thoolen et al., 2012).
Several studies have been describing over decades pre-neoplastic lesions in
liver, initiated and/or promoted by the administration of chemicals, either in experiments
or not. For example, Stentiford et al. (2003), also applying histopathological analyses,
observed an elevated prevalence of FCA in the liver of flounder captured from the lo-
cals with highest levels of polycyclic aromatic hydrocarbons (PAH) contamination.
Moreover, high prevalences of FCA in livers of fishes are well documented from pollut-
ed sites in the North American coast, in UK estuaries and also in the Baltic Sea (Fricke
et al, 2012). In a totally different context, Tsuchishima et al (2013) verified the effects
of ethanol on the formation of precancerous FCA in mice and suggested that chronic
intake of alcohol produces extensive steatosis and accelerates the formation of prene-
oplastic lesions that further can lead to HCC. Very recently, using the alternative testing
“in ovo carcinogenicity assay”, Enzmanna et al. (2014), demonstrated that carcinogenic
tobacco specific nitrosamine 4-(N-methyl-N-nitrosamine)-1-(3-pyridyl)-1-1-butanone

DIS
CU
SS
ION
67
(NNK) induces FCA in fetal turkey liver. The primary exposure to MNNG succeeded
herein to essentially induce the emergence of FCA only, being the initiator previously
used in hepatocarcinogenesis protocols for rainbow trout (Bailey et al, 1996; Williams,
2012). Herein, estrogenic stimulation acted as a promoter, with E2 at the highest dose
being more effective compared with the alkylphenols mixtures, as we hypothesized.
With the promoters, it was observed an increase in both the number of affected fish
and in the diversity of lesions types. It was clear that the group E2 50 µg/L stood out
from the rest because of the higher frequencies; also, VV of the FCA were greater with
the E2 50 µg/L. The cited group also stood out because of the distribution of the foci,
being the one with the higher prevalence of aFCA and of the combination bFCA +
aFCA, which contradicted the other groups. These facts seem not well in agreement
with the most usual path pointed for FCA types evolution, presented in the Introduction,
where it was stated that some authors point that bFCA is the preneoplastic stage that
precedes the HCC. Moreover, at least for mammals, the amphophilic foci type is con-
sidered as a precursor of the basophilic phenotype, suggesting a morphological contin-
uum between the two lesions. Based on this, we should have observed more eFCA
and aFCA in the groups that the promoter effect was weaker (like Alkylphenols group),
and more bFCA in the E2 50 µg/L group. However, we can also think that if the promot-
ing effect is strong, more initial/intermediate foci could be enlarging and evolving to the
more basophilic type. Indeed, the bFCA were significantly more frequent and had a
greater VV in the E2 50 µg/L group than in any of the other groups. Whatever the true
is, our data highlights once more the tricky nature of the FCA and the difficulty in inter-
preting its time evolution/regression.
The results from the group E2 5 µg/L, surprisingly, point for the potential para-
doxical effects of estrogens — protector and promoter — since it was the one present-
ing the lowest values regarding the prevalence. This fact was also reported in the In-
troduction, when we cited studies that demonstrated the protective role of estrogens in
different pathologies, such as HCC (Mendelsohn and Karas, 1999; Omoya et al, 2001;
Shimizu et al., 2007; Kalra et al., 2008; Tian et al, 2012). This way, it seems that estro-
gens can have two opposite effects that can produce different outcomes in the envi-
ronment, in which doses assume a crucial role — the higher the dose, the higher the
probability of lesions promotion. Enzmann et al. (2013), using diethylnitrosamine (DEN)
in turkey eggs, assessed FCA and concluded that its induction was clearly dose-
dependent. Those authors even suggested that although FCA could be used to deter-
mine thresholds of effects of both genotoxic and non-genotoxic carcinogens, they addi-
tionally mentioned that it has been shown that thresholds for the induction of FCA and
of tumors may be clearly different. The same reasoning could be applied to the pro-

DIS
CU
SS
ION
68
moters, helping to explain not only dose-dependent effects but also cases of opposite
effects of lower vs higher doses of a chemical. This apparent duality can be associated
with the concept of hormesis: term used by toxicologists to describe a dose-response
phenomenon in which an environmental agent that produces harmful biological effects
at moderate to high doses may produce beneficial effects at low doses. So, in the
presence of a low dose of a toxicant, the cell response can be considered an adaptive
process to compensate an initial disruption in homeostasis (Calabrese, 2002; Mattson,
2008). Our results seem to favor this hypothesis under the studied experimental con-
text, as in the Strom et al (2011) study, where they describe how the estrogens effects
on stroke can be divergent, since hormone therapy can be neuroprotective, while, on
the contrary, can increase stroke risk and ischemic lesions. The authors also referred
that the estrogens protective potential can include multifactorial mechanisms, like
apoptosis and inflammation decrease, beneficial vascular effects and growth factor
modulation. Strom et al (2011) concluded that there is a necessity to assess the biolog-
ical relevance of a wide range of doses, by serum hormone measurements and subse-
quent comparison with the intended biological situation. As stated by Vandenberg et al
(2012), it is possible that “the dose makes the poison” dogma is indeed right, since
estrogens can have effects at lower doses that are not predicted by effects at higher
doses.
The Alkylphenols and Control Vehicle groups presented similar results concern-
ing the prevalence and extension, even in the VV (Total FCA) and VV (TAP), however,
the alkylphenols mixture seem to have a slightly more powerful effect, having a highest
prevalence of aFCA and Pre-FCA (also exceeding in extension comparing with the
Control Vehicle group) and being the only one, besides the E2 50 µg/L group, to pre-
sent the “triad” bFCA + aFCA + eFCA. However, it seems that the alkylphenols used
are not a potential carcinogenic promoter in our model. Consequently, facing the high
nominal dosage used herein, it seems unlikely that, per se, environmental pollution by
alkylphenols would pose a risk for increased carcinogenesis, at least for fish sensible
as brown trout. By other hand, the estrogenic chemicals can sum their effects when in
mixtures, as shown in vivo and in vitro, which means that collectively, they may repre-
sent a significant environmental risk, even when each compound is present at low-
effect concentrations (Brian et al., 2007; Evans et al., 2012). So, notwithstanding those
chemicals maybe assume as of low dangerousness, we cannot rule out the possibility
of risks at long time, with chronic effects, thus the relevance of monitoring.
Despite the alkylphenols mixture has a lowest estrogenic potential then the E2 5
µg/L, it was clear that it caused more damaging effects (at least in view of the parame-
ters considered in this study), probably by acting in other cellular pathways, independ-

DIS
CU
SS
ION
69
ent of ERs; as discussed below. Note that E2 is a natural ligand and that alkylphenols
are artificial ligands that bind indeed to ERs with estradiol, but are liable to cause sev-
eral other toxic effects, especially in chronic high concentrations. Molecules from the
alkylphenol family, like the 4-nonylphenol (NP) or the 4-tert-octylphenol (OP), are used
in various industrialized processes and released in the environment, being common
aquatic pollutants. Eventually they become persistent pollutants that are poorly elimi-
nated by liver detoxification enzymes in mammals and that can affect the cells (Ajj et al,
2013). In fact, alkylphenols were detected in the urine of 95% of a human test popula-
tion from the United States and, despite controversy, have been associated to health
problems like reduction in fertility and meiotic disruptions (Calafat et al, 2005) Addition-
ally, it has been reported that alkylphenols are toxic to animals, plants and micro-
organisms, including rainbow trout, where, elaborate tests were performed, for instance
using primary culture of hepatocytes (Bhattacharya et al, 2008; Tollefsen et al, 2008).
Alkylphenols are considered endocrine disrupting compounds eventually enable
to promote the progression of estrogen-dependent cancers and cause interference with
reproductive functions and normal developmental of fish (Harris et al, 2000; Kayama et
al, 2003; Soares et al, 2008; Tollefsen et al, 2008). The explanation to this is found in
the experiments that indicate alkylphenols capacity to mimic estrogen mitogenic signal-
ing, in mouse through the binding affinity to17β-estradiol (E2), in the range of 0.1% for
the nuclear receptor ERa66 and of 50% for the transmembrane g-protein coupled es-
trogen receptor (GPER) (Ajj et al, 2013). In 1938, it was published the first evidence
that alkylphenols could be oestrogenic, but only in 1991 it was observed that nonylphe-
nol was capable of initiating proliferation in breast tumor cells as if oestrogens were
present (Soares et al, 2008). Presently, it seems clear that alkylphenolic compounds
may play a role in breast cancer incidence (Darbre, 2006; Villeneuve et al, 2010). Ac-
tually it is hypothesized that alkylphenols increase the probability of acquiring a muta-
tion in oncogenes or tumor suppressor genes, either by interfering with the metabolism
of endogenous steroid hormones or by becoming mutagenic upon sulfonation (Seth et
al, 2000; Gray et al, 2009).
Additionally, it has been shown that CYP1A activity is inhibited by alkylphenols
in several fish species, which may have consequences in clearance of xenobiotics,
resulting in the accumulation of harmful compounds. Besides its detoxifying function,
CYP1A also mediate the metabolism of xenobiotics, a process that can also lead to the
formation of reactive oxygen species (ROS) (Sturve et al, 2006).
Finally, other fact to take in consideration is that the hydrophobic alkyl residue
can induce alterations in cell membranes, by increasing membrane permeability and
causing cell leakage and loss of ions (Bhattacharya et al, 2008). Watson et al (2010)

DIS
CU
SS
ION
70
refer that alkylphenols was quite potent in several performed assays for nongenomic
responses, including PRL release, cell proliferation, calcium (Caþþ) influx, and in the
activation of mitogen-activated protein kinases.
PRE-INITIAL FOCI (PRE-FCA)
During the observations we verified that FCA seemed to have an early stage of
poorer definition, a feature that, to best our knowledge, was never emphasized before
and/or distinctly described in the literature — so, and at least provisionally, we called
those stages as Pre-FCA. This naming presumes that, if evolving, the change will turn
into a well-differentiated type of FCA. After careful considering all the variable aspects
seen in our material, we advanced the following criteria for the classification of this type
of finding:
(1) Lesion composed by less than 12 cells (in a 2D-perspective, i.e., when sec-
tioned);
(2) Presence of a mixture of normal and altered hepatocytes, making the lesion
heterogeneous (making it difficult the limitation of the lesion, in more than 50% of its
perceived boundary);
(3) Lesion already presenting a tinctorial change, however without a trabecular
aspect or any increase of the vascularization.
It must be stressed that Pre-FCA were not easy to detect a low magnification
when the normal parenchyma was normally basophilic, being the digital microscopy a
very useful tool in these cases. Besides the difficulty in diagnosing on those occasions,
we may reason that Pre-FCA can be a peripheral part of a differentiated FCA; derived
from a tangential section of the FCA. To discern this, the second and third criteria
above were essential. In cases where the hepatocellular parenchyma presented a high
level of heterogeneity — i.e., with hepatocytes displaying a more vacuolated aspect in
some areas in parallel with more basophilic tinge in other zones — and a higher num-
ber of sectioned FCA, the Pre-FCA identification was almost impracticable; very com-
mon situation in E2 50 µg/L group.
In the end, the differential diagnostic between Pre-FCA and well-established
FCA is possible, and in our opinion, this distinction can have a major significance. For
example, the detection of this early stage can point to the possibility of a reversible
stage. Under this presumption, if the promoting stimulus stopped the Pre-FCA could
disappear and not evolve to FCA, and further to hepatocellular adenomas (HCA) and
ultimately to HCC. Myers et al (1987) even suggested that FCA can be back into nor-
mal parenchyma if the stimulating contaminant is removed, an assumption mentioned

DIS
CU
SS
ION
71
recently by Oliva et al. (2013), whom pointed it like a possible complicating factor in the
interpretation of data for lesions. Thoolen et al. (2012) also referred the same and add-
ed that different types of FCA had different potentials for developing into neoplasms.
Anyway, both the nature and the reversibility potential of Pre-FCA and FCA deserve
detailed experimental modeling, namely because they early signal significant risks, in
an ecotoxicological context and individually.
DIAGNOSIS AND IMAGING ANALYSIS: DIFFICULTIES AND FINDINGS
One true challenge for diagnosis of the pre-neoplasms was the great heteroge-
neity of the parenchyma in certain animals and/or the fact that sometimes all the liver
seemed like an immense focus; two situations that turned the limitation of the focal
lesions very difficult. We hypothesized that the described scenario should be viewed as
“normal”, considering that the liver (at least of exposed animals) was being chronically
challenged to detoxify the xenobiotics reaching the blood stream and ultimately the
liver. Such kind of histological heterogeneity of the all parenchyma (and eventually an
adaptive change) was not particularly stressed in previous carcinogenesis assays, but,
in theory, it should have metabolic implications. This issue will be discussed further
below, when dealing with the comparison of the seemingly normal parenchyma that we
analyzed in every group.
Other difficulty concerned the foci at the margins of the sections, because they
can be mistaken with histological artifacts, like tissue compression or staining accumu-
lation, or with parenchymatous peripheral alteration. These aspects had not been ad-
dressed in the literature, but they should be reported so that common diagnosis criteria
are established.
The classification between basophilic, eosinophilic and amphophilic was not a
linear task as it may seem — namely in view of the reasonably clear published criteria
— because FCA can be heterogeneous, comparing intra and inter sections within
slides, in which concerns staining or aspect, both influenced by the parenchyma type
itself. For instance, in a vacuolated parenchyma, the detection was faster and precise,
since FCA, rich in determined cytoplasmic constituents; easily stand out by the stain-
ing. Boorman et al. (1997) previous stated that it is complex to diagnose the foci just
based on staining, as the sex of the specimen, section thickness, or the staining quali-
ties of a particular lesion can influence the aspect of a particular FCA to the observer;
impacting on the diagnosis.
When diagnosing the lesions we observed that FCA were preferentially located
at perivascular zones (50% of cases), a feature that was more evident in the more ex-

DIS
CU
SS
ION
72
tensive FCA. This points to the question: besides the increased capillary dilatation, and
thus of blood supply that is always associated with increased the trabecular aspect, is
there also preneoplastic neoangiogenesis (with formation of new blood vessels) that
significantly contribute to the foci development and the later neoplastic transformation?
Alternatively, is there a trend for the FCA to develop near larger blood vessels because
initiation and/or promotion factors are more available on those areas? These facts are
worth investigating, and to our knowledge, the FCA spatial trends of localization have
not been addressed yet.
Another interest fact herein was the frequent fragility of the sections in the FCA
spots, suggesting the possibility of intercellular adhesion be more fragile there. Another
option is that it is simply an artifact, but this seems unlikely because of the frequency of
the event.
THE NORMAL PARENCHYMA
Based on the clear difference observed between the cell and nuclear volume of
hepatocytes from the blank control group and from all the four groups with lesions, we
can reason that the presence of lesions (i.e., of an undergoing pre-neoplastic process)
leads to the creation of a microenvironment that results in significant morphological
alterations in the hepatocytes; which may be viewed as a proxy of functional differ-
ences too. The morphological hypertrophy of the hepatocytes and their nuclei, regard-
less of estrogenic stimulation, can be viewed as a physiological adaption in response to
some greater functional need or to other stresses (e.g., Wei et al., 2012). By other
hand, that kind of cell hypertrophy could result from some kind of signaling coming from
the FCA. Hepatocyte hypertrophy is a well-known first response to the removal of liver
mass, and is controlled by several local (complex and ever increasing) signal network
(Miyaoka and Miyajima, 2013) — eventually, as the FCA emerge and progress they
could signal a “loss of healthy liver”, inducing bigger cells in the normal parenchyma.
Facing the background, this interesting hypothesis does not seem too speculative to us
and could be investigated futurely, in fish and also in a better known rodent model.
Looking to the CVn () we verified that the nuclear heterogeneity was elevated
in all the groups with lesions (being statistically different from the blank control), possi-
bly pointing to an increase in the degree of morphological diversity/dysplasia. This pa-
rameter was computed only for the nuclear volume since this factor has been used as
a proxy of cell heterogeneity or even dysplasia, which is logical given the fact that the
nuclei is the metabolic center of the cell.

DIS
CU
SS
ION
73
Our results assume relevance since we verified that changes occur in the normal
hepatocyte phenotype, additionally to those already observed at a molecular level, as
described for instance by Mirbahai et al. (2011), who stated that global methylation was
statistically significantly reduced in hepatocellular adenoma and in non-cancerous sur-
rounding tissues, when compared with livers from non-cancer bearing dab (Limanda
limanda, a flatfish). In the same vein, Roskams et al. (2000), in an attempt to discover if
the hepatocellular cancer influence/induced suicide in peritumoral cells, also verified a
high co-expression of Fas (factor receptor apoptosis mediator) and Fas-L (Fas ligand)
in hepatocytes immediately adjacent to HCCs. This again supports the notion that ne-
oplastic (and eventually the pre-neoplastic lesions) lesions do influence the normal
hepatocytes, which may underlie the morphofunctional changes that are found in our
study and other. Thereby, these morphofunctional alterations identified in the apparent-
ly normal parenchyma can help researchers to recognize, at early stages, that lesions
are emerging, calling for the development of integrated biomarkers to detect them.
ALTERED PARENCHYMA: VOLUME PARAMETERS OF bFCA AND aFCA
The results from the comparison between the four fish groups having FCA, re-
garding the several stereological parameters from bFCA and aFCA, meet with previous
outcomes, which highlight the powerful estrogenic potential of E2 at 50 µg/L, and sup-
port the hypothesis of a protective effect of E2 at 5 µg/L; which continuous to trigger the
lowest values. Somewhat surprisingly, the bFCA and aFCA in the Alkylphenols group
and even from Vehicle Control overlapped the E2 50 µg/L group regarding (hepato-
cyte). This means that the hypertrophy of the nucleus is not strictly proportionally ac-
companied by all the cell volume, resulting in an elevated ratio nucleus/cell. Besides
that, with these results, it became more probable that alkylphenols may trigger different
cellular mechanisms when compared with E2, despite their action being mostly associ-
ated with similar (usually milder) effects of estrogens. It is also interesting to note that
in the analysis of the Table 7 and 8, which included every type of FCA, the groups did
not seem to differ from each other, only from blank control, and now we can clearly
verify the differences, fundamentally between the E2 5 µg/L and E2 50 µg/L and the
remaining groups; whereas fish from Alkylphenols and Vehicle Control groups still pre-
sent similar outcomes. Thus, the global analysis, involving the three types of FCA, dif-
fers from the individual, which points to the importance of sub-groups identification.
Observing the results of the VV (sinusoid) within the FCA, the groups are not dif-
ferent from each other, indicating the possibility of an optimal level of vascularization
for the development of FCA. Concerning the VV (nucleus) within the FCA, the estrogen-

DIS
CU
SS
ION
74
ic impacts seen in the E2 5 µg/L and E2 50 µg/L groups surpassed those of the Vehicle
Control, in both bFCA and aFCA, according with the trend for increased of the ratio
nucleus/cell, especially at the highest E2 concentration, and in line with the well-known
fact that such an increased ratio and amplified presence of nuclei are associated with
pre-neoplastic dysplasia. In short, the data support a higher impact on hepatocytes as
estrogenic dose increases.
HISTOCHEMISTRY
The Perls’ staining is commonly used in liver to examine the presence of ferric
iron (Fricke et al, 2012; Dabrowska et al 2012; Myers et al, 2003). The results herein
were not the expected, since we did not verify the resistance of iron uptake and deposi-
tion in FCA as suggest by Feist (2004). We can argue that this difference may be con-
nected with factors, such as type of initiator, the estrogenic stimuli, the species, among
other, thus warning against generalizations when the knowledge of fish liver carcino-
genesis is still meager.
Sirius red staining has also been used in liver lesions to detect collagen depos-
its, particularly pericellular material surrounding degenerative hepatocytes (He et al,
2013; Hobbie et al, 2012). In this case, we resource to Sirius red to visualize a possible
thickness of blood vessels inside the FCA, by staining the fibrillar collagen. Comparing
the vessels in the normal parenchyma with those in the FCA, we did not observe signif-
icant differences, however, when we compared both situations with the scenario in an
adenoma the scenario changed, and we detected a slight increase in thickness of the
blood vessels. In the Japanese medaka (Oryzias latipes), a stronger Sirius red staining
in animals exposed an initiator agent was interpreted as an increased collagenous ma-
trix deposition due to the restructuring of the hepatic architecture after the injury (Hob-
bie et al 2012). In our case, as the lesions, and particularly, the hepatocellular adeno-
ma evolves, the architecture is expected to change along with hypervascularization.
On the other hand, glycogen-storing is likewise a relevant aspect analyzed in
hepatic tissue, given the several associated diseases (Özen, 2007), and even in hepa-
tocarcinogenesis (Banasch et al, 2003). As mentioned before, the type of FCA with
increased glycogen storage is the clear cell one, so PAS staining can be used to diag-
nosis this foci, remembering, however, that glycogen may be partially lost because of
the histological process. Based on the possible evolution of the FCA, explained also
above, we expected not to detect any trace of glycogen in eosinophilic foci and a pos-
sible slight occurrence in basophilic foci. Sato et al (2013), when observing spontane-

DIS
CU
SS
ION
75
ous amphophilic foci in a young rat, stated that glycogen content of the hepatocytes
within the lesion was relatively less comparing with the normal area, whereas some
hepatocytes had abundant glycogen. This fact was also previously verified by Mayer
(2003), in a study based on the induction hepatic pre- and neoplasia in the rat with de-
hydroepiandrosterone, where she describes amphophilic foci as a lesion with a very
low glycogen content and low activity of key enzymes of glucose metabolism, high ac-
tivity of mitochondrial and peroxisomal enzymes, as well, lysosomal acid phosphatase.
Our results were different, more complex, since we saw clear heterogeneity among the
amphophilic FCA, visualizing in some cases more glycogen within the FCA than in the
surrounding parenchyma. By the contrary, basophilic and eosinophilic FCA, and even
the adenoma, presented less glycogenic content comparing with the parenchyma. Here
we were expecting to verify an aspect to support the evolution line, but we found a het-
erogeneous middle stage (amphophilic FCA) and equal scenario in opposite phases
(basophilic and eosinophilic FCA). However, based on the majority of the studied cas-
es, it seems to be a deficiency in glycogenic component in FCA comparing with the
surrounding parenchyma, which is in accordance with previous studies. Anyway, our
data reveals that FCA of the same type may reveal dissimilar histochemical profiles.
IMMUNOHISTOCHEMISTRY
E-cadherin, as a key cell adhesion protein, is implicated in a variety of morpho-
genetic events, including cellular growth and transformation, cell migration, separation
and formation of boundaries between cell layers and differentiation of each cell layer
into functionally distinct structures. Since changes in adhesion complexes may lead to
alterations of cell polarity, proliferation, mobility, and differentiation, E-cadherin plays a
critical role as invasiveness suppressor in carcinomas (Wei et al, 2002; Calvisi et al,
2004).
In a diversity of cancers, reduced expression of E-cadherin has been correlated
with disruption of cell-cell contacts, epithelial-mesenchymal transition, invasiveness,
and metastatic potential (Wei et al 2002), being a frequent finding in liver cancer
(Prange et al, 2003) and its down-regulation closely related to the progression of HCC
(Matsumura et al, 2001; Kwon et al, 2005). Our results support these previous studies,
since we observed a negative pattern in E-cadherin immunoreactivity within the FCA,
differing from the surrounding parenchyma. It is a very interest fact, since we can verify
the loss of this protein in a so early phase of the lesion, a feature that probably has a
critical role in FCA progression. We wondered whether or not there are differences of
E-cadherin staining between different types of FCA, but in this approach we did not

DIS
CU
SS
ION
76
have the time to investigate this issue further. Yet, it is worth checking it in the future
facing the differential diagnose potential.
Cytochrome P450 (CYP) plays a crucial role in oxidative metabolism of lipo-
philic drugs and xenobiotics (possible carcinogens). During hepatocarcinogenesis, the
expression of drug metabolism enzymes can be altered, being CYP induction influ-
enced by a number of exogenous and endogenous factors (Liu et al, 2005). Also, it
already described that modification of CYP activities in rats can be a determinant factor
for the resistance vs susceptibility to xenobiotics in the early hepatocarcinogenesis
stages (Maliakal et al, 2002). The CYP decreased expression in preneoplastic lesions
could alter the synthesis and/or inactivate endogenous and/or exogenous substance,
which act as tumor promoters (Liu, 2005). On the other hand, Jaeschke et al (2001)
concluded that induction of CYP isoenzymes can promote oxidant stress and cell inju-
ry.
CYP1A, one of the main cytochrome P450 enzymes, can function as marker to
characterize the carcinogenic potential of xenobiotics (Liu, 2005). Androutsopoulos
(2009) stated that CYP1A1 can play an important role in the detoxification of environ-
mental carcinogens, thus contributing to prevent cancer, or act in procarcinogen activa-
tion and lead to cancer progression. So, several P450 substrates are carcinogenic,
while other substrates are anti-cancer drugs, resulting in its different potentially im-
portant roles in tumor biology and progression (Murray, 2000). We observed herein
heterogeneity between aFCA and eFCA, with distinct patterns of CYP1A immunoreactivity,
ranging from very weak to strong signals. Only in bFCA, we verified a more linear pat-
tern, with the consistent weaker intensity. Once again, we were not able to find a fea-
ture to clarify the “evolution line” of FCA, observing a heterogeneous middle stage
(aFCA), and a similar scenario in “opposite” foci phases (i.e., bFCA and eFCA). These
results strongly point for the possible existence of different phenotypes within same
type of FCA, which is poorly/non-studied issue, but that could help explain, for instance
the fate of individual FCA irrespective of the type. The data point also for a more com-
plex scenario that usually referred in the literature, that often presents the FCA as a
unique homogenous entity, when, in the light of the fact that a tumor (inc. hepatocellu-
lar carcinomas) may be monoclonal or polyclonal, homogenous or heterogeneous
(Kawai et al, 1995; Marusyk et al, 2010), it makes sense to reason that a type of FCA
may indeed correspond to multiple morphofunctional entities according to the underly-
ing genetic/epigenetic events.
Regarding the immunohistochemistry, we were only able to perform a first ap-
proach that nevertheless proved to be successful, with promising discriminative results,
suggesting that in the future this subject should be exhaustively studied with a ample

DIS
CU
SS
ION
77
panel and number of cases. Indeed, it is our intention to advance in this vein in the next
future.


CO
NC
LU
SIO
N A
ND
PE
RS
PE
CT
IVE
S


CO
NC
LU
SIO
N A
ND
PE
RS
PE
CT
IVE
S
81
CONCLUSION AND PERSPECTIVES
In the end of the work we were able to respond to the proposed objectives de-
scribed in the Introduction, opening good perspectives for the continuation of the study.
The virtual slide and the image analysis measurements obtained with the basic
slide scanner software proved to be beneficial to the efficiency on this type of screening
diagnosis and quantification, and we recommend it for further studies of the same sort.
The protocol for inducing the emergence of a carcinogenesis process based on
a single initial bath of eye-egg embryos in a water solution of MNNG was successful.
However, the time from exposure to sampling allowed the emergence of preneoplastic
lesions only, mostly FCA and a couple of hepatocellular adenomas. For ending up with
carcinomas, either the dose of MNNG and/or the time up to sampling should increase.
It was clear that estrogenic stimulation can act as a promoter, being E2 at high
dose more effective when compared with the alkylphenols mixture. Indeed, the group
E2 50 µg/L stood out with greater frequencies (100% in FCA prevalence), a tendency
also noted in the volume parameters. We were not expecting that the results group E2
5 µg/L (namely, the lowest FCA prevalence) pointed for potential paradoxical effects of
estrogens — protector and promoter. Thus, it became difficult to predict the outcomes
since they apparently depend on the doses and even when chemicals seem to assume
a low dangerousness, we cannot rule out the possibility of risks at long time, stressing
the importance of a continuous monitoring when exposure exists. Notwithstanding the
alkylphenols mixture lowest estrogenic potential then E2 at 5 µg/L group, the fact is that
it may trigger more damaging effects (at least in view of the parameters considered in
this study), eventually by combining a xenoestrogenic action with other different cellular
mechanisms/pathways.
The classification of FCA was not so linear as we could thought from the litera-
ture, but despite some uncertainties during certain diagnoses, they were not major ob-
stacles. During the observation of the slides, we were able to establish differential crite-
ria for what seem to be FCA in early stages and poorer definition, which we called Pre-
FCA. It was also interesting to verify that, when parameters were compared in a global
analysis (summing all three types of FCA) and then in type-by-type analysis, the results
provided new insights, proving the importance of sub-groups identification.
Our data revealed that the same type of tinctorial FCA may express dissimilar
histochemical and immunohistological profiles, leading to a complex scenario and pre-
senting the FCA as multiple morphofunctional entities. This possible existence of dif-
ferent phenotypes did not help us to clarify the “evolution line” of FCA, adding to the
fact that some of our results did not agree with the most usual idealized path, where

CO
NC
LU
SIO
N A
ND
PE
RS
PE
CT
IVE
S
82
bFCA is viewed as the preneoplastic stage that precedes the HCC. However, in this
approach, we did not have the time to investigate this issue further in terms of special
histo/immuno-tagging techniques, namely in view of its differential diagnose potential.
On the other hand, our results pointed to previously unidentified changes that
occur in the apparently normal parenchyma, in presence of FCA, which not only sug-
gest some sort of influence of the carcinogenesis process in the all liver, even if not
clearly lesioned, but open the door for using such information as part of a biomarker
panel that could to recognize, in an early stage, that neoplastic lesions are emerging.
Future studies of these presumptive preneoplastic lesions, especially at a mo-
lecular level, should help to characterize with more detail each type of FCA, clarifying
its evolution line, defining their role in progression to malignancy and even testing the
existence of a reversible stage. As reasoned, this can lead to biomarkers for early di-
agnosis, prognosis and interventions, both in terms of environmental health and even-
tually even in possible preventive/treatment approaches. The findings of this work,
complemented with further investigation, should also provide a basis for understanding
liver responses after exposure to estrogens post-initiation, which can predict risks and
dangerous outcomes, not only for fishes exposed to pollutants but even up to Humans.

AC
KN
OW
LE
DG
EM
EN
TS
TO
FU
ND
ING
AG
EN
CIE
S


AC
KN
OW
LE
DG
EM
EN
TS
TO
FU
ND
ING
AG
EN
CIE
S
85
ACKNOWLEDGEMENTS TO FUNDING AGENCIES
This work was partially supported by the European Regional Development Fund
(ERDF) funds through the Competitiveness and Trade Expansion Program (COMPETE)
and by National Funds as provided by the Foundation for Science and Technology (FCT),
via the research projects PTDC/MAR/70436/2006 and PEst-C/MAR/LA0015/2013.


RE
FE
RE
NC
ES


RE
FE
RE
NC
ES
89
REFERENCES
Ajj H., Chesnel A., Pinel S. et al (2013), An alkylphenol mix promotes seminoma derived
cell proliferation through an ERalpha36-Mediated Mechanism, PLoS One, vol., 8,
e61758.
Al-Janabi S., Huisman A. and Van Diest P. (2012), Digital pathology: current status and
future perspectives, Histopathology, vol. 61, pp: 1–9.
Androutsopoulos V., Tsatsakis A. and Spandidos D. (2009), Cytochrome P450 CYP1A1:
wider roles in cancer progression and prevention, BMC Cancer, vol. 9, 187.
Arias I., Wolkoff A., Boyer J. et al (2009), The liver: biology and pathobiology (5th edition),
Wiley-Blackwell.
Assis S., Warri A., Cruz I. et al (2012), High-fat or ethinyl-oestradiol intake during preg-
nancy increases mammary cancer risk in several generations of offspring, Nature
Communications, vol. 3, 1053.
Avellini C., Cesselli D., Beltrami A. et al. (2013), Chapter 9: Conditions that predispose to
the development of HCC: the role of tumor associated fibroblasts and of microRNA. In
Kaseb A., Hepatocellular Carcinoma - Future Outlook (175-195), InTech.
Azam F. and Koulaouzidis A. (2008), Hepatitis B virus and hepatocarcinogenesis, Annals
of Hepatology, vol. 7, pp: 125-129.
Baglinière J. (1999), Introduction: The brown trout (Salmo trutta L)—its origin, distribution
and economic and scientific significance. In Baglinière J. and Maisse G. (1-12), Biolo-
gy and Ecology of the Brown and Sea Trout, Praxis Publishing.
Bailey G., Selivonchick D. and Hendricks J. (1987), Initiation, promotion, and inhibition of
carcinogenesis in rainbow trout, Environmental Health Perspectives, vol. 71, pp: 147-
153.
Bailey G, Williams D. and Hendricks J. (1996), Fish models for environmental carcinogen-
esis: the rainbow trout, Environmental Health Perspectives, vol. 104, pp: 5–21.
Bannasch P., Haertel T. and Su Q. (2003), Significance of hepatic preneoplasia in risk
identification and early detection of neoplasia, Toxicologic Pathology, vol. 31, pp:
134–139.
Benninghoff A. and Williams D. (2008), Identification of a transcriptional fingerprint of es-
trogen exposure in rainbow trout liver, Toxicological Sciences, vol. 101, and pp: 65–
80.
Bialecki E. and Bisceglie A. (2005), Diagnosis of hepatocellular carcinoma, The Official
Journal of the International Hepato-Pancreato-Biliary Association (HPB), vol. 7, pp:
26–34.
RE
FE
RE
NC
ES
90
Bhattacharyaa H., Xiaob Q. and Lunc L. (2008), Toxicity studies of nonylphenol on rosy
barb (Puntius conchonious): A biochemical and histopathological evaluation, Tissue
and Cell, vol. 40, pp: 243–249.
Blazer V., Fournie J., Wolf J. et al. (2006), Diagnostic criteria for proliferative hepatic le-
sions in brown bullhead Ameiurus nebulosus, Diseases of Aquatic Organisms, vol.
72, pp: 19–30.
Blonski W., Kotlyar D. and Forde K. (2010), Non-viral causes of hepatocellular carcinoma,
World Journal Gastroenterology, vol. 16, pp: 3603-3615.
Boorman G., Botts S., Buton T. et al. (1997), Diagnostic criteria for degenerative, inflam-
matory, proliferative nonneoplastic and neoplastic liver lesions in medaka (Oryzias
latipes) Consensus of a National Toxicology Program Pathology Working Group, Tox-
icologic Pathology, vol.25, pp: 202-210.
Bosetti C., La Vecchia C., Lipworth L. et al (2003), Occupational exposure to vinyl chloride
and cancer risk: a review of the epidemiologic literature, European Journal of Cancer
Prevention, vol. 12, pp: 427-430.
Brian J., Harris C. and Scholze M. (2007), Evidence of estrogenic mixture effects on the
reproductive performance of fish, Environmental Science & Technology, vol.41, pp:
337–344.
Bryan C (1930). The Papyrus Ebers, Geoffrey Bles, Suffolk Street, Pall Mall, London,
S.W.t.
Cabrera R. and Nelson R. (2010), Review article: the management of hepatocellular car-
cinoma, Alimentary Pharmacology & Therapeutics, vol.31, pp: 461–476.
Calabrese E. (2002), Hormesis: changing view of the dose-response, a personal account
of the history and current status, Mutation Research, vol. 511, pp: 181-189.
Calafat A., Kuklenyik Z., Reidy J. et al (2005), Urinary Concentrations of Bisphenol A and
4-Nonylphenol in a Human Reference Population, Environmental Health Perspec-
tives, vol.113, pp: 391-395.
Calvisi D., Ladu S., Conner E. et al (2004), Disregulation of E-cadherin in transgenic
mouse models of liver cancer, Laboratory Investigation, vol.84, pp: 1137-1147.
Chang M. (2011), Dual roles of estrogen metabolism in mammary carcinogenesis, BMB
reports, vol.44, pp: 423-434.
Chuang S., Vecchia C. and Boffetta P. (2009), Liver cancer: Descriptive epidemiology and
risk factors other than HBV and HCV infection, Cancer Letters, vol. 286, pp: 9–14.
Darbre P. (2006), Environmental oestrogens, cosmetics and breast cancer, Best Practice
& Research Clinical Endocrinology & Metabolism, vol. 20, pp: 121-43.
Dabrowska H., Ostaszewska T., Kamaszewski M. et al (2012), Histopathological, histo-
morphometrical, and immunohistochemical biomarkers in flounder (Platichthys flesus)

RE
FE
RE
NC
ES
91
from the southern Baltic Sea, Ecotoxicology and Environmental Safety, vol.78, pp: 14-
21.
Dee F. (2006), Virtual microscopy for comparative pathology, Toxicologic Pathology, vol.
34, pp: 966–967.
Dyk J., Cochrane M.J. and Wagenaar G.M. (2012), Liver histopathology of the sharptooth
catfish Clarias gariepinus as a biomarker of aquatic pollution, Chemosphere, vol. 87,
pp: 301–311.
Enzmanna H, Brunnemannb K., Kaestner B. et al. (2014), Dose-dependent induction of
preneoplastic lesions by the tobacco-specific nitrosamine carcinogen NNK in the in
ovocarcinogenicity assessment (IOCA) assay, Experimental and Toxicologic Patholo-
gy, vol. 66, pp: 35– 40.
Enzmanna H., Brunnemannb K., Iatropoulos M. et al. (2013), Inter-laboratory comparison
of turkey in ovo carcinogenicity assessment (IOCA) of hepatocarcinogens, Experi-
mental and Toxicologic Pathology, vol. 65, pp: 729– 735.
Evans R., Scholze M. and Kortenkamp A. (2012), Additive mixture effects of estrogenic
chemicals in human cell-based assays can be influenced by inclusion of chemicals
with differing effect profiles, PLOS One, vol.7, e43606.
Evered A. and Dudding N. (2011), Accuracy and perceptions of virtual microscopy com-
pared with glass slide microscopy in cervical cytology, Cytopathology, vol. 22, pp: 82–
87.
Feist S., Lang T., Stentiford G. et al (2004), Biological effects of contaminants: Use of liver
pathology of the European flatfish dab, No. 38 of ICES techniques in marine environ-
mental sciences, International Council for the Exploration of the Sea.
Ferenci P., Fried M., Labrecque D. et al. (2010), Hepatocellular Carcinoma (HCC): a
global perspective, Journal of Clinical Gastroenterology, vol. 44, pp: 239-245.
Ferlay J., Shin H., Bray F. et al. (2010), Estimates of worldwide burden of cancer in 2008:
GLOBOCAN 2008, International Journal of Cancer, vol. 127, pp: 2893–2917.
Ficsor L., Varga V., Tagscherer A. et al (2008), Automated classification of inflammation in
colon histological sections based on digital microscopy and advanced image analysis,
Cytometry Part A, vol.73, pp: 230-237.
Fricke N., Stentiford G. and Feist S. (2012), Liver histopathology in Baltic eelpout (Zoarc-
es viviparus) - A baseline study for use in marine environmental monitoring, Mar Envi-
ron Res, vol. 82, pp: 1-14.
Fucic A., Gamulin M., Ferencic Z. et al. (2012), Environmental exposure to xenoestrogens
and oestrogen related cancers: reproductive system, breast, lung, kidney, pancreas,
and brain, Environmental Health, vol. 11, pp: 8.

RE
FE
RE
NC
ES
92
Gilbertson J., Ho J., Anthony L. et al (2006), Primary histologic diagnosis using automated
whole slide imaging: a validation study, BMC Clinical Pathology, vol. 6, pp: 4.
Globocan 2012: Estimated Cancer Incidence, Mortality and Prevalence Worldwide in
2012. Accessed on 3rd May, 2014, in http://globocan.iarc.fr/Pages/fact_
sheets_population.aspx.
Gray J., Evans N., Taylor B. et al (2009), State of the evidence: the connection between
breast cancer and the environment, International Journal of Occupational and Envi-
ronmental Health, vol. 15, pp: 43-78.
Gundersen J. and Jensen J. (1985), Stereological estimation of the volume-weighted
mean volume of arbitrary particles observed on random sections, Journal of Micros-
copy, vol. 138, pp: 127-42.
Hamilton S. and Aaltonen L. (2000), Pathology and genetics of tumors of the digestive
system, World Health Organization Classification of Tumors, International Agency for
Research on Cancer (IARC), pp: 314.
Harris R., Waring R., Kirk C. et al (2000), Cell biology and metabolism: Sulfation of ''estro-
genic'' alkylphenols and 17 β-estradiol by human platelet phenol sulfotransferases,
The Journal of Biological Chemistry, vol.275, pp: 159-166.
Harris T., Leaven T., Heidger P. et al (2001), Comparison of a virtual microscope laborato-
ry to a regular microscope laboratory for teaching histology, The Anatomical Record
(New Anat.), vol. 265, pp: 10–14.
Havelková M., Randák T., Blahová J. et al (2008), Biochemical markers for the assess-
ment of aquatic environment contamination, Interdisciplinary Toxicology, vol.1, pp:
169–181;
He G., Dhar D., Nakagawa H. et al (2013), Identification of liver cancer progenitors whose
malignant progression depends on autocrine IL-6 signaling, Cell, vol.155, pp: 384-96.
Hemming A., Cattral M., Reed A. et al (2001), Liver transplantation for hepatocellular car-
cinoma, Annals of Surgery, vol. 233, pp: 652–659.
Hobbie K., DeAngelo A., George A. et al. (2012), Neoplastic and nonneoplastic liver le-
sions induced by dimethylnitrosamine in japanese medaka fish, Veterinary Pathology,
vol. 49, pp: 372-385.
Howard V. and Reed M. (2005), Unbiased stereology: three-dimensional measurement in
microscopy (2nd Edition), Advanced Methods.
Irigaray P. and Belpomme D. (2010), Basic properties and molecular mechanisms of ex-
ogenous chemical carcinogens, Carcinogenesis, vol.31, pp: 135–148.
Jaeschke H., Gores G., Cederbaum A. et al (2001), Mechanisms of hepatotoxicity, Toxi-
cological Sciences, vol.65, pp: 166-176.

RE
FE
RE
NC
ES
93
Jemal A., Bray F., Center M. et al. (2011), Global cancer statistics, CA: A Cancer Journal
for Clinicians, vol. 61, pp: 69–90.
Jemal A., Center M., DeSantis C. et al. (2010), Global patterns of cancer incidence and
mortality rates and trends, Cancer Epidemiology, Biomarkers & Prevention, vol.19,
pp: 1893-1907.
Kayama F., Horiguchi H. and Hamamatsu A. (2003), Potential Health Effects of Alkylphe-
nols in Japan, Japan Medical Association Journal, vol.46, pp: 108–114.
Kalra M., Mayes J., Assefa S. et al. (2008), Role of sex steroid receptors in pathobiology
of hepatocellular carcinoma, World Journal of Gastroenterology, vol. 14, pp: 5945-
5961.
Kanwal F., Befeler A., Chari R. et al. (2012), Potentially curative treatment in patients with
hepatocellular cancer—results from the liver cancer research network, Alimentary
Pharmacology & Therapeutics, vol. 36, pp: 257–265.
Kawai S., Imazeki F., Yokosuka O. et al (1995), Clonality in hepatocellular carcinoma:
analysis of methylation pattern of polymorphic X-chromosome-linked phosphoglycer-
ate kinase gene in females, Hepatology, vol.22, pp: 112-117.
Klontz G. (1991), Manual for rainbow trout production on the family-owned, Nelson &
Sons, Inc., Murray, UT.
Koehler A. (2004), The gender-specific risk to liver toxicity and cancer of flounder (Platich-
thys flesus (L.)) at the German Wadden Sea coast, Aquatic Toxicology, vol. 70, pp:
257–276.
Kwon G., Yoo B., Koh K. et al (2005), Promoter methylation of E-cadherin in hepatocellu-
lar carcinomas and dysplastic nodules, Journal of Korean Medical Science, vol.20,
pp: 242-247.
Lam S., Wu Y., Vega V. et al. (2013), Conservation of gene expression signatures be-
tween zebrafish and human liver tumors and tumor progression, Nature Biotechnolo-
gy, vol. 24, pp: 73-75.
Laroche J., Gauthier O., Quiniou L. et al. (2013), Variation patterns in individual fish re-
sponses to chemical stress among estuaries, seasons and genders: the case of the
European flounder (Platichthys flesus) in the Bay of Biscay, Environmental Science
and Pollution Research, vol. 20, pp: 738–748.
Lerceteau-Köhler E., Schliewen U., Kopun T. et al (2013), Genetic variation in brown trout
Salmo trutta across the Danube, Rhine, and Elbe headwaters: a failure of the phylo-
geographic paradigm?, BMC Evolutionary Biology, vol. 13,176.
Leroy B. (2013). The expanding spectrum of animal cancer models, American College of
Veterinary Pathologists. Accessed in 3 may, 2014, in http://www.acvp.org/ meet-
ing/2013/PDF/Proceedings_Sample.pdf.

RE
FE
RE
NC
ES
94
Lieschke G. and Currie P. (2007), Animal models of human disease: zebrafish swim into
view, Nature Reviews – Genetics, vol.8, and pp: 353-67.
Lipscomb M. (1994), Chapter 16: Liver and biliary tract. In Kumar V., Cotran R. and Rob-
bins K., Basic Pathology (5th edition) (426-461), Guanabara Koogan.
Liu L., Gong L., Qi X. et al (2005), Altered expression of cytochrome P450 and possible
correlation with preneoplastic changes in early stage of rat hepatocarcinogenesis, Ac-
ta Pharmacologica Sinica, vol. 26, pp: 737-744.
Llovet J. and Bruix J. (2003), Systematic review of randomized trials for unresectable
hepatocellular carcinoma: chemoembolization improves survival, Hepatology, vol. 37,
pp: 429-442.
Loeb L. and. Harris C. (2008), Advances in Chemical Carcinogenesis: A Historical Review
and Prospective, Cancer Cancer Research, vol. 68, pp: 6863-6872.
Loukas M., Anna M., Alsaiegh N. et al (2011), Clinical Anatomy as Practiced by Ancient
Egyptians, Clinical Anatomy, vol.24, pp: 409–415.
Maheshwari S., Sarraj A., Kramer J. et al. (2007), Oral contraception and the risk of hepa-
tocellular carcinoma, Journal of Hepatology, vol. 47, pp: 506–513.
Maliakal P., Coville P. and Wanwimolruk S. (2002), Decreased hepatic drug metabolising
enzyme activity in rats with nitrosamine-induced tumours, Drug Metabol Drug Interact,
vol. 19, pp: 13-27.
Marcos R., Monteiro R. and Rocha E. (2012), The use of design-based stereology to
evaluate volumes and numbers in the liver: a review with practical guidelines, Journal
of Anatomy., vol. 220, pp: 303-317.
Marinho R. (2008), O álcool e os jovens, Revista Portuguesa de Clínica Geral, vol. 24, pp:
293-300.
Andriy Marusyk and Kornelia Polyak (2010), Tumor heterogeneity: causes and conse-
quences, Biochimica et Biophysica Acta, vol.1805, 105.
Matsumura T., Makino R. and Mitamura K. (2001), Frequent down-regulation of E-
cadherin by genetic and epigenetic changes in the malignant progression of hepato-
cellular carcinomas, Clinical Cancer Research, vol. 7, pp: 594-549.
Mattson M. (2008), Hormesis Defined, Ageing Research Reviews, vol. 7, pp: 1-7.
Mayhew T. (1992), A review of recent advances in stereology for quantifying neural struc-
ture, Journal of Neurocytology, vol. 21, pp: 313-328.
Mayhew T. and Gundersen H. (1996), 'If you assume, you can make an ass out of u and
me': a decade of the disector for stereological counting of particles in 3D space, Jour-
nal of Anatomy, vol. 188, pp: 1–15.

RE
FE
RE
NC
ES
95
Mayer D., Forstner K. and Kopplow K. (2003), Induction and modulation of hepatic prene-
oplasia and neoplasia in the rat by dehydroepiandrosterone Toxicologic Pathology,
vol.31, pp:103-12.
Mendelsohn M. and Karas R. (1999), The protective effects of estrogen on the cardiovas-
cular system, The New England Journal of Medicine, vol. 340, pp: 1801-1811.
Mirbahai L., Yin G., Bignell J. et al (2011), DNA methylation in liver tumorigenesis in fish
from the environment, Epigenetics, vol. 6, pp: 1319-1333.
Miyaoka Y. and Miyajima A. (2013), To divide or not to divide: revisiting liver regeneration,
Cell Division, vol.8, 8.
Moller A., Strange P. and Gundersen J. (1990), Efficient estimation of cell volume and
number using the nucleator and the dissector, Journal of Microscopy, vol. 159, pp:
61-71.
Mota A., Guedes F., Pinho L. et al. (2010), Alcohol consumption among patients with
hepatitis B infection in northern Portugal considering gender and hepatitis B virus
genotype differences, Alcohol, vol. 44, pp: 149-156.
Murray G. (2000), The role of cytochrome P450 in tumour development and progression
and its potential in therapy, The Journal of Pathology, vol.192, pp: 419–426.
Myers M., Rhodes L. and McCain B. (1987), Pathologic anatomy and patterns of occur-
rence of hepatic neoplasms, putative preneoplastic lesions and other idiopathic he-
patic conditions in English sole (Parophrys vetulus) from Puget Sound, Washington,
Journal of the National Cancer Institute, vol. 78, pp: 333–363.
Myers R., Tainturier M., Ratziu V., et al (2003), Prediction of liver histological lesions with
biochemical markers in patients with chronic hepatitis B, Hepatology, vol. 39, pp: 222-
30.
National Cancer Institute (2003), Cancer and the environment, publication No. 03–2039,
pp: 1-42.
New Jersey Association for Biomedical Research (2012), Rainbow trout—the accidental
liver cancer model. Accessed on 30th August, 2014, in http://curiousyoungwriters.
files.wordpress.com/2013/03/rainbow-trout.pdf.
Okoh V., Deoraj A, Roy D. (2011), Estrogen-induced reactive oxygen species-mediated
signalings contribute to breast cancer, Biochimica et Biophysica Acta, vol. 1815, pp:
115-133.
Oliva M., Vicente-Martorell J., Galindo-Riaño M. et al (2013), Histopathological alterations
in Senegal sole, Solea Senegalensis, from a polluted Huelva estuary (SW, Spain),
Fish Physiology and Biochemistry, vol.39, pp: 523–545.

RE
FE
RE
NC
ES
96
Omoya T., Shimizu I., Zhou Y. et al (2001), Effects of idoxifene and estradiol on NF-kB
activation in cultured rat hepatocytes undergoing oxidative stress, Liver, vol. 21, pp:
183–191.
Ozen H. (2007), Glycogen storage diseases: new perspectives, World Journal of Gastro-
enterology, vol. 13, pp: 2541-2553.
Prange W., Breuhahn K., Fischer F. et al (2003),Beta-catenin accumulation in the pro-
gression of human hepatocarcinogenesis correlates with loss of E-cadherin and ac-
cumulation of p53, but not with expression of conventional, Journal of Pathology, vol.
201, pp: 250-9.
Ptak A. and Gregoraszczuk E. (2013), Chapter 4: Oestrogens, xenoestrogens and hor-
mone-dependent cancers. In Tonissen K., Carcinogenesis (63-86), InTech
Registo Oncológico Nacional 2006 (2012), Instituto Português de Oncologia de Lisboa de
Francisco Gentil- EPE. Accessed on 30th August, 2014, in http://issuu.com
/ipoporto/docs/ron_2006_print_reduce?e=7796583/2503360.
Registo Oncológico 2011 (2013), Instituto Português de Oncologia de Lisboa de Francis-
co Gentil- EPE. Accessed on 30th August, 2014, in http://issuu.com/ipoporto/docs
/publ_ipo2011?e=7796583/2558793.
Romer d. and Suster S. (2003), Use of virtual microscopy for didactic live-audience
presentation in anatomic pathology, Annals of Diagnostic Pathology vol. 7, pp: 67–72.
Roskams T., Libbrecht L., Van Damme B. et al (2000), Fas and Fas ligand: strong co-
expression in human hepatocytes surrounding hepatocellular carcinoma; can cancer
induce suicide in peritumoural cells?, The Journal of Pathology, vol.191, pp: 150–153.
Rotchell J., Miller M., Hinton D. et al. (2008), Chapter 12: Chemical carcinogenesis in
fishes. In Giulio T. and Hinton D., The Toxicology of Fishes (531-596), CRC Press.
Salmonid Water Quality Standards (1988). Accessed on 30th August, 2014, in
http://www.envirocentre.ie/includes/documents/Standards04_SI293_SalmonidWater.p
df .
Santos M., Monteiro R. and Rocha E.(2013), A stereological study of the volume-weighted
volume and of the relative volume of the nucleus of normal and preneoplastic hepato-
cytes in a trout model of hepatocarcinogenesis, Experimental and Toxicologic Pathol-
ogy, vol. 65, pp: 623-30.
Sanyal A., Yoon S. and Lencioni R. (2010), The etiology of hepatocellular carcinoma and
consequences for treatment, The Oncologist, vol. 15, pp: 14-22.
Sato H., Sakairi T., Takagi S. et al (2013), Spontaneous amphophilic focus in the liver of a
young Sprague-Dawley rat, Experimental and Toxicologic Pathology, vol. 65, pp: 35-
7.

RE
FE
RE
NC
ES
97
Serag H. (2012), Epidemiology of viral hepatitis and hepatocellular carcinoma, Gastroen-
terology, vol. 142, pp: 1264–1273.
Seth P., Lunetta K., Bell D. et al (2000), Phenol sulfotransferases: hormonal regulation,
polymorphism, and age of onset of breast cancer, Cancer Research, vol.60, pp:
6859-6863.
Shimizu I and Ito S. (2007), Protection of estrogens against the progression of chronic
liver disease, Hepatology Research, vol. 37, pp: 239–247.
Soares A., Guieysse B., Jefferson B. et al (2008), Nonylphenol in the environment: a criti-
cal review on occurrence, fate, toxicity and treatment in wastewaters, Environment In-
ternational., vol. 34, pp: 1033-49.
Stentiford D, Longshaw M., Lyons P. et al (2003), Histopathological biomarkers in estua-
rine fish species for the assessment of biological effects of contaminants, Marine En-
vironmental Research, vol.55, pp: 137-59.
Sterio C. (1984), The unbiased estimation of number and sizes of arbitrary particles using
the dissector, Journal of Microscopy, vol. 134, pp: 127–136.
Strom J., Theodorsson A. and Theodorsson E. (2011), Hormesis and female sex hor-
mones, Pharmaceuticals, vol. 4, pp: 726-740.
Sturve J., Hasselberg L., Fälth H. et al (2006), Effects of North Sea oil and alkylphenols
on biomarker responses in juvenile Atlantic cod (Gadus morhua), Aquatic Toxicology,
vol. 78, pp: S73-S78.
Su Q., Benner A., Hofmann W. et al. (1997), Human hepatic preneoplasia: phenotypes
and proliferation kinetics of foci and nodules of altered hepatocytes and their relation-
ship to liver cell dysplasia, Virchows Archiv, vol. 431, pp: 391–406.
Tian G., Sun Y., Pang C. et al (2012), Oestradiol is a protective factor for non-alcoholic
fatty liver disease in healthy men, Obesity Reviews, vol. 13, pp: 381–387
Thomson E. (1930), Quantitative microscopic analysis, Journal of Geology, vol. 38, pp:
193–222.
Thoolen B., Kate F., Van Diest P. et al. (2012), Comparative histomorphological review of
rat and human hepatocellular proliferative lesions, Journal of Toxicologic Pathology,
vol. 25, pp: 189–199.
Thoolen B., Maronpot R., Harada T. et al (2010), Proliferative and nonproliferative lesions
of the rat and mouse hepatobiliary system, Toxicologic Pathology, vol. 38, pp: 5S-
81S.
Tollefsen K., Blikstad C., Eikvar S. et al (2008), Cytotoxicity of alkylphenols and alkylated
non-phenolics in a primary culture of rainbow trout (Onchorhynchus mykiss) hepato-
cytes, Ecotoxicology and Environmental Safety, vol. 69, pp: 64-73.

RE
FE
RE
NC
ES
98
Tsuchishima M., George J., Shiroeda H., et al. (2013), Chronic ingestion of ethanol induc-
es hepatocellular carcinoma in mice without additional hepatic insult, Digestive Dis-
eases and Sciences, vol. 58, pp: 1923–1933.
Uccello M., Malaguarnera G., Corriere T. et al (2012), Risk of hepatocellular carcinoma in
workers exposed to chemicals, Hepatitis Monthly, vol.12, e5943.
Valton E, Amblard C., Wawrzyniak I. et al (2013), P-gp expression in brown trout erythro-
cytes: evidence of a detoxification mechanism in fish erythrocytes, Scientific Reports,
vol. 3, 3422.
Vandenberg L., Colborn T., Hayes T. et al (2012), Hormones and endocrine-disrupting
chemicals: low-dose effects and nonmonotonic dose responses, Endocrine Reviews,
vol. 33, pp: 378-455.
Villeneuve S., Cyr D., Lynge E. et al (2010), Occupation and occupational exposure to
endocrine disrupting chemicals in male breast cancer: a case-control study in Europe,
Occupational and Environmental Medicine, vol. 67, pp: 837 – 844.
Vincent T. and Gatenby R. (2008), An evolutionary model for initiation, promotion, and
progression in carcinogenesis, International Journal of Oncology, vol.32, pp: 729-737.
Xia Q., Huang X., Xue F. et al (2013), Chapter 5: Genetic polymorphisms of DNA repair
genes and DNA repair capacity related to aflatoxin b1 (AFB1)-induced DNA damag-
es. In Chen C., New Research Directions in DNA Repair (377-412), InTech.
Watson C., Jeng Y. and Kochukov M. (2010), Nongenomic signaling pathways of estro-
gen toxicity, Toxicological Sciences, vol. 115, pp: 1-11.
Wei T., Yu L. and Lv Y. (2012), A novel therapy of inducing hepatocyte hypertrophy by
activating Akt/mTORC1 pathway in acute liver failure, Medical Hypotheses, vol. 78,
pp: 58-59.
Wei Y., Van Nhieu J., Prigent S. et al (2002), Altered expression of E-cadherin in hepato-
cellular carcinoma: correlations with genetic alterations, beta-catenin expression, and
clinical features, Hepatology, vol.36, pp: 692-701.
World Health Organization - Regional Office (2010), European Status Report on Alcohol
and Health 2010, 380 pages.
World Health Organization (2005), Global Status Report on Alcohol 2004, 88 pages.
Williams D., Bailey G., Hendricks J. et al. (2003), The rainbow trout (Oncorhynchus
mykiss) tumor model: recent applications in low-dose exposures to tumor initiators
and promoters, Toxicologic Pathology, vol. 31, pp: 58–61.
Williams D., Orner G., Willard K. et al. (2009), Rainbow trout (Oncorhynchus mykiss) and
ultra-low dose cancer studies, Comparative Biochemistry and Physiology, vol.149, pp:
175–181.

RE
FE
RE
NC
ES
99
Williams D. (2012), The rainbow trout liver cancer model: response to environmental
chemicals and studies on promotion and chemoprevention, Comparative Biochemis-
try and Physiology, vol. 155, pp: 121–127.
Wogan G., Hecht S., Felton J. et al. (2004), Environmental and chemical carcinogenesis,
Seminars in Cancer Biology, vol. 14, pp: 473–486.
Yardley K. (2004). Xenoestrogens and Your Health, National Institute of Medical Herbal-
ists. Accessed on 5 may, 2014, in http://www.katolenyardley.com/ Xenoestrogens.pdf
Youness E., Nemr M., Oraby F. et al. (2013), Evaluation of apoptotic marker Bcl2, CD4+,
human hepatocyte growth factor and metalloproteinase-9 as tumor markers for pa-
tients with hepatocellular carcinoma, Indian Journal of Clinical Biochemistry, vol. 29,
pp: 351-6.