Embed Size (px)
Citation preview
Estimation of the Monthly Average Daily Solar Radiation usingGeographic Information System and Advanced Case-BasedReasoningChoongwan Koo, Taehoon Hong,* Minhyun Lee, and Hyo Seon Park
Department of Architectural Engineering, Yonsei University, Seoul, 120-749, Korea
*S Supporting Information
ABSTRACT: The photovoltaic (PV) system is considered anunlimited source of clean energy, whose amount of electricitygeneration changes according to the monthly average dailysolar radiation (MADSR). It is revealed that the MADSRdistribution in South Korea has very diverse patterns due tothe country’s climatic and geographical characteristics. Thisstudy aimed to develop a MADSR estimation model for thelocation without the measured MADSR data, using anadvanced case based reasoning (CBR) model, which is ahybrid methodology combining CBR with artificial neuralnetwork, multiregression analysis, and genetic algorithm. Theaverage prediction accuracy of the advanced CBR model was very high at 95.69%, and the standard deviation of the predictionaccuracy was 3.67%, showing a significant improvement in prediction accuracy and consistency. A case study was conducted toverify the proposed model. The proposed model could be useful for owner or construction manager in charge of determiningwhether or not to introduce the PV system and where to install it. Also, it would benefit contractors in a competitive biddingprocess to accurately estimate the electricity generation of the PV system in advance and to conduct an economic andenvironmental feasibility study from the life cycle perspective.
1. INTRODUCTIONIn keeping with the widespread awareness of the issues onglobal warming, the United Nations Framework Convention onClimate Change (UNFCCC) was signed in June 1992 based onthe principle of limiting the use of fossil fuels. To promote thisconvention, the Conference of Parties (COP) is annually held.During the third COP in December 1997, the Kyoto Protocol,a concrete plan of the UNFCCC, was adopted. In order toacquire flexibility in the responsibility to enforce greenhousegas reduction, together with the protocol, various systems,including emission trading scheme, joint implementation, andclean development mechanism, were introduced. Due to thefortification of international environmental regulations, theSouth Korean government set a goal to reduce business-as-usual carbon emissions in 2020 by 30% to increase the ratio by50% in 2050.The South Korean National Assembly recently passed “The
Act on Allocation and Trading of Greenhouse Gas Emissions,”and from 2015, the country plans to enforce the greenhouse gasemission trading scheme.1,2 As part of the global effort toreduce greenhouse gas emissions, there has been a growinginterest in new renewable energy sources. Particularly,advanced countries like Germany, Japan, U.S., and the UKhave introduced Feed in Tariff (FIT), renewable portfoliostandard (RPS), etc., resulting in promoting the growth of thenew renewable energy market.3−8 There is a growing interest invarious types of new renewable energy sources, such as solar
energy, wind energy, bioenergy resources, and hydroelectric-ity.9−13 Through the revisions of laws in February 2012, theSouth Korean government introduced RPS, which substitutedfor the existing FIT, and also granted renewable energycertificates (RECs) to business sectors participating in RPS.Particularly, it proposed the mandatory amount of the annualsolar photovoltaic (PV) system supply for the concentratedgrowth of the PV industry. Standards have been set to grant 1.5of weighted values to PV businesses that use existing facilities.14
The trends in new renewable energy systems in South Koreashowed that hydrogen fuel cells, the PV system, and thegeothermal energy system increased annually by 162.2%,131.1%, and 77.1%, respectively, which revealed that the PVsystem was the second most active system introduced in thecountry. Particularly, those in educational facilities showed thatthe PV system, the solar heat system, and the geothermalenergy system increased annually by 864%, 492%, 691%,respectively, which revealed that the PV system was mostactively introduced to these facilities.15 The floor area ratio ofthe educational facilities is less than that of multifamily housingunits or offices, so it is expected that the introduction of the PVsystem will be more effective in such institutions.
Received: September 18, 2012Revised: February 7, 2013Accepted: April 2, 2013Published: April 2, 2013
Article
pubs.acs.org/est
© 2013 American Chemical Society 4829 dx.doi.org/10.1021/es303774a | Environ. Sci. Technol. 2013, 47, 4829−4839
While the PV system is an unlimited source of clean energy,allows for unmanned operation, and is in a modular structurethat makes it possible to vary the size of the system, itselectricity generation is dependent upon weather conditions,particularly the monthly average daily solar radiation(MADSR).16−28 Therefore, it is very important to determineaccurate MADSR to maximize the effect of the introduction ofthe PV system. South Korea observes the MADSR in 24regions, establishing a MADSR database for about 30 years.However, other than these 24 regions, the country has noactual MADSR data in other regions in which the PV systemcan be effectively introduced. To solve this issue, various studieshave been conducted worldwide. Some representative studiesare as follows.29−59
First, some studies aimed to estimate the MADSR by usingartificial neural networks (ANN). In Iran, an ANN model wasdeveloped in estimating the MADSR. An ANN model usedwind speed, the number of the day of the year (starting fromthe first of January), daily mean air temperature, relativehumidity, and sunshine hours as independent variables. Themean absolute percentage error (MAPE) of this model was5.21%, which was superior to the conventional method(10.02%).51 In estimating the MADSR in Nigeria, an ANNmodel was developed with latitude, longitude, altitude, month,mean temperature, mean sunlight duration, and relativehumidity as independent variables.52 In estimating theMADSR in Indonesia, an ANN model was developed byvisualizing the MADSR with a solar map. The MAPE of thismodel was excellent at 3.4%.53
Second, other studies estimated the MADSR by usingmethods other than ANN. A study estimated the MADSR in sixregions in India by using the IrSOLaV/CIEMAT satellitemodel.54 A satellite-based model was used in estimating theMADSR in Cambodia, of which the root-mean-squaredeviation was 6.3%.55 In China, a support vector machineswas used to estimate the MADSR. Applying Tmax (maximum airtemperature)-Tmin (minimum air temperature) and Tmean(mean air temperature) as independent variables, this model’sroot mean square error (RMSE) and nash-sutcliffe coefficient
were 1.637 MJm−2 and 0.813 MJm−2, respectively, showing it tobe the best model.56
Third, other studies estimated the MADSR by usinggeographic information system (GIS). In Portugal, a studyused LiDAR data based on the solar analyst extension for Arc-GIS. If it is assumed to apply a 7-MW PV system to 538buildings in Lisbon, about 11.5 GWh/year of potential valuewould be generated, offering 48% of the current electricitydemand.57 In Canada, to estimate the MADSR on the rooftopin southeastern Ontario, GIS and advanced feature extractionalgorithms were used. The potential peak power outputs andpotential annual energy generation were 5.74 GW (157% of theregion’s peak power demands) and 6,909 GWh (5% ofOntario’s total annual demand), respectively.58 In Saudi Arabia,to estimate the MADSR where it is not currently measured, avariogram model that used geostatistical techniques wasdeveloped, and it showed that the mean percentage errorswere between 0.5% and 1.7% by month.59
As such, there have been many studies on the MADSR basedon various aspects. Although the ANN methodology, which isoften used in the previous studies, offers excellent predictionaccuracy, its “black-box” makes it difficult to explain predictionresults. The GIS-based methodology can make it easy tounderstand the MADSR distribution by visually expressing it ona map. However, it presents prediction results based on simpledistances.Therefore, in developing a MADSR estimation model, this
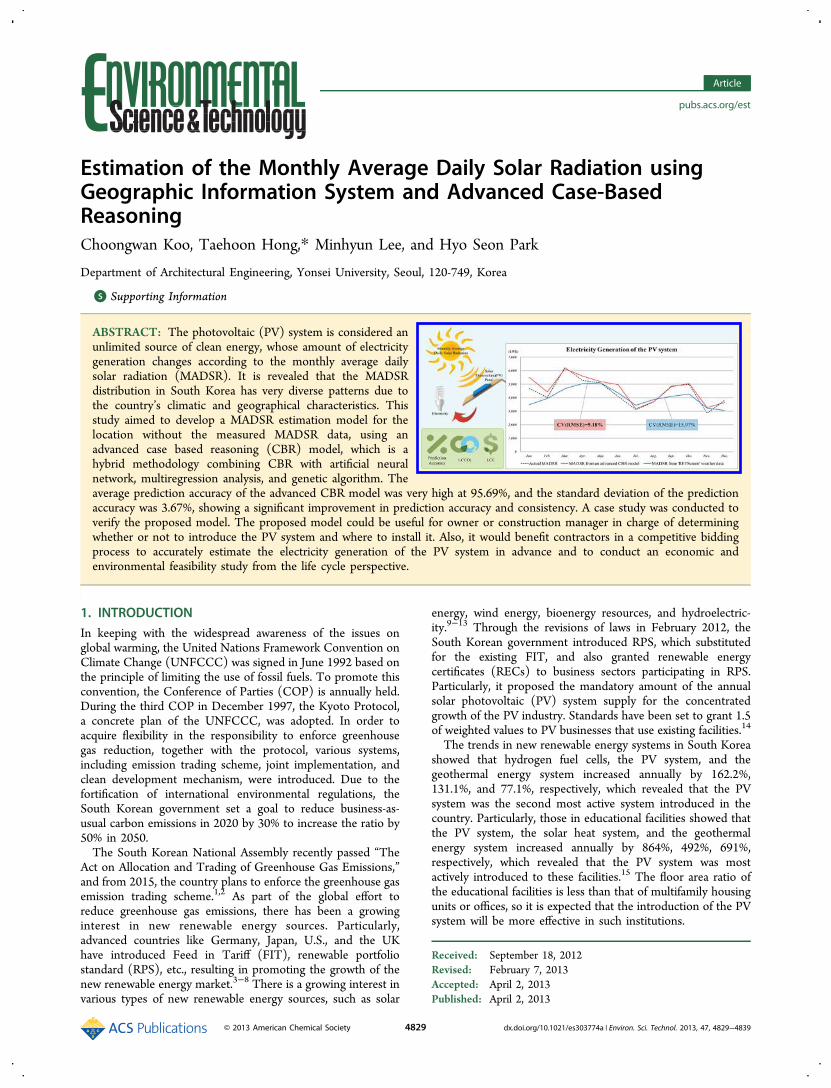
study proposes an advanced CBR methodology that not onlycombines the advantages of GIS’s visual expression and ANN’sexcellent prediction accuracy, but also improves its explanatorypower on prediction results.As shown in Figure 1, this study was conducted as follows:
(i) it collected the MADSR data and related information (i.e.,geographical and meteorological factors) measured in 15regions in South Korea; (ii) using GIS, the MADSR datawere expressed on a map along with the geographicinformation, and the seasonal nature of the MADSRdistribution was analyzed; (iii) through the time-series analysis,it analyzed the monthly cycle of the MADSR and acquired the
Figure 1. Research framework.
Environmental Science & Technology Article
dx.doi.org/10.1021/es303774a | Environ. Sci. Technol. 2013, 47, 4829−48394830
feasibility of the monthly data-based cluster formation; (iv) anadvanced case-based reasoning (CBR) for estimating theMADSR was proposed. This model is a hybrid methodologythat combines ANN, multi-regression analysis (MRA), andgenetic algorithm (GA); (v) the feasibility of the MADSRestimated by the proposed model was verified through a casestudy. Electricity generation was predicted through a softwareprogram called RETScreen; and, finally; and (vi) it conducted aneconomic and environmental feasibility analysis based on thelife cycle.
2. MATERIALS AND METHODS2.1. Establishment of Database. Through extensive
literature review and interviews with experts (i.e., MADSRexperts in the Korea Meteorological Administration (KMA)and in the Korea Institute of Energy Research (KIER)), thisstudy collected the MADSR data measured in a monthly cyclefor the past 10 years (January 2001 to December 2010) in 15regions in South Korea, and extracted factors affecting theMADSR60−64 (refer to Supporting Information (SI) Table S1).As shown in Table 1, this study selected as independent
variables longitude, latitude, and altitude for geographicalfactors, while monthly mean percentage of sunshine, monthlymean cloud amount, monthly total of sunshine duration,monthly mean temperature, monthly mean relative humidity,and monthly mean wind speed were independent variables formeteorological factors. The MADSR was used as the targetvariable.2.2. Cluster Formation. The MADSR distribution in South
Korea was shown to have seasonal characteristics (refer toFigure 2 and SI Figures S1−S3). Based on this result, theMADSR data in South Korea is believed to have a monthlycyclic nature. To acquire the statistical feasibility of the monthlycyclic nature, this study conducted a time-series analysis.Generally, the time-series analysis consists of four phases:model identification, parameter estimation, diagnostic checking,and forecasting. This study aims to determine whether theMADSR data has seasonality based on the time-series analysis.Thus, the autocorrelation analysis in the model identification
phase was conducted to acquire the statistical feasibility. SITable S2 shows the result of the time-series analysis (especially,the autocorrelation analysis) on each of the 15 regions. Within5% of the significance level, if the absolute value of t-statistics tothe autocorrelation coefficient with time lag 12 is larger thanthe warning level “1.25”, it can be said that seasonality in thetime-series exist.65 As shown in SI Table S2, t-statistics to theautocorrelation coefficient in all 15 regions is larger than thewarning level 1.25. Therefore, it can be said that seasonality, orthe monthly cyclic nature, exists in time-series with time lag 12.
2.3. An Advanced CBR Model. It was determined that theMADSR data in South Korea have seasonality and a monthlycyclic nature. Based on such results, this study conductedcluster formation by dividing 1800 MADSR data into 12months. The data included in each cluster, monthly datameasured for the past 10 years (January 2001 to December2010), consists of 150 sets (15 × 10). For each cluster, thisstudy proposed a MADSR estimation model using an advancedCBR model, which is a hybrid methodology that is based on thefundamental characteristics of CBR (a methodology thatretrieves similar cases among historical case-based data), andimproves prediction accuracy by combining other method-ologies like ANN, MRA, and GA. Refer to the previous studiesfor a more detailed explanation.66−69
2.3.1. Selection of Similar Projects Using CBR. CBRmethodology retrieves prediction results based on casesimilarity (CS) and uses a series of processes to calculateattribute similarity (AS), attribute weight (AW), and CS, whichcan be expressed in a matrix, as in eq 1.
···⋮ ⋱ ⋮
···⋮ = ⋮
⎛
⎝
⎜⎜⎜
⎞
⎠
⎟⎟⎟
⎛
⎝
⎜⎜⎜
⎞
⎠
⎟⎟⎟
⎛
⎝
⎜⎜⎜
⎞
⎠
⎟⎟⎟
AS AS
AS AS
AW
AW
CS
CS
n
m mn n n
11 1
1
1 1
(1)
where, AS is the attribute similarity, AW is the attribute weight,CS is the case similarity, m is the number of cases, and n is thenumber of attributes.Before applying CBR methodology, as in eq 1, the values of
all independent variables need to be standardized, as in eq 2.
= −−
SVAV AV
AV AV
min
max min (2)
where, SV is the standardized value for the AV(actual value ofattributes), AVmin is the minimum value of the AV, and AVmax isthe maximum value of the AV.Using the standardized data by eq 2, AS and CS are
calculated by eqs 3 and 4.
=−
| − |× ≥
<
⎧⎨⎪⎪
⎩⎪⎪
⎛⎝⎜
⎞⎠⎟f x
f x
f x
( )100
SV SVSV
100 if ( ) MCAS
0 if ( ) MCASAS
TC RC
TCAS
AS
(3)
where, fAS is the function for calculating the attribute similarity,SVTC is the standardized value for the AV of the test case, SVRCis the standardized value for the AV of the retrieved case, andMCAS is the minimum criterion for scoring the attributesimilarity.
=∑ ×
∑=
=f x
f f
f( )
( )
( )in
inCS
1 AW AS
1 AW
i i
i (4)
Table 1. Target Variable and Independent VariablesAffecting the Monthly Average Daily Solar Radiation
variables attributesdetailed
description
independentvariable
geographicalfactor
longitude () °Elatitude () °Naltitude () m
meteorologicalfactor
monthly meanpercentage of sunshine
() %
monthly mean cloudamount
1−10
monthly total of sunshineduration
() day
monthly meantemperature
() °C
monthly mean relativehumidity
() %
monthly mean windspeed
() m/s
target variable monthly average dailysolar radiation
() kWh/m2/day
Environmental Science & Technology Article
dx.doi.org/10.1021/es303774a | Environ. Sci. Technol. 2013, 47, 4829−48394831
where, f CS is the function for calculating the case similarity, fAWis the function for calculating the attribute weight, fAS is thefunction for calculating the attribute similarity, and n is thenumber of attributes. By multiplying the attribute weight withthe attribute similarity, the weighted-attribute similarity wasderived. Its accumulated sum was divided by the accumulatedsum of the attribute weight.2.3.2. Formation of Filtering Engine. Since CBR method-
ology presents both the prediction results and historical data, ithas high explanatory power. However, according to previousstudies, compared to MRA or ANN, its prediction accuracy isrelatively low. Accordingly, to improve its prediction accuracy, afiltering engine is required. Through the following eqs 5−10, afiltering engine can be introduced, and the proposed hybridmodel was defined as an advanced CBR model.
∑= ×−
=
f xm
( )100 AV PV
AVi
mi
iMAPE
1 (5)
= −f x f x( ) 100 ( )PA MAPE (6)
where, fMAPE is the function for calculating the mean absolutepercentage error, AV is the actual value of the target variable,PV is the predicted value of the target variable, m is the numberof cases, and f PA is the function for calculating the predictionaccuracy.
× −
≤
≤ × +
⎜ ⎟
⎜ ⎟
⎛⎝
⎞⎠
⎛⎝
⎞⎠
PV 1MAPE
100
PR
PV 1MAPE
100
MRAMRA
MRA
MRAMRA
(7)
× −
≤
≤ × +
⎜ ⎟
⎜ ⎟
⎛⎝
⎞⎠
⎛⎝
⎞⎠
PV 1MAPE
100
PR
PV 1MAPE
100
ANNANN
ANN
ANNANN
(8)
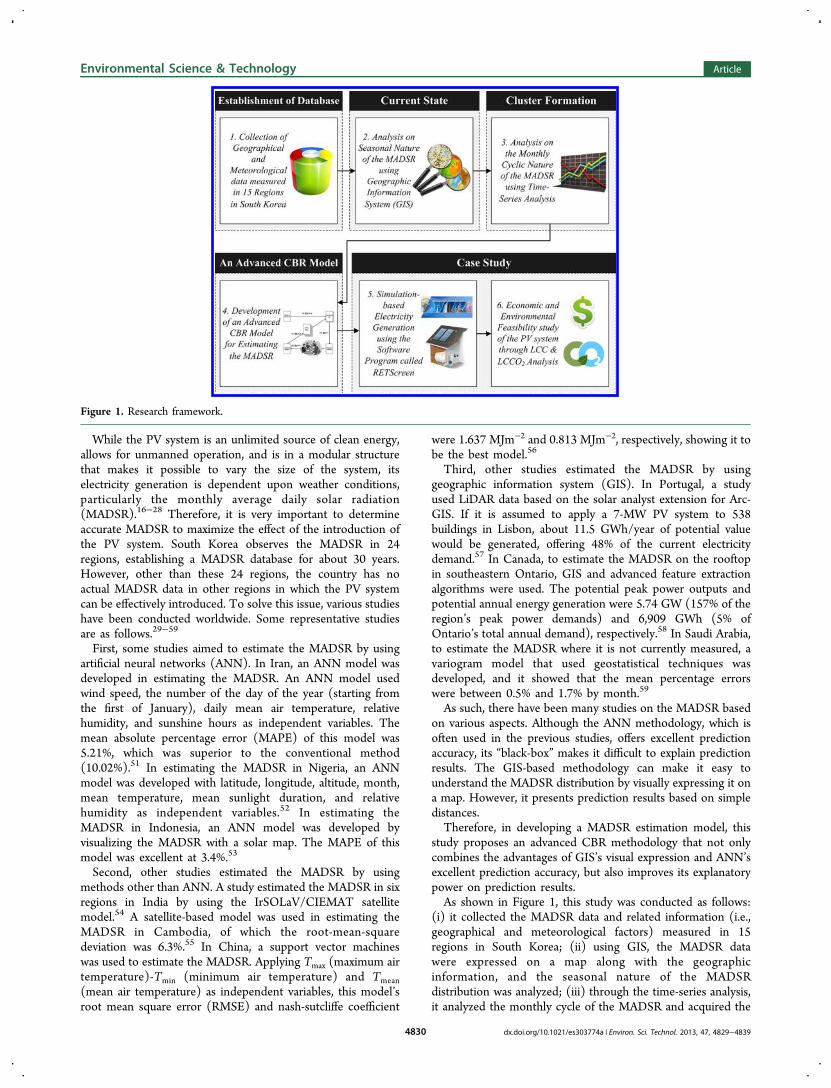
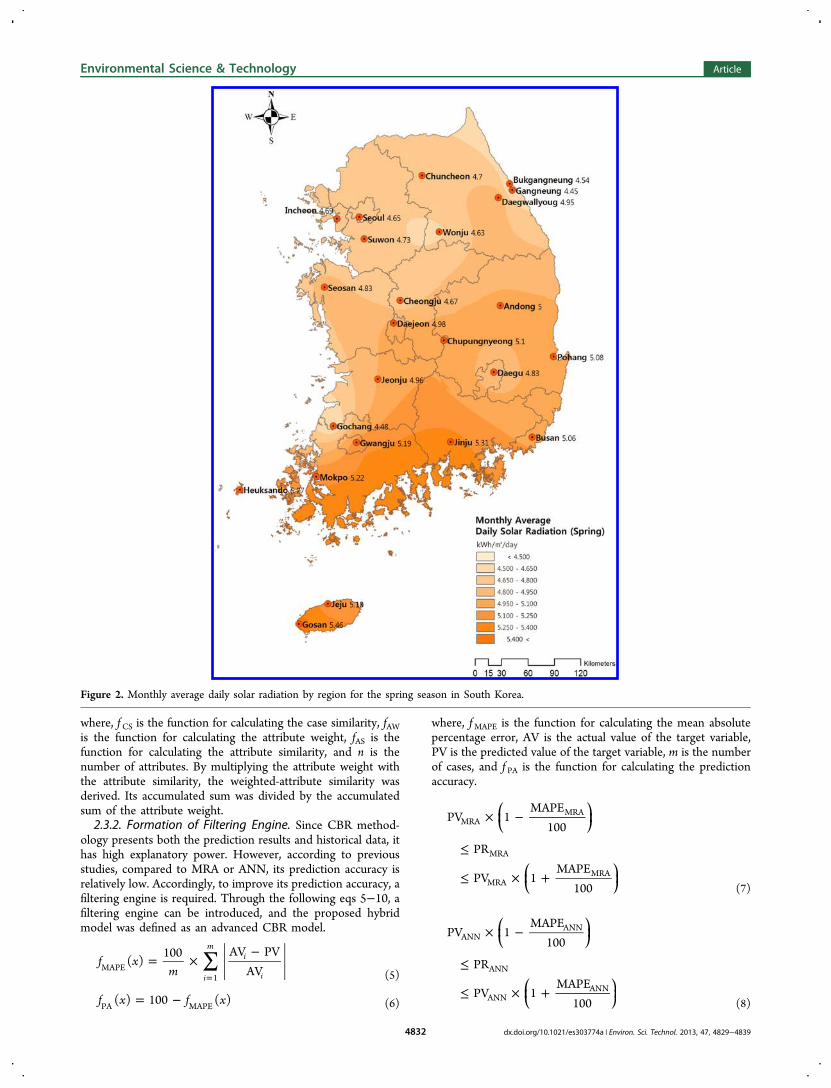
Figure 2. Monthly average daily solar radiation by region for the spring season in South Korea.
Environmental Science & Technology Article
dx.doi.org/10.1021/es303774a | Environ. Sci. Technol. 2013, 47, 4829−48394832
where, PRMRA is the predicted range of the MRA model, PVMRAis the predicted value of the MRA model, MAPEMRA is themean absolute percentage error of the MRA model, PRANN isthe predicted range of the ANN model, PVANN is the predictedvalue of the ANN model, and MAPEANN is the mean absolutepercentage error of the ANN model.
≤≤
max(min(PR ), min(PR ))
CRMA
min(max(PR ), max(PR ))
MRA ANN
MRA ANN (9)
× −
≤ *
≤ × +
⎜ ⎟
⎜ ⎟
⎛⎝
⎞⎠
⎛⎝
⎞⎠
min(CRMA) 1TRCRMA
100
CRMS
max(CRMA) 1TRCRMA
100 (10)
where, CRMA is the cross-range between the predicted value ofthe MRA and ANN models, TRCRMA is the tolerance range ofCRMA, and CRMA* is the filtering range in which TRCRMAwas applied to CRMA.2.3.3. Optimization with GA. To maximize the prediction
performance on the process to develop an advanced CBRmodel, there are variables that need to be optimized. Suchvariables were defined as optimization parameters to which GAwas applied to extract the optimal solution. In GA, a group ofoptimization parameters are defined as a chromosome. Achromosome consists of genes, each of which points to eachoptimization parameter.67 This study used the following fouroptimization parameters: MCAS, RAW, TRCRMA, and RCS.2.4. Energy Simulation Using the Software Program
Called RETScreen. Using the MADSR estimated by theadvanced CBR model, simulation-based electricity generationwas extracted by using the software program called RETScreen,which was codeveloped by specialists from the Department ofNatural Resources in Canada and the United NationsEnvironment Programme.70,71 RETScreen software is widelyused worldwide. As of 2010, more than 20 000 people havedownloaded the RETScreen software, and thus it can beconsidered to be excellent software which can be used forevaluating renewable energy systems.72−77 It was validated thatRETScreen software provided great prediction performance inerror rate within 0−6% of the actual electricity generation.78,79
In this study, to verify the simulation-based electricitygeneration, the following assessment indices were used: (i)CV(RMSE) proposed by ASHRAE to verify the feasibility ofthe simulation result. CV (RMSE) was calculated by eq 11, andif the result is within 25%, the energy simulation wasdetermined to be feasible;80 (ii) the three key assessmentindices to assess the prediction accuracy between the actual andsimulation-based electricity generationthat is, RMSE, MAE,and MAPE, as expressed in eqs 12−14.
=∑ − ×
∑ ××=
=
CV(RMSE)(AEG SEG )
AEG100
in
i n
in
i n
1 i2 1
11
(11)
∑= − ×= n
RMSE (AEG SEG )1
i
n
i i1
2
(12)
∑= | − | ×= n
MAE AEG SEG1
i
n
i i1 (13)
∑=−
× ×= n
MAPEAEG SEG
AEG1
100i
ni i
i1 (14)
where, CV(RMSE) is the coefficient of the variation of theroot-mean-square error, RMSE is the function for calculatingthe root-mean-square error, MAE is the function for calculatingthe mean absolute error, MAPE is the function for calculatingthe mean absolute percentage error, AEG is the actualelectricity generation, SEG is the simulation-based electricitygeneration, and n is the number of data (months).
2.5. Economic and Environmental Assessment. Forbetter understanding of the results, this study conducted aneconomic and environmental assessment.81−86 Particularly,from the environmental aspect, CO2 emission reduction dueto electricity generation was converted into an economic valueby using the profit from the sale of carbon credits, called “KoreaCertified Emission Reductions (KCERs)” at $10.29/tCO2.It is necessary for the LCC and LCCO2 analyses to assume
various factors, which can be divided into six factors: (i) theanalysis approach; (ii) the real discount rate; (iii) the inflationand increase rates; (iv) the analysis period; (v) the startingpoint of the analysis; and (vi) the significant cost ofownership.87 SI Table S3 shows the assumption on keyelements for the LCC and LCCO2 analyses. First, using thedata from the Bank of Korea Economic Statistics system andthe Korean Statistical Information Service, the real discountrate on the inflation rate (3.30%), the electricity price growthrate (0.66%), and the carbon dioxide emission trading pricegrowth rate (2.66%) were calculated, respectively. Second, theanalysis period should be established. Made of reinforcedconcrete structures (refer to SI Table S3), analysis period wasset to 40 years according to the standard service life and servicelife scope chart for the reinforced concrete buildings under theEnforcement Regulations on Corporate Income Tax Act inKorea.1,2 Third, the significant cost of ownership for LCCanalysis should be determined, which means to consider theinitial construction cost, the operation and maintenance cost,and the demolition cost. This study assumed that wastedisposal costs and salvage value offset each other. Therefore,only the initial construction cost and the operation andmaintenance cost were considered. The details weredetermined from interviews with related experts.The LCC and LCCO2 analysis result can be expressed largely
in two key indices: Net Present Value (NPV) and Saving−to-Investment Ratio (SIR). First, NPV, an absolute evaluationmethod, means the benefit generated in the life cycle enablessavings in cost. It is converted into the present worth by usingthe real discount rate. Generally, if “NPV ≥ 0”, a given projectis deemed feasible, and it is determined to have passed thebreak-even point (BEP). NPV was calculated using eq 15.
∑ ∑=+
−+= =
Br
Cr
NPV(1 ) (1 )t
nt
tt
nt
t0 0 (15)
where, NPV is net present value; Bt is benefit in year t; Ct is costin year t; r is the real discount rate; and n is the period of thelife cycle analysisSecond, SIR, a relative evaluation method, means the ratio of
benefit to cost generated in the life cycle. It is converted intothe present worth by using the real discount rate. Generally, if
Environmental Science & Technology Article
dx.doi.org/10.1021/es303774a | Environ. Sci. Technol. 2013, 47, 4829−48394833
“SIR ≥ 1”, a given project is deemed feasible. SIR wascalculated using eq 16.
=∑
∑= +
= +
SIRtn S
r
tn I
r
0 (1 )
0 (1 )
tt
tt (16)
where, SIR is the saving to investment ratio; St is the saving inyear t; It is the investment in year t; r is the real discount rate;and n is the period of the life cycle analysis.2.6. Stochastic Approach. The MADSR estimation model
proposed in this study can be used in the planning phase of aproject where there is insufficient information on the project.There always exists uncertainty in climatic and geographicalinformation, which is used as independent variables of theMADSR estimation model. Therefore, a stochastic approachthat considers various kinds of uncertainty is required.88,89 Toconsider various kinds of uncertainty related to the proposedadvanced CBR model, this study conducted MCS using thesoftware called Crystal Ball. Assumptions for MCS can begenerally divided into two types: (i) Assumption A: theuncertainty to the prediction accuracy of the proposed MADSRestimation model. Here, uncertainty was defined by a normaldistribution using the average and the standard deviation ofprediction accuracy; (ii) Assumption B: the uncertainty to theclimatic and geographical information as well as simulationerrors. Here, uncertainty was defined by a normal distributionby using the average annual error rate between the actualelectricity generation and simulation-based electricity gener-ation, which is 5.30%. By considering unusual weatherphenomena, such as the rainy seasons or typhoons in thesummer, and heavy snow in the winter, this study left room forelectricity generation in January, February, June, July, August,November, and December. A more detailed explanation on theassumptions was given in SI Table S4.
3. CASE STUDYTo verify the feasibility of the MADSR estimated by theproposed model, a case study was conducted by selecting aneducational facility, “S” elementary school, in which the PVsystem was implemented. “S” elementary school, located inSeongbuk-gu, Seoul, introduced the PV system of 44 kW inDecember 2009 to substitute 7.5% of the annual energyconsumption. SI Table S5 shows the facility characteristics andenergy consumption of “S” elementary school. Meanwhile, thePV system is categorized by the solar cell materials intocrystalline silicon solar cells and amorphous silicon cells. In theKorean PV system market, the monocrystalline solar moduleand the multicrystalline module are the most widelycommercialized among the crystalline silicon solar cells. “S”elementary school introduced the PV system with 200 Wmulticrystalline modules. Through such preliminary informa-tion and market research, this study selected the PV system’spanel and inverter that will be applied in the simulation (referto SI Table S6).By using the advanced CBR model proposed in this study,
the MADSR in the location of the “S” elementary school (205,Seokgwan-dong, Seongbuk-gu, Seoul, Korea) was estimated.For example, SI Table S7 presents the prediction results on theMADSR in October 2011 by using the advanced CBR model. Atotal of six similar cases were retrieved, and the average value ofthe six retrieved cases was 3.5 kWh/m2/day. Since the averageprediction accuracy of the advanced CBR model is 95.69%,
indirect verification of the MADSR prediction results can beperformed. In particular, by considering 4.31% of the predictionerror, the MADSR in October 2011 is estimated to be between3.35 and 3.65 kWh/m2/day.However, since there is no actual MADSR measured in the
location of “S” elementary school, no direct verification can beperformed. Thus, an alternative method of verification for theresult of the case study is required. Electricity generationbetween January and December 2011 from the PV system thatwas introduced by “S” elementary school was selected as thealternative method for verification, and the verification processis as follows.
• Step 1: Collect the geographical and meteorologicalfactors in the location of “S” elementary school (refer toTable 1).
• Step 2: Using the advanced CBR model proposed in thisstudy, extract the prediction results on the MADSR inthe location of “S” elementary school.
• Step 3: Calculate the simulation-based electricitygeneration by applying the MADSR estimated by theadvanced CBR model to the software program calledRETScreen.
• Step 4: Using the actual and simulation-based electricitygeneration at “S” elementary school, extract thecoefficient of variation of the root mean square error(CV(RMSE)), RMSE, mean absolute error (MAE), andmean absolute percentage error (MAPE);
• Step 5: For additional comparison, repeat Step 3 andStep 4 by using the weather data from RETScreen.
• Step 6: By comparing the results from Steps 4 and 5,make a final assessment of the prediction performance ofthe advanced CBR model.
4. RESULTS AND DISCUSSION4.1. Distribution of Daily Solar Radiation in South
Korea. Figure 2 and SI Figures S1−S3 show the seasonal
average values of the MADSR observed from March 2011 toFebruary 2012 in 24 regions in South Korea using the softwareprogram called ArcGIS 9.3. Since South Korea belongs to atemperate monsoon climate region with four distinctiveseasons, its climate shows high temperature and humidity inthe summer due to the effect of the southeast monsoon, whilein the winter, it is cold and dry due to the northwest monsoon.It is a peninsula with three sides surrounded by the sea, and
Table 2. Comparison of Prediction Accuracy and StandardDeviation by Model
type ofmodel methodology
the averagepredictionaccuracy
the standard deviation of theprediction accuracy
annually MRA 83.83 12.96ANN 87.29 11.67CBR 84.24 16.69advancedCBR
86.21 11.46
monthly MRA 95.32 4.50ANN 95.65 4.23CBR 91.36 7.55advancedCBR
95.69 3.67
Environmental Science & Technology Article
dx.doi.org/10.1021/es303774a | Environ. Sci. Technol. 2013, 47, 4829−48394834
70% of its land consists of mountains, centered on the TaebaekMountains that runs long from the north to the south, withhigh east and low west. Due to such climatic and geographiccharacteristics, South Korea shows diverse MADSR distribu-tions in each season. Through the correlation analysis result(refer to SI Table S8) between the MADSR and mainmeteorological factors, the overall causal relationship can bedetermined. The main meteorological factors were selected
from interviews with the MADSR specialists in the KMA andKIER: (i) monthly mean percentage of sunshine; (ii) monthlymean cloud amount; and (iii) monthly mean temperature.As shown in SI Table S8, the correlation coefficient between
the MADSR and monthly mean temperature in the spring wasvery high at 0.744 (generally, if the absolute value of acorrelation coefficient is over 0.5, the strength of therelationship is considered to be strong).90 Since South Koreais located in the northern hemisphere, the temperatureincreases as one goes south. The MADSR distribution in thespring, as presented in Figure 2, shows the increase in theMADSR going south, from which it can be determined that theMADSR is affected by temperature. Refer to Figures S1−S3 inthe SI for a more detailed explanation on daily solar radiationby region for the summer, the fall and the winter season inSouth Korea.As shown in Figure 2 and SI Figures S1−S3, the MADSR
distribution in South Korea shows a very diverse pattern due toits climatic and geographical characteristics. Furthermore, localcharacteristics sometimes resulted in a case different from theoverall pattern of the MADSR distribution. For example, Jeju,the largest island in South Korea, exhibits an oceanic climate,whereas the other regions showed a continental climate.Moreover, the MADSR patterns in the typical erosion basinssuch as Daegu and Wonju were somewhat different from that ofthe neighboring regions. Based on such facts, it can be seen thatit would be very difficult to accurately estimate the MADSR in
Table 3. Monthly Comparison of Prediction Accuracy and Standard Deviation by Modela
methodology Jan. Feb. Mar. Apr. May Jun. Jul. Aug. Sep. Oct. Nov. Dec. Average
MRA APA 93.60 95.34 96.02 96.45 96.50 95.47 94.26 95.33 96.30 95.96 94.49 94.09 95.32SDPA 6.61 3.77 3.74 3.07 2.67 3.52 4.28 3.98 3.18 4.12 7.53 7.50 4.50
ANN APA 93.41 95.71 96.55 96.70 97.32 95.98 94.98 95.34 96.66 95.89 94.72 94.48 95.65SDPA 7.08 3.55 3.01 2.83 2.24 3.31 4.41 3.78 2.79 4.35 7.07 6.38 4.23
CBR APA 83.96 91.09 93.33 93.53 94.25 92.55 90.42 91.06 92.41 92.47 91.35 89.95 91.36SDPA 13.63 6.73 6.26 5.09 5.23 5.83 8.04 6.95 6.47 6.72 8.83 10.79 7.55
advanced CBR APA 94.02 95.42 96.46 96.65 97.16 95.99 94.77 95.42 96.58 96.08 94.72 95.04 95.69SDPA 6.22 3.22 2.58 2.62 2.12 3.04 3.42 3.33 2.34 3.82 7.20 4.12 3.67
aNote: APA stands for the average prediction accuracy (%); and SDPA stands for the standard deviation of the prediction accuracy (%).
Table 4. LCC and LCCO2 Analysis Resultsa
classification class 1 class 2
initial construction cost ($) 122 201 122 201government subsidy ($) 48 880 48 880initial investment cost ($) 73 321 73 321operation & maintenance cost ($) 69 671 69 671replacement cost ($) 56 047 56 047repair cost ($) 13 624 13 624electricity generation benefit ($) 549 160 535 223electricity savings ($) 539 587 526 841CO2eq. savings from electricity generation ($) 9573 8382net present value(NPV40) ($) 406 169 392 232saving-to-investment ratio(SIR40) (%) 3.841 3.743break-even-point(BEP) (year) 5 6electricity generation (kWh) 55 546 48 637
aNote: CO2 conversion factor = 0.4716 tCO2/MWh, KCER = US$10.32/tCO2, the exchange rate (KRW/USD) is 1158.5 won to a U.S.dollar (as of 26 June 2012).
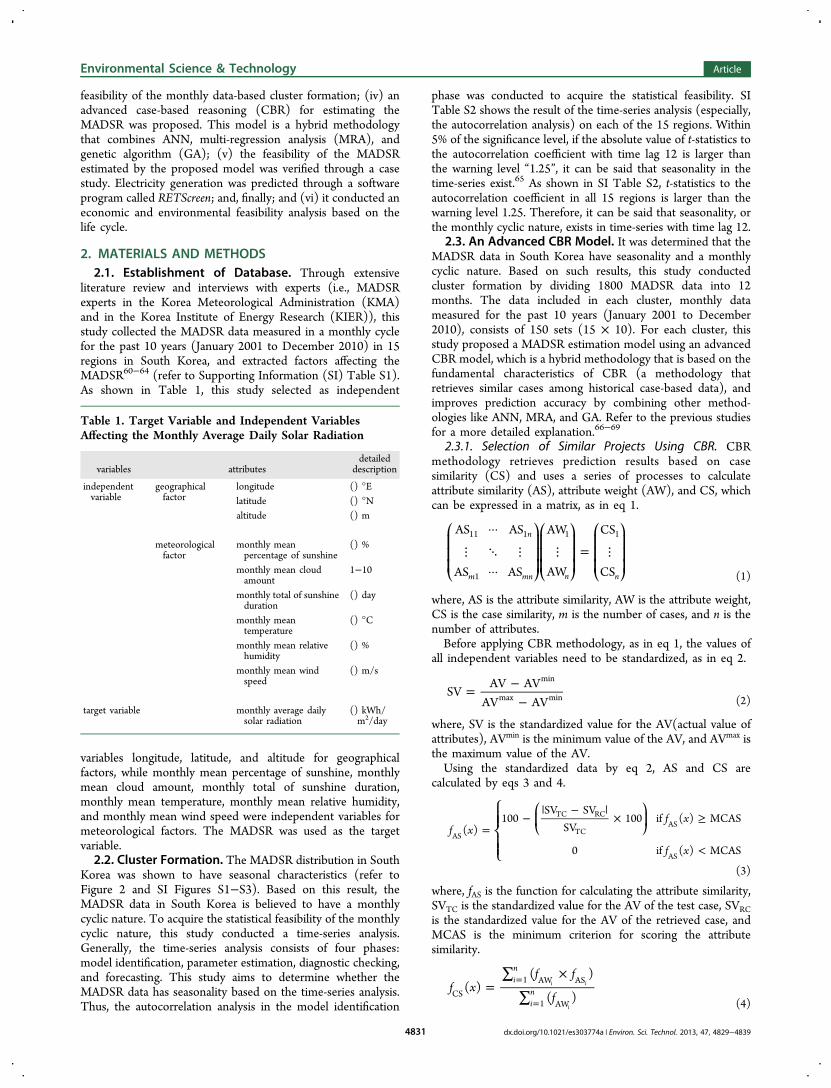
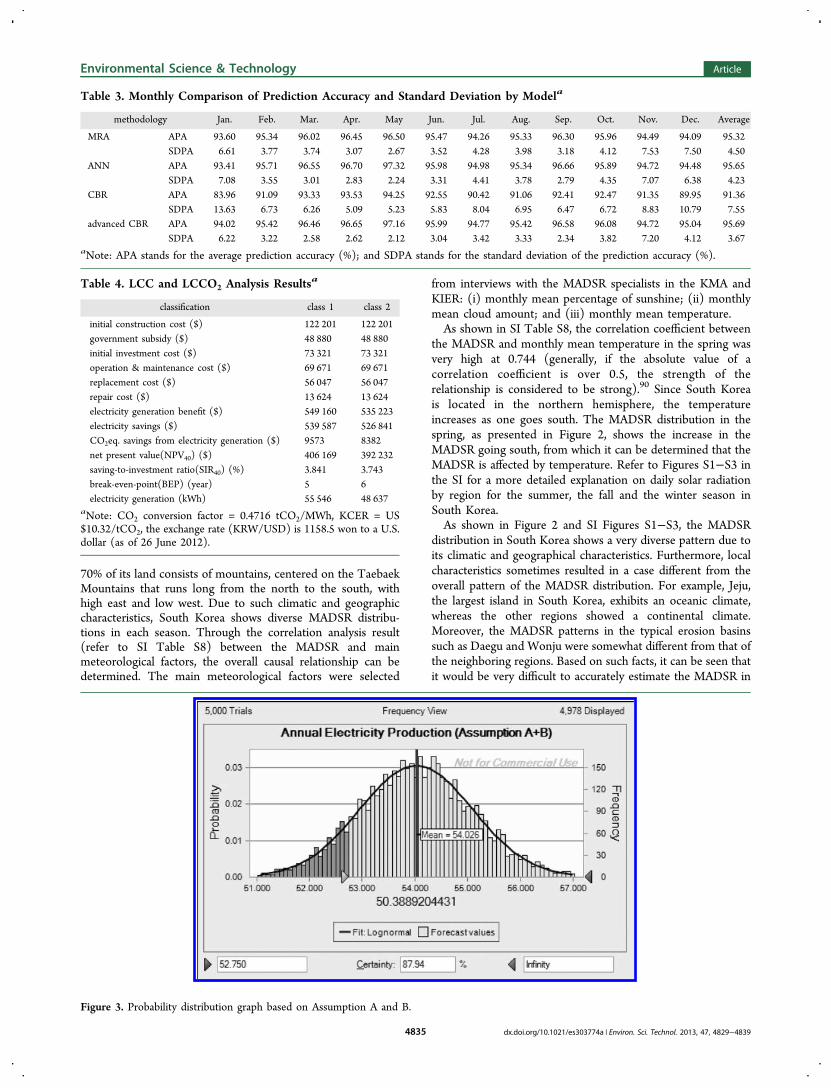
Figure 3. Probability distribution graph based on Assumption A and B.
Environmental Science & Technology Article
dx.doi.org/10.1021/es303774a | Environ. Sci. Technol. 2013, 47, 4829−48394835
regions where there are no MADSR observation data.Consequently, it is not reasonable to measure the MADSR inall regions. Therefore, it is very important to improve theprediction accuracy of a MADSR estimation model that thisstudy is aiming to develop. This can ultimately maximize theproduction efficiency of the PV system.4.2. Comparison of Prediction Accuracy by Model.
The feasibility of the advanced CBR model was verified. Thisstudy used both the ANN model, which is usually used inprevious studies, and the MRA model based on the statisticaltheory as a MADSR estimation model. This study also used aCBR model as the direct comparison index for improving theadvanced CBR model.Table 2 shows the average prediction accuracy of ANN,
MRA, CBR, and the advanced CBR model as well as thestandard deviation of the prediction accuracy. It shows that the12 clusters formed by month were effective. Through clusterformation, the average prediction accuracy by model was shownto have improved between 7.12% and 11.49%, and the standarddeviation of the prediction accuracy was improved between7.44% and 9.14%. It shows that cluster formation significantlyimproved prediction performance.Table 3 shows the average prediction accuracy and the
standard deviation of prediction accuracy of the 12 monthlybased MADSR estimation model. First, the average predictionaccuracy of the advanced CBR model was very high at 95.69%,and the standard deviation of the prediction accuracy was3.67%, showing a significant improvement in predictionaccuracy and consistency. Compared to the other models, theimprovement in the advanced CBR model can be assessed inthe following manner. First, compared to the MRA model, theadvanced CBR model improved in all aspects; then by month,its average prediction accuracy improved by 0.08−0.95%, andthe standard deviation of the prediction accuracy by 0.30−3.38%. On the average, its average prediction accuracyimproved by 0.38%, and the standard deviation of theprediction accuracy by 0.83%. Second, compared to the ANNmodel, the average prediction performance of the advancedCBR model was slightly better. On average, its averageprediction accuracy and the standard deviation of theprediction accuracy improved by 0.05% and 0.56%, respectively.Third, compared to the CBR model, the advanced CBR modelimproved in all aspects. By month, its average predictionaccuracy and the standard deviation of the prediction accuracyimproved by 2.91−10.06% and 1.63−7.41%, respectively. Onaverage, its average prediction accuracy and the standarddeviation of the prediction accuracy improved by 4.33 and3.88%, respectively.In conclusion, it was determined that the advanced CBR
model obtained the advantage of the ANN model and alsoshowed the explanatory power on the prediction results byreferencing historical cases. That is, the proposed modelimproved the disadvantage of the ANN model, which has“black-box” that prevents users from understanding predictionresults. Accordingly, the proposed model can help users toestimate the MADSR more accurately as well as to understandthe prediction results more easily, and thus this will help themconduct the conceptual design and analysis of the PV systemmore efficiently.4.3. Validation of the Simulation Results. To calculate
simulation-based electricity generation, it is necessary todetermine the installation angle of the solar panel and thenumber of solar panels installed along with the aforementioned
PV system’s panel and inverter information. As shown in SITable S5, “S” elementary school introduced the 44 kW PVsystem in December 2009. By considering the installation angleof the solar panel as 30°, the recommended angle by SeoulCity, a total of 220 solar panels are required to generate 44 kWof electricity.91,92 Here, the installation area of a solar panel canbe calculated by SI Figure S4. This study calculated that theinstallation area of a solar panel is about 2.5 m2. Therefore, thetotal installation area was calculated to be about 550.79 m2. Asshown in SI Table S5, since the roof area of “S” elementaryschool was 1671 m2, it was determined that installation ispossible.SI Table S9 shows the result derived from the aforemen-
tioned verification process, which compared the actual andsimulation-based electricity generation. (The result was dividedinto Class 1, the simulation based on the MADSR estimated bythe advanced CBR model, and Class 2, the simulation based onthe weather data offered by RETScreen. Class 2 was used as thecomparison index to Class 1.) To verify the feasibility of theresult of this study, four assessment indices were used asfollows: CV(RMSE), RMSE, MAE, and MAPE.The result of the analysis on the four assessment indices is as
follows: first, in Class 1 and Class 2, CV(RMSE) was shown tobe 9.18% and 15.97%. In both classes, CV(RMSE) was within25%, the limit of the error, showing the feasibility of energysimulation. Likewise, CV(RMSE) of Class 1 was lower thanthat of Class 2; second, Class 1 showed 403.71% of RMSE,116.54% of MAE, and 6.99% of MAPE, while Class 2 showed702.19%, 202.71%, and 11.84%. In all three of them, Class 1was lower than Class 2. In summary, the result of the analysis ofClass 1 was shown to be superior to that of Class 2. Based onsuch results, it is determined that the proposed advanced CBRmodel will estimate electricity generation more accurately fromthe installation of the PV system.
4.4. LCC and LCCO2 Analysis Results. Table 4 shows theLCC and LCCO2 analysis results on Class 1 and Class 2. Sincethe PV system’s type and installation specifications are identicalto each other, the initial construction cost and the operationand maintenance cost were identical. However, as shown in theshaded area of Table 4, the prediction results on the MADSRwere different, thus, resulting in different electricity generationbenefits. The prediction accuracy of Class 1 was shown to besuperior to that of Class 2, based on which the following can bedetermined. In case of using the proposed advanced CBRmodel (Class 1), NPV40, SIR40, and BEP were US$406,169,3.841, and five years, respectively. When the weather dataoffered by RETScreen (Class 2) were used, NPV40, SIR40, andBEP were US$ 392,232, 3.743, and six years, respectively. It isdetermined that the decision-making based on the analysisresult of Class 1 shows a more positive outlook compared tothat of Class 2.The proposed model could be useful for owner or
construction manager in charge of determining whether ornot to introduce the PV system and where to install it. Also, itwould benefit contractors in a competitive bidding process toaccurately estimate the electricity generation of the PV systemin advance and to conduct an economic and environmentalfeasibility study from the life cycle perspective. Since theproposed model was developed using Microsoft Excel’s VBA,the users could correctly, quickly, and easily find useful resultsby entering geographical and meteorological factors as anindependent variable and improve the prediction performancevia the continuous database accumulation.
Environmental Science & Technology Article
dx.doi.org/10.1021/es303774a | Environ. Sci. Technol. 2013, 47, 4829−48394836
4.5. Stochastic Analysis Using MCS. In MCS operation,Assumption A and Assumption B were all defined, and after5000 simulations, the probability distribution graph to theannual electricity generation, as shown in Figure 3, wasextracted. SI Table S9 shows that the actual electricitygeneration was 52 750 kWh, while the simulation-basedelectricity generation was 55 546 kWh. These values wereobtained using the deterministic approach.On the other hand, Figure 3 shows the results from a
stochastic approach where the simulation-based electricitygeneration resulted in 54 026 kWh. The result (54 026 kWh)from the stochastic approach was closer to the actual electricitygeneration (52 750 kWh) than the result (55 546 kWh)obtained using the deterministic approach. By showing theresults along with the probabilistic distribution graph, theproposed model helped the final decision-maker considervarious options.
■ ASSOCIATED CONTENT*S Supporting InformationDetailed data on the monthly average daily solar radiation inSouth Korea, which were used in this study. This material isavailable free of charge via the Internet at http://pubs.acs.org.
■ AUTHOR INFORMATIONCorresponding Author*Phone: 82-2-2123-5788; fax: 82-2-2248-0382; e-mail: [email protected] authors declare no competing financial interest.
■ ACKNOWLEDGMENTSThis research was supported by Basic Science ResearchProgram through the National Research Foundation of Korea(NRF) funded by the Ministry of Education, Science andTechnology (No. 2012-004376 and No. 2012-0001247).
■ REFERENCES(1) Hong, T.; Kim, H.; Kwak, T. Energy saving techniques forreducing CO2 emission in elementary schools. J. Manage. Eng. 2012,28 (1), SPECIAL ISSUE: Engineering Management for SustainableDevelopment,39−50.(2) Hong, T.; Kim, J.; Koo, C. LCC and LCCO2 analysis of greenroofs in elementary schools with energy saving measures. Energy Build2012, 45 (2), 229−239.(3) Renewable Energy Market and Policy Trends in IEA Countries;International Energy Agency (IEA): France, 2009.(4) American Recovery and Reinvestment Act of 2009(ARRA); 111thUnited States Congress, 2009.(5) Sen, Z. Solar energy in progress and future research trends. Prog.Energy Combust. Sci. 2004, 30 (4), 367−416.(6) Trends in Photovoltaic Applications: Survey Report of Selected IEACountries Between 1992 and 2006; International Energy Agency (IEA)PVPS, 2007.(7) Annual world solar photovoltaic industry report; Solar Buzz,Marketbuzz, 2008.(8) Jacobson, M. Z. Review of solutions to global warming, airpollution, and energy security. Energy Environ. Sci. 2009, 2, 148−173.(9) Tapiador, F. J. Assessment of renewable energy potential throughsatellite data and numerical models. Energy Environ. Sci. 2009, 2 (11),1142−1161.(10) Crook, J. A.; Jones, L. A.; Forstera, P. M.; Crook, R. Climatechange impacts on future photovoltaic and concentrated solar powerenergy output. Energy Environ. Sci. 2011, 4, 3101−3109.
(11) Fadare, D. A. The application of artificial neural networks tomapping of wind speed profile for energy application in Nigeria. Appl.Energy 2010, 87, 934−942.(12) Slade, R.; Gross, R.; Bauen, A. Estimating bio-energy resourcepotentials to 2050: learning from experience. Energy Environ. Sci. 2011,4, 2645−2657.(13) Tapiador, F. J.; Hou, A. Y.; Manuel de Castro; Checa, R.;Cuarteroc, F.; Barrosd, A. P. Precipitation estimates for hydro-electricity. Energy Environ. Sci. 2011, 4, 4435−4448.(14) Regulation on Renewable Energy Certificates (RECs) and TradingMarket; New & Renewable Energy Data Center: Seoul, South Korea,2012.(15) Kim, H. I.; Suh, S. J.; Park, K. E.; Kang, G. H.; Yu, G. J. A studyon the development status and future of photovoltaic urban project. J.Korea Solar Energy Soc. 2008, 28 (6), 87−92.(16) Goetzberger, A.; Hoffmann, V. U. Photovoltaic Solar EnergyGeneration; Springer: Berlin, Heidelberg, NY, 2005.(17) Badescu, V. Correlations to estimate monthly mean daily solarglobal radiation: application to Romania. Energy 1999, 24 (10), 883−893.(18) Chegaar, M.; Chibani, A. Global solar radiation estimation inAlgeria. Energy Convers. Manage. 2001, 42 (8), 967−973.(19) Ashhab, M. S. S. Optimization and modeling of a photovoltaicsolar integrated system by neural networks. Energy Convers. Manage.2008, 49 (11), 3349−3355.(20) Reddy, K. S.; Ranjan, M. Solar resource estimation usingartificial neural networks and comparison with other correlationmodels. Energy Convers. Manage. 2003, 44 (15), 2519−2530.(21) Cano, D.; Monget, J. M.; Albuission, M.; Guillard, H.; Regas, N.;Wald, L. A method for the determination of the global solar radiationfrom meteorological satellite data. Solar Energy 1986, 37 (1), 31−39.(22) Mellit, A.; Kalogirou, S. A. Artificial intelligence techniques forphotovoltaic applications: A review. Prog. Energy Combust. Sci. 2008,34 (5), 574−632.(23) Zghal, W.; Kantchev, G.; Kchaou, H. Determination of theexploitable solar energy for electricity generation using the photo-voltaic systems. 1st International Conference on Renewable Energies andVehicular Technology 2012, 43−48.(24) Viana, T. S.; Ruther, R.; Martins, F. R.; Pereira, E. B. Assessingthe potential of concentrating solar photovoltaic generation in Brazilwith satellite-derived direct normal irradiation. Solar Energy 2011, 85,486−495.(25) Djurdjevic, D. Z. Perspectives and assessments of solar PVpower engineering in the Republic of Serbia. Renewable SustainableEnergy Rev. 2011, 15, 2431−2446.(26) Sanchez Reinoso, C. R.; Cutrera, M.; Battioni, M.; Milone, D.H.; Buitrago, R. H. Photovoltaic generation model as a function ofweather variables using artificial intelligence techniques. Int. J.Hydrogen Energy 2012, 37 (19), 14781−14785.(27) Makrides, G.; Zinsser, B.; Norton, M.; Georghiou, G. E.;Schubert, M.; Werner, J. H. Potential of photovoltaic systems incountries with high solar irradiation. Renewable Sustainable Energy Rev.2010, 14, 754−762.(28) Gastli, A.; Charabi, Y. Solar electricity prospects in Oman usingGIS-based solar radiation maps. Renewable Sustainable Energy Rev.2010, 14, 790−797.(29) Elizondo, D.; Hoogenboom, G.; Mcclendon, R. W. Develop-ment of a neural network model to predict daily solar radiation. Agric.For. Meteorol. 1994, 71 (1−2), 115−132.(30) Mohandes, M.; Rehman, S.; Halawani, T. O. Estimation ofglobal solar radiation using artificial neural networks. Renewable Energy1998, 14 (1−4), 179−184.(31) Alawi, S. M.; Hinai, H. A. An ANN-based approach forpredicting global radiation in locations with no direct measurementinstrumentation. Renewable Energy 1998, 14 (1−4), 199−204.(32) Sfetsos, A.; Coonick, A. H. Univariate and multivariateforecasting of hourly solar radiation with artificial intelligencetechniques. Solar Energy 2000, 68 (2), 169−178.
Environmental Science & Technology Article
dx.doi.org/10.1021/es303774a | Environ. Sci. Technol. 2013, 47, 4829−48394837
(33) Mihalakakou, G.; Santamouris, M.; Asimakopoulos, D. N. Thetotal solar radiation time series simulation in Athens, using neuralnetworks. Theor. Appl. Climatol. 2000, 66 (3−4), 185−197.(34) Kalogirou, S. A. Artificial neural networks in renewable energysystems applications: a review. Renewable Sustainable Energy Rev. 2001,5 (4), 373−401.(35) Dorvio, A. S. S.; Jervase, J. A.; Al-Lawati, A. Solar radiationestimation using artificial neural networks. Appl. Energy 2002, 71 (4),307−319.(36) Sozen, A.; Arcaklyogblub, E.; Ozalpa, M.; Agclarc, N. C.Forecasting based on neural network approach of solar potential inTurkey. Renewable Energy 2005, 30 (7), 1075−1090.(37) Mubiru, E. J.; Banda, K. B. Estimation of monthly average dailyglobal solar radiation using artificial neural networks. Solar Energy2008, 82 (2), 181−187.(38) Gennusa, M. L.; Lascari, G.; Rizzo, G.; Scaccianoce, G.;Sorrentino, G. A model for predicting the potential diffusion of solarenergy systems in complex urban environments. Energy Policy 2011, 39(9), 5335−5343.(39) Copper, J. K.; Sproul, A. B. Comparative study of mathematicalmodels in estimating solar irradiance for Australia. Renewable Energy2012, 43, 130−139.(40) Landeras, G.; Lopez, J. J.; Kisi, O.; Shiri, J. Comparison of GeneExpression Programming with neuro-fuzzy and neural networkcomputing techniques in estimating daily incoming solar radiation inthe Basque Country (Northern Spain). Energy Convers. Manage. 2012,62, 1−13.(41) Boscha, J. L.; Lopezb, G.; Batllesa, F. J. Daily solar irradiationestimation over a mountainous area using artificial neural networks.Renewable Energy 2008, 33, 1622−1628.(42) Chineke, T. C. Equations for estimating global solar radiation indata sparse regions. Renewable Energy 2008, 33, 827−831.(43) Liang, H.; Zhang, R. H.; Liu, J. M.; Sun, Z. A.; Cheng, X. H.Estimation of hourly solar radiation at the surface under cloudlessconditions on the Tibetan Plateau using a simple radiation model. Adv.Atmos. Sci. 2012, 29 (4), 675−689.(44) Li, H.; Bu, X.; Lian, Y.; Zhao, L.; Maa, W. Further investigationof empirically derived models with multiple predictors in estimatingmonthly average daily diffuse solar radiation over China. RenewableEnergy 2012, 44, 469−473.(45) Korachagaon, I.; Bapat, V. N. General formula for the estimationof global solar radiation on earth’s surface around the globe. RenewableEnergy 2012, 41, 394−400.(46) Linares-Rodríguez, A.; Ruiz-Arias, J. A.; Pozo-Vazquez, D.;Tovar-Pescador, J. Generation of synthetic daily global solar radiationdata based on ERA-Interim reanalysis and artificial neural networks.Energy 2011, 36, 5356−5365.(47) Fodor, N. Improving the S-shape solar radiation estimationmethod for supporting crop models. Sci. World J.. 2012, Article ID768530;10 pages.(48) Senkal, O. Modeling of solar radiation using remote sensing andartificial neural network in Turkey. Energy 2010, 35, 4795−4801.(49) Martín, L.; Zarzalejo, L. F.; Polo, J.; Navarro, A.; Marchante, R.;Cony, M. Prediction of global solar irradiance based on time seriesanalysis: Application to solar thermal power plants energy productionplanning. Solar Energy 2010, 84, 1772−1781.(50) Duzen, H.; Aydin, H. Sunshine-based estimation of global solarradiation on horizontal surface at Lake Van region (Turkey). EnergyConvers. Manage. 2012, 58, 35−46.(51) Behrang, M. A.; Assareh, E.; Ghanbarzadeh, A.; Noghrehabadi,A. R. The potential of different artificial neural network (ANN)techniques in daily global solar radiation modeling based onmeteorological data. Solar Energy 2010, 84 (8), 1468−1480.(52) Fadare, D. A. Modelling of solar energy potential in Nigeriausing an artificial neural network model. Appl. Energy 2009, 86 (9),1410−1422.(53) Rumbayan, M.; Abudureyimu, A.; Nagasaka, K. Mapping ofsolar energy potential in Indonesia using artificial neural network and
geographical information system. Renewable Sustainable Energy Rev.2012, 16 (3), 1437−1449.(54) Polo, J.; Zarzalejo, L. F.; Cony, M.; Navarro, A. A.; Marchante,R.; Martín, L.; Romero, M. Solar radiation estimations over India usingMeteosat satellite images. Solar Energy 2011, 85 (9), 2395−2406.(55) Janjai, S.; Pankaewa, P.; Laksanaboonsong, J.; Kitichantaropas,P. Estimation of solar radiation over Cambodia from long-termsatellite data. Renewable Energy 2011, 36 (4), 1214−1220.(56) Wua, W.; Liu, H. B. Assessment of monthly solar radiationestimates using support vector machines and air temperatures. Int. J.Climatol. 2012, 32 (2), 274−285.(57) Brito, M. C.; Gomes, N.; Santos, T.; Tenedorio, J. A.Photovoltaic potential in a Lisbon suburb using LiDAR data. SolarEnergy 2012, 86 (1), 283−288.(58) Wiginton, L. K.; Nguyen, H. T.; Pearce, J. M. Quantifyingrooftop solar photovoltaic potential for regional renewable energypolicy. Computers, Environment and Urban Systems 2010, 34 (4), 345−357.(59) Duzen, H.; Aydin, H. Sunshine-based estimation of global solarradiation on horizontal surface at Lake Van region (Turkey). EnergyConvers. Manage. 2012, 58, 35−46.(60) Annual Climatological Report; Korea Meteorological Admin-istration (KMA): Seoul, South Korea, 2011.(61) Winslow, J. C.; Raymond Hunt, E., Jr.; Piper, S. C. A globallyapplicable model of daily solar irradiance estimated from airtemperature and precipitation data. Ecol. Modell. 2001, 143, 227−243.(62) Thornton, P. E.; Running, S. W. An improved algorithm forestimating incident daily solar radiation from measurements oftemperature, humidity, and precipitation. Agric. For. Meteorol. 1999,93, 211−228.(63) Liu, D. L.; Scott, B. J. Estimation of solar radiation in Australiafrom rainfall and temperature observations. Agric. For. Meteorol. 2001,106, 41−59.(64) Lopez, G.; Batlles, F. J.; Tovar-Pescador, J. Selection ofinputparameters to model direct solar irradiance by using artificial neuralnetworks. Energy 2005, 30, 1675−1684.(65) Jeong, D. Statistical Package for the Social Science(SPSS)(PASW)Demand Forecasting of Time Series I; Hannarae Publishing Co.: Seoul,South Korea, 2009.(66) Koo, C.; Hong, T.; Hyun, C. The development of aconstruction cost prediction model with improved prediction capacityusing the advanced CBR approach. Expert Syst. Appl. 2011, 38 (7),8597−8606.(67) Hong, T.; Koo, C.; Jeong, K. A decision support model forreducing electric energy consumption in elementary school facilities.Appl. Energy 2012, 95, 253−266.(68) Hong, T.; Koo, C.; Kim, H. A decision support model forimproving a multi-family housing complex based on CO2 emissionfrom electricity consumption. J. Environ. Manage. 2012, 112 (15), 67−78.(69) Hong, T.; Koo, C.; Park, S. A decision support model forimproving a multi-family housing complex based on CO2 emissionfrom gas energy consumption. Build. Environ. 2012, 52, 142−151.(70) Clean Energy Project Analysis: RETScreen Engineering & CasesTextbook, 3rd ed.; Minister of Natural Resources: Canada, 2010.(71) RETScreen International: Results and impacts 1996−2012;Minister of Natural Resources: Canada, 2004.(72) Connolly, D.; Lund, H.; Mathiesen, B. V.; Leahy, M. A review ofcomputer tools for analyzing the integration of renewable energy intovarious energy systems. Appl. Energy 2010, 87, 1059−1082.(73) Lee, K.; Lee, D.; Baek, N.; Kwon, H.; Lee, C. Preliminarydetermination of optimal size for renewable energy resources inbuildings using RETScreen. Energy 2012, 47, 83−96.(74) Iacobescu, F.; Badescu, V. The potential of the localadministration as driving force for the implementation of the NationalPV systems Strategy in Romania. Renewable Energy 2011, 38, 117−125.
Environmental Science & Technology Article
dx.doi.org/10.1021/es303774a | Environ. Sci. Technol. 2013, 47, 4829−48394838

(75) Alam Hossain Mondal, M.; Sadrul Islam, A. K. M. Potential andviability of grid-connected solar PV system in Bangladesh. RenewableEnergy 2011, 36, 1869−1874.(76) Harder, E.; MacDonald Gibson, J. The costs and benefits oflarge-scale solar photovoltaic power production in Abu Dhabi: UnitedArab Emirates. Renewable Energy 2011, 36, 789−796.(77) EL-Shimy, M. Viability analysis of PV power plants in Egypt.Renewable Energy 2009, 34, 2187−2196.(78) Khalid, A.; Junaidi, H. Study of economic viability ofphotovoltaic electric power for Quetta − Pakistan. Renewable Energy2013, 50, 253−258.(79) Gilman, P. A Comparison of three free computer models forevaluating PV and hybrid system design: homer, Hybrid2 andRETScreen. Proc. Solar Conf. 2007, 1, 81.(80) ASHRAE guideline 14−2002: Measurement of Energy andDemand Saving; American Society of Heating, Refrigerating and Air-Conditioning Engineers (ASHRAE): Atlanta, 2002.(81) Hernandes, J. C.; Vidal, P. G.; Almonacid, G. Photovoltaic ingrid-connected buildings. sizing and economic analysis. RenewableEnergy 1998, 15 (1−4), 562−565.(82) Nelson, D. B.; Nehrir, M. H.; Wang, C. Unit sizing and costanalysis of stand-alone hybrid wind/PV/fuel cell power generationsystems. Renewable Energy 2006, 31 (10), 1641−1656.(83) Celik, A. N. Long-term energy output estimation forphotovoltaic energy systems using synthetic solar radiation data.Energy 2003, 28 (5), 479−493.(84) Darling, S. B.; You, F.; Veselkad, T.; Velosa, A. Assumptions andthe levelized cost of energy for photovoltaics. Energy Environ. Sci. 2011,4 (9), 3133−3139.(85) Azzopardi, B.; Emmott, C. J. M.; Urbina, A.; Krebs, F. C.;Mutalea, J.; Nelsonb, J. Economic assessment of solar electricityproduction from organic-based photovoltaic modules in a domesticenvironment. Energy Environ. Sci. 2011, 4, 3741−3753.(86) Shirvani, T.; Yan, X.; Inderwildi, O. R.; Edwardsb, P. P.; King, D.A. Life cycle energy and greenhouse gas analysis for algae-derivedbiodiesel. Energy Environ. Sci. 2011, 4, 3773−3778.(87) Dell’Isola, A. J.; Kirk, S. J. Life Cycle Costing for Facilities; ReedConstruction Data: Kingston, 2003.(88) Craggsa, C.; Conwaya, E.; Pearsall, N. M. Stochastic modelingof solar irradiance on horizontal and vertical planes at a northerlylocation. Renewable Energy 1999, 18 (4), 445−463.(89) Jain, P. K.; Lungu, E. M. Stochastic models for sunshineduration and solar radiation. Renewable Energy 2002, 27 (2), 197−209.(90) Lee, H.; Lim, J. Statistical Package for the Social Science(SPSS)18.0 Manual; JypHyunJae Publishing Co.: Seoul, South Korea, 2011.(91) Loutzenhier, P. G.; Manz, H.; Felsmann, C.; Strachan, P. A.;Frank, T.; Maxwell, G. M. Empirical validation of models to computesolar irradiance on inclined surfaces for building energy simulation.Solar Energy 2007, 81 (2), 254−267.(92) Ju, J.; Kim, H.; Oh, S.; Lee, M.; Choi, J. A study on thedifference of regional electricity and economic comparative valuationof the photovoltaic system. Conference of Korea Institute of ArchitecturalSustainable Environment and Building Systems 2008, 137−140.(93) National Geographical Information System (NGIS). http://www.ngis.go.kr/.(94) The Application of Regional Climate Change Scenario for theNational Climate Change , Report (IV); Korea MeteorologicalAdministration (KMA): Seoul, South Korea, 2008.
Environmental Science & Technology Article
dx.doi.org/10.1021/es303774a | Environ. Sci. Technol. 2013, 47, 4829−48394839