Embed Size (px)
Citation preview

Faculté des arts et des sciences
Estimation of the
Markov-switching GARCH model
by a Monte Carlo EM algorithm
Maciej Augustyniak
Fields Institute
February 3, 2012
Mathématiques et statistique

Faculté des arts et des sciences
Agenda
• Stylized facts of financial data
• GARCH
• Regime-switching
• MS-GARCH
• Available estimation methods for MS-GARCH models
• EM algorithm and its stochastic variants
• Estimation algorithm for the MS-GARCH based on
the Monte Carlo EM algorithm
• Simulation study
Mathématiques et statistique

Faculté des arts et des sciences
Stylized facts of financial data
• There is no (or very weak) correlation in returns
• However, the square of the returns are highly
correlated; this implies a certain form of dependence
between returns
• Volatility clustering: periods of high and low volatility
• Heavy tails and negative skewness
• Leverage effect: a large negative return has a bigger
impact on future volatility than a large positive return
• Jumps in volatility and returns
Mathématiques et statistique

Faculté des arts et des sciences
Stylized facts of financial data
Mathématiques et statistique

Faculté des arts et des sciences
GARCH
• GARCH(1,1)
• Properties
– Heavy tails
– Volatility clustering
– No correlation in returns but correlation in the squares
Mathématiques et statistique
2 2 2
1 1
t t t
t t t
t t
y
y

Faculté des arts et des sciences
Regime-Switching
• In regime-switching (RS) models, the distribution
generating returns depends on the (unobservable)
state of the economy (also known as regime)
Mathématiques et statistique
( 20%,26%)N (17%,12%)N

Faculté des arts et des sciences
Regime-Switching
Mathématiques et statistique
1 2 1
𝑦1 𝑦2 𝑦3
1 2 1
𝑦1 𝑦2 𝑦3
Mixture RS
0.75 0.25
0.75 0.25
0.95 0.05
0.20 0.80
Faculté des arts et des sciences
Regime-Switching
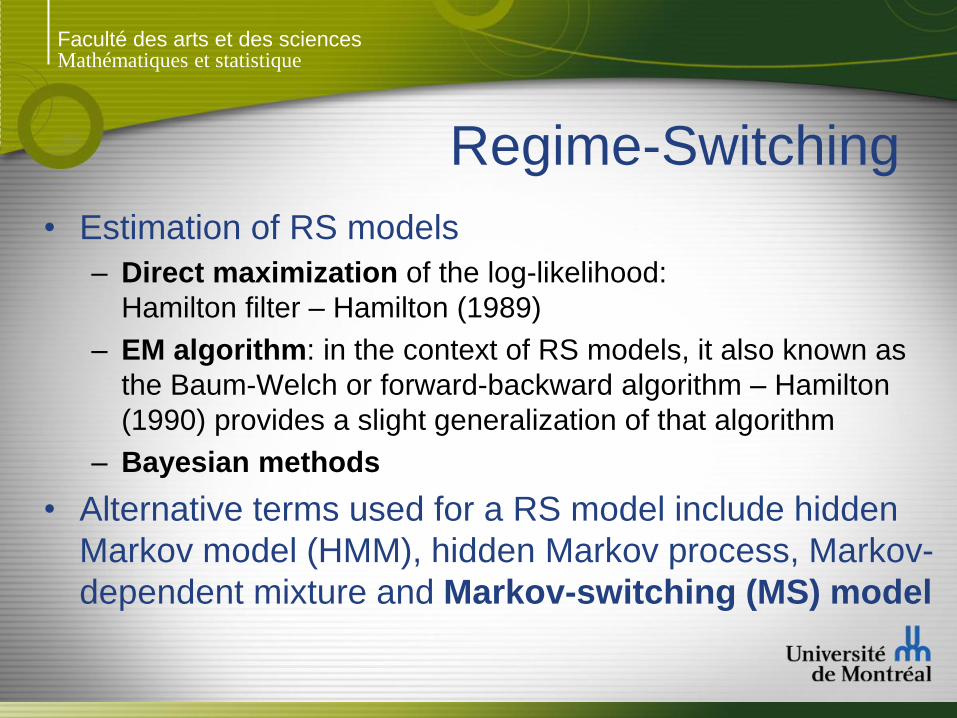
• Estimation of RS models
– Direct maximization of the log-likelihood:
Hamilton filter – Hamilton (1989)
– EM algorithm: in the context of RS models, it also known as
the Baum-Welch or forward-backward algorithm – Hamilton
(1990) provides a slight generalization of that algorithm
– Bayesian methods
• Alternative terms used for a RS model include hidden
Markov model (HMM), hidden Markov process, Markov-
dependent mixture and Markov-switching (MS) model
Mathématiques et statistique
Faculté des arts et des sciences
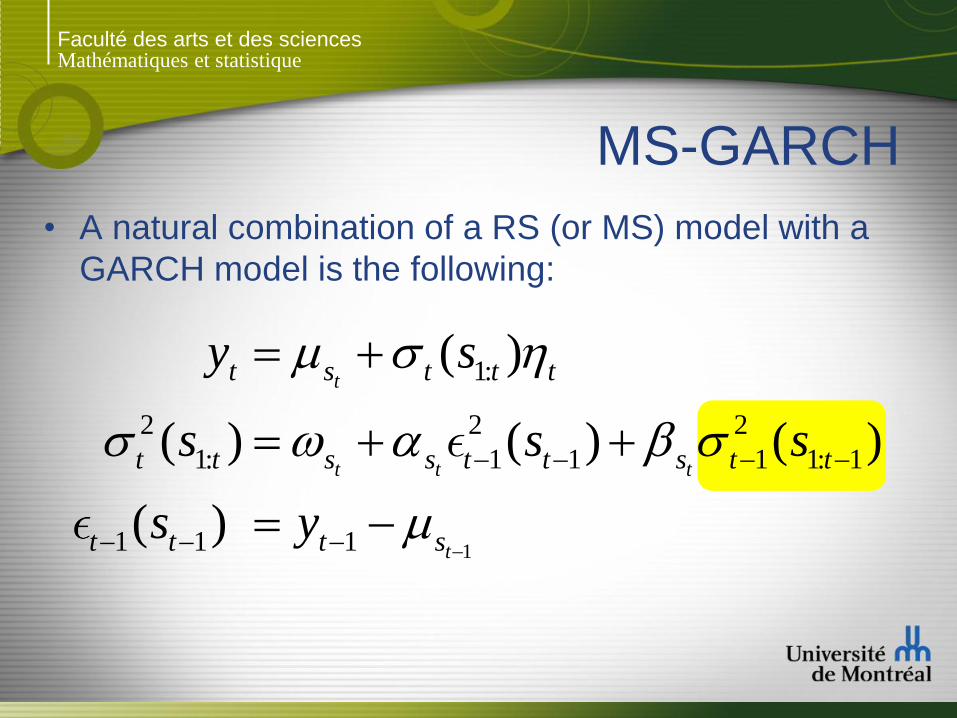
• A natural combination of a RS (or MS) model with a
GARCH model is the following:
MS-GARCH
Mathématiques et statistique
1
1:
2 2 2
1: 1 1 1 1: 1
1 1 1
( )
( ) ( ) ( )
( )
t
t t t
t
t s t t t
t t s s t t s t t
t t t s
y s
s s s
s y

Faculté des arts et des sciences
MS-GARCH
• The conditional distribution of each observation
depends on the whole regime path
Path dependence problem
Mathématiques et statistique
0
1 1s
1 2s
1(1)
1(2)
2 1s
2 2s
2 1s
2 2s
2 (1,1)
2 (1,2)
2 (2,1)
2 (2,2)

Faculté des arts et des sciences
MS-GARCH
• MS-GARCH models are becoming increasingly popular
to model financial data
• Due to this popularity, it is essential to develop efficient
estimation techniques
• However, estimating these models is a difficult task
because of the path dependence problem; one has
yet to propose a method to obtain the maximum
likelihood estimator (MLE) of the model!
• I will now present some methods that were developed
in the past to estimate MS-GARCH models
Mathématiques et statistique

Faculté des arts et des sciences
Methods based on collapsing
• Hamilton and Susmel (1994) and Cai (1994) introduce
MS-ARCH models that avoid path dependence
• First “MS-GARCH” model: Gray (1996)
Mathématiques et statistique
1 2Var( | , , )t t t th y y y
0
1 1s
1 2s
1(1)
1(2)
1h
2 1s
2 2s
2 (1)
2 (2)
2h

Faculté des arts et des sciences
GMM
Mathématiques et statistique
• Francq and Zakoïan (2008) are the first to propose a
method to estimate the MS-GARCH model without
resorting to a modification of the model
• They estimate the model using the generalized method
of moments (GMM); the path dependence problem is
not encountered since the method does not rely on the
likelihood
• Their technique relies on the availability of analytic
expressions (derived by Francq and Zakoïan, 2005)
for and , and
• Problems: identifiability, robustness and bias
2( )tE y 2 2( )m m
t t kE y y 1m 0k
Faculté des arts et des sciences
Bayesian MCMC
Mathématiques et statistique
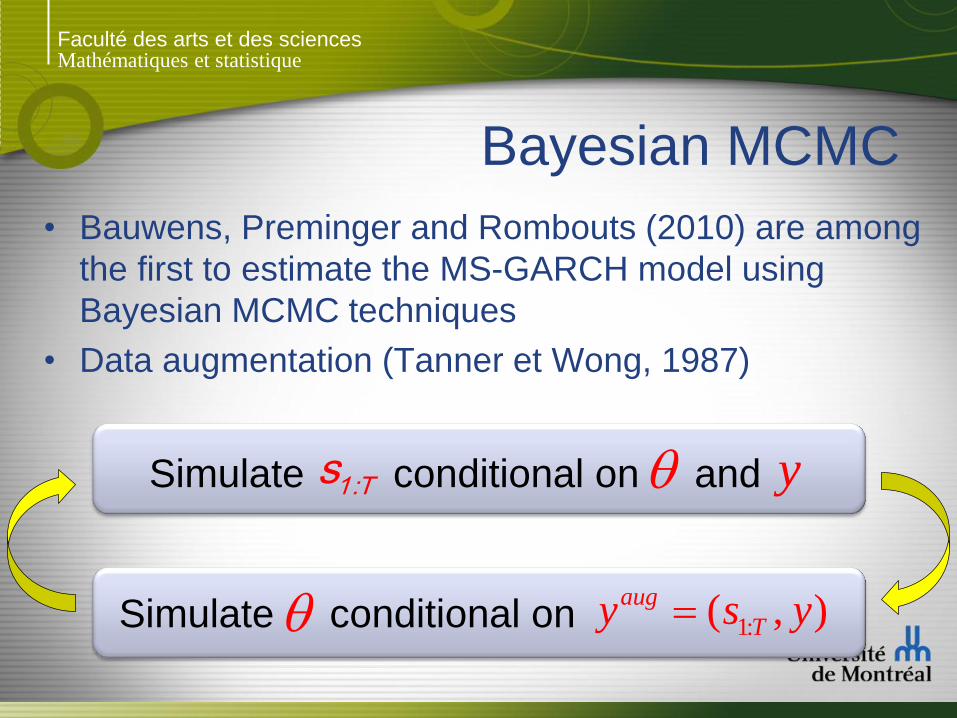
• Bauwens, Preminger and Rombouts (2010) are among
the first to estimate the MS-GARCH model using
Bayesian MCMC techniques
• Data augmentation (Tanner et Wong, 1987)
Simulate conditional on and y1:Ts
Simulate conditional on 1:( , )aug
Ty s y
Faculté des arts et des sciences
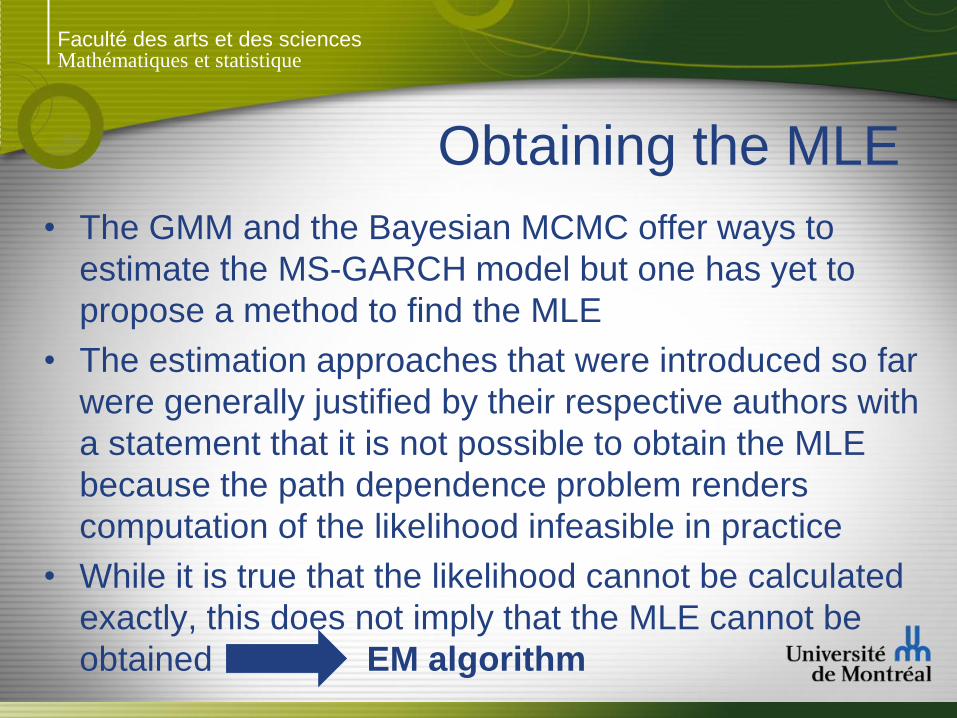
• The GMM and the Bayesian MCMC offer ways to
estimate the MS-GARCH model but one has yet to
propose a method to find the MLE
• The estimation approaches that were introduced so far
were generally justified by their respective authors with
a statement that it is not possible to obtain the MLE
because the path dependence problem renders
computation of the likelihood infeasible in practice
• While it is true that the likelihood cannot be calculated
exactly, this does not imply that the MLE cannot be
obtained EM algorithm
Obtaining the MLE
Mathématiques et statistique

Faculté des arts et des sciences
EM
Mathématiques et statistique
• EM Algorithm: Dempster et al. (1977)
• Insight: let ℓ(𝜽) represent the log-likelihood
• We wish to find a better value than 𝜃′, i.e., we need
) [log ( , | ) | , ] [log ( | , ) | , ]
(
(
| ( |) )
E f y y E f y
Q
S yS
H
) ) [ ( | ( |
[ ( | (
( ( ) )]
) )] 0|H
Q Q
H
≤ 0

Faculté des arts et des sciences
1
( 1) ( 1)
( 1) )(
( | log[ ( , )] ( , )
1 ˆlog[ ( , )] (
)
| )r
r
m
m
i
r
r
r
r
r
i
Q f y f y d
f y
S
S Q
S
m
S
∣ ∣
∣
• E-Step
• M-Step
EM
Mathématiques et statistique
(( 1) )arg max ( )rr Q
∣
Monte Carlo E-Step (Wei and Tanner, 1990)

Faculté des arts et des sciences
E-Step: Gibbs sampler
Mathématiques et statistique
• How can we obtain draws from ?
Gibbs sampler (single-move)
• Full conditional distribution
( 1)( , )rf yS ∣
( 1)
1
(
( 1
1
1
)
)
)
1
(
1
i
i
i
i
s
s
s
s
(
( )
2
( 1
( )
2
1)
2
)
2
i
i
i
i
s
s
s
s
)
(
(
(
)
( )
)
i
T
T
T
i
i
T
i
s
s
s
s
( 1), )( ry ( )
3
( )
3
( )
3
( 1)
3
i
i
i
i
s
s
s
s
( ) ( 1)1 1, ,
( ) ( 1) ( 1) 1
1: 1 1:( , , , )j
i it tt t
Tj si i r
t t t T js s s sj t j
yp s s s y p p g
∣

Faculté des arts et des sciences
M-Step
Mathématiques et statistique
• The M-Step is straightforward and requires less
computational time than the E-Step
• It can be split into two independent maximizations
1) Transition probabilities: closed-form optimization
2) GARCH parameters: the optimization must be performed
numerically
• The gradient of the function to be maximized can be
calculated recursively

Faculté des arts et des sciences
Importance sampling
Mathématiques et statistique
• Importance sampling (reweighting samples)
• Problem (minor): At each iteration of the Monte Carlo
EM (MCEM) algorithm the parameters are updated
and the sample size is (should be) increased; the
importance proposal density may become
inappropriate
( 1)
( 1
*
*
* *
)
1 1
ˆ ( | log[ ( , )] , where
( , | )
( )
)
, |
r r
r
m m
m i i
i
i
i
r
i
i
r
i
Q f y
f y S
f
S
y S
∣

Faculté des arts et des sciences
SAEM
Mathématiques et statistique
• Eventually, we would like to keep the sample size fixed
and stop generating states; however, the MCEM does
not converge with a fixed sample size
• Solution: Stochastic Approximation EM (SAEM)
(Delyon, Lavielle and Moulines, 1999)
(
1
1) (
(
2)
)
1
ˆ ˆ( ) (1 ) ( )
1log[ ( , )]
r
r r
r r r
m
r i
ir
r
Q Q
f ym
S
∣ ∣
∣step size
can be held fixed
Faculté des arts et des sciences
SAEM
Mathématiques et statistique
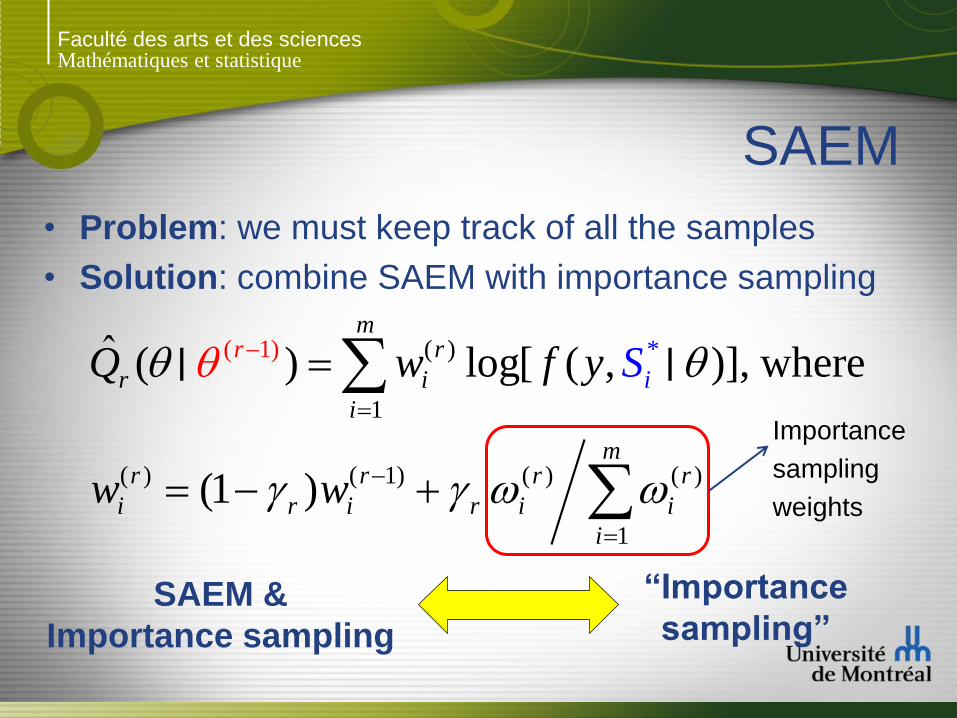
• Problem: we must keep track of all the samples
• Solution: combine SAEM with importance sampling
( )
1
(
( 1) *
) ( 1) ( ) ( )
1
ˆ ( ) log[ ( , )], where
(1 )
r
r i
i
r r r r
i r
m
m
i r
r
i i
i
iQ w f y
w w
S
∣ ∣
SAEM &
Importance sampling
“Importance
sampling”
Importance
sampling
weights

Faculté des arts et des sciences
The algorithm
Mathématiques et statistique
Strategy
1) Start with 10 steps of the MCEM algorithm, increasing
the sample size at each step
2) Do 5 steps with importance sampling
3) End with 5 steps of SAEM with importance sampling
using the following step sizes
1/2/ , ,1 , 62n n
Faculté des arts et des sciences
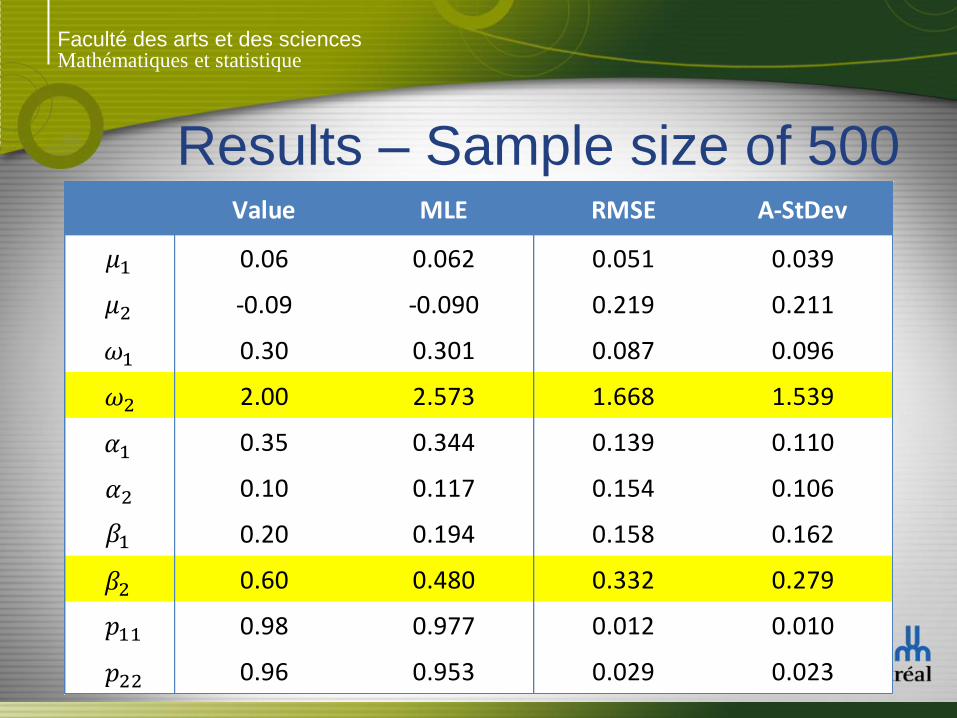
Results – Sample size of 500
Mathématiques et statistique
Value MLE RMSE A-StDev
0.06 0.062 0.051 0.039
-0.09 -0.090 0.219 0.211
0.30 0.301 0.087 0.096
2.00 2.573 1.668 1.539
0.35 0.344 0.139 0.110
0.10 0.117 0.154 0.106
0.20 0.194 0.158 0.162
0.60 0.480 0.332 0.279
0.98 0.977 0.012 0.010
0.96 0.953 0.029 0.023
1
2
1
2
1
2
1
2
11
22

Faculté des arts et des sciences
Results – Sample size of 1500
Mathématiques et statistique
Value MLE RMSE A-StDev
0.06 0.061 0.023 0.025
-0.09 -0.092 0.114 0.114
0.30 0.301 0.057 0.054
2.00 2.310 1.129 1.006
0.35 0.351 0.064 0.071
0.10 0.089 0.058 0.060
0.20 0.199 0.098 0.091
0.60 0.561 0.189 0.187
0.98 0.979 0.007 0.006
0.96 0.959 0.014 0.011
1
2
1
2
1
2
1
2
11
22

Faculté des arts et des sciences
Results – Sample size of 5000
Mathématiques et statistique
Value MLE RMSE A-StDev
0.06 0.061 0.013 0.012
-0.09 -0.090 0.060 0.065
0.30 0.302 0.026 0.032
2.00 2.059 0.525 0.563
0.35 0.353 0.037 0.037
0.10 0.094 0.034 0.030
0.20 0.196 0.048 0.052
0.60 0.597 0.097 0.101
0.98 0.980 0.003 0.003
0.96 0.959 0.006 0.006
1
2
1
2
1
2
1
2
11
22

Faculté des arts et des sciences
Thank You!
Questions?
Mathématiques et statistique


![Efficient Gibbs Sampling for Markov Switching GARCH · 2012. 12. 24. · arXiv:1212.5397v1 [math.ST] 21 Dec 2012 Efficient Gibbs Sampling for Markov Switching GARCH Models MonicaBillio†](https://img.pdfslide.us/doc/110x75/60c93604fca6615deb5bd1ff/eifcient-gibbs-sampling-for-markov-switching-garch-2012-12-24-arxiv12125397v1.jpg)