Embed Size (px)
Citation preview

LUND UNIVERSITY
PO Box 117221 00 Lund+46 46-222 00 00
Estimation of the intake of anthocyanidins and their food sources in the EuropeanProspective Investigation into Cancer and Nutrition (EPIC) study
Zamora-Ros, Raul; Knaze, Viktoria; Lujan-Barroso, Leila; Slimani, Nadia; Romieu, Isabelle;Touillaud, Marina; Kaaks, Rudolf; Teucher, Birgit; Mattiello, Amalia; Grioni, Sara; Crowe,Francesca; Boeing, Heiner; Foerster, Jana; Ramon Quiros, J.; Molina, Esther; Maria Huerta,Jose; Engeset, Dagrun; Skeie, Guri; Trichopoulou, Antonia; Dilis, Vardis; Tsiotas,Konstantinos; Peeters, Petra H. M.; Khaw, Kay-Thee; Wareham, Nicholas; Bueno-de-Mesquita, Bas; Ocke, Marga C.; Olsen, Anja; Tjonneland, Anne; Tumino, Rosario;Johansson, Gerd; Johansson, Ingegerd; Ardanaz, Eva; Sacerdote, Carlotta; Sonestedt,Emily; Ericson, Ulrika; Clavel-Chapelon, Francoise; Boutron-Ruault, Marie-Christine;Fagherazzi, Guy; Salvini, Simonetta; Amiano, Pilar; Riboli, Elio; Gonzalez, Carlos A.Published in:British Journal of Nutrition
DOI:10.1017/S0007114511001437
Published: 2011-01-01
Link to publication
Citation for published version (APA):Zamora-Ros, R., Knaze, V., Lujan-Barroso, L., Slimani, N., Romieu, I., Touillaud, M., ... Gonzalez, C. A. (2011).Estimation of the intake of anthocyanidins and their food sources in the European Prospective Investigation intoCancer and Nutrition (EPIC) study. British Journal of Nutrition, 106(7), 1090-1099. DOI:10.1017/S0007114511001437

General rightsCopyright and moral rights for the publications made accessible in the public portal are retained by the authorsand/or other copyright owners and it is a condition of accessing publications that users recognise and abide by thelegal requirements associated with these rights.
• Users may download and print one copy of any publication from the public portal for the purpose of privatestudy or research. • You may not further distribute the material or use it for any profit-making activity or commercial gain • You may freely distribute the URL identifying the publication in the public portalTake down policyIf you believe that this document breaches copyright please contact us providing details, and we will removeaccess to the work immediately and investigate your claim.
Download date: 11. Sep. 2018

Estimation of the intake of anthocyanidins and their food sources in theEuropean Prospective Investigation into Cancer and Nutrition (EPIC) study
Raul Zamora-Ros1*, Viktoria Knaze1, Leila Lujan-Barroso1, Nadia Slimani2, Isabelle Romieu2,Marina Touillaud2, Rudolf Kaaks3, Birgit Teucher3, Amalia Mattiello4, Sara Grioni5, Francesca Crowe6,Heiner Boeing7, Jana Forster7, J. Ramon Quiros8, Esther Molina9,10, Jose Marıa Huerta10,11,Dagrun Engeset12, Guri Skeie12, Antonia Trichopoulou13,14, Vardis Dilis13,14, Konstantinos Tsiotas13,Petra H. M. Peeters15,16, Kay-Thee Khaw17, Nicholas Wareham18, Bas Bueno-de-Mesquita19,20,Marga C. Ocke19, Anja Olsen21, Anne Tjønneland21, Rosario Tumino22, Gerd Johansson23,Ingegerd Johansson24, Eva Ardanaz10,25, Carlotta Sacerdote26, Emily Sonestedt27, Ulrika Ericson27,Francoise Clavel-Chapelon28,29, Marie-Christine Boutron-Ruault28,29, Guy Fagherazzi28,29,Simonetta Salvini30, Pilar Amiano10,31, Elio Riboli32 and Carlos A. Gonzalez1
1Unit of Nutrition, Environment and Cancer, Cancer Epidemiology Research Programme, Catalan Institute of Oncology,
IDIBELL, Barcelona, Spain2Dietary Exposure Assessment Group, International Agency for Research on Cancer (IARC), Lyon, France3Department of Cancer Epidemiology, German Cancer Research Centre, Heidelberg, Germany4Department of Clinical and Experimental Medicine, Federico II University, Naples, Italy5Nutritional Epidemiology Unit, Fondazione IRCCS Istituto Nazionale dei Tumori, Milan, Italy6Cancer Epidemiology Unit, University of Oxford, Oxford, UK7Department of Epidemiology, German Institute of Human Nutrition Potsdam-Rehbrucke, Nuthetal, Germany8Public Health and Health Planning Directorate, Asturias, Spain9Andalusian School of Public Health, Granada, Spain10CIBER Epidemiologıa y Salud Publica (CIBERESP), Spain11Department of Epidemiology, Murcia Regional Health Authority, Murcia, Spain12Department of Community Medicine, University of Tromsø, Tromsø, Norway13WHO Collaborating Centre for Food and Nutrition Policies, Department of Hygiene, Epidemiology and Medical Statistics,
University of Athens Medical School, Athens, Greece14Hellenic Health Foundation, Athens, Greece15Julius Centre for Health Sciences and Primary Care, University Medical Centre Utrecht, Utrecht, The Netherlands16Department of Epidemiology and Biostatistics, School of Public Health, Faculty of Medicine, Imperial College, London, UK17University of Cambridge School of Clinical Medicine, Cambridge, UK18MRC Epidemiology Unit, Cambridge, UK19National Institute for Public Health and the Environment (RIVM), Bilthoven, The Netherlands20Department of Gastroenterology and Hepatology, University Medical Centre Utrecht (UMCU), Utrecht, The Netherlands21Institute of Cancer Epidemiology, Danish Cancer Society, Copenhagen, Denmark22Cancer Registry and Histopathology Unit, ‘Civile M.P. Arezzo’ Hospital, Ragusa, Italy23Department of Clinical Medicine and Public Health/Nutritional Research, Umea University, Umea, Sweden24Department of Odontology/Cariology, Umea University, Umea, Sweden25Navarre Public Health Institute, Pamplona, Spain26Centre for Cancer Prevention (CPO-Piemonte), and Human Genetic Foundation (HuGeF), Torino, Italy27Diabetes and Cardiovascular Disease, Genetic Epidemiology, Department of Clinical Sciences, Lund University,
Malmo, Sweden28INSERM, Centre for Research in Epidemiology and Population Health, U1018, Institut Gustave Roussy, Villejuif, France29Paris South University, UMRS 1018, Villejuif, France
*Corresponding author: Dr Raul Zamora-Ros, fax þ34 932607787, email [email protected]
Abbreviations: EPIC, European Prospective Investigation into Cancer and Nutrition; FCDB, food composition database; 24-HDR, 24 h dietary recall.
British Journal of Nutrition (2011), 106, 1090–1099 doi:10.1017/S0007114511001437q The Authors 2011
British
Journal
ofNutrition
30Molecular and Nutritional Epidemiology Unit, Cancer Research and Prevention Institute – ISPO, Florence, Italy31Public Health Department of Guipuzkoa, Instituto Investigacion Sanitaria BioDonostia, Basque Government,
San Sebastian, Spain32Department of Epidemiology, Public Health and Primary Care, Imperial College, London, UK
(Received 19 October 2010 – Revised 21 February 2011 – Accepted 24 February 2011 – First published online 12 April 2011)
Abstract
Anthocyanidins are bioactive flavonoids with potential health-promoting effects. These may vary among single anthocyanidins considering
differences in their bioavailability and some of the mechanisms involved. The aim of the present study was to estimate the dietary intake of
anthocyanidins, their food sources and the lifestyle factors (sex, age, BMI, smoking status, educational level and physisical activity)
involved among twenty-seven centres in ten European countries participating in the European Prospective Investigation into Cancer
and Nutrition (EPIC) study. Anthocyanidin intake and their food sources for 36 037 subjects, aged between 35 and 74 years, in twenty-
seven redefined centres were obtained using standardised 24 h dietary recall software (EPIC-SOFT). An ad hoc food composition database
on anthocyanidins (cyanidin, delphinidin, malvidin, pelargonidin, peonidin, petunidin) was compiled using data from the US Department
of Agriculture and Phenol-Explorer databases and was expanded by adding recipes, estimated values and cooking factors. For men, the
total anthocyanidin mean intake ranged from 19·83 (SE 1·53) mg/d (Bilthoven, The Netherlands) to 64·88 (SE 1·86) mg/d (Turin, Italy),
whereas for women the range was 18·73 (SE 2·80) mg/d (Granada, Spain) to 44·08 (SE 2·45) mg/d (Turin, Italy). A clear south to north
gradient intake was observed. Cyanidins and malvidins were the main anthocynidin contributors depending on the region and sex. Antho-
cyanidin intake was higher in non-obese older females, non-smokers, and increased with educational level and physical activity. The major
food sources were fruits, wine, non-alcoholic beverages and some vegetables. The present study shows differences in both total and indi-
vidual anthocyanidin intakes and various lifestyle factors throughout Europe, with some geographical variability in their food sources.
Key words: Anthocyanidins: Intake: Food sources: EPIC-Europe
Anthocyanidins are water-soluble plant pigments that form one
subgroup of flavonoids. They mainly provide the red, blue and
purple colours to fruits, vegetables and flowers. Chemically,
they are derivative salts of the flavilium cation. Anthocyanins
are glycosides of anthocyanidins, and their sugar moiety
(glucose, galactose, rhamnose, xylose and fructose) is mostly
bounded to the C3 position of the C-ring(1). Diglycosides have
also been reported, but in smaller amounts(1).
In nature, more than 500 anthocyanins derived from thirty-
one anthocyanidins have been identified(2). However, only six
anthocyanidins (cyanidin, delphinidin, malvidin, pelargonidin,
peonidin and petunidin) occur ubiquitously and have dietary
importance. They are found in fruits, such as berries, red
grapes, cherries, and plums; in vegetables, such as red cabbage,
red onions, radish and aubergines; and also in fruit and veg-
etable products, such as juices andwines(3,4). The anthocyanidin
content is enhanced during the ripening process. Moreover,
these flavonoids are found mainly in the skin of fruit, except in
berries where they are in the skin and flesh(5).
Some epidemiological studies suggest that the consumption
of anthocyanidins decreases the risk of total mortality(6) and
CVD(7,8) due, in part, to their antioxidant and anti-inflamma-
tory activities(9). There is also much in vitro and in vivo
evidence in animal models about their anti-carcinogenic
properties(9,10), but findings in human subjects are still contro-
versial. Anthocyanidin intake has been associated with a
decreased risk of some cancers, especially digestive system
cancers(11–15), but, in other epidemiological studies, these sig-
nificant associations were not observed(6,16–25).
All anthocyanidins are poorly absorbed (usually less than
0·1 %, but up to 5 % has been reported), highly metabolised
(more than 65 % is detected in glucuronidated and methylated
forms in serum) and rapidly excreted in urine (about 4 h elim-
ination half-life)(9). Differences in the chemical structure of
some anthocyanidins also determine their bioavailability; for
example, pelargonidin-3-glucoside has an 8-fold higher
apparent absorption rate than cyanidin-3-glucoside(26). In the
same way, several activities of anthocyanidins depend on
their chemical structure(9). For example, delphynidins and
cyanidins are able to inhibit lipopolysaccharide-induced
cyclo-oxygenase-2 expression, but pelargonidins, peonidins
and malvidins are not(27). For these reasons, further studies are
needed, comparing individual anthocyanidin bioavailability
and metabolic actions.
To date, there are few population-based descriptive
studies of anthocyanidin intake(28,29), especially in European
countries(30,31). The previous studies mainly reported associ-
ations between anthocyanidins and markers of disease risk.
In general, these studies evaluated anthocyanidins as a
group rather than exploring individual anthocyanidins;
furthermore, main food sources were not reported. The aims
of the present study were to estimate the consumption of
the six most important anthocyanidins and their main food
sources across the ten European countries participating in
the European Prospective Investigation into Cancer and Nutri-
tion (EPIC) study and across population subgroups.
Materials and methods
Study population
EPIC is an ongoing prospective cohort study designed to
investigate the associations between diet, lifestyle and cancer
Anthocyanidin intake and food sources 1091
British
Journal
ofNutrition

throughout ten western European countries: Denmark, France,
Germany, Greece, Italy, Norway, Spain, Sweden, The Nether-
lands and the UK(32,33). The cohort includes approximately
366 000 women and 153 000 men, most aged 35–70 years,
who were enrolled between 1992 and 2000. Participants were
mostly recruited from the general population residing within
defined geographical areas, with some exception: women
members of a health insurance scheme for state school employ-
ees (France); women attending breast cancer screening
(Utrecht in The Netherlands and Florence in Italy); mainly
blood donors (centres in Italy and Spain); and a cohort consist-
ing predominantly of vegetarians (the ‘health-conscious’ cohort
in Oxford, UK)(33). The initial twenty-three EPIC administrative
centres were redefined into twenty-seven geographical regions
relevant to the analysis of dietary consumption patterns(34).
Of the twenty-seven EPIC centres redefined for dietary analysis,
nineteen had both male and female participants, and eight
recruited only women (France, Norway, Utrecht in The Nether-
lands and Naples in Italy).
For calibration purposes, a standardised 24 h dietary recall
(24-HDR) interview was administered to a stratified random
sample (36 994) by age, sex and centre, and weighted for
expected cancer cases in each stratum. A total of 36 037
subjects with 24-HDR data were included in this analysis,
after exclusion of 941 subjects aged less than 35 years of age
or over 74 years because of low participation in these age
categories, and sixteen subjects were excluded due to missing
FFQ data. Approval for the EPIC study was obtained from
all ethical review boards of participating institutions. All
participants provided written informed consent.
Dietary and lifestyle information
The 24-HDR was administered in a face-to-face interview,
except in Norway, where it was obtained by telephone inter-
view(35). A computerised interview program (EPIC-SOFT) was
developed specifically for the calibration study(36,37). A com-
plete description of the rationale, methodology and
population characteristics of the 24-HDR calibration study
has been described elsewhere(34). The original diet and
health survey from which information used in the present
study was obtained had ethical approval from all ethical
review boards of participating institutions.
Data on other lifestyle factors, including educational
level, anthropometry, physical activity and smoking history,
were collected at baseline through standardised question-
naires and clinical examinations, and have been described
elsewhere(33,34,38). Data on age, as well as on body weight
and height, were self-reported by the participants during
the 24-HDR interview. The mean time interval between
completion of the baseline questionnaire measures and
the 24-HDR interview varied by country, and ranged from
1 d to 3 years later(34).
Food composition database
In order to estimate the anthocyanidin (cyanidin, delphynidin,
malvidin, pelargonidin, peonidin and petunidin) intake from
the 24-HDR, a food composition database (FCDB) was devel-
oped, which contained 1877 food items (annex table 1; see
supplementary material available online at http://www.
journals.cambridge.org/bjn). Anthocyanidins are expressed
as anthocyanidin aglycones per 100 mg fresh weight and are
calculated as the sum of the available forms (glycosides and
aglycones) in the literature.
Our database is based on the US Department of Agriculture
(USDA) database(3) and expanded with values from Phenol-
Explorer(39). Approximately, 5 and 1 % of our database come
from USDA and Phenol-Explorer databases, respectively. To
date, these two databases are the most complete and updated
databases on flavonoids and polyphenols and they evaluate
and compile the most worldwide food composition data pub-
lished. There are no large differences on the anthocyanidin
data between the two databases.
One cannot assume that foods that are not in either of the
databases do not contain anthocyanidins. Therefore, for our
FCDB we calculated estimated values (89 %) including logical
zeros (26 %), estimations based on similar food items (15 %),
application of retention factors (29 %) and recipes (19 %).
First, logical zeros were applied when no anthocyanidins are
expected in a food (for example, animal foods or plant
foods without colour, because anthocyanidins are plant
pigments). Second, estimations based on similar food items
were applied when it was possible to extrapolate the compo-
sition from one food to another similar one (for example,
different varieties of blueberries). Third, when there was no
analytical data for cooked food, retention factors were
applied. These were 70, 35 and 25 % after frying, cooking in
a microwave oven, and boiling, respectively(40). Crozier
et al.(40) calculated these retention factors for flavonols, but
these are quite similar to the average of anthocyanidin reten-
tion factors available in the literature by each cooking
method(41–45), although further investigation is needed in
this regard. Recipes were applied when it was feasible to
deconstruct the food item into a list of available ingredients
in our FCDB. Finally, only 4 % of our FCDB had missing
values, which are calculated as a zero by default.
Statistical analyses
Dietary intake data are presented as means (least square
means) and standard errors stratified by sex and study
centre and ordered according to a geographical south to
north gradient. The mean intake data were adjusted for age.
The contribution of each food group to the total intake of
anthocyanidins was calculated as a percentage. Differences
in anthocyanidin intake stratified by sex were also compared
according to the categories of age, educational level, smoking
status, level of physical activity, BMI and European region
(south: all centres in Greece, Spain, Italy and the south of
France centre; central: all of France other than the south
centre, all centres in Germany, The Netherlands and the UK;
north: all centres in Denmark, Sweden and Norway). These
models were adjusted for age, region, BMI and energy
intake. All models were weighted by season and day of the
week of the 24-HDR using generalised linear models to
R. Zamora-Ros et al.1092
British
Journal
ofNutrition

Table 1. Adjusted* daily intakes (mg/d) of total and single anthocyanidins by sex and centre ordered from south to north
(Mean values with their standard errors)
Men Women
Anthocyanidins
(mg/d)
Cyanidin
(mg/d)
Delphinidin
(mg/d)
Malvidin
(mg/d)
Pelargonidin
(mg/d)
Peonidin
(mg/d)
Petunidin
(mg/d)
Anthocyani-
dins (mg/d)
Cyanidin
(mg/d)
Delphinidin
(mg/d)
Malvidin
(mg/d)
Pelargonidin
(mg/d)
Peonidin
(mg/d)
Petunidin
(mg/d)
Country and centre n Mean SE Mean SE Mean SE Mean SE Mean SE Mean SE Mean SE n Mean SE Mean SE Mean SE Mean SE Mean SE Mean SE Mean SE
Greece 1314 37·87 1·34 14·54 0·79 2·21 0·32 17·30 0·63 0·59 0·31 2·06 0·13 1·15 0·08 1373 25·77 1·31 12·42 0·77 1·28 0·31 9·53 0·61 0·65 0·30 1·31 0·12 0·57 0·08
Spain
Granada 214 38·50 3·31 13·92 1·95 2·38 0·79 17·21 1·55 1·08 0·76 2·20 0·31 1·71 0·20 300 18·73 2·80 11·66 1·65 0·85 0·67 3·87 1·31 1·28 0·64 0·76 0·26 0·31 0·17
Murcia 243 36·46 3·11 16·73 1·83 2·09 0·74 13·60 1·46 0·91 0·71 1·64 0·29 1·48 0·18 304 21·40 2·79 11·17 1·64 1·20 0·66 5·59 1·30 2·33 0·64 0·69 0·26 0·43 0·17
Navarra 444 39·45 2·30 10·39 13·52 2·94 0·55 20·20 1·08 1·00 0·53 2·50 0·21 2·42 0·14 271 22·76 2·94 9·73 1·73 0·83 0·70 8·78 1·38 1·75 0·67 1·06 0·27 0·60 0·17
San Sebastian 490 47·49 2·19 16·00 1·29 3·25 0·52 20·93 1·03 2·26 0·50 2·47 0·20 2·58 0·13 244 26·29 3·11 13·20 1·83 0·93 0·74 7·18 1·46 3·54 0·70 0·80 0·29 0·65 0·18
Asturias 386 39·55 2·47 14·76 1·45 2·27 0·59 15·90 1·16 2·59 0·56 2·08 0·23 1·96 0·15 324 25·16 2·69 15·41 1·58 0·77 0·64 5·03 1·26 2·52 0·62 0·94 0·25 0·49 0·16
Italy
Ragusa 168 44·39 3·74 19·53 2·20 3·05 0·89 16·85 1·75 0·97 0·85 2·38 0·35 1·60 0·22 138 33·93 4·13 21·68 2·43 1·98 0·98 7·56 1·94 0·84 0·94 1·27 0·38 0·59 0·25
Naples 403 27·55 2·41 15·62 1·42 1·55 0·58 6·04 1·13 2·38 0·55 1·40 0·22 0·57 0·14
Florence 271 44·46 2·94 19·54 1·73 2·71 0·70 16·05 1·38 2·40 0·67 2·04 0·27 1·72 0·17 784 30·29 1·73 14·03 1·02 1·47 0·41 9·56 0·81 3·03 0·40 1·41 0·16 0·80 0·10
Turin 676 64·88 1·86 25·44 1·10 4·05 0·44 26·42 0·87 2·70 0·43 3·61 0·17 2·67 0·11 392 44·08 2·45 23·06 1·44 2·29 0·58 11·44 1·15 4·08 0·56 2·11 0·23 1·11 0·15
Varese 327 55·48 2·68 23·12 1·58 4·16 0·64 21·91 1·26 1·07 0·61 2·79 0·25 2·43 0·16 794 40·04 1·72 21·16 1·01 2·09 0·41 12·33 0·81 1·97 0·39 1·60 0·16 0·89 0·10
France
South coast 620 38·42 1·95 15·86 1·15 2·29 0·46 12·55 0·91 4·59 0·45 1·98 0·18 1·15 0·12
South 1425 40·78 1·28 18·56 0·76 1·99 0·31 11·40 0·60 5·80 0·29 1·98 0·12 1·04 0·08
North-east 2059 38·11 1·07 17·60 0·63 2·36 0·26 9·77 0·50 5·58 0·24 1·80 0·10 1·01 0·06
North-west 631 32·37 1·93 15·39 1·14 1·57 0·46 7·28 0·90 5·91 0·44 1·39 0·18 0·82 0·11
Germany
Heidelberg 1034 29·79 1·51 12·31 0·89 2·31 0·36 9·78 0·71 2·82 0·34 1·33 0·14 1·24 0·09 1087 36·02 1·48 16·29 0·87 3·31 0·35 8·66 0·70 5·33 0·34 1·29 0·14 1·14 0·09
Potsdam 1233 33·74 1·38 16·86 0·81 2·54 0·33 7·38 0·65 4·85 0·32 1·25 0·13 0·87 0·08 1061 40·80 1·49 20·61 0·88 3·41 0·36 9·02 0·70 5·06 0·34 1·61 0·14 1·08 0·09
The Netherlands
Bilthoven 1024 19·83 1·53 9·24 0·90 2·53 0·36 4·37 0·72 2·25 0·35 0·74 0·14 0·69 0·09 1086 23·27 1·49 12·37 0·88 3·32 0·36 3·86 0·70 2·35 0·34 0·69 0·14 0·68 0·09
Utrecht 1870 24·59 1·13 12·03 0·66 2·63 0·27 4·70 0·53 3·54 0·26 0·94 0·10 0·74 0·07
UK
General population 403 21·79 2·42 7·83 1·42 1·81 0·58 6·33 1·13 2·15 0·55 2·83 0·22 0·85 0·14 571 24·07 2·03 8·31 1·19 1·39 0·48 7·67 0·95 2·76 0·46 3·18 0·19 0·75 0·12
Health-conscious 113 27·82 4·56 14·60 2·68 2·41 1·09 5·01 2·14 4·20 1·04 0·83 0·42 0·76 0·27 196 30·78 3·46 13·68 2·04 2·26 0·82 8·42 1·62 2·70 0·79 2·82 0·32 0·89 0·21
Denmark
Copenhagen 1356 31·60 1·32 10·16 0·77 3·35 0·31 13·28 0·62 1·29 0·30 1·68 0·12 1·82 0·08 1484 26·97 1·26 10·20 0·74 2·56 0·30 10·00 0·59 1·58 0·29 1·30 0·12 1·33 0·08
Aarhus 567 28·02 2·04 11·67 1·20 2·18 0·48 9·83 0·95 1·62 0·46 1·33 0·19 1·40 0·12 510 26·23 2·15 12·38 1·26 1·80 0·51 8·52 1·01 1·30 0·49 1·10 0·20 1·12 0·13
Sweden
Malmo 1421 20·22 1·32 6·39 0·77 4·00 0·31 5·92 0·62 1·60 0·30 0·94 0·12 1·37 0·08 1711 20·13 1·19 6·51 0·70 3·52 0·28 6·23 0·56 1·73 0·27 0·93 0·11 1·22 0·07
Umea 1344 21·24 1·32 7·27 0·78 5·41 0·32 4·72 0·62 1·34 0·30 0·92 0·12 1·58 0·08 1574 22·26 1·22 8·55 0·72 5·77 0·29 4·40 0·57 1·37 0·28 0·82 0·11 1·36 0·07
Norway
South and east 1004 27·81 1·55 9·46 0·91 4·16 0·37 9·20 0·72 2·22 0·35 1·25 0·14 1·53 0·09
North and west 793 25·31 1·74 9·32 1·02 3·98 0·41 7·78 0·81 2·00 0·40 0·98 0·16 1·25 0·10
* Adjusted for age and weighted by season and day of recall.
Anth
ocy
anid
inin
take
and
food
source
s1093
British Journal of Nutrition

control for different distributions of 24-HDR interviews across
seasons and days of the week. All analyses were conducted
using SPSS Statistics software (version 17.0; SPSS Inc., Chicago,
IL, USA).
Results
The mean intakes and for single and total anthocyanidins stra-
tified by centre and sex, adjusted for age, and weighted by
season and day of the week are shown in Table 1. For men,
the total anthocyanidin intake ranged from 19·83 mg/d (Biltho-
ven, The Netherlands) to 64·88 mg/d (Turin, Italy), whereas
for women the range was from 18·73 mg/d (Granada, Spain)
to 44·08 mg/d (Turin, Italy). The main anthocyanidin contribu-
tors (Table 2) were malvidin (42·7 % in men and 29·4 % in
women) and cyanidin (38·0 % in men and 49·9 % in women)
in the southern region, cyanidin (45·6 % in men and 46·8 %
in women) in the central region, and cyanidin (34·0 % in
men and 36·8 % in women) and malvidin (33·0 % in men
and 30·5 % in women) in the northern European region.
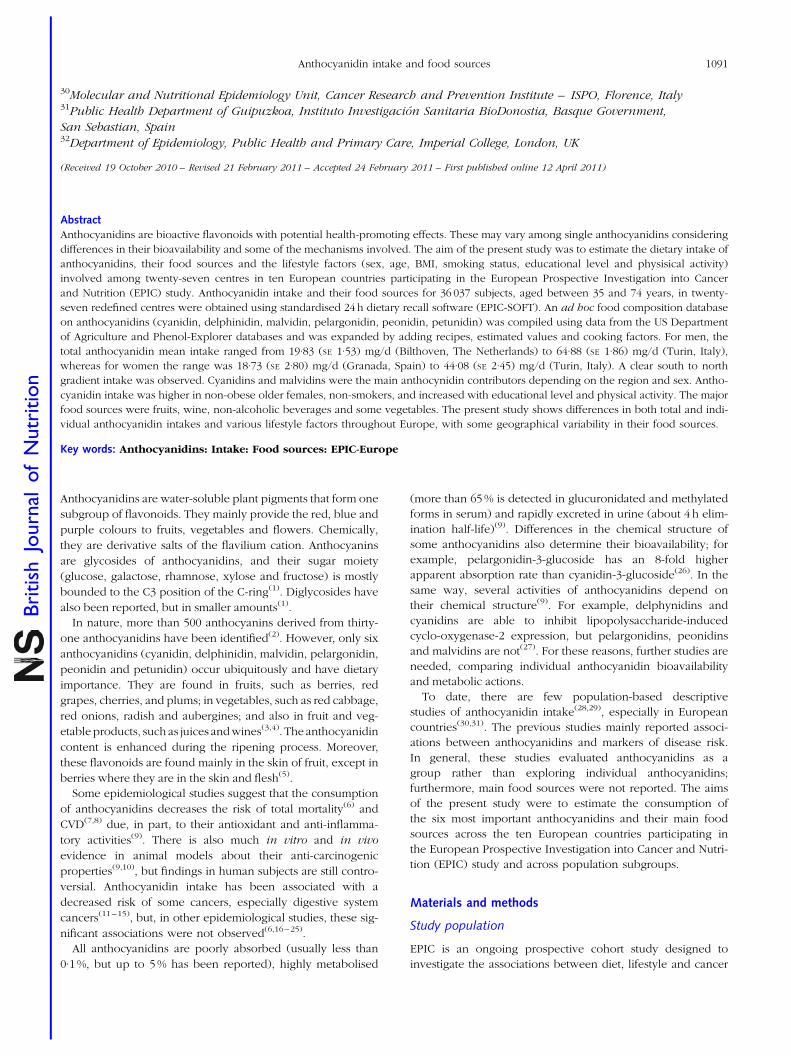
Table 3 shows the assessment of the effect of certain life-
style factors on anthocyanidin intake adjusted for sex, age,
BMI and energy intake (where appropriate) and weighted
by season and day of the week. In south European countries,
men consumed more anthocyanidins than women of these
countries, whereas in north European countries, they con-
sumed similar amounts, and in central European countries
women ingested greater quantities than men. The difference
in intake between the sexes in south European countries
was due to malvidin intake which in men was two-fold
that of women. A geographical gradient of increasing total
anthocyanidin, cyanidin, malvidin and peonidin intakes from
north to south Europe was observed. However, there was
an inverse regional gradient for delphynidin intake. Older
individuals consumed more anthocyanidins, with a maximum
intake in those aged 55–64 years. There were positive
trends when assessing total anthocyanidin intakes and
educational level, smoking status (comparing current v.
never or former smokers), BMI (obese v. normal or
overweight) and physical activity.
The main food sources of anthocyanidin intake by Euro-
pean region were also studied (Table 4). The group of fruits,
nuts and seeds (mainly non-citrus fruit such as grapes,
apples and pears) contributed most of the total anthocyanidin
intake. In south, central and north European countries this
food group contributed 61·2, 52·9 and 38·1 %, respectively.
Other major food sources were wine (contributions ranged
from 14·4 to 24·5 %), followed by non-alcoholic beverages,
such as carbonated, soft and isotonic drinks in northern Euro-
pean countries (15·8 %) and fruit and vegetable juices in cen-
tral European countries (13·4 %), and some types of vegetables
(ranging from 4·8 to 9·7 %). The major food sources of cyani-
dins were fruits and non-alcoholic beverages derived from
either fruits and vegetables or carbonated, soft and isotonic
drinks. For delphynidins, the main contributors in southern
countries were wine, bananas, grapes and fruiting vegetables,
mainly aubergine. However, in central and northern countries
the richest sources were banana, non-alcoholic beverages,
berries and wine. Malvidins were almost exclusively derived
from grape and wine products. The main contributors to
pelargonidins were berries, followed by root vegetables and
dairy products with berries as ingredients. We identified
fruits, wine and non-alcoholic beverages (only in the north
and central European countries) as the most abundant sources
of peonidins and petunidins.
Discussion
To our knowledge, this is the first study to estimate the intake
of anthocyanidins and their main food sources in a large adult
European cohort, evaluating differences across ten European
countries and the most important determinant factors. The
use of a unique FCDB on anthocyanidins and the same
methodology in the dietary assessment for the whole cohort
provided more comparable results across the countries. The
FCDB was compiled at the end of 2009 using the most
updated and available worldwide databases(3,39) on flavonoids
and polyphenols. Furthermore, our database was expanded
with recipes, estimations by food or food group and the appli-
cation of cooking factors(40). However, the use of different
FCDB and different food surveys limits the comparisons
between studies.
In men, there were great differences in anthocyanidin
intakes across EPIC centres, ranging from 19·83 mg/d in
Bilthoven to 64·88 mg/d in Turin. Indeed, the south European
region had the highest consumption of total anthocyanidins,
and the two main individual anthocyanidins (cyanidins and
malvidins). Moreover, regional trends of increasing anthocya-
nidin, cyanidin, malvidin and peonidin intakes from northern
to southern countries were also observed. Meanwhile, women
from central and southern regions were the highest anthocya-
nidin consumers. Individuals aged 55–64 years, who had a
university degree, non-smokers (former or never smokers),
those doing moderate or active physical activity and those
that were overweight (BMI 25 to , 30 kg/m2) had the highest
anthocyanidin consumption. Part of these differences was due
to the differences in the consumption pattern of the major
food sources in the European countries. For example, in
Table 2. Percentage contribution* of intakes of individualanthocyanidins in the European Prospective Investigation intoCancer and Nutrition (EPIC) cohort by European region and sex
Region
Anthocyanidin Sex South Central North
Cyanidin Men 38·0 45·6 34·0Women 49·9 46·8 36·8
Delphinidin Men 6·4 8·7 16·2Women 4·9 8·2 15·9
Malvidin Men 42·7 25·6 33·0Women 29·4 23·8 30·5
Pelargonidin Men 3·3 12·0 5·7Women 8·9 13·7 7·0
Peonidin Men 5·4 4·7 4·8Women 4·6 4·7 4·3
Petunidin Men 4·2 3·3 6·3Women 2·3 2·8 5·4
* Adjusted for age and weighted by season and day of recall.
R. Zamora-Ros et al.1094
British
Journal
ofNutrition
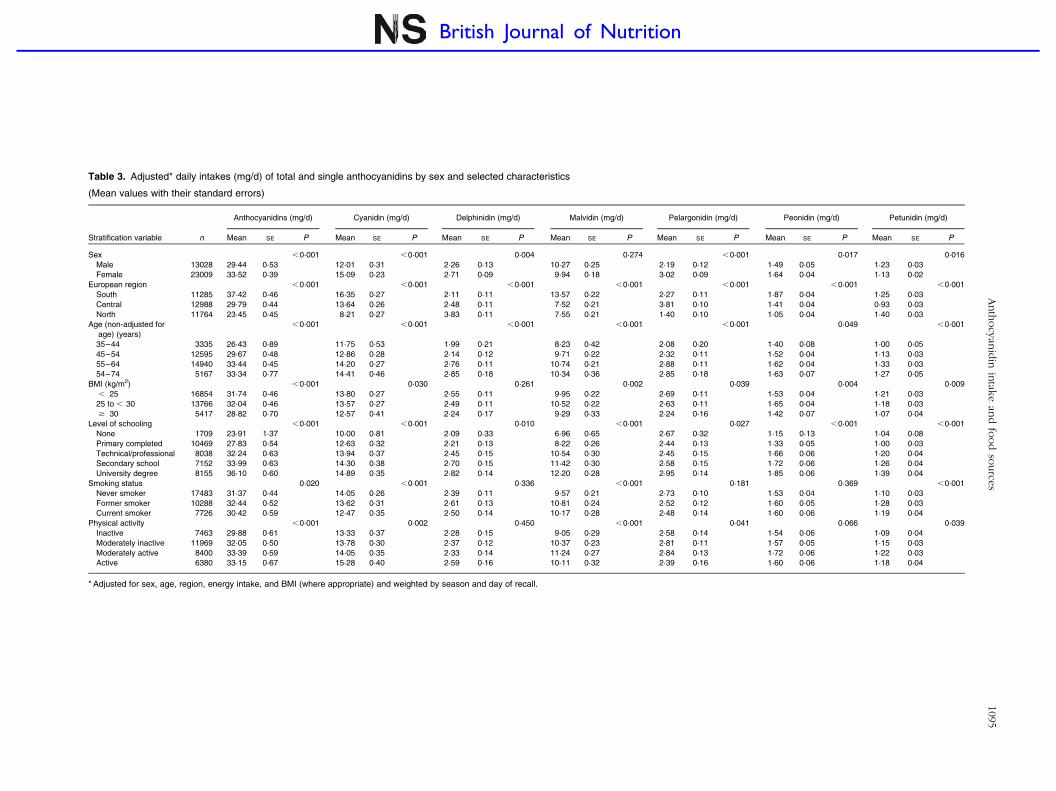
Table 3. Adjusted* daily intakes (mg/d) of total and single anthocyanidins by sex and selected characteristics
(Mean values with their standard errors)
Anthocyanidins (mg/d) Cyanidin (mg/d) Delphinidin (mg/d) Malvidin (mg/d) Pelargonidin (mg/d) Peonidin (mg/d) Petunidin (mg/d)
Stratification variable n Mean SE P Mean SE P Mean SE P Mean SE P Mean SE P Mean SE P Mean SE P
Sex ,0·001 ,0·001 0·004 0·274 ,0·001 0·017 0·016
Male 13028 29·44 0·53 12·01 0·31 2·26 0·13 10·27 0·25 2·19 0·12 1·49 0·05 1·23 0·03
Female 23009 33·52 0·39 15·09 0·23 2·71 0·09 9·94 0·18 3·02 0·09 1·64 0·04 1·13 0·02
European region ,0·001 ,0·001 ,0·001 ,0·001 ,0·001 ,0·001 ,0·001
South 11285 37·42 0·46 16·35 0·27 2·11 0·11 13·57 0·22 2·27 0·11 1·87 0·04 1·25 0·03
Central 12988 29·79 0·44 13·64 0·26 2·48 0·11 7·52 0·21 3·81 0·10 1·41 0·04 0·93 0·03
North 11764 23·45 0·45 8·21 0·27 3·83 0·11 7·55 0·21 1·40 0·10 1·05 0·04 1·40 0·03
Age (non-adjusted for
age) (years)
,0·001 ,0·001 ,0·001 ,0·001 ,0·001 0·049 ,0·001
35–44 3335 26·43 0·89 11·75 0·53 1·99 0·21 8·23 0·42 2·08 0·20 1·40 0·08 1·00 0·05
45–54 12595 29·67 0·48 12·86 0·28 2·14 0·12 9·71 0·22 2·32 0·11 1·52 0·04 1·13 0·03
55–64 14940 33·44 0·45 14·20 0·27 2·76 0·11 10·74 0·21 2·88 0·11 1·62 0·04 1·33 0·03
54–74 5167 33·34 0·77 14·41 0·46 2·85 0·18 10·34 0·36 2·85 0·18 1·63 0·07 1·27 0·05
BMI (kg/m2) ,0·001 0·030 0·261 0·002 0·039 0·004 0·009
, 25 16854 31·74 0·46 13·80 0·27 2·55 0·11 9·95 0·22 2·69 0·11 1·53 0·04 1·21 0·03
25 to , 30 13766 32·04 0·46 13·57 0·27 2·49 0·11 10·52 0·22 2·63 0·11 1·65 0·04 1·18 0·03
$ 30 5417 28·82 0·70 12·57 0·41 2·24 0·17 9·29 0·33 2·24 0·16 1·42 0·07 1·07 0·04
Level of schooling ,0·001 ,0·001 0·010 ,0·001 0·027 ,0·001 ,0·001
None 1709 23·91 1·37 10·00 0·81 2·09 0·33 6·96 0·65 2·67 0·32 1·15 0·13 1·04 0·08
Primary completed 10469 27·83 0·54 12·63 0·32 2·21 0·13 8·22 0·26 2·44 0·13 1·33 0·05 1·00 0·03
Technical/professional 8038 32·24 0·63 13·94 0·37 2·45 0·15 10·54 0·30 2·45 0·15 1·66 0·06 1·20 0·04
Secondary school 7152 33·99 0·63 14·30 0·38 2·70 0·15 11·42 0·30 2·58 0·15 1·72 0·06 1·26 0·04
University degree 8155 36·10 0·60 14·89 0·35 2·82 0·14 12·20 0·28 2·95 0·14 1·85 0·06 1·39 0·04
Smoking status 0·020 ,0·001 0·336 ,0·001 0·181 0·369 ,0·001
Never smoker 17483 31·37 0·44 14·05 0·26 2·39 0·11 9·57 0·21 2·73 0·10 1·53 0·04 1·10 0·03
Former smoker 10288 32·44 0·52 13·62 0·31 2·61 0·13 10·81 0·24 2·52 0·12 1·60 0·05 1·28 0·03
Current smoker 7726 30·42 0·59 12·47 0·35 2·50 0·14 10·17 0·28 2·48 0·14 1·60 0·06 1·19 0·04
Physical activity ,0·001 0·002 0·450 ,0·001 0·041 0·066 0·039
Inactive 7463 29·88 0·61 13·33 0·37 2·28 0·15 9·05 0·29 2·58 0·14 1·54 0·06 1·09 0·04
Moderately inactive 11969 32·05 0·50 13·78 0·30 2·37 0·12 10·37 0·23 2·81 0·11 1·57 0·05 1·15 0·03
Moderately active 8400 33·39 0·59 14·05 0·35 2·33 0·14 11·24 0·27 2·84 0·13 1·72 0·06 1·22 0·03
Active 6380 33·15 0·67 15·28 0·40 2·59 0·16 10·11 0·32 2·39 0·16 1·60 0·06 1·18 0·04
* Adjusted for sex, age, region, energy intake, and BMI (where appropriate) and weighted by season and day of recall.
Anth
ocy
anid
inin
take
and
food
source
s1095
British Journal of Nutrition
Table 4. Percentage contribution of food groups and some main foods to the intake of total and single anthocyanidins by European region*
Anthocyanidins (%) Cyanidins (%) Delphinidins (%) Malvidins (%) Pelargonidins (%) Peonidins (%) Petunidins (%)
Food groups and foods† South Central North South Central North South Central North South Central North South Central North South Central North South Central North
Potatoes and other tubers 0·0 0·0 0·0 0·0 0·0 0·0 0·0 0·0 0·0 0·0 0·0 0·0 0·0 0·0 0·0 0·0 0·0 0·0 0·0 0·0 0·0
Vegetables 9·7 8·8 4·8 15·2 11·4 5·5 24·5 8·6 1·0 0·0 0·0 0·0 16·7 19·9 39·4 0·0 0·0 0·1 0·0 0·0 0·0
Leafy vegetables 7·1 3·8 0·4 14·3 7·8 1·0 7·0 2·5 0·1 0·0 0·0 0·0 0·0 0·0 0·1 0·0 0·0 0·0 0·0 0·0 0·0
Fruiting vegetables 0·9 0·4 0·1 0·0 0·0 0·0 16·7 4·9 0·5 0·0 0·0 0·0 0·1 0·0 0·0 0·0 0·0 0·0 0·0 0·0 0·0
Root vegetables 1·2 2·8 2·7 0·0 0·0 0·0 0·0 0·0 0·0 0·0 0·0 0·0 16·5 19·8 39·2 0·0 0·0 0·0 0·0 0·0 0·0
Cabbages 0·4 1·6 1·5 0·8 3·5 4·2 0·0 0·0 0·0 0·0 0·0 0·0 0·0 0·0 0·0 0·0 0·0 0·0 0·0 0·0 0·0
Other and mixed vegetables 0·1 0·1 0·1 0·1 0·1 0·2 0·7 1·2 0·4 0·0 0·0 0·0 0·1 0·0 0·1 0·0 0·0 0·1 0·0 0·0 0·0
Legumes 0·1 0·1 0·1 0·1 0·0 0·1 0·1 0·0 0·0 0·0 0·0 0·0 0·8 0·3 0·6 0·0 0·0 0·0 0·2 0·1 0·0
Fruits, nuts and seeds 61·2 52·9 38·1 76·6 56·8 55·5 25·9 33·8 20·2 46·5 47·6 32·5 73·9 66·3 38·4 54·9 44·6 27·7 25·8 33·1 17·5
Citrus fruits 0·0 0·0 0·0 0·0 0·0 0·0 0·0 0·0 0·0 0·0 0·0 0·0 0·0 0·0 0·0 0·0 0·0 0·0 0·0 0·0 0·0
Apples and pears 14·2 10·0 12·7 30·1 21·3 34·9 0·3 0·1 0·0 0·0 0·0 0·0 0·2 0·1 0·1 0·1 0·3 0·4 0·0 0·0 0·0
Grapes 18·9 13·0 10·6 0·9 0·7 0·7 20·8 9·4 3·7 46·3 44·5 28·0 0·1 0·0 0·1 30·3 21·7 18·5 25·1 18·5 7·7
Stone fruits 14·8 10·0 2·8 29·6 20·0 7·6 0·0 0·0 0·0 0·0 0·0 0·0 1·5 0·6 0·1 16·3 14·1 0·8 0·0 0·0 0·0
Berries 6·3 16·5 10·1 2·6 9·6 8·3 2·2 22·5 15·8 0·1 2·9 4·2 68·1 61·5 34·5 0·4 7·1 6·1 0·6 14·4 9·7
Other and mixed fruits 2·5 2·3 1·1 3·5 3·2 1·4 2·6 1·7 0·5 0·0 0·0 0·0 4·0 4·1 3·7 7·8 1·5 1·8 0·1 0·2 0·1
Olives 4·5 0·8 0·9 9·6 1·7 2·5 0·0 0·0 0·0 0·0 0·0 0·0 0·0 0·0 0·0 0·0 0·0 0·0 0·0 0·0 0·0
Nuts and seeds 0·2 0·1 0·1 0·3 0·3 0·2 0·0 0·1 0·0 0·0 0·0 0·0 0·0 0·0 0·0 0·0 0·0 0·0 0·0 0·0 0·0
Dairy products 0·5 1·5 0·8 0·1 0·2 0·2 0·1 0·3 0·0 0·0 0·0 0·0 6·5 9·3 10·8 0·0 0·0 0·0 0·0 0·1 0·0
Cereal, cakes and confectionery 1·0 6·5 4·5 1·4 7·4 6·4 1·3 19·7 3·8 0·2 2·4 2·0 1·9 2·8 3·4 1·3 5·1 7·7 0·9 9·0 6·4
Meat, fish and eggs 0·0 0·0 0·0 0·0 0·0 0·0 0·0 0·0 0·0 0·0 0·0 0·0 0·0 0·0 0·0 0·0 0·0 0·0 0·0 0·0 0·0
Non-alcoholic beverages 1·7 13·6 19·7 3·1 21·7 26·5 0·1 16·7 49·0 0·7 3·3 0·3 0·0 0·8 5·5 0·9 21·9 7·4 0·4 7·9 19·7
Fruit and vegetable juices 1·7 13·4 3·9 3·0 21·5 8·6 0·1 16·4 3·3 0·7 3·2 0·2 0·0 0·8 0·8 0·9 21·7 2·0 0·4 7·7 1·4
Carbonated, soft, and
isotonic drinks
0·0 0·2 15·8 0·1 0·2 17·9 0·0 0·3 45·8 0·0 0·1 0·1 0·0 0·0 4·7 0·0 0·2 5·4 0·0 0·2 18·3
Coffee, tea and herbal teas 0·0 0·0 0·0 0·0 0·0 0·0 0·0 0·0 0·0 0·0 0·0 0·0 0·0 0·0 0·0 0·0 0·0 0·0 0·0 0·0 0·0
Alcoholic beverages 25·5 15·9 25·4 3·4 2·3 4·0 47·6 19·5 15·3 52·2 45·2 55·6 0·0 0·1 0·0 42·6 27·3 46·6 72·1 47·2 39·2
Wine 24·5 14·4 24·5 2·0 1·2 2·6 45·9 17·9 15·0 51·8 42·3 55·7 0·0 0·0 0·0 42·0 25·5 45·7 70·5 44·1 38·5
Beer, cider 0·6 0·3 0·4 1·2 0·7 1·2 0·0 0·0 0·0 0·0 0·0 0·0 0·0 0·0 0·0 0·0 0·1 0·0 0·0 0·0 0·0
Liqueurs and spirits 0·4 1·2 0·5 0·2 0·4 0·2 1·7 1·6 0·3 0·5 2·9 1·0 0·0 0·1 0·0 0·6 1·8 0·8 1·6 3·1 0·7
Soups, bouillons 0·0 0·3 5·9 0·0 0·1 1·7 0·0 0·9 10·3 0·0 0·4 7·3 0·0 0·0 0·0 0·0 0·4 9·5 0·0 1·3 16·4
Miscellaneous 0·3 0·5 0·7 0·2 0·1 0·2 0·4 0·5 0·4 0·4 1·0 1·2 0·2 0·6 1·8 0·3 0·6 1·1 0·5 1·1 0·8
* Values are percentages derived from models adjusted for age and sex and weighted by season and day of recall. There were differences between European regions for all food sources (P,0·001), except for food sources whereanthocyanidin contributions are less than 0·2 % for all regions (NS differences).
† Leafy vegetables include red leaf lettuce, red chicory, radicchio and trevise (red Treviso lettuce); fruiting vegetables include aubergines; root vegetables include beetroot, red radish and black radish; cabbages include red cabbageand Chinese cabbage; stone fruits include plums, peaches, nectarines, apricots, mangoes and paraguayos; other and mixed fruits include cherries, red fruit not specified, sour cherries, persimmon, sharon fruit and pomegranate;cereal, cakes and confectionery include fruit cakes, biscuits with jam and plum cake; fruit and vegetable juices include blackcurrant juice, cranberry juice, redcurrant juice, cherry juice, peach juice, apricot juice, plum juice andbeetroot juice; carbonated, soft and isotonic drinks include blackcurrant syrups, syrups of fruits and berries, cherry coke, pommac and jaffa; soups and bouillons include bilberry soup, berry soup and elderberry soup.
R.Zam
ora-R
os
eta
l.1096
British Journal of Nutrition

southern countries, a high intake of wine(46), non-citrus fruits
(especially grapes, stone fruits, apples and pears, and olives)
and leafy vegetables(47) was observed. However, in central
and northern countries the main contributors were non-
citrus fruits (mainly berries, apples and pears, and grapes),
wine and, finally, non-alcoholic beverages (juices and soft
drinks of anthocyanidin-rich fruits). The large differences in
anthocyanidin intakes between men (45·47 mg/d) and
women (31·73 mg/d) in the southern region (Italy, Spain,
Greece) were due to the high consumption of red wine,
which is very rich in malvidins, as observed in a previous
Spanish cohort(30). The present results are comparable with
previously published data of intakes in the southern European
region; median intakes of 9·3 to 28·0 mg/d have been
reported(7,12–15,17,18,21,24,25,48–50) although a Greek cohort
was found to consume 52·6 mg/d(22). Two previous studies
in northern countries (Finland) also reported great differences
in mean intakes; 5·9 mg/d in the Kuopio Ischaemic Heart Dis-
ease Risk Factor Study(23) and 47 mg/d in the FINDIET 2002
Study(31). In non-European countries, lower intakes have
been observed than in European countries. For example, in
the USA mean intakes were found to range from less than 1
to 10·1 mg/d(6,11,16,19,20,29), while in Australia 2·9 mg/d(28),
and in Japan 11·3 mg/d(51) were reported.
Cyanidins were the most prevalent anthocyanidins
(34–50 %) except in men from the southern European region.
Cyanidin intake ranged from 8·2 to 16·4 mg/d; these values
are slightly higher than our previous results in Spain
(6·2 mg/d)(30) and in Greece (4 mg/d)(50), lower than Finland
(25 mg/d)(31) and much higher than in Australia (0·42 mg/
d)(28). In Finland the main contributors were berries and
their derived products (88 %)(31), whereas in the present
study berries and berry products (juices, soft drinks and
soups) represented approximately 6, 31 and 37 % in southern,
central and northern countries, respectively. In the present
study, leafy vegetables, apples and pears, and stone fruits
were also major food sources of cyanidins. Malvidin was the
main anthocyanidin in men from the southern European
region, which is in line with findings from our previous
study in Spain(30) and in Australia(28). In the entire cohort
and in the literature the main contributors were red wine
and red grapes. Delphynidin was usually the third most
abundant anthocyanidin (5·6 and 16·0 % in southern and
northern countries, respectively). Moreover, a geographical
trend was observed, with increasing intakes from south
(0·8 mg/d women in Navarra, Spain) to north (5·8 mg/d
women in Umea, Sweden), as has previously been observed
in Spain (2·5 mg/d)(30) and Finland (14 mg/d)(31). Pelargoni-
dins (3·3–13·7 %), peonidins (4·3–5·4 %) and petunidins
(2·3–6·3 %) were the least abundant anthocyanidins, similar
to findings reported in previous papers(28,30,31).
Anthocyanidins have been shown to have protective effects
in clinical and epidemiological studies, especially against
some chronic diseases. In a US breast cancer case–control
study, a reduction of all mortality at 6 years of follow-up
after a high intake of anthocyanidins and other flavonoids(6)
was reported. Concerning CVD, an Italian case–control
study observed a significant inverse trend between acute
myocardial infarction and anthocyanidin intake, and an OR
of 0·45 (95 % CI 0·26, 0·78) when comparing extreme quin-
tiles(7). However, in two Greek case–control studies no associ-
ations were found between anthocyanidin consumption and
peripheral arterial occlusive disease(48) or CHD(49). Indeed,
in a recent meta-analysis, Hooper et al. concluded that there
were insufficient data from clinical trials to confirm the ben-
eficial effects on CVD(52). Several epidemiological studies
have suggested contradicting results regarding cancer. How-
ever, these differences can be explained, in part, by low
anthocyanidin bioavailability (less than 5 %)(9) and the wide
range of anthocyanidin intakes among studies. Overall, all
cancers studied not related to the digestive system (breast,
ovarian, prostate, lung, pancreatic, liver, renal cancers, and
diffuse and follicular b-cell lymphomas) have not been signifi-
cantly associated with anthocyanidin intake(6,17–20,22–25,53).
Concerning cancers of the digestive system, when the
mean consumption of anthocyanidins is low (, 20 mg/d),
non-significant associations have been reported for upper
aero-digestive and colorectal cancer, colorectal and oesopha-
geal squamous cell cancer in the Iowa Women’s Health
Study(19), the Kuopio Ischaemic Heart Disease Risk Factor
Study(23) and a US case–control study(11), respectively. How-
ever, when their mean intake is high (southern European
countries), a protective effect against colorectal, oral cavity,
pharyngeal and laryngeal oesophageal cancers comparing
extreme quintiles has been observed, although the trend
analysis has usually not been significant(12–15). Gastric
cancer has only been studied in a Greek case–control
study, in which no statistical association with anthocyanidin
intake was shown, even though the mean intake was
slightly high (20·4 mg/d)(21). More recently, anthocyanidins
have been shown to reach some brain regions after con-
sumption of blueberries in rats(54); therefore they are able
to cross the haemato–encephalic barrier. This finding
suggests the potential role of anthocyanidins as anti-inflam-
matory and antioxidant agents against the deleterious effects
of ageing and its related neurodegenerative diseases(55) and
in improving memory function in older adults(56). Further
basic and epidemiological investigation is needed to confirm
these potential effects against cancer and cardiovascular and
neurodegenerative diseases, but taking into account possible
differences among individual anthocyanidins.
To our knowledge, this is a unique study and the largest to
date describing anthocyanidin intake across several European
countries. However, as not all the EPIC cohorts are represen-
tative of the population, the observed level of intake cannot
be extrapolated to the general population of each region.
Another limitation of the present study is an underestimation
of the real anthocyanidin intake, because there are some
food items with missing composition data. However, our data-
base was compiled from the most updated flavonoid data-
bases, with only 10 % of missing values. Indeed, the major
strength of the present study is the use of a unique and specifi-
cally developed FCDB, for that allowed results to be
compared across countries. Further underestimation may be
due to the omission of dietetic supplements in this analysis.
However, there are few consumers of herb or plant
Anthocyanidin intake and food sources 1097
British
Journal
ofNutrition

supplements in the present study (up to 5 % in Denmark, the
highest consumer country)(57).
The present study generated data for total and individual
anthocyanidin intakes among twenty-seven centres in ten
European countries, according to sex, age and some lifestyle
factors. Main food sources and differences among European
regions were also identified. These descriptive data will be
valuable for future aetiological research focused on the
relationships between anthocyanidins and chronic diseases.
Acknowledgements
The present study was carried out with the financial support of
the European Commission: Public Health and Consumer Pro-
tection Directorate 1993 to 2004; Research Directorate-General
2005; Ligue contre le Cancer; Institut Gustave Roussy;
Mutuelle Generale de l’Education Nationale; Institut National
de la Sante et de la Recherche Medicale (INSERM) (France);
German Cancer Aid; German Cancer Research Centre;
German Federal Ministry of Education and Research; Danish
Cancer Society; Health Research Fund (FIS) of the Spanish
Ministry of Health (RTICC, DR06/0020); the participating
regional governments and institutions of Spain; Cancer
Research UK; Medical Research Council, UK; the Stroke
Association, UK; British Heart Foundation; Department of
Health, UK; Food Standards Agency, UK; the Wellcome
Trust, UK; Hellenic Ministry of Health; the Stavros Niarchos
Foundation; the Hellenic Health Foundation; Italian Associ-
ation for Research on Cancer; Compagnia San Paolo, Italy;
Dutch Ministry of Public Health, Welfare and Sports; Dutch
Ministry of Health; Dutch Prevention Funds; LK Research
Funds; Dutch ZON (Zorg Onderzoek Nederland); World
Cancer Research Fund (WCRF); Swedish Cancer Society;
Swedish Scientific Council; Regional Government of Skane,
Sweden; Nordforsk – Centre of Excellence Programme.
Some authors are partners of ECNIS (Environmental Cancer
Risk, Nutrition and Individual Susceptibility), a network of
excellence of the 6FP of the European Community. R. Z. R.
is thankful for a postdoctoral programme funded by the
Fondo de Investigacion Sanitaria (FIS; no. CD09/00133) from
the Spanish Ministry of Science and Innovation. We thank
Raul M. Garcıa for developing an application to link the
FCDB and the 24-HDR.
R. Z.-R. and C. A. G. designed the research; R. Z.-R. and V. K.
conducted the research; R. Z.-R. and L. L.-B. performed the
statistical analysis; R. Z.-R. wrote the manuscript; all authors
critically reviewed and approved the final manuscript.
The authors are not aware of any conflict of interest.
References
1. Clifford MN (2000) Anthocyanins – nature, occurrence anddietary burden. J Sci Food Agric 80, 1126–1137.
2. Anderson OM & Jordheim M (2006) The anthocyanins. InFlavonoids: Chemistry, Biochemistry and Applications,pp. 472–551 [OM Anderson and KR Markham, editors].Boca Raton, FL: CRC Press/Taylor & Francis Group.
3. US Departament of Agriculture (2007) USDA Database forthe Flavonoid Content of Selected Foods, Release 2.1 ed.Beltsville, MD: USDA.
4. Perez-Jimenez J, Neveu V, Vos F, et al. (2010) Systematicanalysis of the content of 502 polyphenols in 452 foodsand beverages: an application of the Phenol-Explorer data-base. J Agric Food Chem 58, 4959–4969.
5. Manach C, Scalbert A, Morand C, et al. (2004) Polyphenols:food sources and bioavailability. Am J Clin Nutr 79, 727–747.
6. Fink BN, Steck SE, Wolff MS, et al. (2007) Dietary flavonoidintake and breast cancer survival among women on LongIsland. Cancer Epidemiol Biomarkers Prev 16, 2285–2292.
7. Tavani A, Spertini L, Bosetti C, et al. (2006) Intake of specificflavonoids and risk of acute myocardial infarction in Italy.Public Health Nutr 9, 369–374.
8. Mink PJ, Scrafford CG, Barraj LM, et al. (2007) Flavonoidintake and cardiovascular disease mortality: a prospectivestudy in postmenopausal women. Am J Clin Nutr 85,895–909.
9. Prior RL & Wu X (2006) Anthocyanins: structural character-istics that result in unique metabolic patterns and biologicalactivities. Free Radic Res 40, 1014–1028.
10. Wang LS & Stoner GD (2008) Anthocyanins and their role incancer prevention. Cancer Lett 269, 281–290.
11. Bobe G, Peterson JJ, Gridley G, et al. (2009) Flavonoid con-sumption and esophageal cancer among black and whitemen in the United States. Int J Cancer 125, 1147–1154.
12. Rossi M, Garavello W, Talamini R, et al. (2007) Flavonoidsand the risk of oral and pharyngeal cancer: a case–controlstudy from Italy. Cancer Epidemiol Biomarkers Prev 16,1621–1625.
13. Garavello W, Rossi M, McLaughlin JK, et al. (2007) Flavo-noids and laryngeal cancer risk in Italy. Ann Oncol 18,1104–1109.
14. Rossi M, Garavello W, Talamini R, et al. (2007) Flavonoidsand risk of squamous cell esophageal cancer. Int J Cancer120, 1560–1564.
15. Rossi M, Negri E, Talamini R, et al. (2006) Flavonoids andcolorectal cancer in Italy. Cancer Epidemiol BiomarkersPrev 15, 1555–1558.
16. Bobe G, Sansbury LB, Albert PS, et al. (2008) Dietary flavo-noids and colorectal adenoma recurrence in the PolypPrevention Trial. Cancer Epidemiol Biomarkers Prev 17,1344–1353.
17. Bosetti C, Spertini L, Parpinel M, et al. (2005) Flavonoids andbreast cancer risk in Italy. Cancer Epidemiol Biomarkers Prev14, 805–808.
18. Bosetti C, Rossi M, McLaughlin JK, et al. (2007) Flavonoidsand the risk of renal cell carcinoma. Cancer Epidemiol Bio-markers Prev 16, 98–101.
19. Cutler GJ, Nettleton JA, Ross JA, et al. (2008) Dietary flavo-noid intake and risk of cancer in postmenopausal women:the Iowa Women’s Health Study. Int J Cancer 123, 664–671.
20. Fink BN, Steck SE, Wolff MS, et al. (2007) Dietary flavonoidintake and breast cancer risk among women on Long Island.Am J Epidemiol 165, 514–523.
21. Lagiou P, Samoli E, Lagiou A, et al. (2004) Flavonoids, vita-min C and adenocarcinoma of the stomach. Cancer CausesControl 15, 67–72.
22. Lagiou P, Rossi M, Lagiou A, et al. (2008) Flavonoid intakeand liver cancer: a case–control study in Greece. CancerCauses Control 19, 813–818.
23. Mursu J, Nurmi T, Tuomainen TP, et al. (2008) Intake offlavonoids and risk of cancer in Finnish men: The KuopioIschaemic Heart Disease Risk Factor Study. Int J Cancer123, 660–663.
R. Zamora-Ros et al.1098
British
Journal
ofNutrition
24. Peterson J, Lagiou P, Samoli E, et al. (2003) Flavonoid intakeand breast cancer risk: a case–control study in Greece. Br JCancer 89, 1255–1259.
25. Rossi M, Negri E, Lagiou P, et al. (2008) Flavonoids and ovar-ian cancer risk: a case–control study in Italy. Int J Cancer123, 895–898.
26. Felgines C, Talavera S, Gonthier MP, et al. (2003) Strawberryanthocyanins are recovered in urine as glucuro- and sulfo-conjugates in humans. J Nutr 133, 1296–1301.
27. Hou DX, Yanagita T, Uto T, et al. (2005) Anthocyanidinsinhibit cyclooxygenase-2 expression in LPS-evoked macro-phages: structure–activity relationship and molecularmechanisms involved. Biochem Pharmacol 70, 417–425.
28. Johannot L & Somerset SM (2006) Age-related variations inflavonoid intake and sources in the Australian population.Public Health Nutr 9, 1045–1054.
29. Chun OK, Chung SJ & Song WO (2007) Estimated dietary fla-vonoid intake and major food sources of US adults. J Nutr137, 1244–1252.
30. Zamora-Ros R, Andres-Lacueva C, Lamuela-Raventos RM,et al. (2010) Estimation of dietary sources and flavonoidintake in a Spanish adult population (EPIC-Spain). J AmDiet Assoc 110, 390–398.
31. Ovaskainen ML, Torronen R, Koponen JM, et al. (2008) Diet-ary intake and major food sources of polyphenols in Finnishadults. J Nutr 138, 562–566.
32. Riboli E & Kaaks R (1997) The EPIC project: rationale andstudy design. European Prospective Investigation intoCancer and Nutrition. Int J Epidemiol 26, Suppl. 1, S6–S14.
33. Riboli E, Hunt KJ, Slimani N, et al. (2002) European ProspectiveInvestigation into Cancer and Nutrition (EPIC): study popu-lations and data collection. Public Health Nutr 5, 1113–1124.
34. Slimani N, Kaaks R, Ferrari P, et al. (2002) EuropeanProspective Investigation into Cancer and Nutrition (EPIC)calibration study: rationale, design and population character-istics. Public Health Nutr 5, 1125–1145.
35. Brustad M, Skeie G, Braaten T, et al. (2003) Comparison oftelephone vs face-to-face interviews in the assessment ofdietary intake by the 24 h recall EPIC SOFT program – theNorwegian calibration study. Eur J Clin Nutr 57, 107–113.
36. Slimani N, Ferrari P, Ocke M, et al. (2000) Standardization ofthe 24-hour diet recall calibration method used in the Euro-pean Prospective Investigation into Cancer and Nutrition(EPIC): general concepts and preliminary results. Eur JClin Nutr 54, 900–917.
37. Slimani N, Deharveng G, Unwin I, et al. (2007) The EPICnutrient database project (ENDB): a first attempt to standar-dize nutrient databases across the 10 European countriesparticipating in the EPIC study. Eur J Clin Nutr 61,1037–1056.
38. Haftenberger M, Schuit AJ, Tormo MJ, et al. (2002) Physicalactivity of subjects aged 50–64 years involved in the Euro-pean Prospective Investigation into Cancer and Nutrition(EPIC). Public Health Nutr 5, 1163–1176.
39. Neveu V, Perez-Jimenez J, Vos F, et al. (2010) Phenol-Explorer: an online comprehensive database on polyphenolcontents in foods. Database (Oxford) 2010, bap024.
40. Crozier A, Lean MEJ, McDonald MS, et al. (1997) Quanti-tative analysis of the flavonoid content of commercial
tomatoes, onions, lettuces, and celery. J Agric Food Chem45, 590–595.
41. Hiemori M, Koh E & Mitchell AE (2009) Influence of cookingon anthocyanins in black rice (Oryza sativa L. japonica var.SBR). J Agric Food Chem 57, 1908–1914.
42. Mulinacci N, Ieri F, Giaccherini C, et al. (2008) Effectof cooking on the anthocyanins, phenolic acids, glyco-alkaloids, and resistant starch content in two pigmentedcultivars of Solanum tuberosum L. J Agric Food Chem 56,11830–11837.
43. Steed LE, Truong VD, Simunovic J, et al. (2008) Continuousflow microwave-assisted processing and aseptic packagingof purple-fleshed sweetpotato purees. J Food Sci 73,455–462.
44. Xu B & Chang SK (2008) Total phenolics, phenolic acids, iso-flavones, and anthocyanins and antioxidant properties ofyellow and black soybeans as affected by thermal proces-sing. J Agric Food Chem 56, 7165–7175.
45. Oliveira C, Amaro LF, Pinho O, et al. (2010) Cooked blueber-ries: anthocyanin and anthocyanidin degradation andtheir radical-scavenging activity. J Agric Food Chem 58,9006–9012.
46. Sieri S, Krogh V, Saieva C, et al. (2009) Alcohol consumptionpatterns, diet and body weight in 10 European countries.Eur J Clin Nutr 63, Suppl. 4, S81–S100.
47. Agudo A, Slimani N, Ocke MC, et al. (2002) Vegetable andfruit consumption in the EPIC cohorts from 10 Europeancountries. IARC Sci Publ 156, 99–103.
48. Lagiou P, Samoli E, Lagiou A, et al. (2006) Flavonoid classesand risk of peripheral arterial occlusive disease: a case–control study in Greece. Eur J Clin Nutr 60, 214–219.
49. Lagiou P, Samoli E, Lagiou A, et al. (2004) Intake of specificflavonoid classes and coronary heart disease – a case–control study in Greece. Eur J Clin Nutr 58, 1643–1648.
50. Dilis V & Trichopoulou A (2010) Antioxidant intakes andfood sources in Greek adults. J Nutr 140, 1274–1279.
51. Melby MK, Murashima M & Watanabe S (2008) Phytochem-ical intake and relationship to past health history in Japanesewomen. Biofactors 22, 265–269.
52. Hooper L, Kroon PA, Rimm EB, et al. (2008) Flavonoids,flavonoid-rich foods, and cardiovascular risk: a meta-analysis of randomized controlled trials. Am J Clin Nutr88, 38–50.
53. Frankenfeld CL, Cerhan JR, Cozen W, et al. (2008) Dietaryflavonoid intake and non-Hodgkin lymphoma risk. Am JClin Nutr 87, 1439–1445.
54. Andres-Lacueva C, Shukitt-Hale B, Galli RL, et al. (2005)Anthocyanins in aged blueberry-fed rats are found centrallyand may enhance memory. Nutr Neurosci 8, 111–120.
55. Shukitt-Hale B, Lau FC & Joseph JA (2008) Berry fruit sup-plementation and the aging brain. J Agric Food Chem 56,636–641.
56. Krikorian R, Shidler MD, Nash TA, et al. (2010) Blueberrysupplementation improves memory in older adults. J AgricFood Chem 58, 3996–4000.
57. Skeie G, Braaten T, Hjartaker A, et al. (2009) Use of dietarysupplements in the European Prospective Investigationinto Cancer and Nutrition calibration study. Eur J Clin Nutr63, Suppl. 4, S226–S238.
Anthocyanidin intake and food sources 1099
British
Journal
ofNutrition