Embed Size (px)
Citation preview
Estimation of Production/Reserves
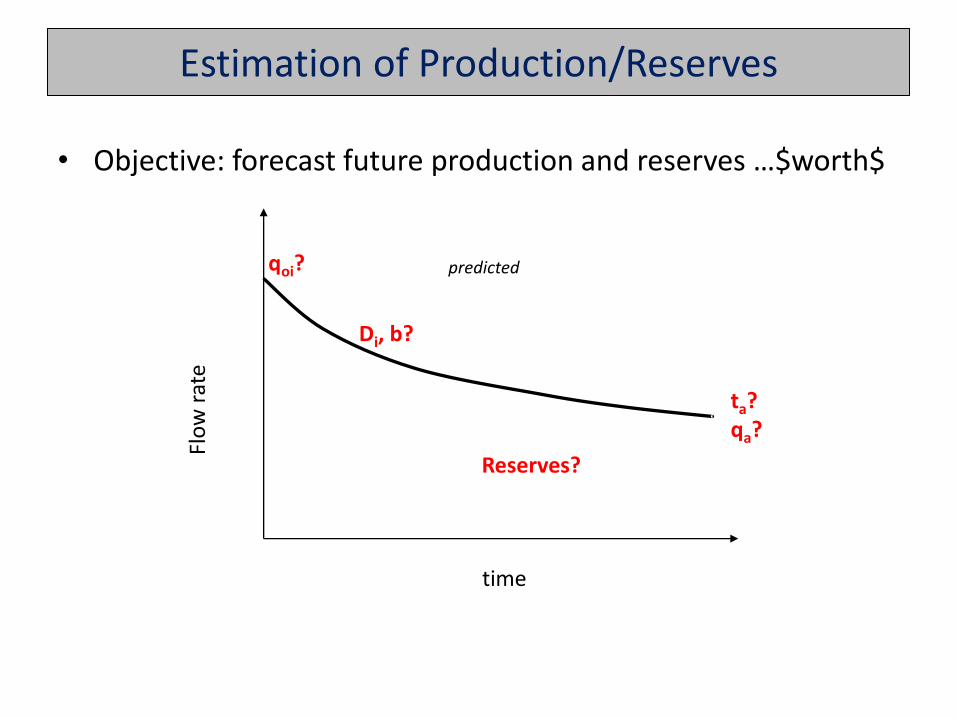
• Objective: forecast future production and reserves …$worth$
time
Flo
w r
ate
predicted qoi?
Di, b?
ta? qa?
Reserves?
Estimation of Production/Reserves
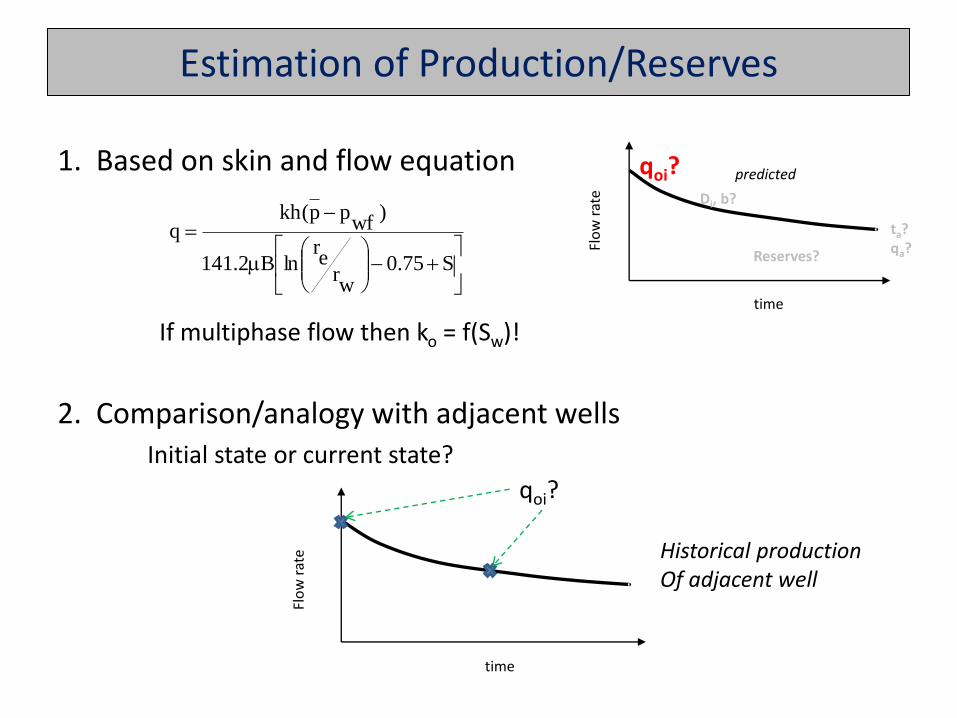
1. Based on skin and flow equation
If multiphase flow then ko = f(Sw)!
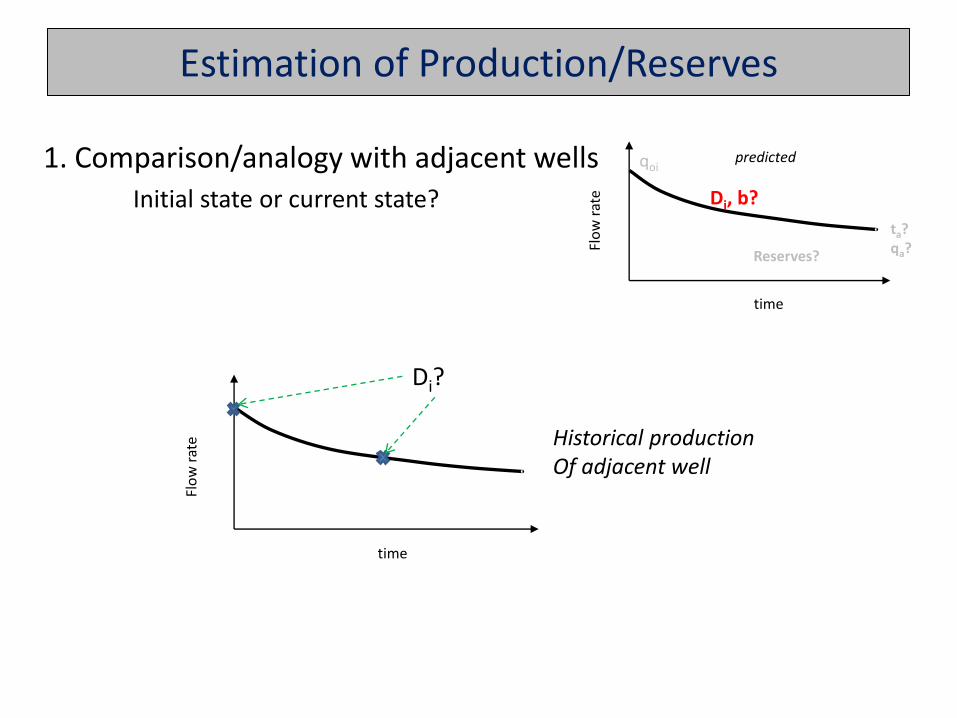
2. Comparison/analogy with adjacent wells Initial state or current state?
time
Flo
w r
ate
predicted qoi? Di, b?
ta? qa?
Reserves?
S75.0w
re
rlnB2.141
)wf
pp(khq
time
Flo
w r
ate
qoi?
Historical production Of adjacent well
Estimation of Production/Reserves
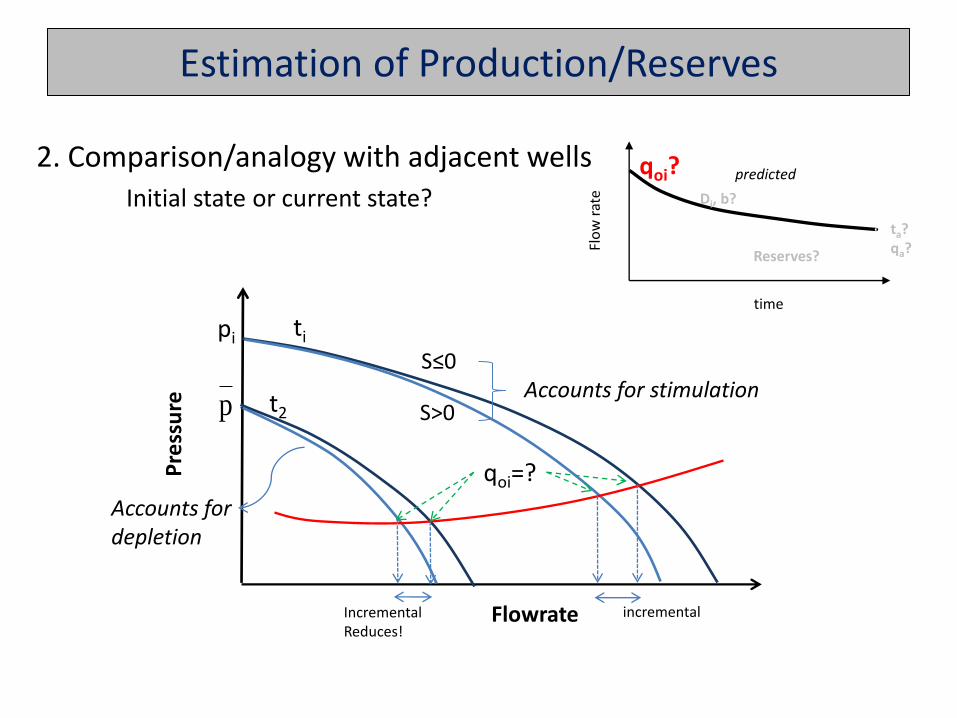
2. Comparison/analogy with adjacent wells Initial state or current state?
time
Flo
w r
ate
predicted qoi? Di, b?
ta? qa?
Reserves?
Pre
ssu
re
pi
p
S≤0
S>0 Accounts for stimulation
ti
t2
Flowrate incremental Incremental Reduces!
Accounts for depletion
qoi=?
Estimation of Production/Reserves
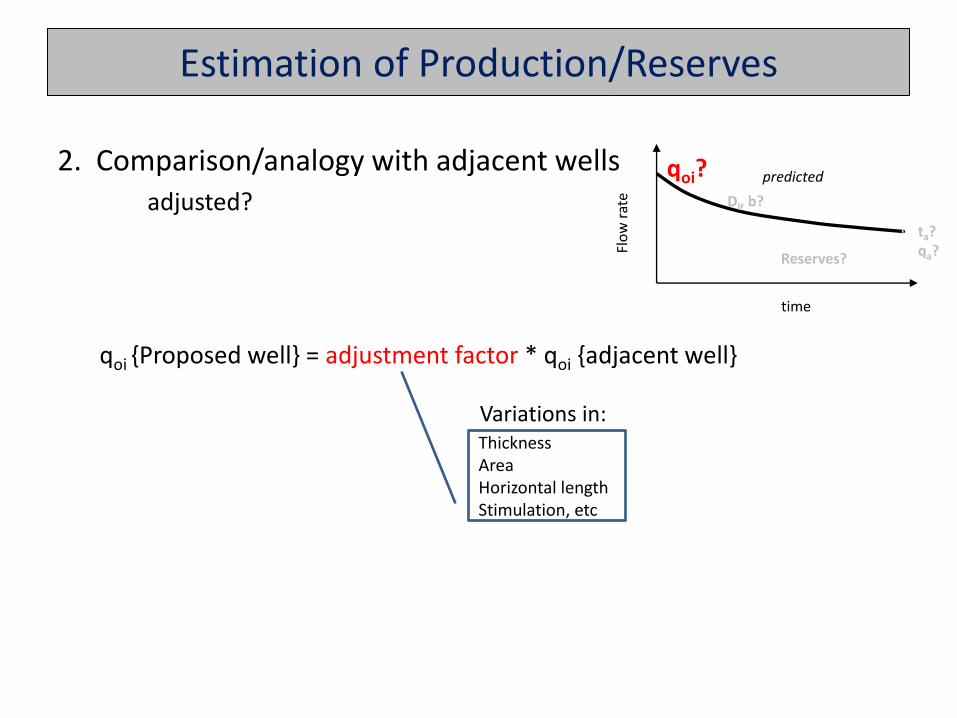
2. Comparison/analogy with adjacent wells adjusted?
qoi {Proposed well} = adjustment factor * qoi {adjacent well}
time
Flo
w r
ate
predicted qoi? Di, b?
ta? qa?
Reserves?
Thickness Area Horizontal length Stimulation, etc
Variations in:
Estimation of Production/Reserves
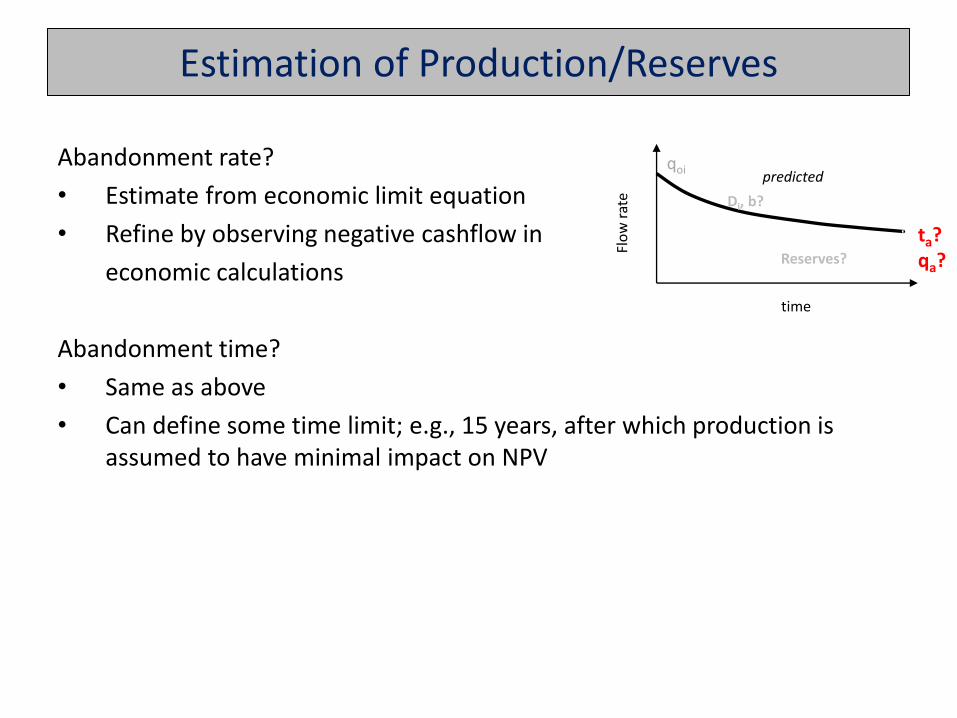
Abandonment rate?
• Estimate from economic limit equation
• Refine by observing negative cashflow in
economic calculations
Abandonment time?
• Same as above
• Can define some time limit; e.g., 15 years, after which production is assumed to have minimal impact on NPV
time
Flo
w r
ate
predicted qoi
Di, b?
ta? qa? Reserves?
Estimation of Production/Reserves
1. Comparison/analogy with adjacent wells Initial state or current state?
time
Flo
w r
ate
predicted qoi
Di, b?
ta? qa?
Reserves?
time
Flo
w r
ate
Di?
Historical production Of adjacent well
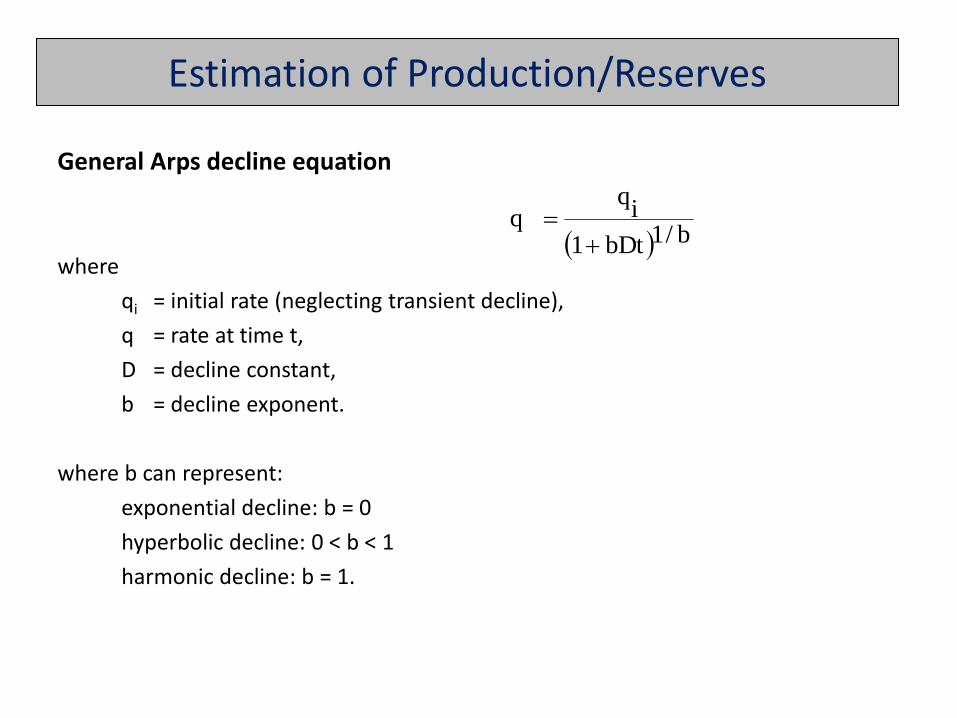
General Arps decline equation
where
qi = initial rate (neglecting transient decline),
q = rate at time t,
D = decline constant,
b = decline exponent.
where b can represent:
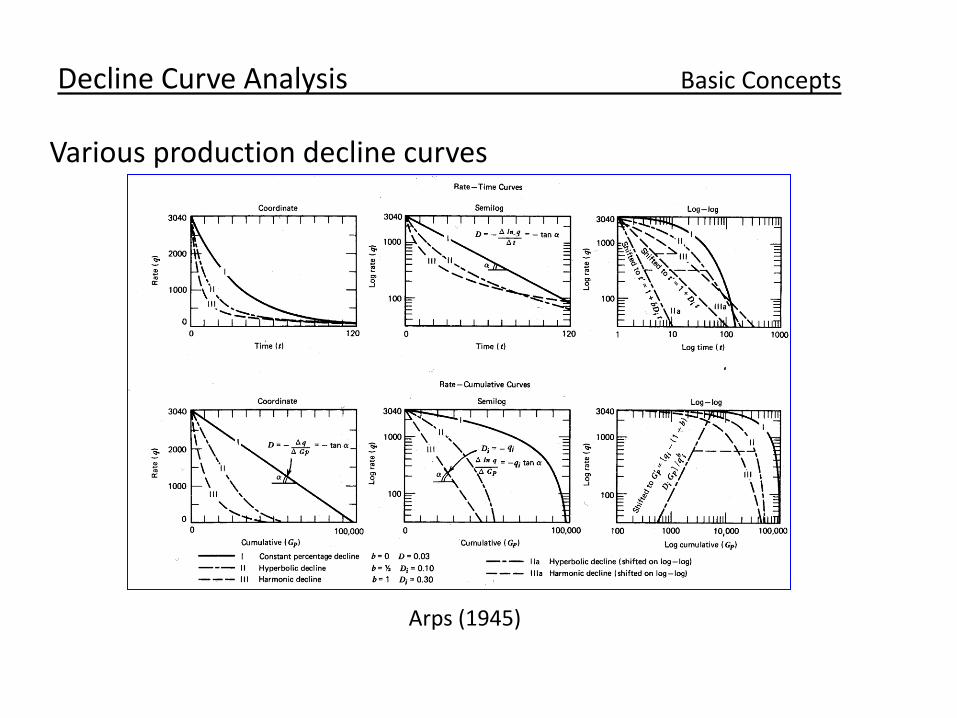
exponential decline: b = 0
hyperbolic decline: 0 < b < 1
harmonic decline: b = 1.
b/1bDt1
iq
q
Estimation of Production/Reserves
Decline Curve Analysis Basic Concepts
Various production decline curves
Arps (1945)
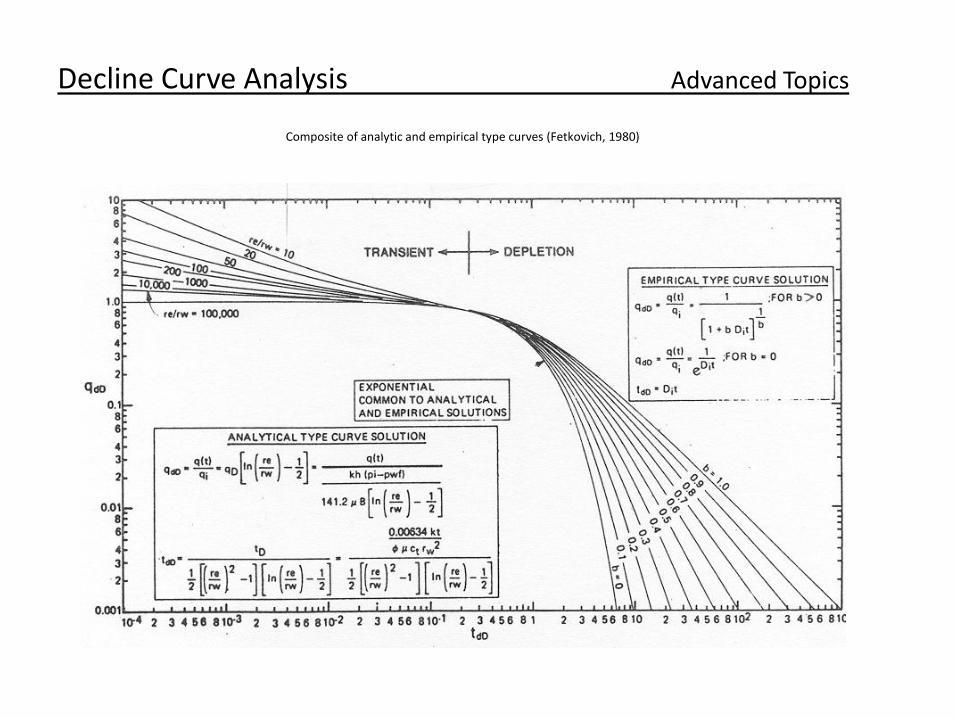
Decline Curve Analysis Advanced Topics
Composite of analytic and empirical type curves (Fetkovich, 1980)
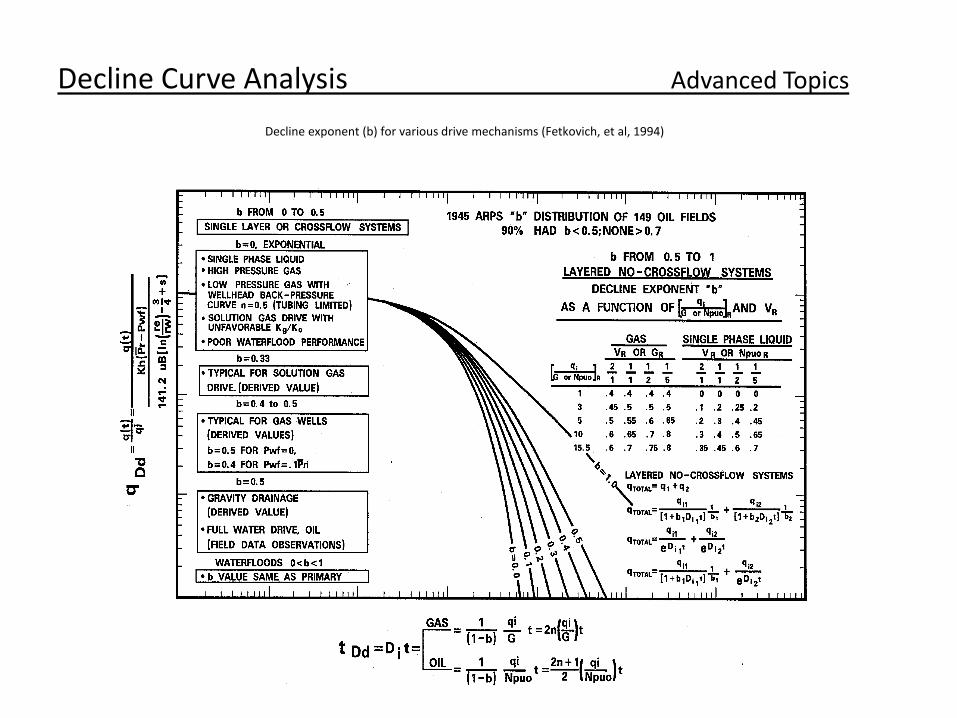
Decline Curve Analysis Advanced Topics
Decline exponent (b) for various drive mechanisms (Fetkovich, et al, 1994)
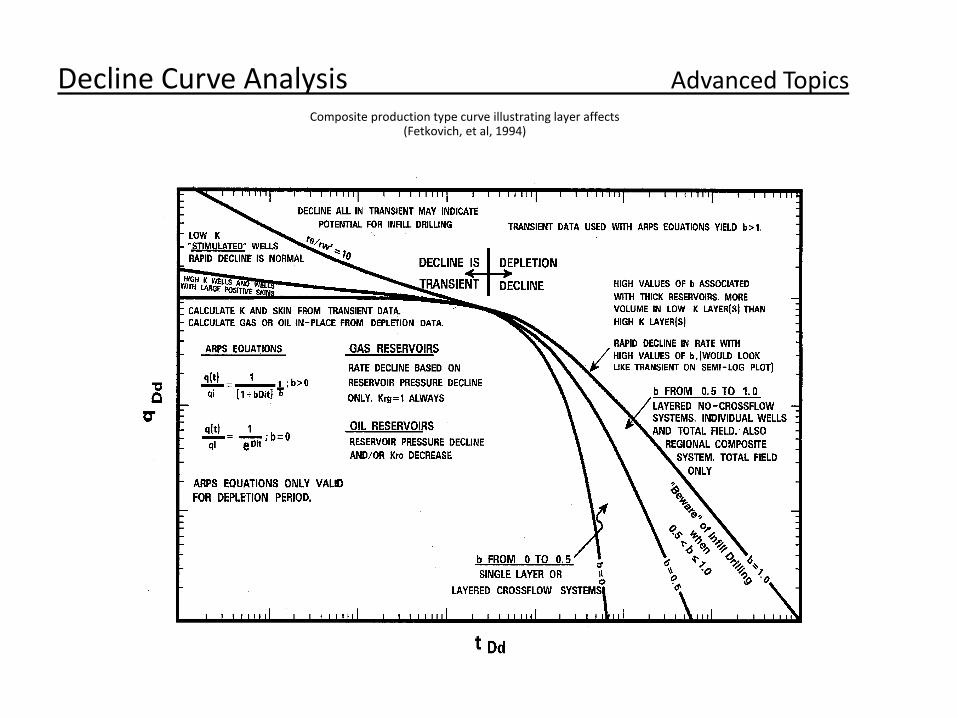
Decline Curve Analysis Advanced Topics Composite production type curve illustrating layer affects
(Fetkovich, et al, 1994)
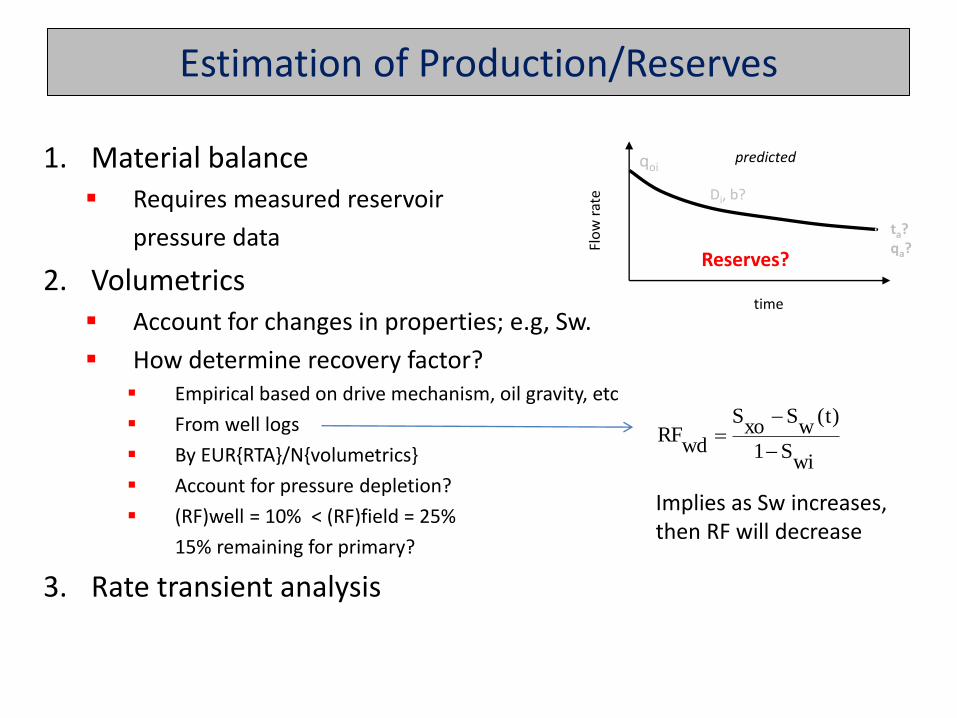
Estimation of Production/Reserves
1. Material balance Requires measured reservoir
pressure data
2. Volumetrics Account for changes in properties; e.g, Sw.
How determine recovery factor? Empirical based on drive mechanism, oil gravity, etc
From well logs
By EUR{RTA}/N{volumetrics}
Account for pressure depletion?
(RF)well = 10% < (RF)field = 25%
15% remaining for primary?
3. Rate transient analysis
time
Flo
w r
ate
predicted qoi
Di, b?
ta? qa?
Reserves?
wiS1
)t(w
Sxo
S
wdRF
Implies as Sw increases, then RF will decrease
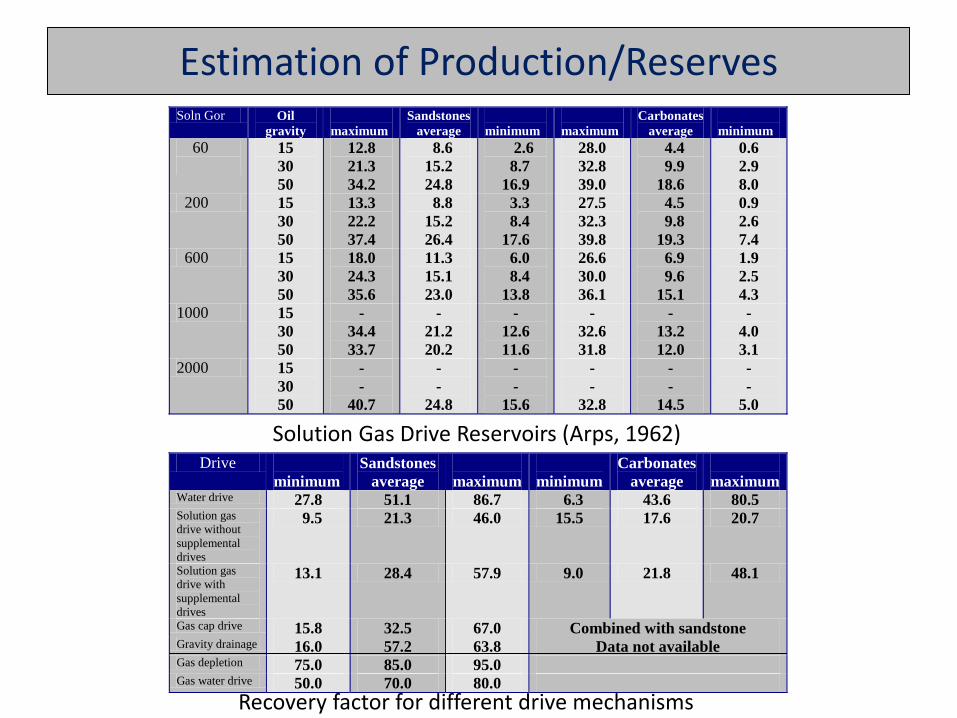
Estimation of Production/Reserves Soln Gor Oil
gravity
maximum
Sandstones
average
minimum
maximum
Carbonates
average
minimum
60
15
30
50
12.8
21.3
34.2
8.6
15.2
24.8
2.6
8.7
16.9
28.0
32.8
39.0
4.4
9.9
18.6
0.6
2.9
8.0
200 15
30
50
13.3
22.2
37.4
8.8
15.2
26.4
3.3
8.4
17.6
27.5
32.3
39.8
4.5
9.8
19.3
0.9
2.6
7.4
600 15
30
50
18.0
24.3
35.6
11.3
15.1
23.0
6.0
8.4
13.8
26.6
30.0
36.1
6.9
9.6
15.1
1.9
2.5
4.3
1000 15
30
50
-
34.4
33.7
-
21.2
20.2
-
12.6
11.6
-
32.6
31.8
-
13.2
12.0
-
4.0
3.1
2000 15
30
50
-
-
40.7
-
-
24.8
-
-
15.6
-
-
32.8
-
-
14.5
-
-
5.0
Drive
minimum
Sandstones
average
maximum
minimum
Carbonates
average
maximum Water drive 27.8 51.1 86.7 6.3 43.6 80.5 Solution gas
drive without
supplemental
drives
9.5 21.3 46.0 15.5 17.6 20.7
Solution gas
drive with
supplemental
drives
13.1 28.4 57.9 9.0 21.8 48.1
Gas cap drive 15.8 32.5 67.0 Combined with sandstone
Data not available Gravity drainage 16.0 57.2 63.8 Gas depletion 75.0 85.0 95.0 Gas water drive 50.0 70.0 80.0
Solution Gas Drive Reservoirs (Arps, 1962)
Recovery factor for different drive mechanisms
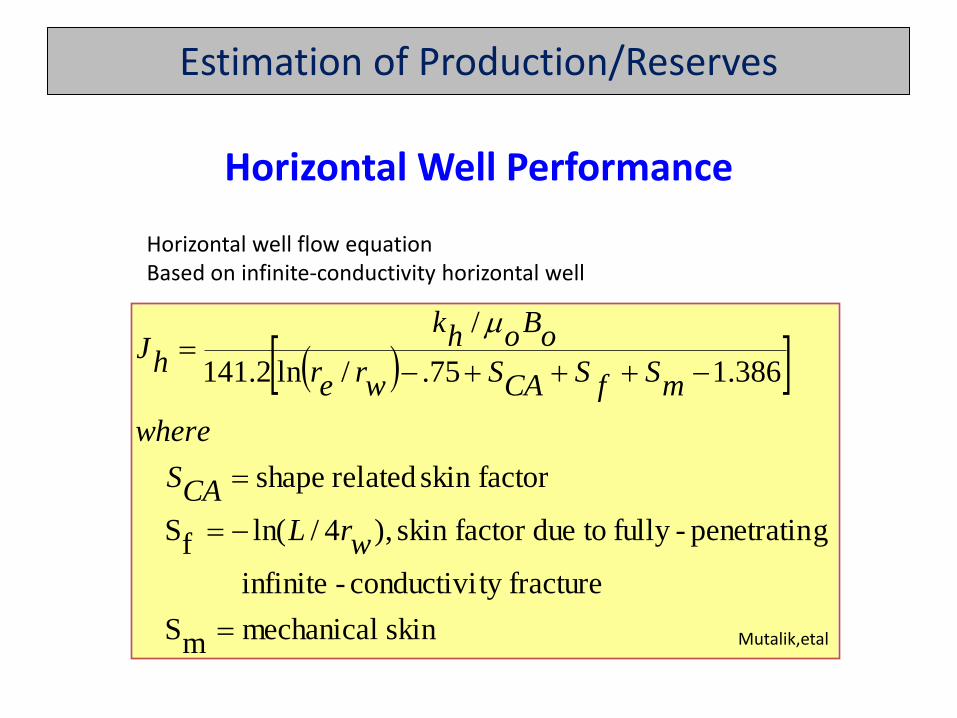
skin mechanicalmS
fracturety conductivi-infinite
gpenetratin-fully toduefactor skin ),4/ln(fS
factorskin related shape
386.175./ln2.141
/
wrL
CAS
where
mSfSCASwrer
oBohk
hJ
Horizontal well flow equation Based on infinite-conductivity horizontal well
Mutalik,etal
Estimation of Production/Reserves
Horizontal Well Performance
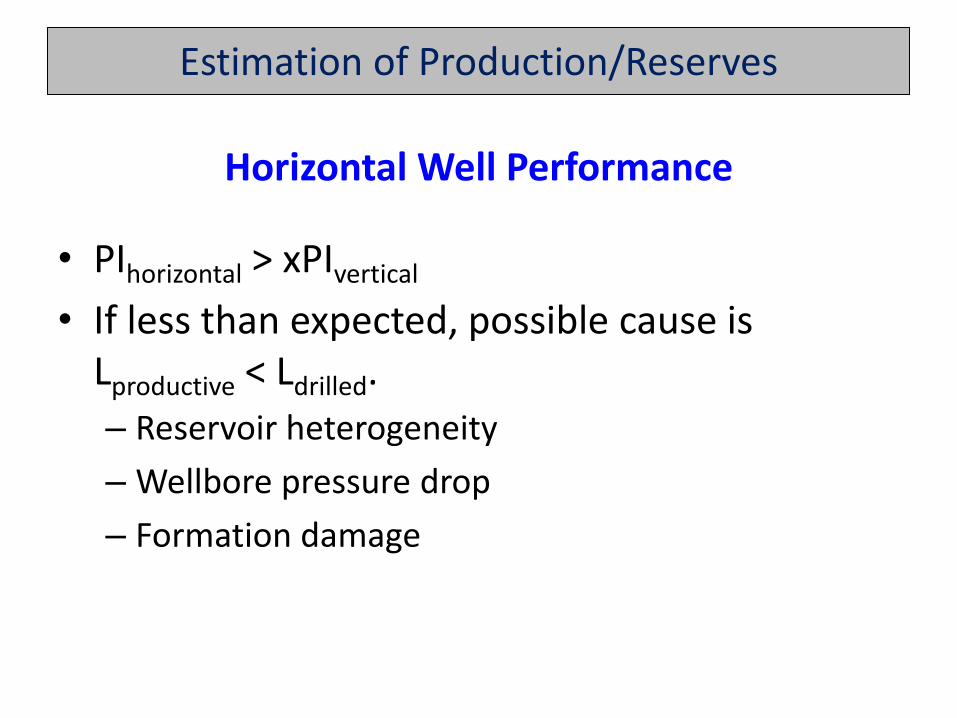
Horizontal Well Performance
• PIhorizontal > xPIvertical
• If less than expected, possible cause is Lproductive < Ldrilled.
– Reservoir heterogeneity
– Wellbore pressure drop
– Formation damage
Estimation of Production/Reserves
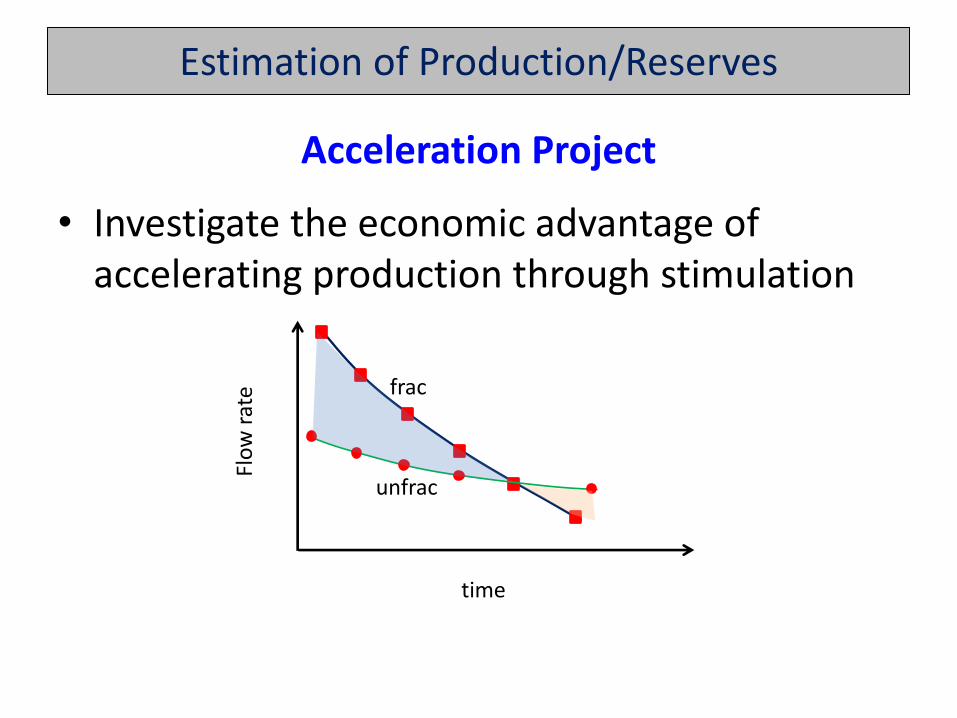
Acceleration Project
• Investigate the economic advantage of accelerating production through stimulation
Estimation of Production/Reserves
time
Flo
w r
ate
frac
unfrac
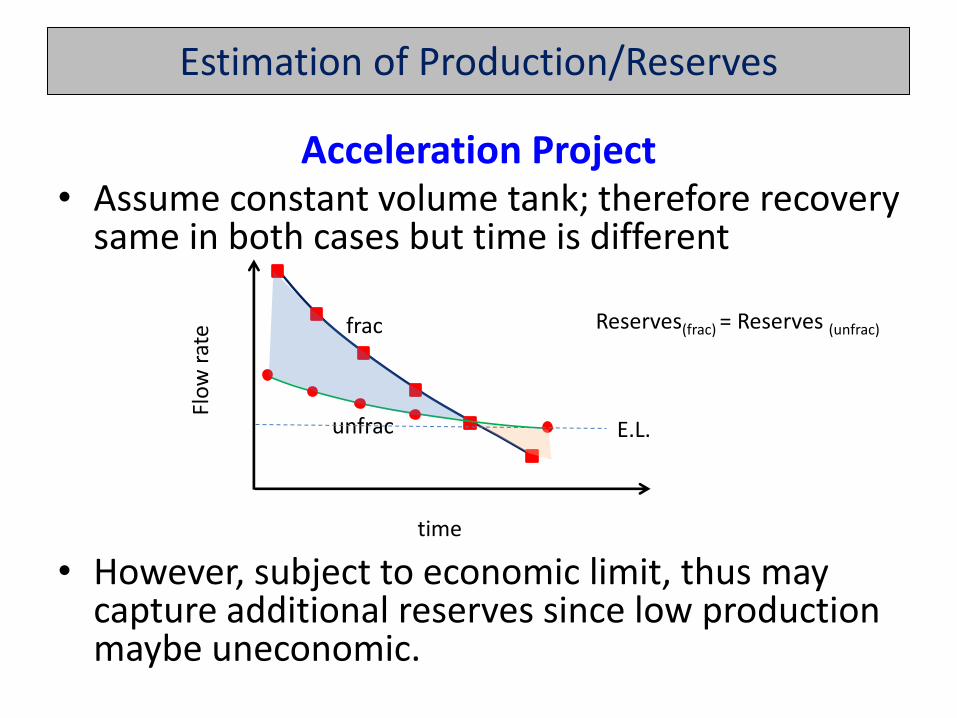
Acceleration Project • Assume constant volume tank; therefore recovery
same in both cases but time is different
• However, subject to economic limit, thus may capture additional reserves since low production maybe uneconomic.
Estimation of Production/Reserves
time
Flo
w r
ate
frac
unfrac E.L.
Reserves(frac) = Reserves (unfrac)

Acceleration Project
• Possibility of gaining additional reserves if stimulation communicates with other compartments/layers
Estimation of Production/Reserves
time
Flo
w r
ate
frac
unfrac
Reserves(frac) > Reserves (unfrac)
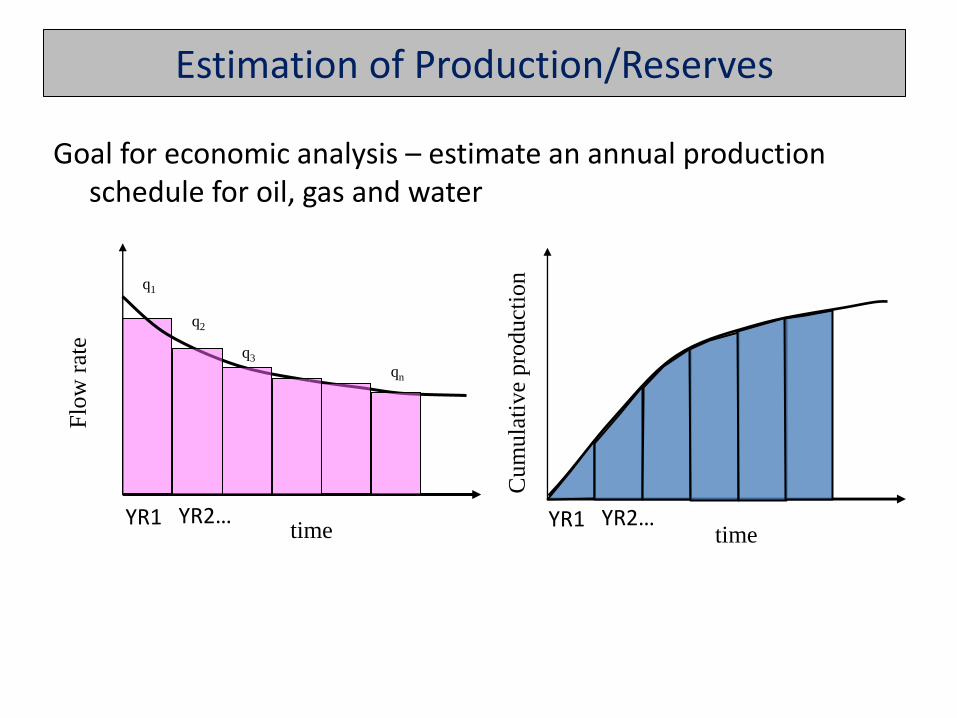
Goal for economic analysis – estimate an annual production schedule for oil, gas and water
time
Flo
w r
ate
q1
q2
q3
qn
Estimation of Production/Reserves
YR1 YR2… time
Cum
ula
tive
pro
duct
ion
YR1 YR2…

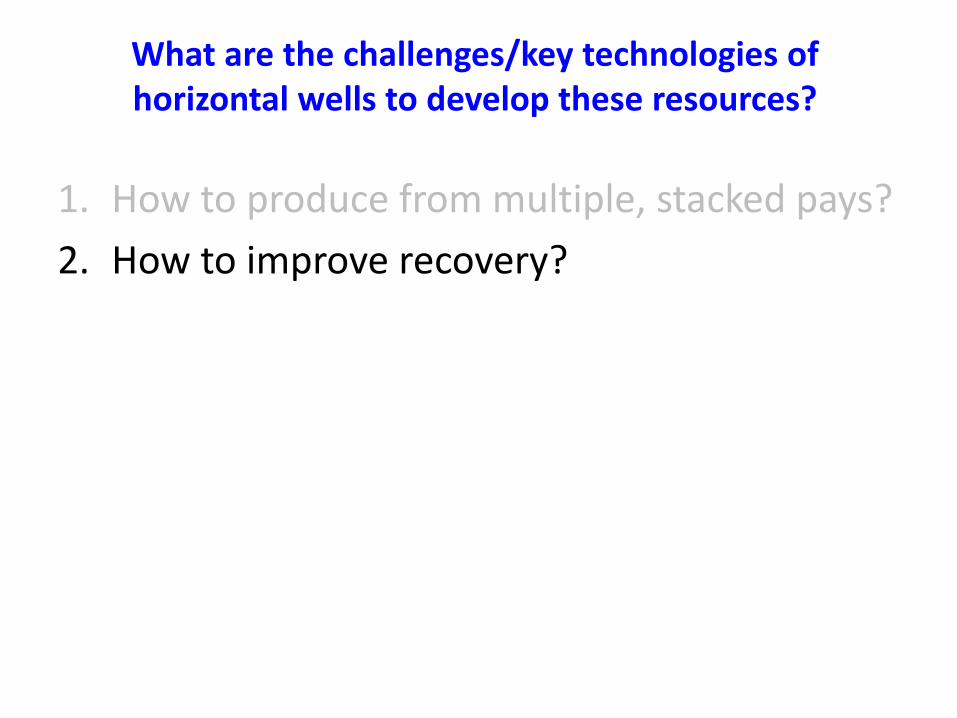
1. How to produce from multiple, stacked pays?
What are the challenges/key technologies of horizontal wells to develop these resources?
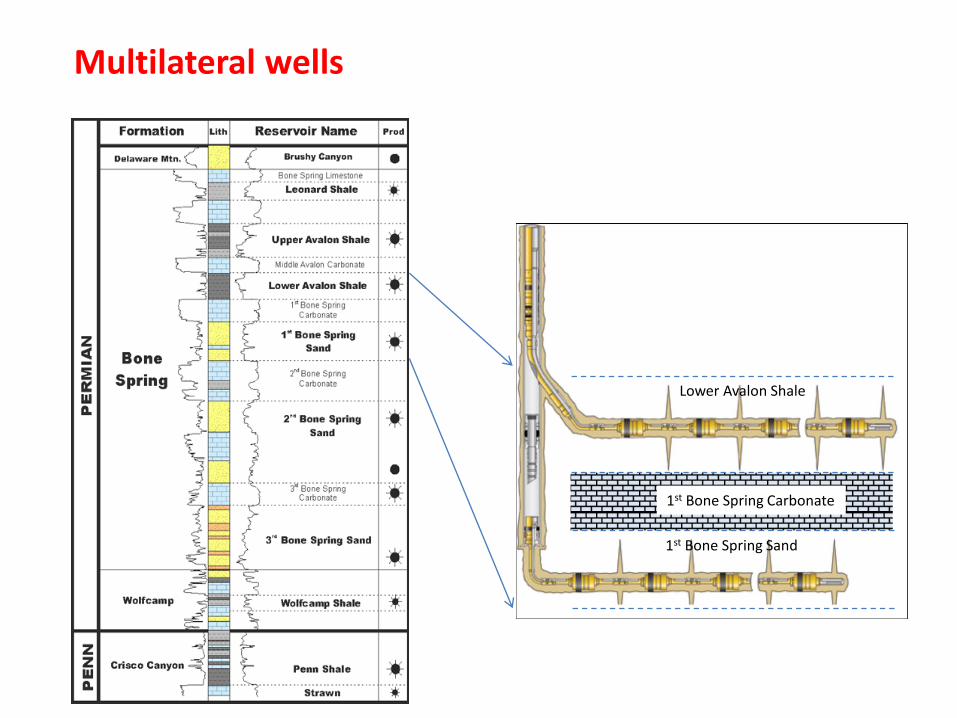
Multilateral wells
1st Bone Spring Sand
1st Bone Spring Carbonate
Lower Avalon Shale
1. How to produce from multiple, stacked pays?
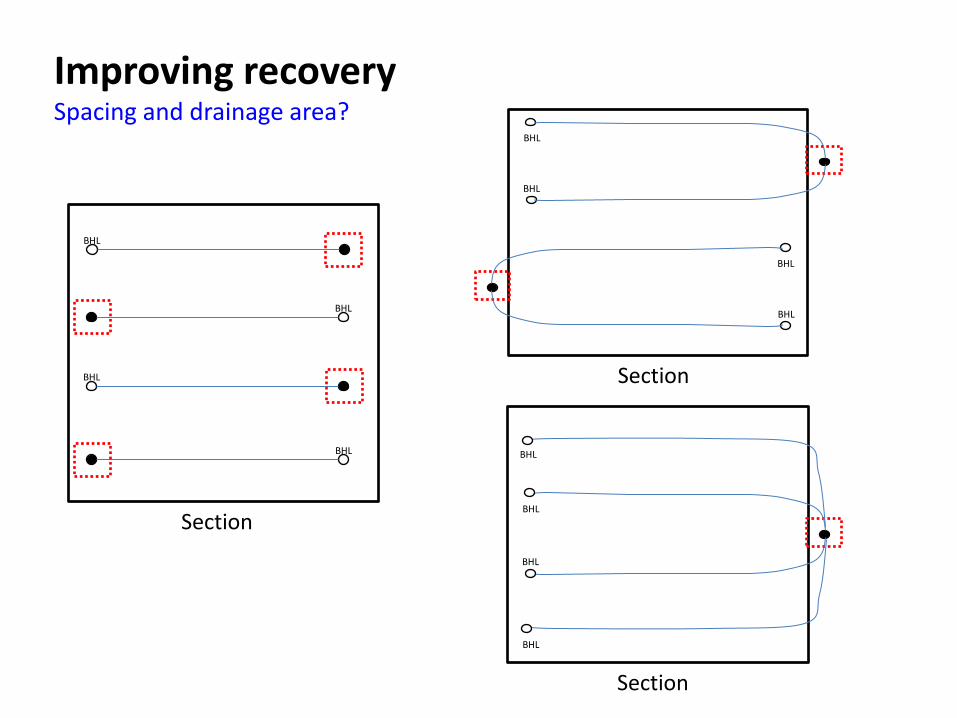
2. How to improve recovery?
What are the challenges/key technologies of horizontal wells to develop these resources?
BHL
BHL
BHL
BHL
Section
Section
BHL
BHL
BHL
BHL
Section
BHL
BHL
BHL
BHL
Improving recovery Spacing and drainage area?

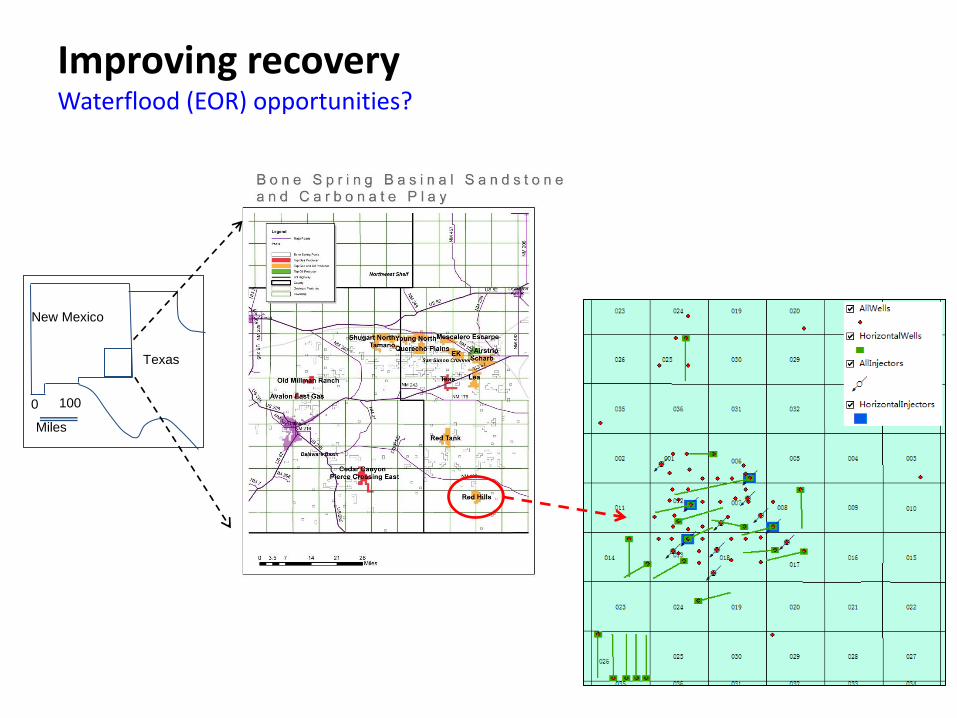
Improving recovery Waterflood (EOR) opportunities?
BHL
BHL
BHL
BHL
Section
BHL
BHL
BHL
BHL
Section
BHL GAS INJECTION
BHL WATER INJECTION
BH
L W
ATER
INJEC
TION
BHL
BHL
BHL
BHL
Section
BH
L W
ATER
INJEC
TION
BHL
BHL
Section
BHL GAS INJECTION
BHL GAS INJECTION
New Mexico
Texas
Miles
0 100
Improving recovery Waterflood (EOR) opportunities?

1. How to produce from multiple, stacked pays?
2. How to improve recovery?
3. How to improve the fracture design and increase the SRV?
What are the challenges/key technologies of horizontal wells to develop these resources?
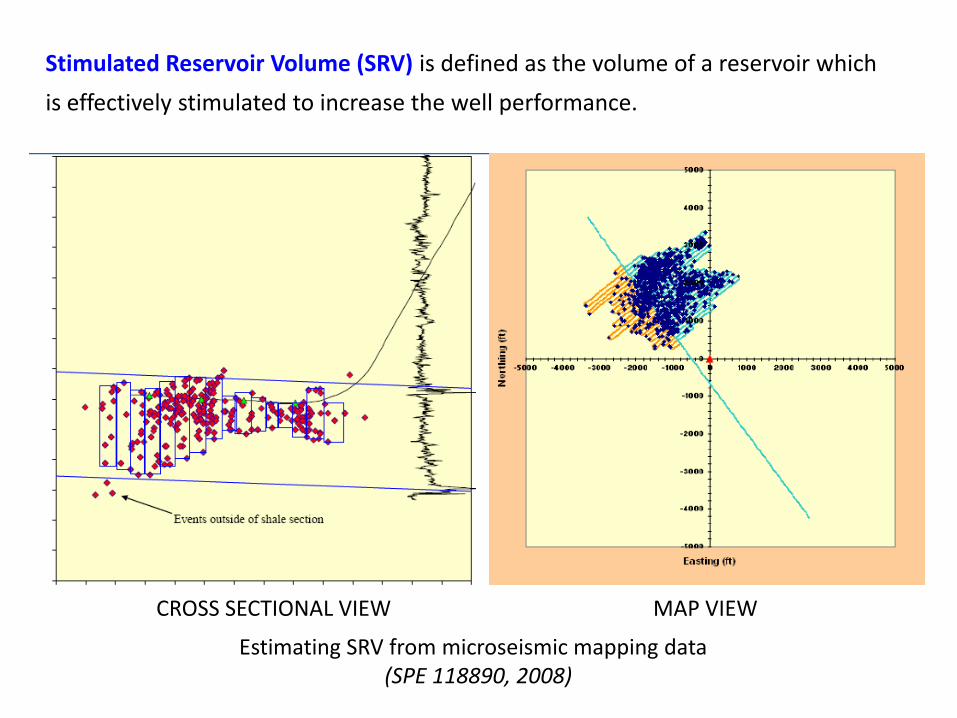
Stimulated Reservoir Volume (SRV) is defined as the volume of a reservoir which
is effectively stimulated to increase the well performance.
Estimating SRV from microseismic mapping data (SPE 118890, 2008)
MAP VIEW CROSS SECTIONAL VIEW
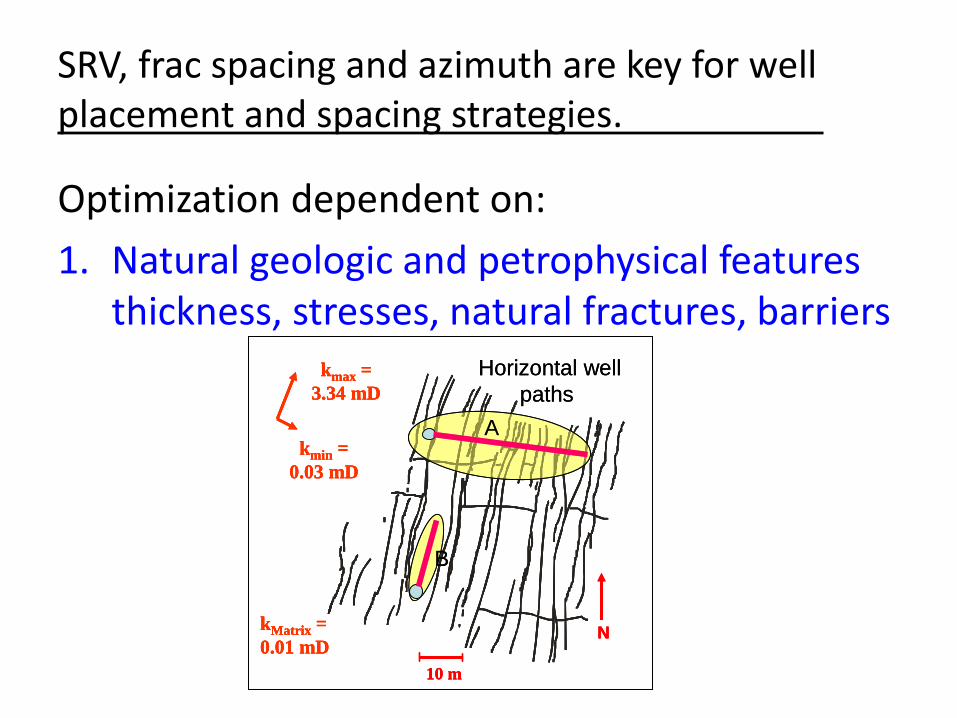
SRV, frac spacing and azimuth are key for well placement and spacing strategies.
Optimization dependent on:
1. Natural geologic and petrophysical features thickness, stresses, natural fractures, barriers
kmin =
0.03 mD
kmax =
3.34 mD
kMatrix =
0.01 mDN
10 m
Horizontal well
paths
A
B
kmin =
0.03 mD
kmax =
3.34 mD
kMatrix =
0.01 mDN
10 m
kmin =
0.03 mD
kmax =
3.34 mD
kMatrix =
0.01 mDN
10 m
Horizontal well
paths
A
B
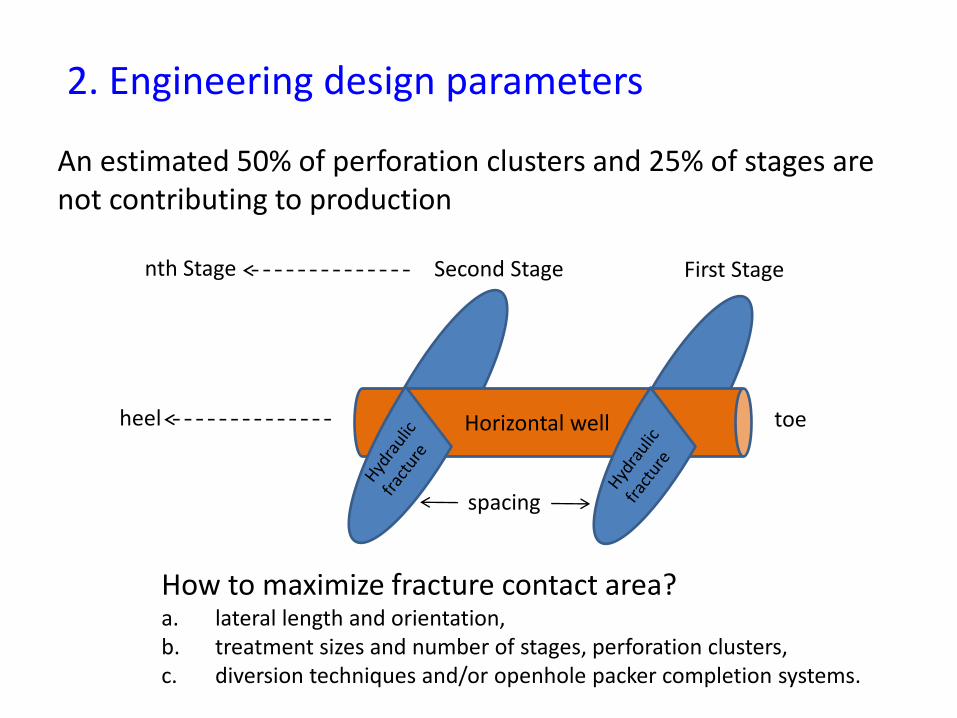
An estimated 50% of perforation clusters and 25% of stages are not contributing to production
Horizontal well
spacing
First Stage Second Stage nth Stage
heel toe
How to maximize fracture contact area? a. lateral length and orientation, b. treatment sizes and number of stages, perforation clusters, c. diversion techniques and/or openhole packer completion systems.
2. Engineering design parameters

Engineering design parameters
0
100
200
300
400
500
600
700
2004 2005 2006 2007 2008 2009 late2009
2010
stag
e le
ngt
h, f
t
carbonates
tight ss
shales
1242
0
2
4
6
8
10
12
14
16
18
20
2004 2005 2006 2007 2008 2009 late2009
2010
Nu
mb
er o
f st
ages
carbonates
tight ss
shales
Source: Optimization of Completions in Unconventional Reservoirs JPT, July 2011, SPE 143066

1. How to produce from multiple, stacked pays?
2. How to improve recovery?
3. How to improve the fracture design and increase the SRV?
4. What are the environmental impacts on horizontal wells and how can they be mitigated?
What are the challenges/key technologies of horizontal wells to develop these resources?
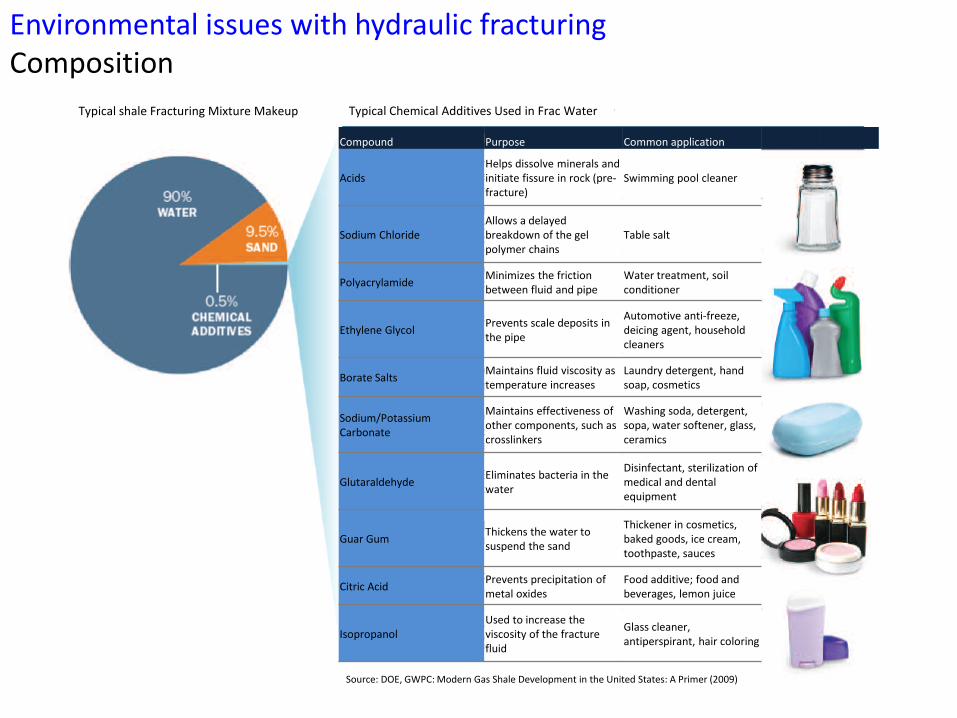
Compound Purpose Common application
Acids Helps dissolve minerals and initiate fissure in rock (pre-fracture)
Swimming pool cleaner
Sodium Chloride Allows a delayed breakdown of the gel polymer chains
Table salt
Polyacrylamide Minimizes the friction between fluid and pipe
Water treatment, soil conditioner
Ethylene Glycol Prevents scale deposits in the pipe
Automotive anti-freeze, deicing agent, household cleaners
Borate Salts Maintains fluid viscosity as temperature increases
Laundry detergent, hand soap, cosmetics
Sodium/Potassium Carbonate
Maintains effectiveness of other components, such as crosslinkers
Washing soda, detergent, sopa, water softener, glass, ceramics
Glutaraldehyde Eliminates bacteria in the water
Disinfectant, sterilization of medical and dental equipment
Guar Gum Thickens the water to suspend the sand
Thickener in cosmetics, baked goods, ice cream, toothpaste, sauces
Citric Acid Prevents precipitation of metal oxides
Food additive; food and beverages, lemon juice
Isopropanol Used to increase the viscosity of the fracture fluid
Glass cleaner, antiperspirant, hair coloring
Source: DOE, GWPC: Modern Gas Shale Development in the United States: A Primer (2009)
Typical shale Fracturing Mixture Makeup Typical Chemical Additives Used in Frac Water
Environmental issues with hydraulic fracturing Composition
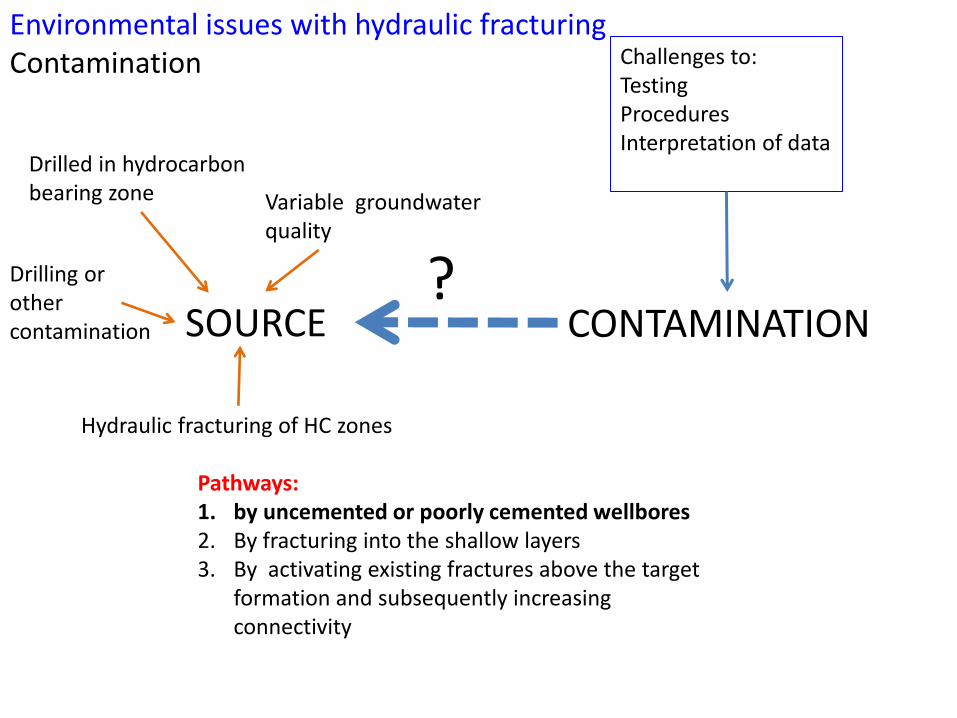
SOURCE CONTAMINATION ?
Pathways: 1. by uncemented or poorly cemented wellbores 2. By fracturing into the shallow layers 3. By activating existing fractures above the target
formation and subsequently increasing connectivity
Challenges to: Testing Procedures Interpretation of data Drilled in hydrocarbon
bearing zone Variable groundwater quality
Hydraulic fracturing of HC zones
Drilling or other contamination
Environmental issues with hydraulic fracturing Contamination
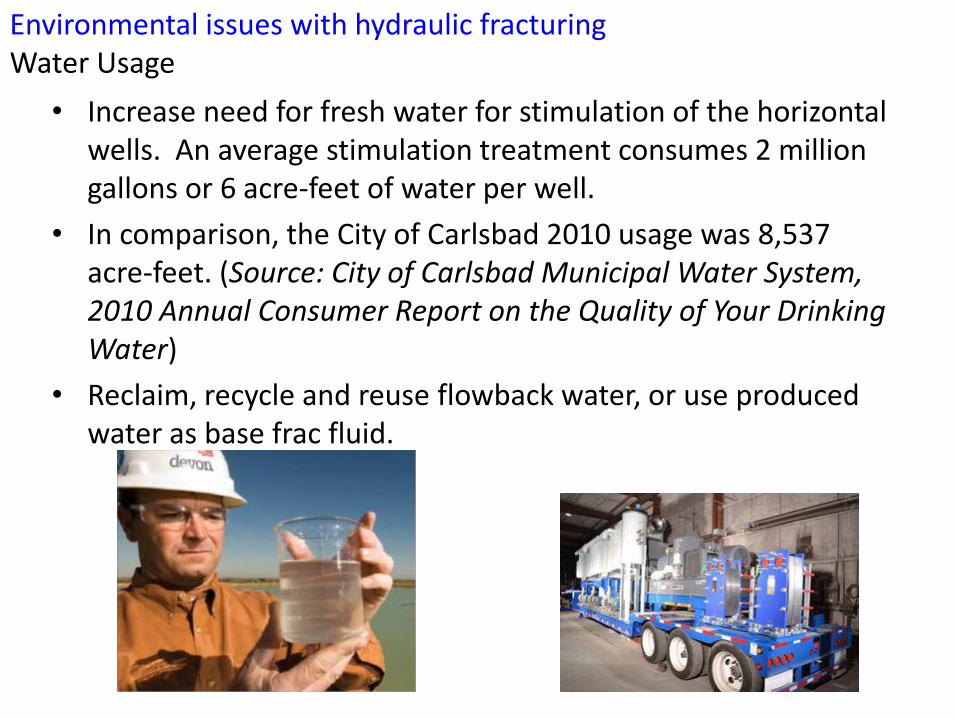
• Increase need for fresh water for stimulation of the horizontal wells. An average stimulation treatment consumes 2 million gallons or 6 acre-feet of water per well.
• In comparison, the City of Carlsbad 2010 usage was 8,537 acre-feet. (Source: City of Carlsbad Municipal Water System, 2010 Annual Consumer Report on the Quality of Your Drinking Water)
• Reclaim, recycle and reuse flowback water, or use produced water as base frac fluid.
Environmental issues with hydraulic fracturing Water Usage