Embed Size (px)
Citation preview

Estimation of percolation threshold of acid-etched titanium surfaces using
Minkowski functionals
M.A. Rodríguez-Valverde1, P.J. Ramón-Torregrosa
1 and M.A. Cabrerizo-Vílchez
1
1 Biocolloid and Fluids Physics Group. Department of Physics, Faculty of Sciences University of Granada, C\Fuentenueva
s/n, E-18071, Granada, Spain
Minkowski functionals provide morphological and topological information of a rough surface such as connectivity. In the
context of biomaterials, since the Euler characteristic relates to the possibility of fluid flow on a surface, it may be of
interest in the prediction of biointegration. The Euler characteristic (third Minkowski functional) can be used to define a
percolation threshold from the height level where the Euler characteristic function has its zero crossing. A high percolation
threshold suggests better fluid retention properties. In this work, we studied the evolution of commercially pure titanium
(grade II) subjected to an acid etching process. Each set of samples was attacked for different times, from 0 to 750 s with
hydrofluoridric acid. Topographies of each sample were achieved by AFM (Nanoscope IV) in Tapping Mode. We present
the evolution of the maximum-density height for the peaks and valleys with etching time and the concerning percolation
thresholds.
Keywords percolation, Minkowski functionals, biomaterials, titanium
1. Introduction
Biomaterial surfaces are usually textured to enhance the cell adhesion and to assure a suitable bio-integration [1].
However, cell proliferation on rough surfaces can be driven by topography features rather than by available surface area
(i.e. roughness degree) [1]. Percolation in disordered surfaces (2-D connected media) of implants affects the circulation
of extracellular material, nutrient diffusion, cell adhesion and the ingrowth of bone tissue. Thus, a high percolation
threshold suggests better fluid retention properties, as the fluid will not be able to move freely below this threshold due
to the formation of air channels.
Commercially pure titanium (c.p. Ti) fulfils important chemical and mechanical requirements for use in medical
implants as it exhibits a higher specific strength, lower stiffness, and improved corrosion resistance in biological media
as compared with stainless steel. The incorporation of porosity into titanium implants provides additional advantages
over fully dense titanium: mechanical anchoring to bone is facilitated through tissue growth into the pores and stiffness
is reduced, thus mitigating stress shielding.
Interconnectivity plays a determining role in percolation studies (long-range connectivity), where the path length
between pores connected to the surrounding is investigated. However, interconnectivity has mainly been determined
qualitatively. Atomic force microscopy makes possible to acquire a complete three-dimensional height map of surfaces
[2]. 2-D percolation can be detected in topographies at a given level set. In this chapter, alike the valley fluid retention
index [3], we report a method to estimate the percolation threshold of acid-etched titanium surfaces using the tools of
Integral Geometry: the Minkowski functionals [4].
a) b)
Fig. 1 a) Topography and b) height thresholding.
Microscopy: Science, Technology, Applications and Education A. Méndez-Vilas and J. Díaz (Eds.)
1978 ©FORMATEX 2010
______________________________________________

2. Minkowski functionals
Characterization of textured surfaces by means of Minkowski Functionals (MFs) allows us to analyze the spatial
distribution of the sites of holes (or valleys), in detail [5]. MFs are an alternative to structure functions. Further, they are
connected to physically useful parameters like the threshold of percolation [6].
In order to compute the MFs of an arbitrary topography, a height thresholding should be applied as in Fig. 1. By
intersecting the topography data with multiple horizontal planes, this procedure allows us to transform a height map to a
stack of level sets (Fig. 2). Choosing a height above the highest surface peak yields an empty set; choosing a height
below the deepest pit yields the full domain. Thus, MFs yield 3D characterizing functions from 2D sets.
Fig. 2 Transformation of the topography displayed in Fig. 1a to a stack of level sets. The height h increases from left (hmin) to right
(hmax). Black areas represent material, white represents void areas.
At each level h of the level sets of a topography, NB and NW are referred to black and white pixels, NBounded to the
bounded pixels, nB and nW, to isolated regions or islets. A black pixel represents a material point (bulk or surface)
whereas a white pixel represents a void point (air).
The first MF F is the covered surface area at the level h and it is defined as:
( ) B
B W
NF h
N N≡
+. (1)
The normalization by the total analyzed area is necessary to provide easy comparison of the functionals determined
for images with different scan ranges. The first functional measures the relative matter amount existing underneath the
level h. Indeed, the plot of the first functional in terms of level h is the bearing area curve or Abbott-Firestone curve,
which is used for calculating the functional roughness parameters.
The second MF U is the length of contours:
( ) Bounded
B W
NU h
N N≡
+. (2)
This functional describes the shape of the surface features, i.e. the microstructure. The second functional of a level
set with multiple or spiky isolated regions is greater than a set with few or smooth regions.
Finally, the third MF χ is the so-called Euler characteristic:
( ) B W
B W
n nh
N Nχ
−≡
+. (3)
The Euler characteristic describes the connectivity of spatial patterns. A negative Euler characteristic indicates that
the surface is predominantly characterized by isolated holes (i.e. porous structure). Instead, a positive Euler
characteristic points out that the surface mainly consists of isolated regions (i.e. punctiform structure). Further, the
maximum value of χ is equal to the maximum density of peaks and the minimum χ, the maximum density of valleys.
The Euler characteristic has an important interpretation in the context of percolation. For a level set with a very low
Euler characteristic, a fluid can be expected to be trapped in the holes. Instead, the fluid could flow freely in the case of
a high Euler characteristic (see Fig. 3).
Microscopy: Science, Technology, Applications and Education A. Méndez-Vilas and J. Díaz (Eds.)
©FORMATEX 2010 1979
______________________________________________
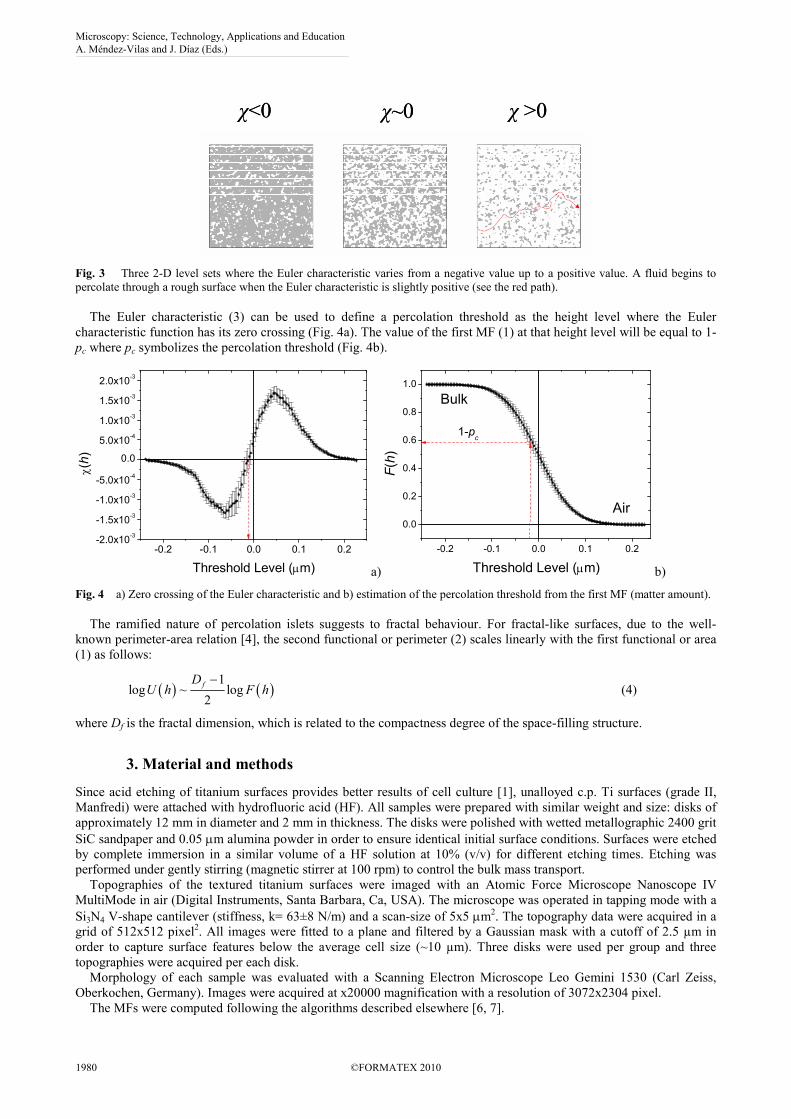
χ<0 χ >0χ~0χ<0 χ >0χ~0
Fig. 3 Three 2-D level sets where the Euler characteristic varies from a negative value up to a positive value. A fluid begins to
percolate through a rough surface when the Euler characteristic is slightly positive (see the red path).
The Euler characteristic (3) can be used to define a percolation threshold as the height level where the Euler
characteristic function has its zero crossing (Fig. 4a). The value of the first MF (1) at that height level will be equal to 1-
pc where pc symbolizes the percolation threshold (Fig. 4b).
-0.2 -0.1 0.0 0.1 0.2-2.0x10
-3
-1.5x10⁻³
-1.0x10⁻³
-5.0x10⁻⁴
0.0
5.0x10⁻⁴
1.0x10⁻³
1.5x10⁻³
2.0x10⁻³
χ(h)
Threshold Level (µm) a)
-0.2 -0.1 0.0 0.1 0.2
0.0
0.2
0.4
0.6
0.8
1.0
Air
F(h)
Threshold Level (µm)
Bulk
1-pc
b)
Fig. 4 a) Zero crossing of the Euler characteristic and b) estimation of the percolation threshold from the first MF (matter amount).
The ramified nature of percolation islets suggests to fractal behaviour. For fractal-like surfaces, due to the well-
known perimeter-area relation [4], the second functional or perimeter (2) scales linearly with the first functional or area
(1) as follows:
( ) ( )1
log ~ log2
fDU h F h
− (4)
where Df is the fractal dimension, which is related to the compactness degree of the space-filling structure.
3. Material and methods
Since acid etching of titanium surfaces provides better results of cell culture [1], unalloyed c.p. Ti surfaces (grade II,
Manfredi) were attached with hydrofluoric acid (HF). All samples were prepared with similar weight and size: disks of
approximately 12 mm in diameter and 2 mm in thickness. The disks were polished with wetted metallographic 2400 grit
SiC sandpaper and 0.05 µm alumina powder in order to ensure identical initial surface conditions. Surfaces were etched
by complete immersion in a similar volume of a HF solution at 10% (v/v) for different etching times. Etching was
performed under gently stirring (magnetic stirrer at 100 rpm) to control the bulk mass transport.
Topographies of the textured titanium surfaces were imaged with an Atomic Force Microscope Nanoscope IV
MultiMode in air (Digital Instruments, Santa Barbara, Ca, USA). The microscope was operated in tapping mode with a
Si3N4 V-shape cantilever (stiffness, k= 63±8 N/m) and a scan-size of 5x5 µm2. The topography data were acquired in a
grid of 512x512 pixel2. All images were fitted to a plane and filtered by a Gaussian mask with a cutoff of 2.5 µm in
order to capture surface features below the average cell size (~10 µm). Three disks were used per group and three
topographies were acquired per each disk.
Morphology of each sample was evaluated with a Scanning Electron Microscope Leo Gemini 1530 (Carl Zeiss,
Oberkochen, Germany). Images were acquired at x20000 magnification with a resolution of 3072x2304 pixel.
The MFs were computed following the algorithms described elsewhere [6, 7].
Microscopy: Science, Technology, Applications and Education A. Méndez-Vilas and J. Díaz (Eds.)
1980 ©FORMATEX 2010
______________________________________________

4. Results
From Fig. 5, the morphology of the etched samples was angular and stepped due to the crystalline grain detachment
from the amorphous structure of titanium. Moreover, at dimensions smaller than the grain structure of titanium, a
secondary texture was visualized. This double-scale roughness is visualized in Fig. 6.
During the etching process, preferential surface sites (grain boundaries) are attacked. The local etching rate depends
on grain orientation. This anisotropy affects the properties of the surface. In oxygen-rich ambients, c.p. Ti surfaces are
covered by a thin film of TiO2 (2-10 nm of thickness), which improves the corrosion resistance of titanium. Thus, the
etching kinetics is ruled by the interplay between the acid etching produced by the HF on Ti and TiO2 and the own
oxidation of Ti in aqueous solution.
a) b)
c) d)
Fig. 5 AFM topographies of titanium surfaces: (a) polished and etched for (b) 120s, (c) 180 s and (d) 300 s.
a) b)
Fig. 6 SEM pictures of titanium surfaces etched for (a) 120s and (b) 180 s. Acid etching initially produced stepped morphologies
due to the crystalline grain detachment, but after 180 s, a spiky aspect was found.
Microscopy: Science, Technology, Applications and Education A. Méndez-Vilas and J. Díaz (Eds.)
©FORMATEX 2010 1981
______________________________________________

The maximum densities of peaks and valleys are found at 50 nm and -70 nm, respectively (Fig. 7a) for an etching
time of 180 s. Further, the percolation threshold is maximum at 180s (Fig. 7b). This optimal time should be taken into
account in clinical applications. The controlling parameters on the evolution of acid-etched titanium surfaces will
become the initial state of surface (oxidation, roughness), the acid concentration and the type of acid. These parameters
might shift the critical etching time.
0 100 200 300 400 500 600 700 800
-75
-60
-45
-30
-15
0
15
30
45
60
valleys
peaks
Maximum-density Height (nm)
Etching time (s) a)
0 100 200 300 400 500 6000.34
0.36
0.38
0.40
0.42
0.44
0.46
0.48
0.50
pc
etching time (s) b)
Fig. 7 a) Evolution of the maximum-density height for the peaks and valleys, and b) percolation threshold in function of etching time.
Chemically etched surfaces have long been recognized as
fractal at least over a range of dimensions smaller than the
grain structure of the material [1]. However, the log-log plot
in Fig. 8 presents two slopes, one for large areas and the
other for small areas [8]. The structure at smaller length
scales and the structure at larger length scales, are
controlled by two separate dimensions: Dfl (local) and Dfg
(global). The fractal reaction dimension Dfl is basically the
effective fractal dimension of the surface towards the
etching. When Dfl > Dfg, the etched surface undergoes
roughening and if Dfl < Dfg , smoothing.
Anomalous surface roughness is indentified by distinct scaling relations for the local and the global surface
fluctuations. This behaviour can explain why osteoblast-like cells are more sensitive to the submicron-scale features of
acid-etched titanium surfaces [1].
5. Conclusions
The approach of integral geometry characterization shows promise towards improving the quantitative analysis of
topography data. Since surface characterization of biomaterials is crucial to understand the concerning biological
events, the use of complementary topography analysis, like Minkowski Functionals analysis, are highly recommended.
As reported Dotto and Kleinke [8], chemical etching processes produce percolation networks. This study reveals the
etching time as an optimizing parameter on the evolution of acid-etched titanium surface. A roughening transition in the
fractal behaviour of the acid-etched surfaces verifies the double-scale roughness found with AFM and SEM. Further,
cell proliferation was mediated by this specific morphology.
Acknowledgements This work was supported by the “Ministerio Español de Educación y Ciencia” (project MAT2007-66117 and
contract “Ramón y Cajal” RYC-2005-000983), the European Social Fund (ESF) and the “Junta de Andalucia” (projects P07-FQM-
02517 and P08-FQM-4325).
Fig. 8 Log-log plot of the second MF in function of the first MF
for etching time 570 s.
-5 -4 -3 -2 -1 0
-4
-3
-2
-1
Df=2.67
log U(h)
log F(h)
Df=2.46
Microscopy: Science, Technology, Applications and Education A. Méndez-Vilas and J. Díaz (Eds.)
1982 ©FORMATEX 2010
______________________________________________

References
[1] Rosales-Leal JI, Rodríguez-Valverde MA, Mazzaglia G, Ramón-Torregrosa PJ, Díaz-Rodríguez L, García-Martínez O,
Vallecillo-Capilla M, Ruiz C, Cabrerizo-Vílchez MA. Effect of roughness, wettability and morphology of engineered titanium
surfaces on osteoblast-like cell adhesion. Colloids Surf. A: Physicochem. Eng. Aspects 365 (2010). 222–229..
[2] Ramón-Torregrosa PJ, Rodríguez-Valverde MA, Amirfazli A, Cabrerizo-Vílchez MA. Factors affecting the measurement of
roughness factor of surfaces and its implications for wetting studies. Colloids Surf. A: Physicochem. Eng. Aspects 323 (2008)
83–94.
[3] Méndez-Vilas A, Donoso MG, González-Carrasco JL, González-Martín ML. Looking at the micro-topography of polished and
blasted Ti-based biomaterials using atomic force microscopy and contact angle goniometry Colloids and Surfaces B:
Biointerfaces 52 (2006) 157–166.
[4] Mecke K.R. Additivity, Convexity, and Beyond: Applications of Minkowski Functionals in Statistical Physics. In: Statistical
Physics and Spatial Statistics, Lecture Notes in Physics, 554. Berlin: Springer; 2000: pp 111-184.
[5] Raczkowska J, Rysz J, Budkowski A, Lekki J, Lekka M, Bernasik A, Kowalski K, Czub P. Surface Patterns in Solvent-Cast
Polymer Blend Films Analyzed with an Integral-Geometry Approach. Macromolecules 36 (2003) 2419–2427.
[6] Schmäehling J. Statistical characterization of technical surface microstructure. PhD Thesis. University of Heidelberg, 2006.
[7] Steele J. Characterizing 3D Microstructure using the Minkowski Functionals. Microsc. Microanal. 13 (2007) 1658-1659.
[8] Dotto MER, Maurício U. Kleinke, MU. Scaling laws in etched Si surfaces. Phys. Rev. B 65 (2002) 245323-6.
Microscopy: Science, Technology, Applications and Education A. Méndez-Vilas and J. Díaz (Eds.)
©FORMATEX 2010 1983
______________________________________________


![SUBCRITICAL U-BOOTSTRAP PERCOLATION MODELS HAVE · bootstrap percolation exhibited interesting nite-size e ects: on nite grids [n]d, there is a certain metastability threshold for](https://img.pdfslide.us/doc/110x75/5f42718685e18313351c9eca/subcritical-u-bootstrap-percolation-models-have-bootstrap-percolation-exhibited.jpg)