Embed Size (px)
Citation preview
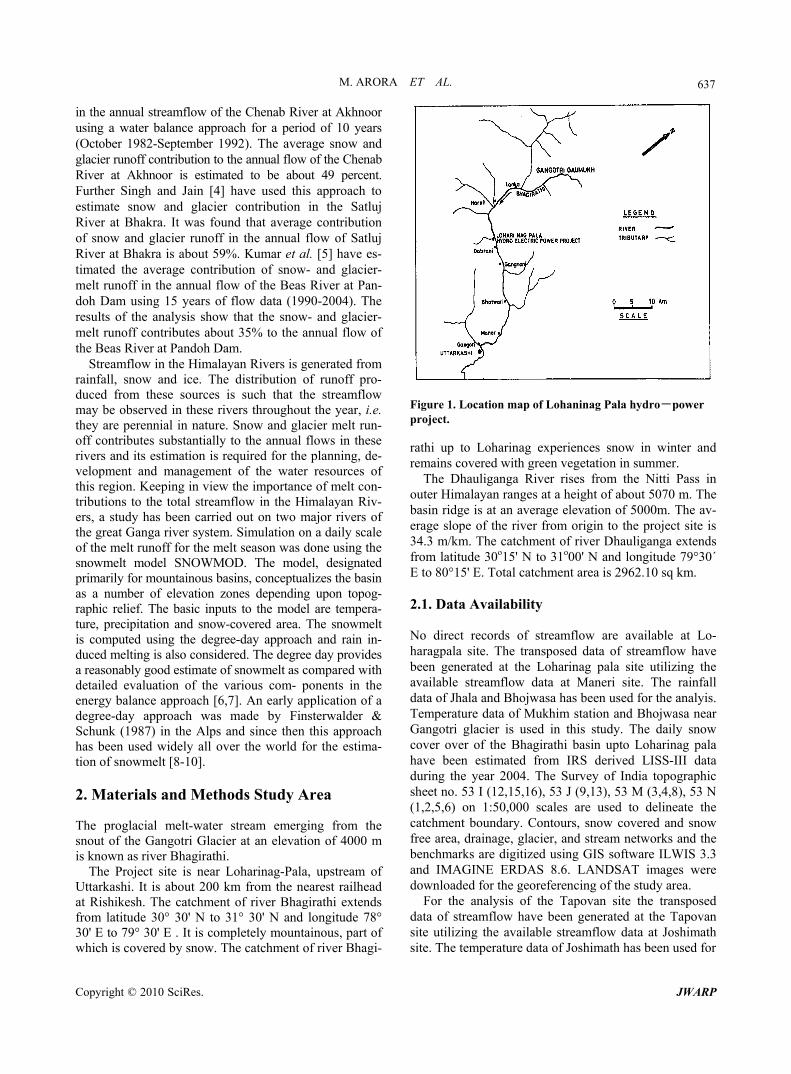
J. Water Resource and Protection, 2010, 2, 636-643 doi:10.4236/jwarp.2010.27073 Published Online July 2010 (http://www.SciRP.org/journal/jwarp)
Copyright © 2010 SciRes. JWARP
Estimation of Melt Contribution to Total Streamflow in River Bhagirathi and River DhauliGanga at Loharinag
Pala and Tapovan Vishnugad Project Sites
Manohar Arora1, D S Rathore1, R D Singh1, Rakesh Kumar1, Amit Kumar2 1Scientist, National Institute of Hydrology, Roorkee, India
2Research Associate, Centre for Glaciology, Dehradun, India E-mail: [email protected]
Received September 1, 2009; revised September 23, 2009; accepted September 30, 2009
Abstract Many of the major rivers in India originate from the Himalayas. These rivers have significant contribution from snow and ice which makes these rivers perennial. Due to steep slopes, all such streams have potential sites for hydropower generation. There is a requirement of estimation of the contribution from snow and gla-cier melt, rainfall contribution and sub surface contribution in the total runoff for sustainable supply of water to the hydropower plants. Considering this aspects, in this study a snowmelt runoff simulation model SNOWMOD suitable for Himalayan basins developed earlier has been modified and applied for simulation of flows. Input to the model such as glacier cover, permanent snow cover, seasonal snow cover generated through remote sensing techniques were used in conjunction with daily maximum and minimum temperature, rainfall and discharge. Two hydropower dam sites on major tributaries (Bhagirathi and DhauliGanga) of River Ganga have been selected for determination of different runoff components. However, though the data available was for a very limited period but the results indicate that these tributaries have significant contribu-tion from snow and ice for long term sustainability of flows to these schemes. Keywords: Himalayas, Snow and Ice, SNOWMOD, Modeling, Hydropower Schemes
1. Introduction
The Himalayan Mountain, system is the source of one of the world’s largest supplies of fresh water. All the major south Asian rivers originate in the Himalayan and their upper catchments are covered with snow and glaciers. The Indus, the Ganga and the Brahmaputra river systems originating from the Himalayan region receive substan- tial amount of precipitation in the form of snow and gla- ciers. The perennial nature of Himalayan Rivers and ap- propriate topographic setting of the region provide a sub- stantial exploitable hydropower in this area. In the Hi- malayan range there are more than > 10,000 glaciers [1] and feed a number of Himalayan rivers. This ice exposed surface of the glacier increases with time resulting in higher quantum of runoff. As the melt season advances, the melt water contribution from the glaciers increases. By the end of melt season, the melt runoff is reduced due to increases in air temperature and fresh snowfall on the higher reaches. Evidently, runoff generated from the gla-
ciers in the Himalayan basins has a significant influence on the streamflow of the river. The melt rate of the gla-cier is deter- mined by the prevailing climatic conditions and, therefore, varies from year to year. The physical changes in the glacier, like trend of exposition of glacier surface, influence the melting and runoff pattern of the glacier. Further, contribution of snow and ice melt to the total increase with altitude, but variation in the different components of runoff with season has not been quanti- fied for any Himalayan rivers.
In glaciated areas, much of the precipitation falls in solid form of throughout the year, so that it contributes to mass storage rather than directly to runoff. For example in the Alps, a minimum variation in annual runoff was observed from the river basin with 30-40% glacier cover [2]. The contribution of snow and glacier- melt runoff to Himalayan Rivers is significant and an estimation of the amount is necessary for the development, planning, and management of water resources. Singh et al. [3] estimated the average contribution of snow and glacier-melt runoff
M. ARORA ET AL.
637
in the annual streamflow of the Chenab River at Akhnoor using a water balance approach for a period of 10 years (October 1982-September 1992). The average snow and glacier runoff contribution to the annual flow of the Chenab River at Akhnoor is estimated to be about 49 percent. Further Singh and Jain [4] have used this approach to estimate snow and glacier contribution in the Satluj River at Bhakra. It was found that average contribution of snow and glacier runoff in the annual flow of Satluj River at Bhakra is about 59%. Kumar et al. [5] have es-timated the average contribution of snow- and glacier- melt runoff in the annual flow of the Beas River at Pan-doh Dam using 15 years of flow data (1990-2004). The results of the analysis show that the snow- and glacier- melt runoff contributes about 35% to the annual flow of the Beas River at Pandoh Dam.
Streamflow in the Himalayan Rivers is generated from rainfall, snow and ice. The distribution of runoff pro- duced from these sources is such that the streamflow may be observed in these rivers throughout the year, i.e. they are perennial in nature. Snow and glacier melt run- off contributes substantially to the annual flows in these rivers and its estimation is required for the planning, de- velopment and management of the water resources of this region. Keeping in view the importance of melt con- tributions to the total streamflow in the Himalayan Riv-ers, a study has been carried out on two major rivers of the great Ganga river system. Simulation on a daily scale of the melt runoff for the melt season was done using the snowmelt model SNOWMOD. The model, designated primarily for mountainous basins, conceptualizes the basin as a number of elevation zones depending upon topog-raphic relief. The basic inputs to the model are tempera-ture, precipitation and snow-covered area. The snowmelt is computed using the degree-day approach and rain in-duced melting is also considered. The degree day provides a reasonably good estimate of snowmelt as compared with detailed evaluation of the various com- ponents in the energy balance approach [6,7]. An early application of a degree-day approach was made by Finsterwalder & Schunk (1987) in the Alps and since then this approach has been used widely all over the world for the estima-tion of snowmelt [8-10].
2. Materials and Methods Study Area
The proglacial melt-water stream emerging from the snout of the Gangotri Glacier at an elevation of 4000 m is known as river Bhagirathi.
The Project site is near Loharinag-Pala, upstream of Uttarkashi. It is about 200 km from the nearest railhead at Rishikesh. The catchment of river Bhagirathi extends from latitude 30° 30' N to 31° 30' N and longitude 78° 30' E to 79° 30' E . It is completely mountainous, part of which is covered by snow. The catchment of river Bhagi-
Figure 1. Location map of Lohaninag Pala hydro-power project. rathi up to Loharinag experiences snow in winter and remains covered with green vegetation in summer.
The Dhauliganga River rises from the Nitti Pass in outer Himalayan ranges at a height of about 5070 m. The basin ridge is at an average elevation of 5000m. The av- erage slope of the river from origin to the project site is 34.3 m/km. The catchment of river Dhauliganga extends from latitude 30o15' N to 31o00' N and longitude 79°30´ E to 80°15' E. Total catchment area is 2962.10 sq km. 2.1. Data Availability No direct records of streamflow are available at Lo-haragpala site. The transposed data of streamflow have been generated at the Loharinag pala site utilizing the available streamflow data at Maneri site. The rainfall data of Jhala and Bhojwasa has been used for the analyis. Temperature data of Mukhim station and Bhojwasa near Gangotri glacier is used in this study. The daily snow cover over of the Bhagirathi basin upto Loharinag pala have been estimated from IRS derived LISS-III data during the year 2004. The Survey of India topographic sheet no. 53 I (12,15,16), 53 J (9,13), 53 M (3,4,8), 53 N (1,2,5,6) on 1:50,000 scales are used to delineate the catchment boundary. Contours, snow covered and snow free area, drainage, glacier, and stream networks and the benchmarks are digitized using GIS software ILWIS 3.3 and IMAGINE ERDAS 8.6. LANDSAT images were downloaded for the georeferencing of the study area.
For the analysis of the Tapovan site the transposed data of streamflow have been generated at the Tapovan site utilizing the available streamflow data at Joshimath site. The temperature data of Joshimath has been used for
Copyright © 2010 SciRes. JWARP
M. ARORA ET AL.
638
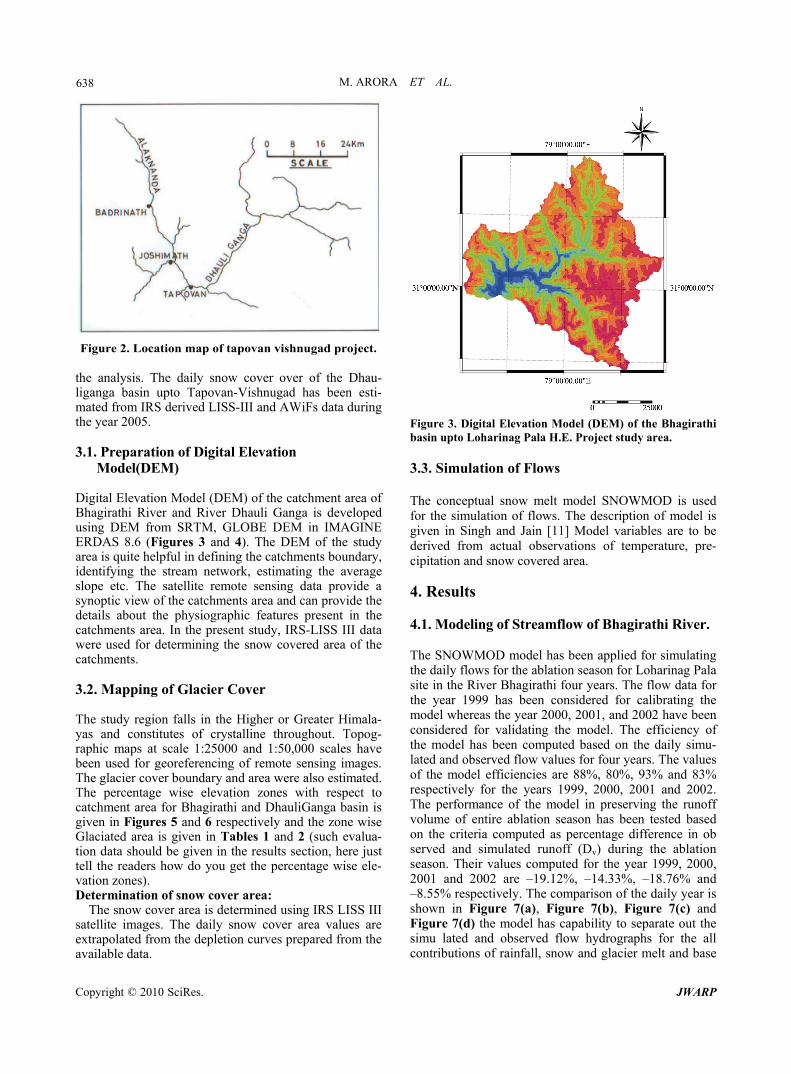
Figure 2. Location map of tapovan vishnugad project. the analysis. The daily snow cover over of the Dhau- liganga basin upto Tapovan-Vishnugad has been esti-mated from IRS derived LISS-III and AWiFs data during the year 2005. 3.1. Preparation of Digital Elevation
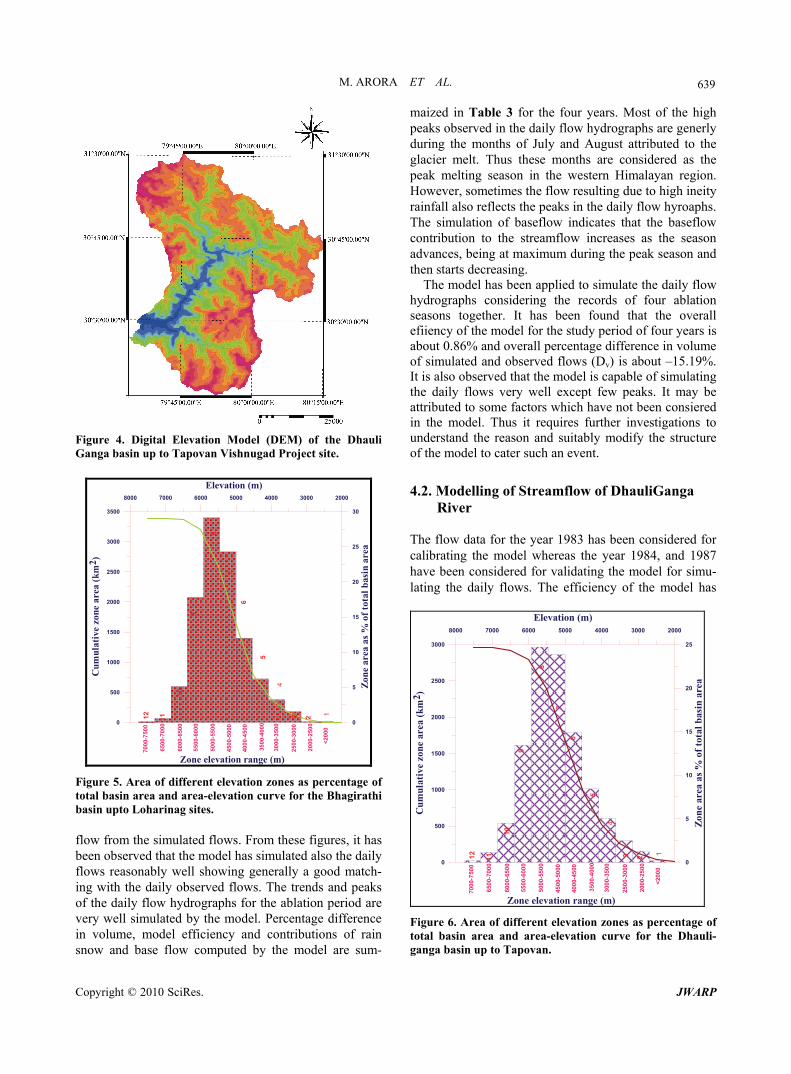
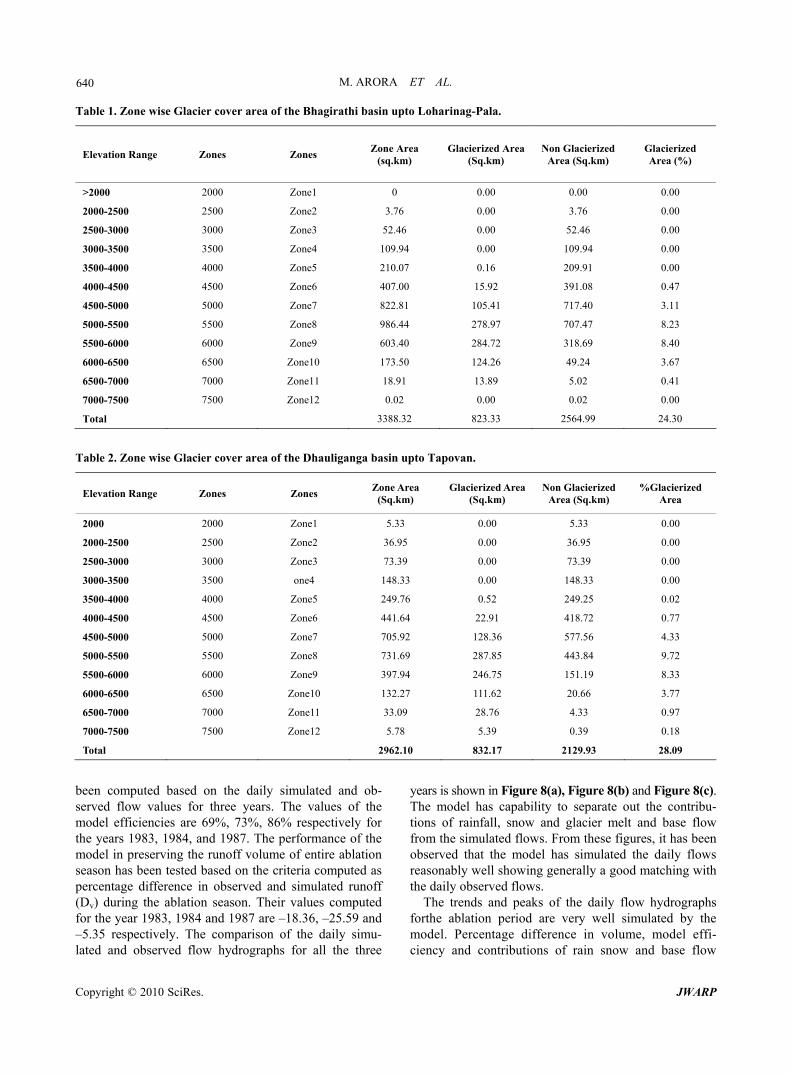
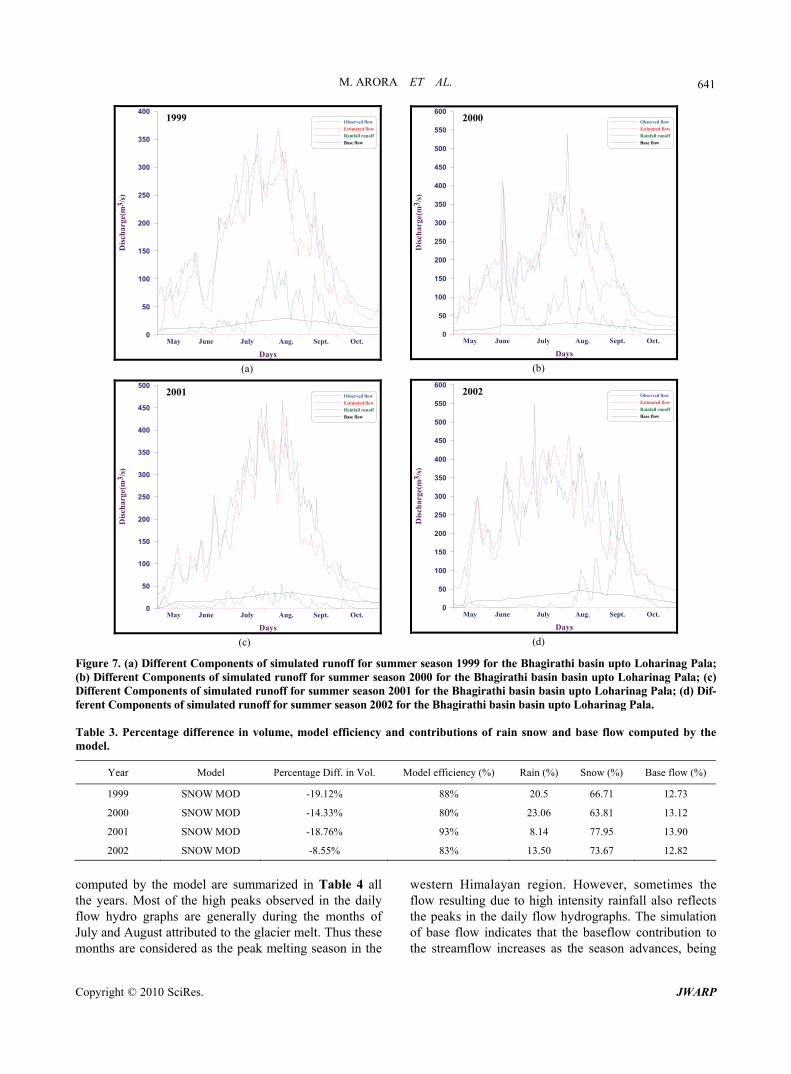
Model(DEM) Digital Elevation Model (DEM) of the catchment area of Bhagirathi River and River Dhauli Ganga is developed using DEM from SRTM, GLOBE DEM in IMAGINE ERDAS 8.6 (Figures 3 and 4). The DEM of the study area is quite helpful in defining the catchments boundary, identifying the stream network, estimating the average slope etc. The satellite remote sensing data provide a synoptic view of the catchments area and can provide the details about the physiographic features present in the catchments area. In the present study, IRS-LISS III data were used for determining the snow covered area of the catchments. 3.2. Mapping of Glacier Cover The study region falls in the Higher or Greater Himala- yas and constitutes of crystalline throughout. Topog- raphic maps at scale 1:25000 and 1:50,000 scales have been used for georeferencing of remote sensing images. The glacier cover boundary and area were also estimated. The percentage wise elevation zones with respect to catchment area for Bhagirathi and DhauliGanga basin is given in Figures 5 and 6 respectively and the zone wise Glaciated area is given in Tables 1 and 2 (such evalua-tion data should be given in the results section, here just tell the readers how do you get the percentage wise ele-vation zones). Determination of snow cover area:
The snow cover area is determined using IRS LISS III satellite images. The daily snow cover area values are extrapolated from the depletion curves prepared from the available data.
Figure 3. Digital Elevation Model (DEM) of the Bhagirathi basin upto Loharinag Pala H.E. Project study area. 3.3. Simulation of Flows The conceptual snow melt model SNOWMOD is used for the simulation of flows. The description of model is given in Singh and Jain [11] Model variables are to be derived from actual observations of temperature, pre-cipitation and snow covered area.
4. Results 4.1. Modeling of Streamflow of Bhagirathi River. The SNOWMOD model has been applied for simulating the daily flows for the ablation season for Loharinag Pala site in the River Bhagirathi four years. The flow data for the year 1999 has been considered for calibrating the model whereas the year 2000, 2001, and 2002 have been considered for validating the model. The efficiency of the model has been computed based on the daily simu-lated and observed flow values for four years. The values of the model efficiencies are 88%, 80%, 93% and 83% respectively for the years 1999, 2000, 2001 and 2002. The performance of the model in preserving the runoff volume of entire ablation season has been tested based on the criteria computed as percentage difference in ob served and simulated runoff (Dv) during the ablation season. Their values computed for the year 1999, 2000, 2001 and 2002 are –19.12%, –14.33%, –18.76% and –8.55% respectively. The comparison of the daily year is shown in Figure 7(a), Figure 7(b), Figure 7(c) and Figure 7(d) the model has capability to separate out the simu lated and observed flow hydrographs for the all contributions of rainfall, snow and glacier melt and base
Copyright © 2010 SciRes. JWARP
M. ARORA ET AL.
639
Figure 4. Digital Elevation Model (DEM) of the Dhauli Ganga basin up to Tapovan Vishnugad Project site.
Zone elevation range (m)
0
5
10
15
20
25
30
Zon
e ar
ea a
s %
of
tota
l bas
in a
rea
8000 7000 6000 5000 4000 3000 2000
Elevation (m)
0
500
1000
1500
2000
2500
3000
3500
Cum
ulat
ive
zone
are
a (k
m2 )
123
4
5
6
7
8
9
10
1112
<2000
2000-2500
2500-3000
3000-3500
3500-4000
4000-4500
4500-5000
5000-5500
5500-6000
6000-6500
6500-7000
7000-7500
Figure 5. Area of different elevation zones as percentage of total basin area and area-elevation curve for the Bhagirathi basin upto Loharinag sites. flow from the simulated flows. From these figures, it has been observed that the model has simulated also the daily flows reasonably well showing generally a good match-ing with the daily observed flows. The trends and peaks of the daily flow hydrographs for the ablation period are very well simulated by the model. Percentage difference in volume, model efficiency and contributions of rain snow and base flow computed by the model are sum-
maized in Table 3 for the four years. Most of the high peaks observed in the daily flow hydrographs are generly during the months of July and August attributed to the glacier melt. Thus these months are considered as the peak melting season in the western Himalayan region. However, sometimes the flow resulting due to high ineity rainfall also reflects the peaks in the daily flow hyroaphs. The simulation of baseflow indicates that the baseflow contribution to the streamflow increases as the season advances, being at maximum during the peak season and then starts decreasing.
The model has been applied to simulate the daily flow hydrographs considering the records of four ablation seasons together. It has been found that the overall efiiency of the model for the study period of four years is about 0.86% and overall percentage difference in volume of simulated and observed flows (Dv) is about –15.19%. It is also observed that the model is capable of simulating the daily flows very well except few peaks. It may be attributed to some factors which have not been consiered in the model. Thus it requires further investigations to understand the reason and suitably modify the structure of the model to cater such an event.
4.2. Modelling of Streamflow of DhauliGanga
River The flow data for the year 1983 has been considered for calibrating the model whereas the year 1984, and 1987 have been considered for validating the model for simu- lating the daily flows. The efficiency of the model has
Zone elevation range (m)
0
5
10
15
20
25
Zon
e ar
ea a
s %
of
tota
l bas
in a
rea
8000 7000 6000 5000 4000 3000 2000
Elevation (m)
0
500
1000
1500
2000
2500
3000
Cu
mu
lati
ve z
one
area
(km
2 )
123
4
5
6
7
8
9
10
1112
<2000
2000-2500
2500-3000
3000-3500
3500-4000
4000-4500
4500-5000
5000-5500
5500-6000
6000-6500
6500-7000
7000-7500
Figure 6. Area of different elevation zones as percentage of total basin area and area-elevation curve for the Dhauli-anga basin up to Tapovan. g
Copyright © 2010 SciRes. JWARP
M. ARORA ET AL.
Copyright © 2010 SciRes. JWARP
640 Table 1. Zone wise Glacier cover area of the Bhagirathi basin upto Loharinag-Pala.
Elevation Range Zones Zones Zone Area
(sq.km) Glacierized Area
(Sq.km) Non Glacierized
Area (Sq.km) Glacierized Area (%)
>2000 2000 Zone1 0 0.00 0.00 0.00
2000-2500 2500 Zone2 3.76 0.00 3.76 0.00
2500-3000 3000 Zone3 52.46 0.00 52.46 0.00
3000-3500 3500 Zone4 109.94 0.00 109.94 0.00
3500-4000 4000 Zone5 210.07 0.16 209.91 0.00
4000-4500 4500 Zone6 407.00 15.92 391.08 0.47
4500-5000 5000 Zone7 822.81 105.41 717.40 3.11
5000-5500 5500 Zone8 986.44 278.97 707.47 8.23
5500-6000 6000 Zone9 603.40 284.72 318.69 8.40
6000-6500 6500 Zone10 173.50 124.26 49.24 3.67
6500-7000 7000 Zone11 18.91 13.89 5.02 0.41
7000-7500 7500 Zone12 0.02 0.00 0.02 0.00
Total 3388.32 823.33 2564.99 24.30
Table 2. Zone wise Glacier cover area of the Dhauliganga basin upto Tapovan.
Elevation Range Zones Zones Zone Area
(Sq.km) Glacierized Area
(Sq.km) Non Glacierized
Area (Sq.km) %Glacierized
Area
2000 2000 Zone1 5.33 0.00 5.33 0.00
2000-2500 2500 Zone2 36.95 0.00 36.95 0.00
2500-3000 3000 Zone3 73.39 0.00 73.39 0.00
3000-3500 3500 one4 148.33 0.00 148.33 0.00
3500-4000 4000 Zone5 249.76 0.52 249.25 0.02
4000-4500 4500 Zone6 441.64 22.91 418.72 0.77
4500-5000 5000 Zone7 705.92 128.36 577.56 4.33
5000-5500 5500 Zone8 731.69 287.85 443.84 9.72
5500-6000 6000 Zone9 397.94 246.75 151.19 8.33
6000-6500 6500 Zone10 132.27 111.62 20.66 3.77
6500-7000 7000 Zone11 33.09 28.76 4.33 0.97
7000-7500 7500 Zone12 5.78 5.39 0.39 0.18
Total 2962.10 832.17 2129.93 28.09
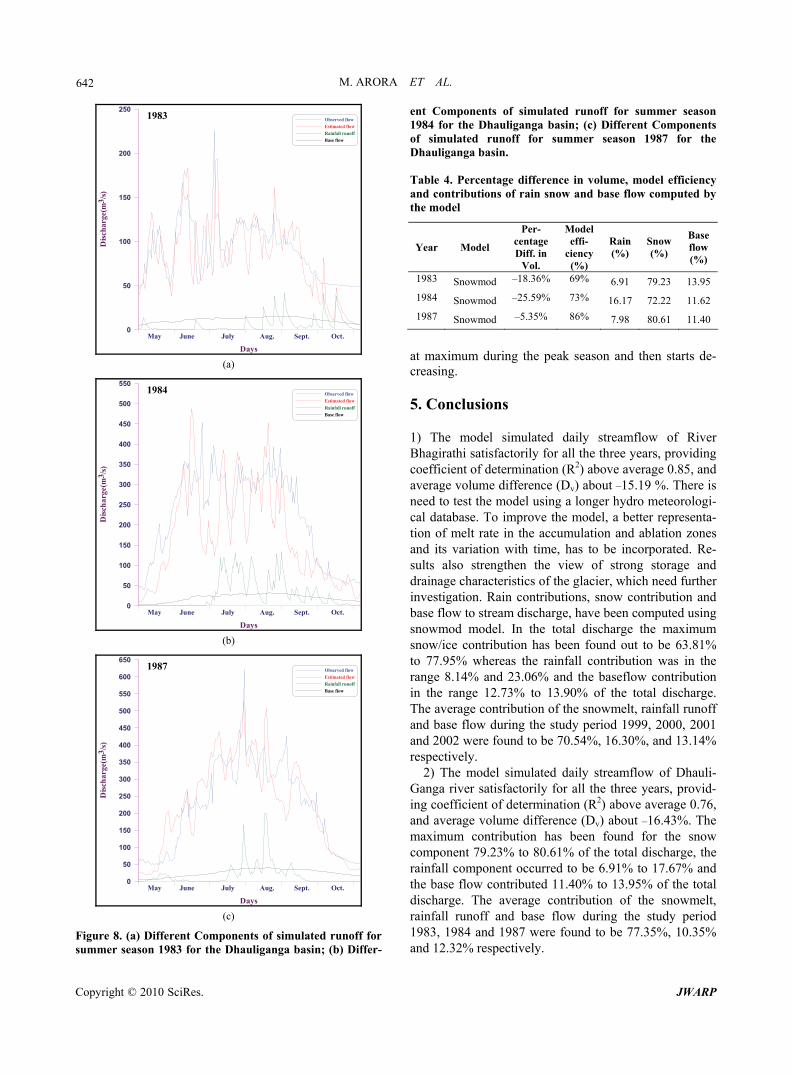
been computed based on the daily simulated and ob- served flow values for three years. The values of the model efficiencies are 69%, 73%, 86% respectively for the years 1983, 1984, and 1987. The performance of the model in preserving the runoff volume of entire ablation season has been tested based on the criteria computed as percentage difference in observed and simulated runoff (Dv) during the ablation season. Their values computed for the year 1983, 1984 and 1987 are –18.36, –25.59 and –5.35 respectively. The comparison of the daily simu- lated and observed flow hydrographs for all the three
years is shown in Figure 8(a), Figure 8(b) and Figure 8(c). The model has capability to separate out the contribu-tions of rainfall, snow and glacier melt and base flow from the simulated flows. From these figures, it has been observed that the model has simulated the daily flows reasonably well showing generally a good matching with the daily observed flows.
The trends and peaks of the daily flow hydrographs forthe ablation period are very well simulated by the model. Percentage difference in volume, model effi-iency and contributions of rain snow and base flow c
M. ARORA ET AL.
Copyright © 2010 SciRes. JWARP
641
Days
0
50
100
150
200
250
300
350
400
Dis
char
ge(m
3 /s)
Observed flow
Estimated flow
Rainfall runoff
Base flow
1999
May June July Aug. Sept. Oct.
(a)
Days
0
50
100
150
200
250
300
350
400
450
500
Dis
char
ge(m
3 /s)
Observed flow
Estimated flow
Rainfall runoff
Base flow
2001
May June July Aug. Sept. Oct.
(c)
Days
0
50
100
150
200
250
300
350
400
450
500
550
600
Dis
char
ge(m
3 /s)
Observed flow
Estimated flow
Rainfall runoff
Base flow
2000
May June July Aug. Sept. Oct.
(b)
Days
0
50
100
150
200
250
300
350
400
450
500
550
600
Dis
char
ge(m
3 /s)
Observed flow
Estimated flow
Rainfall runoff
Base flow
2002
May June July Aug. Sept. Oct.
(d)
Figure 7. (a) Different Components of simulated runoff for summer season 1999 for the Bhagirathi basin upto Loharinag Pala; (b) Different Components of simulated runoff for summer season 2000 for the Bhagirathi basin basin upto Loharinag Pala; (c) Different Components of simulated runoff for summer season 2001 for the Bhagirathi basin basin upto Loharinag Pala; (d) Dif-ferent Components of simulated runoff for summer season 2002 for the Bhagirathi basin basin upto Loharinag Pala. Table 3. Percentage difference in volume, model efficiency and contributions of rain snow and base flow computed by the model.
Year Model Percentage Diff. in Vol. Model efficiency (%) Rain (%) Snow (%) Base flow (%)
1999 SNOW MOD -19.12% 88% 20.5 66.71 12.73
2000 SNOW MOD -14.33% 80% 23.06 63.81 13.12
2001 SNOW MOD -18.76% 93% 8.14 77.95 13.90
2002 SNOW MOD -8.55% 83% 13.50 73.67 12.82
computed by the model are summarized in Table 4 all the years. Most of the high peaks observed in the daily flow hydro graphs are generally during the months of July and August attributed to the glacier melt. Thus these
onths are considered as the peak melting season in the
western Himalayan region. However, sometimes the flow resulting due to high intensity rainfall also reflects the peaks in the daily flow hydrographs. The simulation of base flow indicates that the baseflow contribution to the streamflow increases as the season advances, being m
M. ARORA ET AL.
642
Days
0
50
100
150
200
250D
isch
arge
(m3 /
s)
Observed flow
Estimated flow
Rainfall runoff
Base flow
1983
May June July Aug. Sept. Oct.
(a)
Days
0
50
100
150
200
250
300
350
400
450
500
550
Dis
char
ge(m
3 /s)
Observed flow
Estimated flow
Rainfall runoff
Base flow
1984
May June July Aug. Sept. Oct.
(b)
Days
0
50
100
150
200
250
300
350
400
450
500
550
600
650
Dis
char
ge(m
3 /s)
Observed flow
Estimated flow
Rainfall runoff
Base flow
1987
May June July Aug. Sept. Oct.
(c)
Figure 8. (a) Different Components of simulated runoff for summer season 1983 for the Dhauliganga basin; (b) Differ-
ent Components of simulated runoff for summer season 1984 for the Dhauliganga basin; (c) Different Components of simulated runoff for summer season 1987 for the Dhauliganga basin. Table 4. Percentage difference in volume, model efficiency and contributions of rain snow and base flow computed by the model
Year Model
Per-centage Diff. in
Vol.
Model effi-
ciency (%)
Rain (%)
Snow (%)
Base flow (%)
1983 Snowmod –18.36% 69% 6.91 79.23 13.95
1984 Snowmod –25.59% 73% 16.17 72.22 11.62
1987 Snowmod –5.35% 86% 7.98 80.61 11.40
at maximum during the peak season and then starts de-creasing.
5. Conclusions
1) The model simulated daily streamflow of River Bhagirathi satisfactorily for all the three years, providing coefficient of determination (R2) above average 0.85, and average volume difference (Dv) about –15.19 %. There is need to test the model using a longer hydro meteorologi-cal database. To improve the model, a better representa-tion of melt rate in the accumulation and ablation zones and its variation with time, has to be incorporated. Re-sults also strengthen the view of strong storage and drainage characteristics of the glacier, which need further investigation. Rain contributions, snow contribution and base flow to stream discharge, have been computed using snowmod model. In the total discharge the maximum snow/ice contribution has been found out to be 63.81% to 77.95% whereas the rainfall contribution was in the range 8.14% and 23.06% and the baseflow contribution in the range 12.73% to 13.90% of the total discharge. The average contribution of the snowmelt, rainfall runoff and base flow during the study period 1999, 2000, 2001 and 2002 were found to be 70.54%, 16.30%, and 13.14% respectively.
2) The model simulated daily streamflow of Dhauli-Ganga river satisfactorily for all the three years, provid-ing coefficient of determination (R2) above average 0.76, and average volume difference (Dv) about –16.43%. The maximum contribution has been found for the snow component 79.23% to 80.61% of the total discharge, the rainfall component occurred to be 6.91% to 17.67% and the base flow contributed 11.40% to 13.95% of the total discharge. The average contribution of the snowmelt, rainfall runoff and base flow during the study period 1983, 1984 and 1987 were found to be 77.35%, 10.35% and 12.32% respectively.
Copyright © 2010 SciRes. JWARP
M. ARORA ET AL.
643
6. References [1] V. K. Raina and D. Srivastava, “Glacier Atlas of India,”
Geological Society of India, Bangalore, 2008, p. 315.
[2] P. Kasser, “Fluctuation of Glaciers (1959-1965),” United Nations Educational, Scientific and Cultural Organization, Paris, 1967.
[3] P. Singh, S. K. Jain and N. Kumar, “Estimation of Snow and Glacier-Melt Contribution to the Chenab River, Western Himalaya,” Mountain Research Development, Vol. 17, No. 1, 1997, pp. 49-56.
[4] P. Singh and S. K. Jain, “Snow and Glacier Melt in the Satluj River at Bhakra Dam in the Western Himalayan Region,” Hydrological Sciences, Vol. 47, No. 1, 2002, pp. 93-106.
[5] V. Kumar, P. Singh and V. Singh, “Snow and Glacier Melt Contribution in the Beas River at Pandoh Dam, Hi-machal Pradesh, India,” Hydrological Sciences Journal, Vol. 52, No. 2, 2007, pp. 376-388.
[6] “Runoff Evaluation and Streamflow Simulation by Computer,” Part II, US Army of Engineers, North Pacific
Division, Portland, 1971.
[7] E. A. C. Anderson, “The National Weather Service River Forecast System- Snow Accumulation and Ablation Model,” National Oceanic and Atmospheric Administra-tion, Washington, D.C., 1973.
[8] S. Finsterwalder and H. Schunk, “Der Suldenferner,” Oesterreichischer Alpenverein, Vol. 18, 1987, pp. 72-89.
[9] J. Martinec, A. Rango and R. Roberts, “Snowmelt Runoff Model (SRM) User’s Manual (Version 3.0),” In: M. Baumgartner, Ed., Department of Geography, University of Bern, Switzerland, 1994.
[10] M. C. Quick and A. Pipes, “UBC Watershed Model Manual (Version 4.0),” University of British Columbia, Vancouver, 1995.
[11] P. Singh and V. P. Singh, “Snow and Glacier Hydrol-ogy,” Kluwer, Dordrecht, 2001.
[12] P. Singh and S. K. Jain, “Modelling of Streamflow and its Components for a Large Himalayan Basin with Predo- minant Snowmelt Yield,” Hydrological Sciences, Vol. 48, No. 2, 2003, pp. 257-276.
Copyright © 2010 SciRes. JWARP