Embed Size (px)
Citation preview

1119
ESTIMATION OF MAXIMUM RESIDUE LEVELS FOR PESTICIDES IN/ON SPICES
First draft prepared by Árpád Ambrus, Centre for Plant Protection and Soil Conservation Service,
Hungary EXPLANATION The setting of MRLs for spices was discussed by the CCPR on several occasions. At the 35th Session there was considerable discussion on the spice industry’s proposal to include dried chili peppers in the list of spices under Group 028 of the FAO Classification of Foods and Feeds. The CCPR noted that “MRLs existed for fresh chili peppers and other peppers for a number of pesticides and that GAP and trial data were required to establish MRLs for those commodities”.
The 36th Session agreed that chili peppers fell outside the definition of spices for the purposes of setting Codex MRLs. However it requested the JMPR to review the existing MRLs on peppers with a view to setting MRLs for dried chili peppers using processing/dehydration factors as appropriate (ALINORM 04/07/24). The industry was encouraged to submit to the JMPR any processing study that would support the derivation of such dehydration factor(s).
Furthermore the CCPR recommended that for the establishment of MRLs for spices based on monitoring data (ALINORM 04/24):
• The commodity group 028 for spices be divided into sub-groups, and that MRLs should be set for these instead of for each of the pesticide/spice combinations.
• MRLs for spices could be established for pesticides that are already in the Codex system. The 2002 JMPR prepared guidelines for the format of submission of monitoring data for evaluation. The Indian Spice Board, the American Spice Trade Association (ASTA), the European Spice Association (ESA), and the government of Egypt provided data from pesticide monitoring programmes carried out from 1996 to 2003, and the delegation of South Africa co-ordinated the submission of the results to the JMPR.
The spice trade industry (IOSTA) provided the JMPR with the rationale for the use of the dehydration or concentration factor for estimating residues of pesticides in chili peppers derived from residues in fresh peppers. Note: the term “dehydration factor” used by some authorities is the same as “concentration factor”, i.e. the degree of concentration of the residues after drying. The JMPR reviewed the reported data and estimated maximum residue levels for the spice sub-groups and for dried chili peppers based on the MRLs for peppers (VO 0051, VO 0444, VO 0445) adhering as closely as possible to the agreed criteria set forth by the CCPR. Assessment of monitoring data The residue data reported were obtained from the analysis of random spice samples submitted by exporting countries before shipment or by importing countries upon arrival of the consignments. No details were given of the sampling frequency or procedures or sample sizes.
The ESA also submitted residue data for several commodities that are not in the current Group 028 classification.

spices, pesticide residues in
1120
Analytical methods The samples were analysed by ASTA and India by the multi-residue procedures summarised below in Table 1. Typical mean recoveries and limits of quantification, LOQs, are given in Tables 2 and 3. Table 1. Multi-residue methods used in the monitoring programmes of ASTA and India.
Pesticides Analytical method Summary
Organophosphorus (OP)
U.S. Food and Drug Administration Pesticide Analytical Manual (FDA PAM) Vol.1, 3rd Edition, 1997, E4 and C5)
Extraction: acetone-water Clean-up: Florisil Detection: capillary GC with NP detector (PAM DG 17)
Organochlorine (OC)
Official Methods of AOAC International, Vol. 1, 17th Edition, 2000. Method 970.52
Extraction: acetonitrile-water Clean-up: sulfuric acid Detection: capillary GC with ECD detector (PAM DG 13)
Pyrethroid (PY) Official Methods of AOAC International, Vol. 1, 17th Edition, 2000. Method 970.52
Extraction: acetonitrile-water Clean-up: Florisil (PAM C5) Detection: capillary GC with ECD detector (PAM DG 10)
Table 2. Average recovery data for four years.
Pesticide Spike level, mg/kg Recovery, % Acephate 0.2 70 Azinphos-methyl 0.2 150 Chlorpyrifos 0.6 72 Cypermethrin 0.2 100 Diazinon 0.2 100 Dichlorvos 0.2 95 Dimethoate 0.2 100 Disulfoton 0.2 100 Endosulfan 0.05 102 Ethion 0.2 150 Fenitrothion 0.6 72 Malathion 0.6 72 Methamidophos 0.2 95 Mevinphos 0.2 105 Parathion 0.6 72 Parathion-methyl 0.2 100 Permethrin 0.05 118 Phorate 0.2 100 Pirimiphos-methyl 0.6 72 Quintozene 0.05 102
Table 3. Reported limits of quantification.
Pesticide ESA (mg/kg) ASTA/India (mg/kg) Acephate 0.02 0.2 Azinphos-methyl 0.1 0.5 Chlorpyrifos 0.05 0.05 Cypermethrin 0.05 0.05 Diazinon 0.05 0.1 Dichlorvos (DDVP) 0.1 0.1 Dimethoate 0.05 0.1 Disulfoton 0.05 0.05 Endosulfan 0.1 0.03 Ethion 0.05 0.1 Fenitrothion 0.05 0.1 Malathion 0.05 0.1

spices, pesticide residues in
1121
Pesticide ESA (mg/kg) ASTA/India (mg/kg) Methamidophos 0.01 0.1 Methyl parathion 0.1 0.1 Mevinphos 0.05 0.2 Parathion 0.1 0.1 Permethrin 0.05 0.05 Phorate 0.05 0.1 Pirimiphos-methyl 0.05 0.1 Quintozene 0.01 0.01
The spice samples in Egypt were analysed by a modified version of the AOAC Official Methods of Analysis (985.22, 1995). Dry samples of herbs, spices and cereals, which might contain considerable amounts of oils, were mixed with de-ionized water (10 g/50 ml). The analyses were then carried out for high-moisture samples. The residues in purified extracts were separated on apolar and medium polarity capillary columns and quantified with NP detectors. The average recoveries ranged from 80 to 106% with a relative standard deviation of <20%. The reported LOQs were between 0.05 and 0.5 mg/kg depending on the compound and sample.
Selection of residue data for evaluation With the agreed 2004 CCPR criteria as a basis, the following data collation and preliminary analysis process was followed in deciding upon the list of pesticides for consideration of MRLs on spices.
� Only pesticides already in the Codex system were considered.
� Pesticides with national registrations on any commodity in either the exporting or importing country were included.
� Persistent pesticides that have been banned for use in crop protection (e.g. DDT, Aldrin, Heptachlor, Endrin, etc.) were excluded.
� Only residues on the spices in the modified Group 028 were considered. For example, data for herbs, dried onions, chilies, etc. were excluded.
� As poppy seed (SO 0698), mustard seeds (SO 0090) and sesame seed (SO 0700) are used as a major food ingredient in several countries, they were not considered among spices.
� Only those data bases were considered which included at least 58-59 data points (satisfying the 95th percentile coverage with 95% confidence), preferably for more than one sub-group of spices. Exceptions to this minimum requirement were made when all residues were below the LOQ. The 95% confidence limit was chosen as it better reflects usual practice and is also used as a criterion for establishing the variability factor for acute exposure assessment.
Nineteen organophosphorus, three organochlorine, two dicarboximide, one acylalanine, one
carbamate and two synthetic pyrethroid pesticides were selected for the establishment of MRLs on spices. The selected compounds, the numbers of the Tables containing details of the residues of the selected compounds are given in Table 4. Table 4. Pesticides selected for the establishment of MRLs for spices.
Pesticide Table no. Acephate 5 Azinphos-methyl 6 Chlorpyrifos 7 Chlorpyrifos-methyl 8 Cypermethrin 9

spices, pesticide residues in
1122
Pesticide Table no. Diazinon 10 Dichlorvos 11 Dicofol 12 Dimethoate 13 Disulfoton 14 Endosulfan 15 Ethion 16 Fenitrothion 17 Iprodione 18 Malathion 19 Metalaxyl 20 Methamidophos 21 Mevinphos 22 Parathion 23 Parathion-methyl 24 Permethrin 25 Phenthoate 26 Phorate 27 Phosalone 28 Pirimicarb 29 Pirimiphos-methyl 30 Quintozene 30 Vinclozolin 31
Each summary Table shows the origin of the spices, the year the data were compiled, the number and range of residues detected, the total number of samples for each sub-group, the highest residue (HR) and the median residue, which can be used in the same way as the STMR derived from supervised trials. In the Tables the residue values reported as “0” are replaced by “<LOQ”, the median was calculated from all reported residue values including <LOQ, and no data point was considered as an outlier. Table 5. Summary of monitoring data for acephate residues in spices.
Spice Residues (mg/kg) 1,2 Group Name
Country/ Year(s) No. Median Max Detections
Seed Anise Canada, 1999 Syria, 2002-2003 Turkey, 1999-2003
15 <0.2 <0.2 0
Seed Celery seed India, 1999-2003 EU, 1996-1998
8 <0.11 <0.2 0
Seed Coriander Bulgaria, 1999 EU, 1996-1998 Canada, 1992
10 <0.02 <0.2 0
Seed Cumin EU., 1996-1998 India, 2000 Pakistan, 2000 Syria, 2001-2003 Turkey, 1999-2003
20 <0.2 <0.2 0
Seed Dill seed Australia, 1999 Canada, 1999/2001 India, 1999-2003
10 <0.2 <0.2 0
Seed Fennel seed EU, 1998 India, 2002-2003
5 <0.2 <0.2 0
spices, pesticide residues in
1123
Spice Residues (mg/kg) 1,2 Group Name
Country/ Year(s) No. Median Max Detections
Seed Fenugreek Canada, 2003 India, 2001-2003
4 <0.2 <0.2 0
Seed Nutmeg Guatemala, 2002-2003 Indonesia, 2000-2003 EU, 1998
7 <0.2 <0.2 0
SEEDS TOTAL 1996-2003 79 0.2 0.2 0 Fruit or berry Allspice Jamaica, 1999
Mexico, 2003 EU, 1996-1998
4 <0.11 <0.2 0
Fruit or berry Caraway US, 2000-2001 EU, 1996-1998
12 <0.02 <0.2 0
Fruit or berry Cardamom India, 2001 EU, 1996-1998 Guatemala, 2001-2003
10 <0.02 <0.2 0
Fruit or berry Juniper EU, 1998 2 <0.02 <0.02 0 Fruit or berry Pepper, black,
white, pink EU, 1996-1998; Brazil, 2001-2002 Ecuador, 1999 India, 2000-2003 Indonesia, 2001-2003 Malaysia, 2003 New Guinea, 1999 Vietnam, 1999-2002
48 <0.02 <0.2 0
Fruit or berry Vanilla EU, 1998 1 <0.02 <0.02 0 FRUITS TOTAL 1996-2003 77 0.2 0.2 0 Roots/ Rhizome Ginger China, 2001;
EU, 1996-1998 India, 2000-2001
30 <0.02 <0.2 0
Roots/ Rhizome Turmeric Brazil, 2003 EU, 1996-1998 India, 1999 Vietnam, 2003
12 <0.02 <0.2 0
ROOTS TOTAL 1996-2003 42 0.02 0.2 0 Bark Cassia EU, 1998
Indonesia, 1999 Vietnam, 2001-2003
4 <0.2 <0.2 0
Bark Cinnamon EU, 1996–1998 Vietnam, 2001-2003
10 <0.2 <0.2 0
Buds Cloves Brazil, 2002 Madagascar, 99-2000
4 <0.2 <0.2 0
Aril Mace EU, 1996-1998 India, 2001-2003 Indonesia, 2002
9 <0.2 <0.2 0
BARK, BUDS, ARIL
TOTAL, MISC- 1996-2003 27 0.2 0.2 0
1 Method described in Table 2 for organophosphorus screening. 2 LOQ 0.2 mg/kg for data from ASTA and India; 0.02 for data from EU. Table 6. Summary of monitoring data for azinphos-methyl residues in spices.
Spice Residues (mg/kg) 1, 2 Group Name
Country/ Year(s) No. Median Max Detections
Seed Anise Canada, 1999; Syria, 2002-2003 Turkey, 1999-2003 EU, 1998
16 <0.5 <0.5 0
Seed Celery seed EU, 1996-1998 India, 1999-2003
8 <0.3 <0.5 0
Seed Coriander Bulgaria, 1999 Canada, 1999 EU, 1996-1998
11 <0.1 <0.5 0

spices, pesticide residues in
1124
Spice Residues (mg/kg) 1, 2 Group Name
Country/ Year(s) No. Median Max Detections
Seed Cumin EU, 1996-1998 India, 2000 Pakistan, 2000 Syria, 2001-2003 Turkey, 1999-2003
24 <0.5 <0.5 0
Seed Dill seed Australia, 1999 Canada, 1999 India, 1999-2003
8 <0.5 <0.5 0
Seed Fennel seed EU, 1996-19998 India, 2002-2003
7 <0.1 <0.5 0
Seed Fenugreek Canada, 2000 India, 2001-2003 EU, 1996-1998
5 <0.5 <0.5 0
Seed Nutmeg Guatemala, 2002 –2003 EU, 1998 Indonesia, 2000-2003 US-2001
7 <0.5 <0.5 0
SEEDS TOTAL 1996-2003 86 0.5 0.5 0 Fruit or berry Allspice EU, 1996-1998
Jamaica, 1999 Mexico, 2002
6 <0.1 <0.5 0
Fruit or berry Caraway US, 2000 15 <0.1 <0.5 0 Fruit or berry Cardamom EU, 1996-1998
Guatemala, 2002-2003 India, 2001
10 <0.1 <0.5 0
Fruit or berry Juniper EU, 1998 2 <0.1 <0.1 0 Fruit or berry Pepper, black,
white, pink EU, 1996-1998 Brazil, 2001-2002 Ecuador, 1999 India, 2000-2003 Indonesia, 2001-2003 Malaysia, 2003 New Guinea, 1999 Vietnam, 1999-2002
58 <0.1 <0.5 0
Fruit or berry Vanilla EU, 1998 1 <0.1 <0.1 0 FRUITS TOTAL 1996-2003 92 0.1 0.5 0 Roots/ Rhizome
Ginger China, 2001 EU, 1996-1998 India, 2000-2001
32 <0.1 <0.5 0
Roots/ Rhizome
Turmeric EU, 1996-1998 India, 1999 Vietnam, 2003
14 <0.1 <0.5 0
ROOTS TOTAL 1996-2003 46 0.1 0.5 0 Aril Mace India, 2001-2003
Indonesia, 2002 EU, 1996-1998
10 <0.1 <0.5 0
Bark Cassia EU, 1996-1998 Indonesia, 1999 Vietnam, 2001-2003
12 <0.1 <0.5 0
Bark Cinnamon EU, 1996-1998 Vietnam, 2000-2003
10 <0.1 <0.5 0
Buds Cloves Madagascar, 1999 –2000 Brazil, 2002
4 <0.5 <0.5 0
BARK, BUDS, ARIL
TOTAL, MISC- 1996-2003 36 0.1 0.5 0
1 Method described in Table 1 for organophosphorus screening. 2 LOQ 0.5 mg/kg for data from ASTA and India; 0.1 for data from EU.

spices, pesticide residues in
1125
Table 7. Summary of monitoring data for chlorpyrifos residues in spices.
Spice Residues (mg/kg) 1, 2 Group Name
Country/ Year(s) No. Median Max Detections
Canada, 1999 EU, 1996-1998 Syria, 2002-2003 Turkey, 1999-2003
18 0.05 0.05 0.05 Seed Anise
Egypt 1996-2001 744 0.05 3.6 0.01, 0.01, 0.05, ( 11) , 0.06 (7), 0.07 (8), 0.08, (9), 0.09 (4), 0.1, 0.1, 0.11 (3), 0.13 (6), 0.14 (6), 0.15, 0.17, 0.17, 0.18, 0.21 (3), 0.22, 0.23, 0.32, 0.33, 0.36, 0.5, 0.5, 0.54, 0.9, 1.8, 2, 3, 3.6
Seed Celery seed EU, 1996-1998 India, 1999-2003
55 <0.05 0.18 0.18
Seed Coriander Bulgaria, 1999 Canada, 1999 EU, 1996-1998 India, 2000
49 <0.05 0.41 0.25, 0.41
Seed Cumin EU, 1996-1998 India, 2000-2003 Pakistan, 2000 Syria, 2001-2003 Turkey, 1999-2003
39 <0.05 0.54 0.12, 0.15, 0.16, 0.26, 0.44, 0.54 0.54
Seed Dill seed Australia, 1999 Canada, 1999-2001 EU, 1996-1998 India, 1999-2003
19 <0.05 <0.05 0
Seed Fennel seed EU, 1996-1998 India, 2002-2003
9 <0.05 <0.05 0
Egypt 1219
<0.05 1.4 0.05, 0.05, 0.06, 0.07, 0.08, 0.1, 0.1, 0.11 (5), 0.13, 0.14, 0.15,
0.22, 0.22, 1.4 Seed Fenugreek India, 2001-2003
Canada, 2000 5 <0.05 <0.05 0
Seed Nutmeg EU, 1996-1998 Guatemala, 2002-2003 India, 2003 Indonesia, 2000-2003 US, 2001
8 <0.05 <0.05 0
SEEDS TOTAL 1996-2003 2165
0.05 3.6 124/ (0.01-3.6)
Fruit or berry
Allspice EU, 1996-1998 Jamaica, 1999 Mexico, 2002
7 <0.05 <0.05 0
Fruit or berry
Caraway US, 2000-2002 EU, 1996-1998
18 <0.05 <0.05 0
Fruit or berry
Cardamom EU, 1996-1998 Guatemala, 2001-2003 India, 2001-2003
14 <0.05 0.11 0.05, 0.06, 0.07, 0.11
Fruit or berry
Juniper EU, 1996-1998 5 <0.05 <0.05 0
Fruit or berry
Pepper, black, white, pink
EU, 1996-1998 India, 2001-2002 Brazil, 2001-2002 Ecuador, 1999 Indonesia, 2001-2003 Malaysia, 2003 New Guinea, 1999 Vietnam, 1999-2002
104 <0.05 0.71 0.05, 0.08, 0.20, 0.54
0.71
Fruit or berry
Vanilla EU, 1996-1998 7 <0.05 <0.05 0
FRUITS TOTAL 1996-1998 155 0.05 0.71 9/ (0.05-0.71)

spices, pesticide residues in
1126
Spice Residues (mg/kg) 1, 2 Group Name
Country/ Year(s) No. Median Max Detections
Roots/ Rhizome
Ginger EU, 1996-1998 China, 2001 India, 2000-2003
127 <0.05 0.37 0.05, 0.24, 0.28, 0.31, 0.37
Roots/ Rhizome
Turmeric Brazil, 2003 India, 2000-2003 Vietnam, 2003 EU, 1996-1998
143 <0.05 0.72 0.13, 0.72
ROOTS TOTAL 1996-2003 270 0.05 0.72 7/ (0.05-0.72)
Bark Cassia EU, 1996-1998 Indonesia, 1999 Vietnam, 2001-2003
12 <0.05 0.05 0.05
Bark Cinnamon EU, 1996-1998 India, 2003 Vietnam, 2000-2003
15 <0.05 0.05 0.05, 0.05
Buds Cloves Madagascar, 1999-2000 Brazil, 2002 India, 2003
5 <0.05 <0.05 0
Aril Mace India, 2001-2003 EU, 1996-1998 Indonesia, 2002
10 <0.05 <0.05 0
BARK, BUDS, ARIL
TOTAL, MISC-
1996-2003 42 0.05 0.05 3/ (0.05)
1 Method as described in Table 2 for organophosphorus screening. 2 LOQ 0.05 mg/kg for data from all sources.
Table 8. Summary of monitoring data for chlorpyrifos-methyl residues in spices.
Spice Residues (mg/kg) 1.2 Group Name
Country/ Year(s) No. Median Max
Detections
EU 3 0.05 0.02, 0.02 Seed Anise Egypt, 1996-2001 980 <0.05 0.39 0.05, 0.05, 0.06 (4), 0.07, 0.07,
0.08 (6), 0.09 (8), 0.1 (5), 0.11, 0.12, 0.12, 0.13 (3), 0.14, 0.15, 0.15, 0.16 (4), 0.17, 0.18, 0.18, 0.19, 0.2, 0.2, 0.22 (3), 0.24, 0.24, 0.25, 0.28, 0.3, 0.31, 0.32, 0.38, 0.39
Seed Celery seed EU 49 <0.05 0.05 0.01 Seed Coriander EU 19 <0.05 0.05 0.01 Seed Cumin EU
Turkey 1999-2003 24 <0.05 0.05 0
Seed Dill seed EU 8 <0.05 0.05 0 Fennel seed 6 <0.05 0.05 0 Seed
EU Egypt, 1996-2001 339 <0.05 0.16 0.16, 0.12, 0.08, 0.07 EU 2 0.050 0 Seed Nutmeg Indonesia 2000-2003 2 0.050 0
SEEDS TOTAL 1432 <0.05 0.39 66(0.01-0.39) Fruit or berry Allspice EU 5 <0.05 0.05 0 Fruit or berry Caraway EU
Egypt, 1996-2001 13
143 <0.05 0.05
0.1
0.06, 0.12 Fruit or berry Cardamom EU 8 <0.05 0.05 0 Fruit or berry Juniper EU 5 <0.05 0.05 0 Fruit or berry Pepper EU 42 <0.05 0.05 0.01 Fruit or berry Vanilla EU 7 <0.05 0.05 0 FRUITS TOTAL 223 4(0.01-0.12) Roots/Rhizome Ginger EU 22 0.077 2.93 0.03, 0.03, 0.031, 0.034, 0.034,
0.037, 0.050, 0.060, 0.070, 0.071, 0.073, 0.082, 0.089,

spices, pesticide residues in
1127
Spice Residues (mg/kg) 1.2 Group Name
Country/ Year(s) No. Median Max
Detections
0.091, 0.098, 0.135, 0.138, 0.138, 0.161, 0.294, 0.390, 2.93
Roots/Rhizome Turmeric EU 120 <0.01 0.038 0.013 (12), 0.017, 0.038 ROOTS TOTAL 142 0.01 2.93 36/0.013-0.038 Bark Cassia EU 9 <0.05 0.05 0.05 Bark Cinnamon EU 10 <0.05 0.05 0.05, 0.05 Aril Mace EU 6 <0.05 0.05 0 BARK, BUDS,
ARIL TOTAL 25 0.05 0.05 2(0.05)
1 Method as described in Table 2 for organophosphorus screening. 2 LOQ 0.05 mg/kg for data from all sources. Table 9. Summary of monitoring data for cypermethrin residues in spices.
Spice Residues (mg/kg) 1 Group Name
Country/ Year(s) No. Median Max Detections
Seed Anise EU, 1998 1 <0.05 <0.05 0 Seed Bishop’s weed India, 2003 1 <0.05 <0.05 0 Seed Celery seed EU, 1996-1998
India, 2002 6 <0.05 0.93 0.93
Seed Coriander India, 2001-2003 10 <0.05 0.15 0.15 Seed Cumin India, 2001-2003
Turkey, 1999-2003 10 <0.05 0.142 0.142
Seed Dill seed India, 2002 2 <0.05 0.076 0.076 Seed Fennel seed EU, 1996-1998
India, 2003 4 <0.05 <0.05 0
Seed Fenugreek India, 2001 2 <0.05 0.085 0.085 Seed Nutmeg Indonesia, 2000-2003 2 <0.05 <0.05 0 SEEDS TOTAL 1996-2003 38 0.05 0.93 5/
(0.076-0.93) Fruit or berry Allspice EU, 1996-1998 4 <0.05 <0.05 0 Fruit or berry Cardamom India, 2003 2 <0.05 <0.05 0 Fruit or berry Juniper EU, 1996 1 <0.05 <0.05 0 Fruit or berry Pepper, black,
white, pink EU, 1996-1998 India, 2001-2003
57 <0.05 0.065 0.065
Fruit or berry Vanilla EU, 1998 1 <0.05 <0.05 0 FRUITS TOTAL 1996-1998 65 0.05 0.065 1(0.065) Roots/ Rhizome
Ginger EU, 1996-1998 India, 2001-2003
6 <0.05 0.05 0.05
Roots/ Rhizome
Turmeric India, 2000-2003 52 <0.05 0.118 0.11, 0.12
ROOTS TOTAL 1996-2003 58 0.05 0.118 3/ (0.05–0.12)
Bark Cassia EU, 1996-1998 8 <0.05 <0.05 0 Bark Cinnamon EU, 1996-1998
India, 2003 4 <0.05 <0.05 0
Aril Mace EU, 1998 1 <0.05 <0.05 0 BARK, BUDS, ARIL
TOTAL, MISC- 1996-2003 13 0.05 <0.05 0
1 LOQ 0.05 mg/kg for data from all sources.

spices, pesticide residues in
1128
Table 10. Summary of monitoring data for diazinon residues in spices.
Spice Residues (mg/kg) 1, 2 Group Name
Country/ Year(s) No. Median Max Detections
Canada, 1999 EU, 1996-1998 Syria, 2002-2003 Turkey, 1999-2003
18 <0.1 <0.1 0 Seed Anise
Egypt, 1996-2001 667 <0.05 3.6 0.05, 0.06 (4), 0.07, 0.08, 0.08, 0.09 (3), 0.1, 0.1, 0.11, 0.12, 0.12, 0.13, 0.14 (4), 0.15 (3), 0.16, 0.16, 0.17 (4), 0.18, 0.18, 0.19 (3), 0.21, 0.22, 0.24, 0.28, 0.3, 0.32, 0.32, 0.33, 0.33, 0.35, 0.37, 0.39, 0.41, 0.42, 0.42, 0.47, 0.473, 0.48, 0.51, 0.59, 0.6, 0.82, 0.88, 0.9, 1.1, 1.1, 1.2, 1.3, 1.8, 1.8, 2.1, 2.7, 3.5, 3.6
Seed Celery seed EU, 1996-1998 India, 1999-2003
53 <0.05 0.29 0.1, 0.14, 0.29
Seed Coriander Bulgaria, 1999 Canada, 1999 EU, 1996-1998
28 <0.05 <0.1 0
Seed Cumin EU, 1996-1998 India, 2000 Pakistan, 2000 Syria, 2001-2003 Turkey, 2000-2003
21 <0.1 0.1 0.1
Seed Dill seed Australia, 1999 Canada, 1999-2001 EU, 1996-1999 India, 1999-2003
18 <0.1 <0.1 0
EU, 1996-1998 India, 2002-2003
9 <0.05 <0.1 0 Seed Fennel seed
Egypt, 1996-2001 734 0.06 (3), 0.05, 0.05, 0.07, 0.07, 0.07, 0.08, 0.08, 0.1, 0.1, 0.1, 0.12, 0.17, 0.17, 0.19, 0.2, 0.21, 0.23, 0.24, 0.24, 0.26, 0.45, 0.59, 0.65, 0.72, 0.76, 0.77, 1.2, 1.7
Seed Fenugreek Canada, 2000 India, 2001-2003
4 <0.1 <0.1 0
Seed Nutmeg EU, 1998 Guatemala, 2002-2003 Indonesia, 2000-2003 US, 2001
7 <0.1 <0.1 0
SEEDS TOTAL 1996-2003 1559 0.05 1.7 104/ (0.05-3.6)
Fruit or berry Allspice EU, 1996-1998 Jamaica, 1999 Mexico, 2002
7 <0.05 <0.1 0
Fruit or berry Caraway EU, 1996-1998 US, 2000
18 <0.05 <0.1 0
Fruit or berry Cardamom EU, 1996-1998 Guatemala, 2001-2003 India, 2001
12 <0.05 <0.1 0
Fruit or berry Juniper EU, 1996-1998 5 <0.05 <0.05 0 Fruit or berry Pepper,
black, white, pink
EU, 1996-1998 Brazil, 2001-2002 Ecuador, 1999 India, 2000-2003 Indonesia, 2001-2003 New Guinea, 1999 Malaysia, 2003 Vietnam, 1999-2003
66 <0.05 <0.1 0
Fruit or berry Vanilla EU, 1996-1998 7 <0.05 <0.05 0 FRUITS TOTAL 1996-2003 115 0.05 0.1 0

spices, pesticide residues in
1129
Spice Residues (mg/kg) 1, 2 Group Name
Country/ Year(s) No. Median Max Detections
Roots/ Rhizome
Ginger EU, 1996-1998 India, 2000-2003 China, 2001
121 <0.05 <0.1 0
Roots/ Rhizome
Turmeric Brazil, 2003 EU, 1996-1998 India, 1999 Vietnam, 2003
113 <0.05 0.26 0.23, 0.26
ROOTS TOTAL 1996-2003 234 0.05 0.26 2/ (0.23-0.26)
Bark Cassia EU, 1996-1998 Indonesia, 1999 Vietnam, 2001-2003
12 <0.05 <0.1 0
Bark Cinnamon EU, 1996-1998 Vietnam, 2000-2003
14 <0.05 <0.1 0
Bud Cloves Madagascar, 1999-2000 Brazil, 2002
4 <0.1 <0.1 0
Aril Mace EU, 1996-1998 India, 2001-2003 Indonesia, 2002
10 <0.05 <0.1 0
BARK, BUDS, ARIL
TOTAL, MISC-
1996-2003 40 0.05 0.1 0
1 Method as described in Table 2 for organophosphorus screening. 2 LOQ 0.1 mg/kg for data from ASTA and India; 0.05 mg/kg for data from Egypt and EU. Table 11. Summary of monitoring data for dichlorvos residues in spices.
Spice Residues (mg/kg) 1, 2 Group Name
Country/ Year(s) No. Median Max Detections
Seed Anise Canada, 1999 EU, 1996-1998 Syria, 2002-2003 Turkey, 1999-2003
16 <0.1 <0.1 0
Seed Celery seed EU, 1996-1998 India, 1999-2003
8 <0.1 <0.1 0
Seed Coriander Bulgaria, 1999 Canada, 1999 EU, 1996-1998
14 <0.1 <0.1 0
Seed Cumin EU, 1996-1998 India, 2000 Pakistan, 2000 Syria, 2001-2003 Turkey, 2000-2003
18 <0.1 <0.1 0
Seed Dill seed Australia, 1999 Canada, 1999-2001 India, 1999-2003
10 <0.1 <0.1 0
Seed Fennel seed EU, 1996-1998 India, 2002-2003
7 <0.1 <0.1 0
Seed Fenugreek Canada, 2000 India, 2001-2003
4 <0.1 <0.1 0
Seed Nutmeg EU, 1998 Guatemala, 2002-2003 Indonesia, 2000-2003 US, 2001
7 <0.1 <0.1 0
SEEDS TOTAL 1996-2003 84 0.1 0.1 0 Fruit or berry Allspice EU, 1996-1998
Jamaica, 1999 Mexico, 2002
6 <0.1 <0.1 0
Fruit or berry Caraway EU, 1996-1998 US, 2000
15 <0.1 <0.1 0

spices, pesticide residues in
1130
Spice Residues (mg/kg) 1, 2 Group Name
Country/ Year(s) No. Median Max Detections
Fruit or berry Cardamom EU, 1996-1998 Guatemala, 2001-2003 India, 2001
10 <0.1 <0.1 0
Fruit or berry Juniper EU, 1996-1998 3 <0.1 <0.1 0 Fruit or berry Pepper, black,
white, pink EU, 1996-1998 Brazil, 2001-2002 Ecuador, 1999 India, 2000-2003 Indonesia, 2001-2003 New Guinea, 1999 Malaysia, 2003 Vietnam, 1999-2003
58 <0.1 <0.1 0
Fruit or berry Vanilla EU,1998 1 <0.1 <0.1 0 FRUITS TOTAL 1996-2003 93 0.1 0.1 0 Roots/ Rhizome
Ginger EU, 1996-1998 India, 2000-2003 China, 2001
32 <0.1 <0.1 0
Roots/ Rhizome
Turmeric Brazil, 2003 EU, 1996-1998 India, 1999 Vietnam, 2003
16 <0.1 <0.1 0
ROOTS TOTAL 1996-2003 48 0.1 0.1 0 Bark Cassia EU, 1996-1998
Indonesia, 1999 Vietnam, 2001-2003
12 <0.1 <0.1 0
Bark Cinnamon EU, 1996-1998 Vietnam, 2000-2003
10 <0.1 <0.1 0
Bud Cloves Madagascar, 1999-2000 Brazil, 2002
4 <0.1 <0.1 0
Aril Mace EU, 1996-1998 India, 2001-2003 Indonesia, 2002
10 <0.1 <0.1 0
BARK, BUDS, ARIL
TOTAL, MISC- 1996-2003 36 0.1 0.1 0
1 Method as described in Table 2 for organophosphorus screening. 2 LOQ 0.1 mg/kg for data from all sources.
Table 12. Summary of monitoring data for dicofol residues in spices.
Spice Residues (mg/kg) 1 Group Name
Country/ Year(s) No. Median Max
Detections
Seeds Anis EU 3 0.05 0 Seeds Coriander EU 25 0.05 0 Seeds Cumin EU 18 0.05 0 Seeds Cumin Turkey 1999-2003 5 0.05 0 Seeds Dill seed EU 8 0.05 0 Seeds Fennel EU 6 0.05 0 Seeds Nutmeg Indonesia 1 0.05 0 Seeds Nutmeg Indonesia 1 0.05 0 SEEDS 67 0.05 0.05 0 Fruit or berry Caraway EU 13 0.05 0 Fruit or berry Cardamom EU 18 0.05 0 Fruit or berry Juniper EU 5 0.05 0 Fruit or berry Pepper EU 42 0.05 0.05 Fruit or berry Vanilla EU 7 0.05 0 FRUITS 85 0.05 0.05 1/0.05 Roots Ginger EU 118 0.05 0.05 0.05 Roots Turmeric EU 112 0.05 0.05 0.02. 0.035.
0.036

spices, pesticide residues in
1131
Spice Residues (mg/kg) 1 Group Name
Country/ Year(s) No. Median Max
Detections
ROOTS 230 0.05 0.05 4/0.02-0.05 Bark Cassia EU 18 0.05 0.05. 0.05 Bark Cinnamon EU 10 0.05 0.05, 0.05 Aril Mace EU 6 0.05 0 TOTAL, MISC 34 0.05 0.05 4/0.05
1 LOQ 0.05 mg/kg for data from all sources Table 13. Summary of monitoring data for dimethoate residues in spices.
Spice Residues (mg/kg) 1, 2 Group Name
Country/ Year(s) No. Median Max Detections
Anise Canada, 1999 EU, 1998 Syria, 2002-2003 Turkey, 1999-2003
16 <0.1 <0.1 0 Seed
Egypt, 1996-2001 728 <0.05 3 0.05 (3), 0.06 (5), 0.07 (3), 0.08, 0.08, 0.09, 0.09, 0.1, 0.1, 0.12 (3), 0.13 (3), 0.14, 0.15 (4), 0.17, 0.17, 0.18, 0.24, 0.24, 0.25 (4), 0.27, 0.27, 0.28, 0.28, 0.29, 0.29, 0.32, 0.35, 0.36, 0.39, 0.41, 0.42, 0.43, 0.44, 0.46, 0.53, 0.53, 0.57, 0.62, 0.9, 1.4, 2.5, 3
Seed Celery seed EU, 1996-1998 India, 1999-2003
8 <0.075 <0.1 0
Seed Coriander Bulgaria, 1999 Canada, 1999 EU, 1996-1998 India 2000-2003
29 <0.1 <0.1 0
Seed Cumin EU, 1996-1998 India, 2000-2001 Pakistan, 2000 Syria, 2000-2003 Turkey, 1999-2003
34 <0.1 <0.1 0
Seed Dill seed Australia, 1999 Canada, 1999-2001 India, 1999-2003
10 <0.1 <0.1 0
Seed Fennel seed EU, 1996-1998 India, 2002-2003
7 <0.05 <0.1 0
Egypt, 1996-2001 1277 <0.05 1.4 0.03, 0.05 (4), 0.06 (4), 0.07 (6), 0.08 (4), 0.09 (4), 0.1 (3), 0.11, 0.12, 0.13, 0.14 (3), 0.15 (4), 0.16, 0.18, 0.18, 0.2, 0.2, 0.21, 0.25, 0.25, 0.3, 0.32 (4), 0.33, 0.33, 0.34, 0.35, 0.37, 0.38, 0.38, 0.43, 0.43, 0.51 (4), 0.53, 0.53, 0.54, 0.94, 1.1, 1.4, 1.4
Seed Fenugreek Canada, 2000 India, 2001-2003
5 <0.1 <0.1 0
Seed Nutmeg EU, 1998 Guatemala, 2002-2003 Indonesia, 2000-2003 US, 2001
7 <0.1 <0.1 0
SEEDS TOTAL 1996-2003 2121 0.05 3 130(0.05-3) Fruit or berry Allspice EU, 1996-1998
Jamaica, 1999 Mexico, 2002
6 <0.05 <0.1 0
Fruit or berry Caraway EU, 1996-1998 US, 2000
15 <0.05 <0.1 0
spices, pesticide residues in
1132
Spice Residues (mg/kg) 1, 2 Group Name
Country/ Year(s) No. Median Max Detections
Egypt, 1996-2001 277 <0.05 0.22 0.08, 0.17, 0.17, 0.22, 0.22 Fruit or berry Cardamom EU, 1996-1998
Guatemala, 2001-2003 India, 2001
11 <0.05 <0.1 0
Fruit or berry Pepper, black, white, pink
EU, 1996-1998 Brazil, 2001-2002 Ecuador, 1999 India, 2001-2003 Indonesia, 2001-2003 New Guinea, 1999 Malaysia, 2003 Vietnam, 1999-2002
72 <0.1 <0.1 0
FRUITS TOTAL 1996-2003 381 0.05 0.1 5(0.08-0.22) Roots/ Rhizome
Ginger EU, 1996-1998 India, 2000-2001 China, 2001
35 <0.05 <0.1 0
Roots/ Rhizome
Turmeric Brazil, 2003 EU, 1996-1998 India, 1999-2003 Vietnam, 2003
40 <0.1 <0.1 0
ROOTS TOTAL 1996-2003 75 0.05 0.1 0 Bark Cassia EU, 1996-1998
Indonesia, 1999 Vietnam, 2001-2003
12 <0.05 <0.1 0
Bark Cinnamon EU, 1996-1998 Vietnam, 2000-2003
10 <0.05 <0.1 0
Bud Cloves Madagascar, 1999-2000 Brazil, 2002
4 <0.1 <0.1 0
Aril Mace EU, 1996-1998 India, 2001-2003 Indonesia, 2002
10 <0.05 <0.1 0
BARK, BUDS, ARIL
TOTAL, MISC-
1996-2003 36 0.05 0.1 0
1 Method as described in Table 2 for organophosphorus screening. 2 LOQ 0.1 mg/kg for data from ASTA and India; 0.05 mg/kg for data from EU. Table 14. Summary of monitoring data for disulfoton residues in spices.
Spice Residues (mg/kg) 1, 2 Group Name
Country/ Year(s) No. Median Max Detections
Seed Anise EU, 1998 1 <0.05 <0.05 0 Seed Celery seed EU, 1996-1998 4 <0.05 <0.05 0 Seed Coriander EU, 1996-1998
India 2000-2003 26 <0.05 <0.05 0
Seed Cumin EU, 1996-1998 India, 2000-2001 Turkey, 1999-2003
25 <0.05 <0.05 0
Seed Fennel seed EU, 1996-1998 4 <0.05 <0.05 0 Seed Fenugreek India, 2001 1 <0.05 <0.05 0 Seed Nutmeg EU, 1998
Indonesia, 2000-2003 6 <0.05 <0.05 0
SEEDS TOTAL 1996-2003 67 0.05 0.05 0 Fruit or berry Caraway EU, 1996-1998 10 <0.05 <0.05 0 Fruit or berry Cardamom EU, 1996-1998
India, 2001 7 <0.05 <0.05 0
Fruit or berry Pepper, black, white, pink
EU, 1996-1998 49 <0.05 <0.05 0
FRUITS TOTAL 1996-2003 66 0.05 0.05 0 Roots/ Rhizome
Ginger EU, 1996-1998 India, 2001
32 <0.05 <0.05 0

spices, pesticide residues in
1133
Spice Residues (mg/kg) 1, 2 Group Name
Country/ Year(s) No. Median Max Detections
Roots/ Rhizome
Turmeric EU, 1996-1998 India, 2000-2003
37 <0.05 <0.05 0
ROOTS TOTAL 1996-2003 69 0.05 0.05 0 Bark Cassia EU, 1996-1998 9 <0.05 <0.05 0 Bark Cinnamon EU, 1996-1998 6 <0.05 <0.05 0 Aril Mace EU, 1996-1998 6 <0.05 <0.05 0 BARK, ARIL TOTAL, MISC- 1996-2003 21 0.05 0.05 0
1 Method as described in Table 2 for organophosphorus screening. 2 LOQ 0.05 mg/kg for data from all sources. Table 15. Summary of monitoring data for endosulfan residues in spices.
Spice Residues (mg/kg) 1 Group Name
Country/ Year(s) No. Median Max Detections
Seed Anise EU, 1996-1998 Canada, 1999 Syria, 2002-2003 Turkey, 1999-2003
18 <0.03 <0.03 0
Seeds Bishop’s weed
India, 2000-2002 7 <0.03 <0.03 0
Seed Celery seed EU, 1996-1998 India, 2000– 2002
56 <0.1 0.20 0.1 (10), 0.12, 0.14, 0.20
Seed Coriander Bulgaria, 1999 Canada, 1999 EU, 1996-1998 India 2000-2003
95 <0.03 0.34 0.1, 0.34
Seed Cumin EU, 1996-1998 India, 2000-2003 Pakistan, 2000 Syria, 2001-2002 Turkey, 1999-2003
75 <0.03 0.63 0.035, 0.035, 0.038, 0.63
Seed Dill seed Australia, 1999 Canada, 1999-2001 EU, 1996-1998 India, 1999-2003
20 <0.03 0.45 0.45
Seed Fennel seed EU, 1996-1998 India, 2000-2003
38 <0.03 <0.1 0
Seed Fenugreek Canada, 2000 India, 2000-2003
15 <0.03 <0.03 0
Seed Nutmeg Guatemala, 2002-2003 Indonesia, 2000-2001 EU, 1998 US, 2001
7 <0.03 <0.1 0
SEEDS TOTAL 1996-2003 331 0.03 0.63 20/ (0.035-0.63)
Fruit or berry Allspice Jamaica, 1999 Mexico, 2002, EU, 1996-1998
7 <0.1 <0.1 0
Fruit or berry Caraway EU, 1996-1998 US, 2000
18 <0.1 <0.1 0
Fruit or berry Cardamom Guatemala, 2001-2003 EU, 1996-1998 India, 2000-2003
28 <0.085 0.12 0.04, 0.075, 0.081, 0.089, 0.092, 0.093,
0.10, 0.12 Fruit or berry Juniper EU, 1996-1998 5 <0.1 <0.1 0

spices, pesticide residues in
1134
Spice Residues (mg/kg) 1 Group Name
Country/ Year(s) No. Median Max Detections
Fruit or berry Pepper, black, white, pink
Brazil, 2001-2002 Ecuador, 1999 EU, 1996-1998 India, 2000-2003 Indonesia, 2001-2003 Malaysia, 2003 New Guinea, 1999 Vietnam, 1999-2003
143 <0.03 3.2 0.031, 0.086 0.11, 0.12, 0.12, 3.1,
3.2
Fruit or berry Vanilla EU, 1996-1998 7 <0.03 <0.03 0 FRUITS TOTAL 1996-2003 208 0.03 3.2 15/
(0.031-3.2) Roots/ Rhizome
Ginger China, 2001 EU, 1996-1998 India, 2000-2003
154 <0.1 0.24 0.084, 0.24
Roots/ Rhizome
Turmeric Brazil, 2003 EU, 1996-1998 India, 1999-2003 Vietnam, 2003
247 <0.1 0.1 0.038, 0.041, 0.061, 0.1
ROOTS TOTAL 1996-2003 401 0.1 0.24 6/ (0.038-0.24)
Bark Cassia EU, 1996-1998 Indonesia, 1999 Vietnam, 2001-2003
12 <0.1 <0.1 0
Bark Cinnamon EU, 1996-1998 Vietnam, 2001-2003
14 <0.1 <0.1 0
Buds Cloves Brazil, 2002 Madagascar, 2001-2003
4 <0.03 <0.03 0
Aril Mace EU, 1996-1998 7 <0.1 <0.1 0 BARK, BUDS, ARIL
TOTAL, MISC-
1996-2003 41 0.1 0.1 0
1 LOQ 0.03 mg/kg for data from ASTA and India; 0.1 mg/kg for data from ESA.
Table 16. Summary of monitoring data for ethion residues in spices.
Spice Residues (mg/kg) 1, 2 Group Name
Country/ Year(s) No. Median Max Detections
Seed Anise Canada, 1999 EU, 1998 Syria, 2002-2003 Turkey, 1999-2003
18 <0.1 1.8 1.8
Seed Celery seed EU, 1996-1998 India, 1999-2003
55 <0.05 <0.1 0
Seed Coriander Bulgaria, 1999 Canada, 1999 EU, 1996-1998 India 2000-2003
49 <0.1 0.21 0.21
Seed Cumin EU, 1996-1998 India, 2000-2001 Pakistan, 2000 Syria, 2000-2003 Turkey, 1999-2003
35 <0.1 0.13 0.11, 0.13
Seed Dill seed Australia, 1999 Canada, 1999-2001 India, 1999-2003
11 <0.1 <0.1 0
Seed Fennel seed EU, 1996-1998 India, 2002-2003
9 <0.05 <0.1 0
Seed Fenugreek Canada, 2000 India, 2001-2003
5 <0.1 <0.1 0

spices, pesticide residues in
1135
Spice Residues (mg/kg) 1, 2 Group Name
Country/ Year(s) No. Median Max Detections
Seed Nutmeg EU, 1998 Guatemala, 2002-2003 India, 2003 Indonesia, 2000-2003 US, 2001
8 <0.1 <0.1 0
SEEDS TOTAL 1996-2003 190 <0.1 1.8 4/ (0.11-1.8)
Fruit or berry Allspice EU, 1996-1998 Jamaica, 1999 Mexico, 2002
7 <0.05 <0.05 0
Fruit or berry Caraway EU, 1996-1998 US, 2000
18 <0.05 <0.1 0
Fruit or berry Cardamom EU, 1996-1998 Guatemala, 2001-2003 India, 2001
14 <0.1 0.12 0.12
Fruit or berry Juniper EU, 1996-1998 5 <0.05 <0.05 0 Fruit or berry Pepper, black,
white, pink EU, 1996-1998 Brazil, 2001-2002 Ecuador, 1999 India, 2001-2003 Indonesia, 2001-2003 New Guinea, 1999 Malaysia, 2003 Vietnam, 1999-2003
104 <0.1 3.1 0.33, 3.1
Fruit or berry Vanilla EU, 1996-1998 7 <0.05 <0.05 0 FRUITS TOTAL 1996-2003 155 <0.1 3.1 3/
(0.12-3.1) Roots/ Rhizome
Ginger China, 2001 EU, 1996-1998 India, 2000-2003
224 <0.05 0.15 0.11, 0.15
Roots/ Rhizome
Turmeric Brazil, 2003 EU, 1996-1998 India, 1999-2003 Vietnam, 2003
143 <0.05 <0.1 0
ROOTS TOTAL 1996-2003 367 <0.05 0.15 2/ (0.11-0.15)
Bark Cassia EU, 1996-1998 Indonesia, 1999 Vietnam, 2001-2003
12 <0.05 <0.1 0
Bark Cinnamon EU, 1996-1998 Vietnam, 2000-2003 India, 2003
15 <0.05 <0.1 0
Buds Cloves Madagascar, 1999-2000 Brazil, 2002 India, 2003
5 <0.1 <0.1 0
Aril Mace EU, 1996-1998 India, 2001-2003 Indonesia, 2002
10 <0.05 <0.1 0
BARK, BUDS, ARIL
TOTAL, MISC- 1996-2003 42 <0.05 <0.1 0
1 Method as described in Table 2 for organophosphorus screening. 2 LOQ 0.1 mg/kg for data from ASTA and India; 0.05 mg/kg for data from ESA. Table 17. Summary of monitoring data for fenitrothion residues in spices.
Spice Residues (mg/kg) 1 Group Name
Country/ Year(s) No. Median Max Detections
Seed Anise Canada, 1999 EU, 1998 Syria, 2002-2003 Turkey, 1999-2003
18 <0.05 <0.1 0

spices, pesticide residues in
1136
Spice Residues (mg/kg) 1 Group Name
Country/ Year(s) No. Median Max Detections
Egypt, 1996-2001 756 0.05 5.4 0.05, 0.08, 0.08, 0.1, 0.12, 0.12, 0.13, 0.15, 0.25, 0.4, 0.4, 0.41, 0.41, 0.87, 0.88, 1, 1, 1, 1.4, 1.4, 2, 5.4
Seed Celery seed EU, 1996-1998 India, 1999-2003
53 <0.05 0.168 0.168
Seed Coriander Bulgaria, 1999 Canada, 1999 EU, 1996-1998
28 <0.05 1.45 1.45
Seed Cumin EU, 1996-1998 India, 2000-2001 Pakistan, 2000 Syria, 2000-2003 Turkey, 1999-2003
28 <0.1 0.19 0.19
Seed Dill seed Australia, 1999 Canada, 1999-2001 EU, 1996-1998 India, 1999-2003
18 <0.1 <0.1 0
EU, 1996-1998 India, 2002-2003
9 <0.05 <0.1 0 Seed Fennel seed
Egypt, 1996-2001 999 0.05, 0.05, 0.09, 0.09, 0.09, 0.1, 0.22
Seed Fenugreek Canada, 2000 India, 2001-2003
4 <0.1 <0.1 0
Seed Nutmeg EU, 1998 Guatemala, 2002-2003 India, 2003 Indonesia, 2000-2003 US, 2001
7 <0.1 <0.1 0
SEEDS TOTAL 1996-2003 1920 0.05 5.4 32/ (0.05-5.4)
Fruit or berry Allspice EU, 1996-1998 Jamaica, 1999 Mexico, 2002
7 <0.1 <0.1 0
Fruit or berry Caraway EU, 1996-1998 US, 2000
20 <0.05 0.40 0.10, 0.40
Egypt 1996-2001 113 <0.05 0.12 0.05, 0.12 Fruit or berry Cardamom EU, 1996-1998
Guatemala, 2001-2003 India, 2001
12 <0.05 <0.1 0
Fruit or berry Juniper EU, 1996-1998 5 <0.05 <0.05 0 Fruit or berry Pepper,
black, white, pink
EU, 1996-1998 Brazil, 2001-2002 Ecuador, 1999 India, 2001-2003 Indonesia, 2001-2003 New Guinea, 1999 Malaysia, 2003 Vietnam, 1999-2003
66 <0.05 <0.1 0
Fruit or berry Vanilla EU, 1996-1998 7 <0.05 <0.05 0 FRUITS TOTAL 1996-2003 230 0.05 0.40 4/
(0.10-0.40) Roots/ Rhizome
Ginger China, 2001 EU, 1996-1998 India, 2000-2003
121 <0.05 <0.1 0
Roots/ Rhizome
Turmeric Brazil, 2003 EU, 1996-1998 India, 1999-2003 Vietnam, 2003
113 <0.05 <0.1 0

spices, pesticide residues in
1137
Spice Residues (mg/kg) 1 Group Name
Country/ Year(s) No. Median Max Detections
ROOTS TOTAL 1996-2003 234 0.05 0.1 0 Bark Cassia EU, 1996-1998
Indonesia, 1999 Vietnam, 2001-2003
12 <0.05 <0.1 0.1
Bark Cinnamon EU, 1996-1998 Vietnam, 2000-2003
14 <0.05 <0.1 0.1
Buds Cloves Madagascar, 1999-2000 Brazil, 2002
4 <0.1 <0.1 0.1
Aril Mace EU, 1996-1998 India, 2001-2003 Indonesia, 2002
10 <0.05 <0.1 0.1
BARK, BUDS, ARIL
TOTAL, MISC-
1996-2003 40 0.05 0.1 0.1
1 Method as described in Table 2 for organophosphorus screening. 2 LOQ 0.1 mg/kg for data from ASTA and India; 0.05 mg/kg for data from ESA. Table 18. Summary of monitoring data for iprodione residues in spices.
Spice Residues (mg/kg) 1.2 Group Name
Country/ Year(s) No. Median Max
Detections
Seeds Cumin Turkey 1999.-2003. 5 0.05 0 Mustard seed Canada 2000. 1 0.05 0 Nutmeg Indonesia 2003. 1 0.05
Nutmeg Indonesia 2000. 1 0.05 0 Anise EU 3 0.05 0 Cumin EU 7 0.05 0 Dill seed EU 8 0.05 0 Fennel seed EU 5 0.05 0 Coriander seed EU 16 0.05 0 Celery seed EU 46 0.05 0 SEEDS TOTAL 93 0.05 0.05 0 Fruits Caraway EU 7 0.05 0 Cardamom EU 2 0.05 0 Juniper berries EU 2 0.05 0 Pepper EU 1 0.05 0.05 Pfeffer EU 20 0.05 0 Vanila pod EU 6 0.05 0 FRUITS TOTAL 38 0.05 0.05 1(0.05) Roots Ginger EU 92 0.05 0.05 Turmeric EU 100 0.05 0 ROOTS TOTAL 192 0.05 0.05 1(0.05) Cassia EU 6 0.05 0 Cassia, lignea EU 2 0.05 0.05, 0.05 Cinnamon EU 5 0.05 0 Cinnamon EU 2 0.05 0.05, 0.05 Mace EU 1 0.05 0 BARK, BUDS, ARIL TOTAL 16 0.05 0.05 4(0.05)
1 LOQ of 0.05 mg/kg was reported from all sources.

spices, pesticide residues in
1138
Table 19. Summary of monitoring data for malathion residues in spices.
Spice Residues (mg/kg) 1, 2 Group Name
Country/ Year(s) No. Median Max Detections
Seed Anise Canada, 1999 EU, 1996-1998 Syria, 2002-2003 Turkey, 1999-2003
18 <0.1 0.38 0.38
Seed Celery seed EU, 1996-1998 India, 1999-2003
53 <0.05 0.86 0.16, 0.48, 0.86
Seed Coriander Bulgaria, 1999 Canada, 1999 EU, 1996-1998 India 2000-2003
28 <0.05 <0.1 0
Seed Cumin EU, 1996-1998 India, 2000-2001 Pakistan, 2000 Syria, 2000-2003 Turkey, 1999-2003
29 <0.1 0.58 0.16, 0.16, 0.58
Seed Dill seed Australia, 1999 Canada, 1999-2001 EU, 1996-1998 India, 1999-2003
18 <0.1 <0.1 0
Seed Fennel seed EU, 1996-1998 India, 2002-2003 Egypt, 2001-2003
12 0.075 0.22 0.16, 0.18, 0.22
Seed Fenugreek Canada, 2000 India, 2001-2003
4 <0.1 <0.1 0
Seed Nutmeg EU, 1998 Guatemala, 2002-2003 Indonesia, 2000-2003 US, 2001
7 <0.1 0.32 0.32
SEEDS TOTAL 1996-2003 169 0.1 0.86 11/ (0.16-0.86)
Fruit or berry Allspice EU, 1996-1998 Jamaica, 1999 Mexico, 2002
7 <0.05 <0.1 0
Fruit or berry Caraway EU, 1996-1998 US, 2000
18 <0.05 <0.1 0
Egypt 1996-2001 0.05, 0.05, 0.06, 0.06, 0.07, 0.07, 0.07, 0.07, 0.09, 0.09, 0.1, 0.19, 0.26, 0.3, 0.31, 0.33, 0.46
Fruit or berry Cardamom EU, 1996-1998 Guatemala, 2001-2003 India, 2001
12 <0.05 <0.1 0
Fruit or berry Juniper EU, 1996-1998 5 <0.05 <0.05 0 Fruit or berry Pepper, black,
white, pink EU, 1996-1998 Brazil, 2001-2002 Ecuador, 1999 India, 2001-2003 Indonesia, 2001-2003 New Guinea, 1999 Malaysia, 2003 Vietnam, 1999-2003
66 <0.05 0.48 0.1, 0.42, 0.48
Fruit or berry Vanilla EU, 1996-1998 7 <0.05 <0.05 0 FRUITS TOTAL 1996-2003 115 0.05 0.48 3/
(0.1-0.48) Roots/ Rhizome
Ginger China, 2001 EU, 1996-1998 India, 2000-2003
121 <0.05 0.1 0.1

spices, pesticide residues in
1139
Spice Residues (mg/kg) 1, 2 Group Name
Country/ Year(s) No. Median Max Detections
Roots/ Rhizome
Turmeric Brazil, 2003 EU, 1996-1998 India, 1999-2003 Vietnam, 2003
113 <0.05 0.16 0.12, 0.16
ROOTS TOTAL 1996-2003 234 0.05 0.16 3/ (0.1-0.16)
Bark Cassia EU, 1996-1998 Indonesia, 1999 Vietnam, 2001-2003
12 0.075 0.14 0.1, 0.12, 0.14
Bark Cinnamon EU, 1996-1998 Vietnam, 2000-2003
14 <0.05 0.1 0.1, 0.1
Buds Cloves Madagascar, 1999-2000 Brazil, 2002
4 <0.1 <0.1 0.1
Aril Mace EU, 1996-1998 India, 2001-2003 Indonesia, 2002
17 <0.1 2 0.3, 0.48, 0.96, 1.02, 1.04, 1.88, 1.96, 2
BARK, BUDS, ARIL
TOTAL, MISC- 1996-2003 47 0.1 2 14/ (0.1-2)
1 Method as described in Table 2 for organophosphorus screening. 2 LOQ 0.1 mg/kg for data from ASTA and India; 0.05 mg/kg for data from ESA. Table 20. Summary of monitoring data for metalaxyl residues in spices.
Spice Residues (mg/kg) 1 Group Name
Country/ Year(s) No. Median Max Detections
Seed Anise Egypt, 1996-2001 411 <0.05 0.38 0.2, 0.22, 0.4, 0.47, 0.64, 0.65 Seed Fennel seed Egypt, 2001-2003 895 <0.05 3.2 0.17, 0.29, 0.4, 3.2 SEEDS TOTAL 1996-2003 1306 0.1 0.86 10/
(0.2-3.2) 1 LOQ 0.05 mg/kg Table 21. Summary of monitoring data for methamidophos residues in spices.
Spice Residues (mg/kg) 1, 2 Group Name
Country/ Year(s) No. Median Max Detections
Seed Anise Canada, 1999 EU, 1998 Syria, 2002-2003 Turkey, 1999-2003
16 <0.1 <0.1 0
Seed Celery seed EU, 1996-1998 India, 1999-2003
8 <0.055 <0.1 0
Seed Coriander Bulgaria, 1999 Canada, 1999 EU, 1996-1998 India 2000-2003
11 <0.01 <0.1 0
Seed Cumin EU, 1996-1998 India, 2000-2001 Pakistan, 2000 Syria, 2000-2003 Turkey, 1999-2003
23 <0.1 <0.1 0
Seed Dill seed Australia, 1999 Canada, 1999-2001 India, 1999-2003
10 <0.1 <0.1 0
Seed Fennel seed EU, 1996-1998 India, 2002-2003
7 <0.1 <0.1 0
Seed Fenugreek Canada, 2000 India, 2001-2003
4 <0.1 <0.1 0

spices, pesticide residues in
1140
Spice Residues (mg/kg) 1, 2 Group Name
Country/ Year(s) No. Median Max Detections
Seed Nutmeg EU, 1998 Guatemala, 2002-2003 Indonesia, 2000-2003
7 <0.1 <0.1 0
SEEDS TOTAL 1996-2003 86 0.1 0.1 0 Fruit or berry Allspice EU, 1996-1998
Jamaica, 1999 Mexico, 2002
6 <0.01 <0.1 0
Fruit or berry Caraway EU, 1996-1998 US, 2000
15 <0.01 <0.1 0
Fruit or berry Cardamom EU, 1996-1998 Guatemala, 2001-2003 India, 2001
10 <0.01 <0.1 0
Fruit or berry Juniper EU, 1998 2 <0.01 <0.1 0 Fruit or berry Pepper, black,
white, pink EU, 1996-1998 Brazil, 2001-2002 Ecuador, 1999 India, 2001-2003 Indonesia, 2001-2003 New Guinea, 1999 Malaysia, 2003 Vietnam, 1999-2003
58 <0.01 <0.1 0
Fruit or berry Vanilla EU, 1998 1 <0.01 <0.01 0 FRUITS TOTAL 1996-2003 92 0.01 0.1 0 Roots/ Rhizome
Ginger China, 2001 EU, 1996-1998 India, 2000-2003
32 <0.01 <0.1 0
Roots/ Rhizome
Turmeric Brazil, 2003 EU, 1996-1998 India, 1999-2003 Vietnam, 2003
14 <0.01 <0.1 0
ROOTS TOTAL 1996-2003 46 0.01 0.1 0 Bark Cassia EU, 1996-1998
Indonesia, 1999 Vietnam, 2001-2003
12 <0.01 <0.1 0
Bark Cinnamon EU, 1996-1998 Vietnam, 2000-2003
10 <0.01 <0.1 0
Buds Cloves Madagascar, 1999-2000 Brazil, 2002
4 <0.1 <0.1 0
Aril Mace EU, 1996-1998 India, 2001-2003 Indonesia, 2002
10 <0.01 <0.1 0
BARK, BUDS, ARIL
TOTAL, MISC- 1996-2003 36 0.01 0.1 0
1 Method as described in Table 2 for organophosphorus screening. 2 LOQ 0.1 mg/kg for data from ASTA and India; 0.01 mg/kg for data from ESA. Table 22. Summary of monitoring data for mevinphos residues in spices.
Spice Residues (mg/kg) 1, 2 Group Name
Country/ Year(s) No. Median Max Detections
Seed Anise Canada, 1999 EU, 1998 Syria, 2002-2003 Turkey, 1999-2003
17 <0.2 <0.2 0
Seed Celery seed EU, 1996-1998 India, 1999-2003
53 <0.05 2.9 2.9
Seed Coriander Bulgaria, 1999 Canada, 1999 EU, 1996-1998
25 <0.05 <0.2 0

spices, pesticide residues in
1141
Spice Residues (mg/kg) 1, 2 Group Name
Country/ Year(s) No. Median Max Detections
Seed Cumin EU, 1996-1998 India, 2000-2001 Pakistan, 2000 Syria, 2000-2003 Turkey, 1999-2003
27 <0.2 <0.2 0
Seed Dill seed Australia, 1999 Canada, 1999-2001 India, 1999-2003 EU, 1996-1998
18 <0.2 <0.2 0
Seed Fennel seed EU, 1996-1998 India, 2002-2003
9 <0.05 <0.2 0
Seed Fenugreek Canada, 2000 India, 2001-2003
4 <0.2 <0.2 0
Seed Nutmeg EU, 1998 Indonesia, 2000-2003 US, 2001
5 <0.2 <0.2 0
SEEDS TOTAL 1996-2003 158 0.05 2.9 1/ (2.9) Fruit or berry Allspice EU, 1996-1998
Jamaica, 1999 Mexico, 2002
12 <0.05 <0.2 0
Fruit or berry Caraway EU, 1996-1998 US, 2000
44 <0.05 <0.2 0
Fruit or berry Cardamom EU, 1996-1998 Guatemala, 2001-2003 India, 2001
47 <0.05 <0.2 0
Fruit or berry Juniper EU, 1998 4 <0.05 <0.05 0 Fruit or berry Vanilla EU, 1998 7 <0.05 <0.05 0 FRUITS TOTAL 1996-2003 114 0.05 0.2 0 Roots/ Rhizome
Ginger China, 2001 EU, 1996-1998 India, 2000-2003
121 <0.05 0.47 0.21, 0.22, 0.3, 0.37, 0.39, 0.41,
0.47 Roots/ Rhizome
Turmeric Brazil, 2003 EU, 1996-1998 India, 1999-2003 Vietnam, 2003
111 <0.05 0.40 0.2, 0.24, 0.27, 0.34, 0.40
ROOTS TOTAL 1996-2003 232 0.05 0.47 13/ (0.2-0.47)
Bark Cassia EU, 1996-1998 Indonesia, 1999 Vietnam, 2001-2003
12 <0.05 <0.2 0
Bark Cinnamon EU, 1996-1998 Vietnam, 2000-2003
14 <0.05 <0.2 0
Buds Cloves Madagascar, 1999-2000 Brazil, 2002
4 <0.2 <0.2 0
Aril Mace EU, 1996-1998 India, 2001-2003 Indonesia, 2002
10 <0.05 <0.2 0
BARK, BUDS, ARIL
TOTAL, MISC- 1996-2003 40 0.05 0.2 0
1 Method as described in Table 2 for organophosphorus screening. 2 LOQ 0.2 mg/kg for data from ASTA and India; 0.05 mg/kg for data from ESA.

spices, pesticide residues in
1142
Table 23. Summary of monitoring data for parathion residues in spices.
Spice Residues (mg/kg) 1, 2 Group Name
Country/ Year(s) No. Median Max Detections
Seed Anise Canada, 1999 EU, 1998 Syria, 2002-2003 Turkey, 1999-2003
16 <0.1 <0.1 0
Seed Celery seed EU, 1996-1998 India, 1999-2003
8 <0.1 <0.1 0
Seed Coriander Bulgaria, 1999 Canada, 1999 India, 2000-2003 EU, 1996-1998
27 <0.1 <0.1 0
Seed Cumin EU, 1996-1998 India, 2000-2001 Pakistan, 2000 Syria, 2000-2003 Turkey, 1999-2003
34 <0.1 <0.1 0
Seed Dill seed Australia, 1999 Canada, 1999-2001 India, 1999-2003
10 <0.1 <0.1 0
Seed Fennel seed EU, 1996-1998 India, 2002-2003
7 <0.1 <0.1 0
Seed Fenugreek Canada, 2000 India, 2001-2003
5 <0.1 <0.1 0
Seed Nutmeg EU, 1998 Guatemala, 2002-2003 India, 2003 Indonesia, 2000-2003 US, 2001
7 <0.1 <0.1 0
SEEDS TOTAL 1996-2003 114 0.1 0.1 0 Fruit or berry Allspice EU, 1996-1998
Jamaica, 1999 Mexico, 2002
6 <0.1 <0.1 0
Fruit or berry Caraway EU, 1996-1998 US, 2000
15
<0.1 <0.1 0
Fruit or berry Cardamom EU, 1996-1998 Guatemala, 2001-2003 India, 2001
11 <0.1 <0.1 0
Fruit or berry Juniper EU, 1998 3 <0.1 <0.1 0 Fruit or berry Pepper, black,
white, pink EU, 1996-1998 Brazil, 2001-2002 Ecuador, 1999 India, 2001-2003 Indonesia, 2001-2003 New Guinea, 1999 Malaysia, 2003 Vietnam, 1999-2003
69 <0.1 0.1 0.1
Fruit or berry Vanilla EU, 1998 1 <0.1 <0.1 0 FRUITS TOTAL 1996-2003 105 0.1 0.1 1/
(0.1) Roots/ Rhizome
Ginger China, 2001 EU, 1996-1998 India, 2000-2003
35 <0.1 0.1 0.1
Roots/ Rhizome
Turmeric Brazil, 2003 EU, 1996-1998 India, 1999-2003 Vietnam, 2003
39 <0.1 <0.1 0
ROOTS TOTAL 1996-2003 74 0.1 0.1 1(0.1) Bark Cassia EU, 1996-1998
Indonesia, 1999 Vietnam, 2001-2003
12 <0.1 0.1 0.1
spices, pesticide residues in
1143
Spice Residues (mg/kg) 1, 2 Group Name
Country/ Year(s) No. Median Max Detections
Bark Cinnamon EU, 1996-1998 Vietnam, 2000-2003
10 <0.1 0.1 0.1, 0.1
Buds Cloves Madagascar, 1999-2000 Brazil, 2002
4 <0.1 <0.1 0
Aril Mace EU, 1996-1998 India, 2001-2003 Indonesia, 2002
10 <0.1 <0.1 0
BARK, BUDS, ARIL
TOTAL, MISC- 1996-2003 36 0.1 0.1 3(0.1)
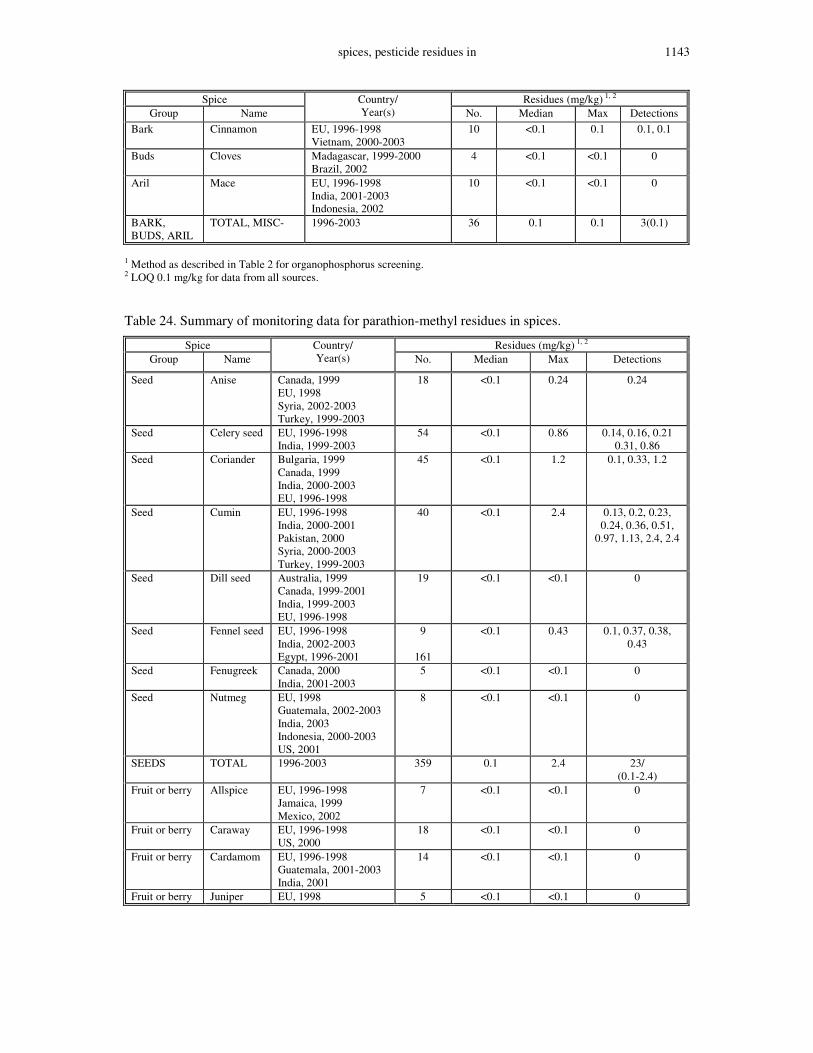
1 Method as described in Table 2 for organophosphorus screening. 2 LOQ 0.1 mg/kg for data from all sources. Table 24. Summary of monitoring data for parathion-methyl residues in spices.
Spice Residues (mg/kg) 1, 2 Group Name
Country/ Year(s) No. Median Max Detections
Seed Anise Canada, 1999 EU, 1998 Syria, 2002-2003 Turkey, 1999-2003
18 <0.1 0.24
0.24
Seed Celery seed EU, 1996-1998 India, 1999-2003
54 <0.1 0.86 0.14, 0.16, 0.21 0.31, 0.86
Seed Coriander Bulgaria, 1999 Canada, 1999 India, 2000-2003 EU, 1996-1998
45 <0.1 1.2 0.1, 0.33, 1.2
Seed Cumin EU, 1996-1998 India, 2000-2001 Pakistan, 2000 Syria, 2000-2003 Turkey, 1999-2003
40 <0.1 2.4 0.13, 0.2, 0.23, 0.24, 0.36, 0.51,
0.97, 1.13, 2.4, 2.4
Seed Dill seed Australia, 1999 Canada, 1999-2001 India, 1999-2003 EU, 1996-1998
19 <0.1 <0.1 0
Seed Fennel seed EU, 1996-1998 India, 2002-2003 Egypt, 1996-2001
9
161
<0.1 0.43 0.1, 0.37, 0.38, 0.43
Seed Fenugreek Canada, 2000 India, 2001-2003
5 <0.1 <0.1 0
Seed Nutmeg EU, 1998 Guatemala, 2002-2003 India, 2003 Indonesia, 2000-2003 US, 2001
8 <0.1 <0.1 0
SEEDS TOTAL 1996-2003 359
0.1 2.4 23/ (0.1-2.4)
Fruit or berry Allspice EU, 1996-1998 Jamaica, 1999 Mexico, 2002
7 <0.1 <0.1 0
Fruit or berry Caraway EU, 1996-1998 US, 2000
18 <0.1 <0.1 0
Fruit or berry Cardamom EU, 1996-1998 Guatemala, 2001-2003 India, 2001
14 <0.1 <0.1 0
Fruit or berry Juniper EU, 1998 5 <0.1 <0.1 0

spices, pesticide residues in
1144
Spice Residues (mg/kg) 1, 2 Group Name
Country/ Year(s) No. Median Max Detections
Fruit or berry Pepper, black, white, pink
EU, 1996-1998 Brazil, 2001-2002 Ecuador, 1999 India, 2001-2003 Indonesia, 2001-2003 New Guinea, 1999 Malaysia, 2003 Vietnam, 1999-2003
104 <0.1 3.4 0.1, 3.4
Fruit or berry Vanilla EU, 1998 7 <0.1 <0.1 0 FRUITS TOTAL 1996-2003 155 0.1 3.4 2/
(0.1-3.4) Roots/ Rhizome
Ginger China, 2001 EU, 1996-1998 India, 2000-2003
126 <0.1 1.2 0.1, 0.14, 1.2
Roots/ Rhizome
Turmeric Brazil, 2003 EU, 1996-1998 India, 1999-2003 Vietnam, 2003
139 <0.1 1.7 0.13, 0.14, 0.15, 0.17, 0.24, 0.3, 1.7
ROOTS TOTAL 1996-2003 265 0.1 1.7 11/ (0.1-1.7)
Buds Cloves Madagascar, 1999-2000 Brazil, 2002 India, 2003
5 <0.1 <0.1 0
Bark Cassia EU, 1996-1998 Indonesia, 1999 Vietnam, 2001-2003
12 <0.1 0.1 0.1
Bark Cinnamon EU, 1996-1998 Vietnam, 2000-2003
15 <0.1 0.1 0.1, 0.1
Aril Mace EU, 1996-1998 India, 2001-2003 Indonesia, 2002
10 <0.1 <0.1 0
BARK, BUDS, ARIL
TOTAL, MISC-
1996-2003 42 0.1 0.1 3/ (0.1)
1 Method as described in Table 2 for organophosphorus screening. 2 LOQ 0.1 mg/kg for data from ASTA and India; 0.05 mg/kg for data from Egypt and ESA.
Table 25. Summary of monitoring data for permethrin residues in spices.
Spice Residues (mg/kg) 1 Group Name
Country/ Year(s) No. Median Max Detectio
ns Seed Anise Canada, 1999
EU, 1998 Syria, 2002-2003 Turkey, 1999-2003
16 <0.05 <0.05 0
Seed Celery seed EU, 1996-1998 India, 1999-2003
5 <0.05 <0.05 0
Seed Coriander Bulgaria, 1999 Canada, 1999
5 <0.05 <0.05 0
Seed Cumin EU, 1996-1998 India, 2000-2001 Pakistan, 2000 Syria, 2000-2003 Turkey, 1999-2003
17 <0.05 <0.05 0
Seed Dill seed Australia, 1999 Canada, 1999-2001 India, 1999-2003
10 <0.05 <0.05 0
Seed Fennel seed EU, 1996-1998 India, 2002-2003
6 <0.05 <0.05 0

spices, pesticide residues in
1145
Spice Residues (mg/kg) 1 Group Name
Country/ Year(s) No. Median Max Detectio
ns Seed Fenugreek Canada, 2000
India, 2001-2003 4 <0.05 <0.05 0
Seed Nutmeg Guatemala, 2002-2003 Indonesia, 2000-2003 US, 2001
5 <0.05 <0.05 0
SEEDS TOTAL 1996-2003 68 0.05 0.05 0 Fruit or berry Allspice EU, 1998
Jamaica, 1999 Mexico, 2002
14 <0.05 <0.05 0
Fruit or berry Caraway EU, 1996-1998 US, 2000
19 <0.05 <0.05 0
Fruit or berry Cardamom Guatemala, 2001-2003 India, 2001
14 <0.05 <0.05 0
FRUITS TOTAL 1996-2003 17 0.05 0.05 0 Roots/ Rhizome
Ginger China, 2001 EU, 1996-1998 India, 2000-2003
6 <0.05 <0.05 0
Roots/ Rhizome
Turmeric Brazil, 2003 EU, 1996-1998 India, 1999 Vietnam, 2003
6 <0.05 <0.05 0
ROOTS TOTAL 1996-2003 12 0.05 0.05 0 Bark Cassia EU, 1996-1998
Indonesia, 1999 Vietnam, 2001-2003
11 <0.05 <0.05 0
Bark Cinnamon EU, 1996-1998 Vietnam, 2000-2003
7 <0.05 <0.05 0
Buds Cloves Madagascar, 1999-2000 Brazil, 2002
4 <0.05 <0.05 0
Aril Mace EU, 1996-1998 India, 2001-2003 Indonesia, 2002
5 <0.05 <0.05 0
BARK, BUDS, ARIL
TOTAL, MISC- 1996-2003 27 0.05 0.05 0
1 LOQ 0.05 mg/kg for data from all sources. Table 26. Summary of monitoring data for phenthoate residues in spices.
Spice Residues (mg/kg) 1 Group Name
Country/ Year(s) No. Median Max Detections
Seed Anise Egypt 2000-2001 415 <0.05 5.2 0.05, 0.19, 0.49, 1.1, 1.1, 1.3, 1.4, 1.4, 5, 5.2
SEEDS TOTAL 1996-2003 415 <0.05 5.2 10/(0.05-5.2) 1 LOQ 0.05 mg/kg for data from all sources. Table 27. Summary of monitoring data for phorate residues in spices.
Spice Residues (mg/kg) 1, 2 Group Name
Country/ Year(s) No. Median Max Detections
Seed Anise Canada, 1999 Syria, 2002-2003 Turkey, 1999-2003
15 <0.1 <0.1 0
Seed Celery seed EU, 1996-1998 India, 1999-2003
9 <0.1 <0.1 0

spices, pesticide residues in
1146
Spice Residues (mg/kg) 1, 2 Group Name
Country/ Year(s) No. Median Max Detections
Seed Coriander Bulgaria, 1999 Canada, 1999 India, 2000-2003 EU, 1996-1998
30 <0.1 <0.1 0
Seed Cumin EU, 1996-1998 India, 2000-2001 Pakistan, 2000 Syria, 2000-2003 Turkey, 1999-2003
32 <0.1 0.3 0.12, 0.3
Seed Dill seed Australia, 1999 Canada, 1999-2001 India, 1999-2003
11 <0.1 <0.1 0
Seed Fennel seed EU, 1996-1998 India, 2002-2003
4 <0.1 <0.1 0
Seed Fenugreek Canada, 2000 India, 2001-2003
5 <0.1 <0.1 0
Seed Nutmeg EU, 1998 Guatemala, 2002-2003 India, 2003 Indonesia, 2000-2003 US, 2001
8 <0.1 <0.1 0
SEEDS TOTAL 1996-2003 115 0.1 0.3 2/ (0.12– 0.3)
Fruit or berry Allspice EU, 1996-1998 Jamaica, 1999 Mexico, 2002
4 <0.075 <0.1 0
Fruit or berry Caraway EU, 1996-1998 US, 2000
12 <0.05 <0.1 0
Fruit or berry Cardamom EU, 1996-1998 Guatemala, 2001-2003 India, 2001
12 <0.075 <0.1 0
Fruit or berry Juniper EU, 1998 2 <0.05 <0.05 0 Fruit or berry Pepper, black,
white, pink EU, 1996-1998 Brazil, 2001-2002 Ecuador, 1999 India, 2001-2003 Indonesia, 2001-2003 New Guinea, 1999 Malaysia, 2003 Vietnam, 1999-2003
86 <0.1 <0.1 0
Fruit or berry Vanilla EU, 1998 1 <0.05 <0.05 0 FRUITS TOTAL 1996-2003 117 0.1 0.1 0 Roots/ Rhizome
Ginger China, 2001 EU, 1996-1998 India, 2000-2003
35 <0.05 <0.1 0
Roots/ Rhizome
Turmeric Brazil, 2003 EU, 1996-1998 India, 1999-2003 Vietnam, 2003
40 <0.1 <0.1 0
ROOTS TOTAL 1996-2003 75 0.1 0.1 0 Bark Cassia EU, 1996-1998
Indonesia, 1999 Vietnam, 2001-2003
5 <0.1 <0.1 0
Bark Cinnamon EU, 1996-1998 Vietnam, 2000-2003 India, 2003
10 <0.05 <0.1 0
Buds Cloves Madagascar, 1999-2000 Brazil, 2002 India, 2003
5 <0.1 <0.1 0
Aril Mace EU, 1996-1998 India, 2001-2003 Indonesia, 2002
9 <0.05 <0.1 0

spices, pesticide residues in
1147
Spice Residues (mg/kg) 1, 2 Group Name
Country/ Year(s) No. Median Max Detections
BARK, BUDS, ARIL
TOTAL, MISC- 1996-2003 29 0.1 0.1 0
1 Method as described in Table 2 for organophosphorus screening. 2 LOQ 0.1 mg/kg for data from ASTA and India; 0.05 mg/kg for data from EU. Table 28. Summary of monitoring data for phosalone residues in spices. Origin of meat samples was not reported.
Spice Residues (mg/kg) 1.2 Group Name
Country/ Year(s) No. Median Max
Detections
Seeds Anise Egypt 2001 171 0.05 0.1 Seeds Celery seed 49 0.05 0.95 Seeds Coriander seed 22 0.05 0 Seeds Cumin Turkey 1999-2003. 18 0.05 0.25 Seeds Dill seed 8 0.05 0 Seeds Fennel seed 6 0.05 0 Seeds Nutmeg Indonesia 2000-2003. 2 0.05 0 SEEDS TOTAL 276 0.05 0.95 1(0.1-0.95) Fruits Allspice 5 0.05 0 Fruits Caraway 13 0.05 0 Fruits Cardamom 8 0.05 0 Fruits Juniper berries 4 0.05 0 Fruits Pepper 43 0.05 0.05, 0.85, 0.89 Fruits Vanilla pod 6 0.05 0 Fruits Vanilla pod 1 0.05 0 FRUITS TOTAL 80 0.05 0.89 3(0.05-0.89) Roots Ginger 118 0.05 0.05, 0.14, 0.22, 0.4, 0.5 Roots Turmeric 108 1.49 0.27, 0.31, 0.49, 1.49 ROOTS TOTAL 226 0.05 1.49 4(0.27-1.49) Bark Cassia 9 0.05 0.05 Bark Cinnamon 10 0.05 0.05, 0.05 Aril Mace 6 0.05 0 BARK, BUDS, ARIL TOTAL 25 0.05 0.05 3(0.05)
1 Method as described in Table 2 for organophosphorus screening. 2 LOQ 0.05 mg/kg from all sources. Table 29. Summary of monitoring data for pirimicarb residues in spices.
Spice Residues (mg/kg) 1 Group Name
Country/ Year(s) No. Median Max Detections
Seed Anise Egypt, 1996-2001
484 0.05 1.4 0.05 (8), 0.06 (13), 0.07 (8), 0.08 (5), 0.09 (10), 0.1 (9), 0.12 (3), 0.13 (5), 0.14 (7), 0.15 (4), 0.16 (6), 0.17, 0.17, 0.18, 0.18, 0.19, 0.19, 0.2, 0.2, 0.22, 0.22 (3), 0.23, 0.27, 0.27, 0.28 (3), 0.29, 0.29, 0.33 (3), 0.34, 0.34, 0.37, 0.39, 0.41, 0.42, 0.42, 0.43, 0.44, 0.45, 0.47, 0.47, 0.53, 0.53, 0.58, 0.58, 0.59, 0.6, 0.6, 0.64, 0.67, 0.69, 0.7, 0.8, 0.84, 0.93, 1.2, 1.4

spices, pesticide residues in
1148
Spice Residues (mg/kg) 1 Group Name
Country/ Year(s) No. Median Max Detections
Seed Fennel seed
Egypt, 1996-2001
824 0.05 3 0.05 (3), 0.06 (9), 0.07, 0.08 (4), 0.09 (4), 0.1, 0.1, 0.12 (3), 0.13, 0.13, 0.14, 0.15 (3), 0.17, 0.17, 0.18, 0.2, 0.21, 0.22,0.24 0.26, 0.27, 0.28, 0.31, 0.35, 0.37, 0.38, 0.54, 0.54, 0.59, 0.7, 0.94, 1.4, 1.5, 3
SEEDS TOTAL 1996-2001 1308 <0.1 3 183/ (0.05-3)
1 LOQ 0.05 mg/kg Table 30. Summary of monitoring data for pirimiphos-methyl residues in spices.
Spice Residues (mg/kg) 1, 2 Group Name
Country/ Year(s) No. Median Max Detections
Canada, 1999 EU, 1998 Syria, 2002-2003 Turkey, 1999-2003
16 <0.1 <0.1 0 Seed Anise
Egypt, 1996-2001 492 <0.05 0.05, 0.06, 0.07, 0.08, 0.12, 0.17, 0.18, 0.19, 0.27, 0.32, 0.47, 0.58, 0.6, 0.61, 0.63, 1.8
Seed Celery seed EU, 1996-1998 India, 1999-2003
8 <0.1 <0.1 0
Seed Coriander Bulgaria, 1999 Canada, 1999 EU, 1996-1998
14 <0.05 <0.1 0
Seed Cumin EU, 1996-1998 India, 2000-2001 Pakistan, 2000 Syria, 2000-2003 Turkey, 1999-2003
23 <0.1 <0.1 0
Seed Dill seed Australia, 1999 Canada, 1999-2001 India, 1999-2003
10 <0.1 <0.1 0
Seed Fennel seed EU, 1996-1998 India, 2002-2003
7 <0.05 <0.1 0
Egypt, 1996-2001 556 <0.05 0.05, 0.07, 0.08, 0.1, 0.11 Seed Fenugreek Canada, 2000
India, 2001-2003 4 <0.1 <0.1 0
Seed Nutmeg EU, 1998 Guatemala, 2002-2003 Indonesia, 2000-2003 US, 2001
7 <0.1 0.1 0.1
SEEDS TOTAL 1996-2003 1137 0.1 1.8 22/ (0.05-1.8)
Fruit or berry Allspice EU, 1996-1998 Jamaica, 1999 Mexico, 2002
6 <0.05 <0.1 0
Fruit or berry Caraway EU, 1996-1998 US, 2000
15 <0.05 <0.1 0
Fruit or berry Cardamom EU, 1996-1998 Guatemala, 2001-2003 India, 2001
10 <0.075 0.18 0.18
Fruit or berry Juniper EU, 1998 3 <0.05 <0.05 0 Fruit or berry Pepper,
black, white, pink
Europe, 1996-1998 Brazil, 2001-2002 Ecuador, 1999 India, 2001-2003 Indonesia, 2001-2003 New Guinea, 1999 Malaysia, 2003 Vietnam, 1999-2003
59 <0.1 0.1 0.1, 0.1

spices, pesticide residues in
1149
Spice Residues (mg/kg) 1, 2 Group Name
Country/ Year(s) No. Median Max Detections
Fruit or berry Vanilla EU, 1998 1 <0.05 <0.05 0 FRUITS TOTAL 1996-2003 94 0.05 0.18 3/
(0.1-0.18) Roots/ Rhizome
Ginger China, 2001 EU, 1996-1998 India, 2000-2003
31 <0.05 0.1 0.1
Roots/ Rhizome
Turmeric Brazil, 2003 EU, 1996-1998 India, 1999-2003 Vietnam, 2003
16 <0.05 <0.1 0
ROOTS TOTAL 1996-2003 47 <0.05 0.1 1/(0.1) Bark Cassia EU, 1996-1998
Indonesia, 1999 Vietnam, 2001-2003
12 <0.1 0.1 0.1
Bark Cinnamon EU, 1996-1998 Vietnam, 2000-2003
10 <0.1 0.1 0.1, 0.1
Buds Cloves Madagascar, 1999-2000 Brazil, 2002
4 <0.1 0.1 0
Aril Mace EU, 1996-1998 India, 2001-2003 Indonesia, 2002
10 <0.1 <0.1 0
BARK, BUDS, ARIL
TOTAL, MISC-
1996-2003 36 0.1 0.1 3/ (0.1)
1 Method as described in Table 2 for organophosphorus screening. 2 LOQ 0.1 mg/kg for data from ASTA and India; 0.05 mg/kg for data from EU Table 31. Summary of monitoring data for quintozene residues in spices.
Spice Residues (mg/kg) 1 Group Name
Country/ Year(s) No. Median Max Detections
Seed Anise Canada, 1999 EU, 1998 Syria, 2002-2003 Turkey, 1999-2003
18 <0.01 <0.01 0
Seed Celery seed EU, 1996-1998 India, 1999-2003
53 <0.01 <0.01 0
Seed Coriander Bulgaria, 1999 Canada, 1999 EU, 1996-1998
29 <0.01 0.05 0.05
Seed Cumin EU, 1996-1998 India, 2000-2001 Pakistan, 2000 Syria, 2000-2003 Turkey, 1999-2003
27 <0.01 0.024 0.013, 0.014, 0.024
Seed Dill seed Australia, 1999 Canada, 1999-2001 EU, 1996-1998 India, 1999-2003
18 <0.01 <0.01 0
Seed Fennel seed EU, 1996-1998 India, 2002-2003
9 <0.01 0.022 0.022
Seed Fenugreek Canada, 2000 India, 2001-2003
4 <0.01 <0.01 0
Seed Nutmeg Guatemala, 2002-2003 Indonesia, 2000-2003 US, 2001
5 <0.01 <0.01 0

spices, pesticide residues in
1150
Spice Residues (mg/kg) 1 Group Name
Country/ Year(s) No. Median Max Detections
SEEDS TOTAL 1996-2003 163 0.01 0.05 5/ (0.01-0.05)
Fruit or berry Allspice Jamaica, 1999 Mexico, 2002
2 <0.01 <0.01 0
Fruit or berry Caraway EU, 1996-1998 US, 2000
18 <0.01 <0.01 0
Fruit or berry Cardamom EU, 1996-1998 Guatemala, 2001-2003 India, 2001
13 <0.01 <0.01 0
Fruit or berry Juniper EU, 1996-1998 5 <0.01 <0.01 0 Fruit or berry Pepper,
black, white, pink
EU, 1996-1998 Brazil, 2001-2002 Ecuador, 1999 India, 2001-2003 Indonesia, 2001-2003 New Guinea, 1999 Malaysia, 2003 Vietnam, 1999-2003
66 <0.01 0.01 0.01
Fruit or berry Vanilla EU, 1996-1998 7 <0.01 <0.01 0.01 FRUITS TOTAL 1996-2003 111 0.01 0.01 1/
(0.01) Roots/ Rhizome
Ginger China, 2001 EU, 1996-1998 India, 2000-2003
121 <0.01 0.082 0.01, 0.082
Roots/ Rhizome
Turmeric Brazil, 2003 EU, 1996-1998 India, 1999-2003 Vietnam, 2003
115 <0.01 1.25 0.04, 0.05, 0.05, 1.2
ROOTS TOTAL 1996-2003 236 <0.01 1.25 6/ (0.01-1.2)
Bark Cassia EU, 1996-1998 Indonesia, 1999 Vietnam, 2001-2003
12 <0.01 0.01 0.01
Bark Cinnamon EU, 1996-1998 Vietnam, 2000-2003
14 <0.01 0.01 0.01, 0.01
Buds Cloves Madagascar, 1999-2000 Brazil, 2002
4 <0.01 <0.01 0.01
Aril Mace EU, 1996-1998 India, 2001-2003 Indonesia, 2002
10 <0.01 <0.01 0
BARK, BUDS, ARIL
TOTAL, MISC-
1996-2003 40 0.01 0.01 3 (0.01)
1 LOQ 0.01 mg/kg for data from all sources. Table 32. Summary of monitoring data for vinclozolin residues in spices.
Spice Residues (mg/kg) 1 Group Name
Country/ Year(s) No. Median Max
Detections
S Anise EU 3 0.05 0 S Celery seed EU 49 0.05 0 S Coriander seed EU 22 0.05 0 S Cumin Turkey 0999.-20003.. EU 18 0 S Dill seed EU 8 0.05 0 S Fennel seed EU 6 0.05 0 S Nutmeg Indonesia 2000.-2003.. EU 4 0.05 0 SEEDS TOTAL 110 0.05 0.05 0

spices, pesticide residues in
1151
Spice Residues (mg/kg) 1 Group Name
Country/ Year(s) No. Median Max
Detections
F Allspice EU 5 0.05 0 F Caraway EU 13 0.05 0 F Cardamom EU 8 0.05 0 F Junniper berries EU 4 0.05 0 F Pepper EU 43 0.05 0 F Vanilla pod EU 7 0.05 0 FRUITS TOTAL 80 0.05 0.05 0 R Ginger EU 117 0.05 0 R Turmeric EU 110 0.05 0 ROOTS TOTAL 227 0.05 0.05 0 B Cassia EU 9 0.05 0 B Cinnamon EU 10 0.05 0 A Mace EU 6 0.05 0 BARK. BUDS. ARIL TOTAL 25 0.05 0.05 0
1 LOQ 0.01 mg/kg for data from all sources. Estimation of maximum residue levels for pesticides in or on dry chili peppers As a general practice, chili peppers are traded according to colour. They are not normally harvested at maturity. Harvest practices differ from country to country and even farmer to farmer, but usually chilies are harvested when the colour is at its optimum on the industry scale which is almost always much later than peak ripeness. It is now common practice for farmers to leave the fruit on the plant to be dried in the sun, thus saving dehydration costs. In establishing the existing Codex MRLs for fresh peppers, it was assumed, on the basis of GAP, that samples were taken when the fruits were mature. This is not the harvest point for the peppers that are dried and consumed as spices. Estimating dehydration factors based on the Fruit at harvest does not reflect the common cultural practices described, and would not give a lower factor than one based on the mature fruit. In a study in Spain on the nutrient content of fresh peppers (Capsicum annum L.), results showed the water content to be 91 g/100 g of fruit (Lopez-Hernandez et.al., 1996). The United States Department of Agriculture Nutrient Database gives a water content for several varieties of peppers as ranging from 87.7 g to 93.9 g per 100 g fresh fruit. The corresponding concentration factors are shown in Table 33. Table 33. Dehydration/concentration factors for dried chili peppers.
Pepper variety Water content (g/100 g edible portion)1
Concentration factor2, 3
Fresh Pepper, sweet, green, raw 93.89 16.4 Peppers, sweet, red, raw 92.21 12.8 Pepper, hot chili, green, raw 87.74 8.1 Peppers, hot chili, red, raw 88.02 8.3 Pepper, Hungarian, raw 91.51 11.8 Peppers, jalapeno, raw 91.69 12.0

spices, pesticide residues in
1152
Average 11.6 Dried Peppers, hot chili, sun-dried 7.15 13.9 Peppers, pasilla, dried 14.84 6.7 Spices, peppers, red or cayenne 8.05 12.4 Spices, paprika 9.54 10.5 Spice, chili powder 7.79 12.8 Average 11.3
1 USDA nutrient Database (http://www.nal.usda.gov/fnic/foodcomp/search) 2 From fresh peppers: concentration factor = 1/(1-g water/g edible) 3 From dried peppers: concentration factor = 1/(g water/g edible) The average concentration factor is about 11.6 based on the worst-case assumption that all water is removed from the fresh peppers during drying. Depending on the variety, in reality about 5-10% water is retained. Using the same USDA Nutrient Database, the water content of dried peppers and spices is about 7 to 15 g/100 g of the dried commodity (average concentration factor 11.3). ASTA routinely monitors the moisture content of dried chili peppers (capsicums). The results of the latest inter-comparison study based on results from 27 laboratories indicated an average water content of 7.06% with a reproducibility coefficient of variation of 14.7%. The highest moisture content was 9.79%. The data support the rounded figure of 10 for the dehydration/concentration factor currently applied by the spice industry.
Table 34 shows existing CXLs for pesticide residues in peppers as well as for draft MRLs at Step 6 and above of the Codex procedure. Table 34. MRLs for peppers being at or above step 6 in Codex procedure
Pesticide and commodity MRL for fresh produce
(mg/kg) Status Comments
PEPPERS (VO 0051) Acephate 5 Step 6 Proposed by 2003 JMPR Carbendazim 0.1 Step 6 Chlorpyrifos-methyl 0.5 CXL Cypermethrin 0.5 CXL Cyromazine 1 CXL Dichlofluanid 2 CXL Dicofol 1 CXL Dimethoate 1 CXL Withdrawal recommended by 1998 & 2003
JMPR (replacement) Dinocap 0.2 CXL Ethephon 5 CXL Ethoprophos 0.02 (*) CXL 2004 JMPR withdrew its previous
recommendation for peppers and recommended 0.05 mg/kg for sweet peppers
Imidacloprid 1 (dry basis) CXL Malathion 0.1 CXL Metalaxyl 1 CXL Methamidophos 2 Step 6 To replace CXLs Methomyl 1 CXL Withdrawal recommended by 2001 JMPR Methoxyfenozide 2 Step 6 Proposed by 2003 JMPR Monocrotophos 0.2 CXL Oxamyl 5 Step 6 Proposed by 2002 JMPR Permethrin 1 CXL Phosphamidon 0.2 CXL Pirimicarb 2 CXL Pirimiphos-methyl 1 CXL Withdrawal recommended by 2003 JMPR Piperonyl butoxide 2 CXL Procymidone 5 CXL

spices, pesticide residues in
1153
Pesticide and commodity MRL for fresh produce (mg/kg)
Status Comments
Profenofos 5 CXL Pyrethrins 0.05 (*) CXL Spinosad 0.3 CXL Tebufenozide 1 CXL PEPPERS, SWEET (VO 0445)
Abamectin 0.02 CXL Azinphos-methyl 1 CXL Benalaxyl 0.05 CXL Bromide ion 20 CXL Carbaryl 5 CXL Chlorothalonil 7 CXL Chlorpyrifos 2 CXL Cyfluthrin 0.2 CXL Cyhexatin 0.5 CXL Cyprodinil 0.5 Step 6 Proposed by 2003 JMPR Diazinon 0.05 CXL Dimethoate 5 Step 6 Proposed by 2003 JMPR Dithiocarbamates 1 CXL Fenarimol 0.5 CXL Fenpropathrin 1 CXL Fenvalerate 0.5 CXL Methamidophos 1 CXL Withdrawal recommended by 2003 JMPR
(replacement) Oxamyl 0.1 CXL To be replaced by MRL for peppers Pirimicarb 1 CXL Profenofos 0.5 CXL Propamocarb 1 CXL Quintozene 0.01 CXL Tebuconazole 0.5 CXL Triadimefon 0.1 CXL Triadimenol 0.1 CXL Tolylfluanid 2 CXL Vinclozolin 3 CXL PEPPERS, CHILI (VO 0 444)
Carbendazim 2 Step 6 Proposed by 2003 JMPR Methamidophos 2 CXL Withdrawal recommended by 2003 JMPR
(replacement) Pirimicarb 2 CXL Profenofos 5 CXL
In a substantial proportion of random samples residues were undetectable indicating that the
sampled lots were probably not treated with the prescribed pesticide. Median residues were therefore derived from detected residues. The long-term intake from the residue data which gave the largest contribution to the intake and the percentage of samples contained detectable residues of that particular crop–pesticide combination. Where no samples contained detectable residues the intake was calculated from highest and median LOQs, and the proportion of commodities “treated” could not be taken into account. The values on which intake calculations are shown in Table 35. Table 35. Percentage of samples containing detectable residues of pesticides, and the highest contributing residues to short-term and chronic intakes.
Pesticide Commodity No. of samples
Samples with detectable residues, %
High residue, mg/kg
Median mg/kg
Acephate All spices 225 0 0.2 0.2 Azinphos-methyl All spices 260 0 0.5 0.1 Chlorpyrifos Anise 762 10 3.6 0.09

spices, pesticide residues in
1154
Pesticide Commodity No. of samples
Samples with detectable residues, %
High residue, mg/kg
Median mg/kg
Chlorpyrifos-methyl Ginger 22 100 2.9 0.077 Cypermethrin Pepper 57 1.7 0.12 0.11 Diazinon Anise seed 685 10 3.6 0.19 Dichlorvos All spices 277 0 0.1 0.1 Dicofol Root/rhizomes 112 3 0.05 0.05 Dimethoate Anise 744 8 3 0.17 Disulfoton All spices 223 0 0.05 0.05 Endosulfan Pepper 143 5 3.2 0.12 Ethion Pepper 104 2 3.1 1.7 Fenitrothion Anise 756 3 5.4 0.4 Iprodione Ginger 92 1 0.05 0.05 Malathion Celery 53 6 0.86 0.48 Metalaxyl Anise 411 1.5 0.43
Fennel 895 3.2 Methamidophos All spices 260 0 0.1 0.01 Mevinphos Celery 53 1.9 2.9 0.05 Parathion Pepper 114 0 0.1 0.1 Parathion-methyl Cumin 40 25 3.4 0.43 Permethrin All spices 160 0 0.05 0.05 Phenthoate Anise 415 2.4 5.2 1.2 Phorate Cumin 32 6.2 0.3 0.21 Phosalone Pepper 43 7 1.5 0.85 Pirimicarb Anise 484 27 0.14
Fennel 824 3 Pirimiphos-methyl Anise 508 3.1 1.8 0.23 Quintozene Turmeric 115 3.5 1.2 0.05 Vinclozolin All spices 442 0 0.05 0.05
The Meeting noted that the sampled commodities were probably already blended or mixed from a number of lots. A composite sample from such a mixed lot represents its average residue, which provides similar information to the median residue from supervised trials. Therefore the highest residues observed in composite samples were used in the short-term intake calculations. Dried chili pepper consumption The Gems/Food Regional Diets break down the consumption of peppers into chili peppers and sweet peppers (including pimientos), in most cases mainly as fresh vegetables. The proportion of both, when dried, consumed as spices (i.e. sprinkled on or cooked in foods, etc) is estimated by the spice industry to be about 10% of the total consumption. Therefore for the assessment of long and short-term intakes 10% of the sum of the Gems/Food dietary consumption of sweet and chili peppers was used. Instead of the IEDI only TMDI calculations were possible, since the only residue values available were derived by extrapolation from the MRLs for fresh peppers. Similarly the estimated maximum residue levels for dried chili peppers were used for the IESTI calculations.

spices, pesticide residues in
1155
DIETARY RISK ASSESSMENT Taking into account the specific nature of monitoring data and the lack of detailed information on spice consumptions, the following assumptions and approximations had to be made for the calculations:
• Since the sub-groups of spices used by the GEMS/Food Diet did not coincide with those drawn up by the 36th session of the CCPR (2004 report 2.6), the consumption for the entire spices group was used for long-term and short-term intake calculations.
• The ratio of samples containing detectable residues to all samples taken from a given commodity-pesticide combination was used to reflect the proportion of the commodity which was treated with or exposed to the pesticide. The factor derived was used in the IEDI calculations.
• The IEDI was calculated only from detected residues in that particular pesticide spice commodity combination which gave the highest contribution to the intake from any of the sub-groups.
• The IESTI was calculated where ARfD values were available. • The consumption of “dried chili peppers” was estimated to be about 10% of the combined
consumption of fresh sweet and chili peppers (VO 0445 and VO 0444). • For dried chili peppers, only TMDI calculations were possible, since the only residue values
available were the ones derived by extrapolation from MRLs for fresh peppers. The IESTI was also calculated from the estimated maximum residue levels.
• A composite sample taken from a spice shipment containing several lots represents the average residue in the mixed commodity. This residue value provides similar information to the median residue from supervised trials. Therefore the highest residues observed in composite samples were used in the short-term intake calculations instead of the median values which would have been used in case of results deriving from supervised trials.
• The estimations were made for spices and chili peppers independently.
The Meeting evaluated residues of 28 pesticides based on monitoring data, and estimated maximum reside levels for 47 pesticides for dried chili peppers based on MRLs established for fresh sweet and chili peppers. The intakes from spices and chili only were compared to the existing ADI and acute RfD values; intakes arising from uses of compounds on other commodities were not considered.
Table 38 summarises the available ADIs and ARfDs used for the dietary risk assessments. Table 38. ADIs and ARfDs used in the intake assessments for pesticide residues in spices and dried chili peppers.
Pesticide ADI mg/kg bw/day
ARfD mg/kg bw/day
Assessment
Abamectin 0.002 Dried chili Acephate 0.01 0.05 Spices/dried chili Azinphos-methyl 0.005 Spices/dried chili Benalaxyl 0.05 Dried chili Carbaryl 0.008 0.2 Dried chili Carbendazim 0.03 Dried chili Chlorothalonil 0.03 Dried chili Chlorpyrifos 0.01 0.1 Spices/ dried chili Chlorpyrifos-methyl 0.01 Dried chili Cyfluthrin 0.02 Dried chili Cyhexatin 0.007 Dried chili Cypermethrin 0.05 Spices/ dried chili Cyromazine 0.02 Dried chili Diazinon 0.002 0.03 Spices/ dried chili Dichlofluanid 0.3 Dried chili

spices, pesticide residues in
1156
Pesticide ADI mg/kg bw/day
ARfD mg/kg bw/day
Assessment
Dichlorvos 0.004 Spices Dicofol 0.002 Dried chili Dimethoate 0.002 0.02 Spices/ dried chili Dinocap 0.008 Dried chili Disulfoton 0.0003 0.003 Spices Dithiocarbamates (c,n) 0.03 Dried chili Endosulfan 0.006 0.02 Spices Ethephon 0.05 0.05 Dried chili Ethion 0.002 Spices Ethoprophos 0.0004 0.05 Dried chili Fenarimol 0.01 Dried chili Fenitrothion 0.005 0.04 Spices Fenpropathrin 0.03 Dried chili Fenvalerate 0.02 Dried chili Imidacloprid 0.06 0.4 Dried chili Iprodione 0.06 Spice Malathion 0.3 2 Spices/ dried chili Metalaxyl 0.08 Dried chili Methamidophos 0.004 0.01 Spices Methomyl 0.02 0.02 Dried chili Methoxyfenozide 0.1 0.9 Dried chili Mevinphos 0.0008 0.003 Spices Monocrotophos 0.0006 0.002 Dried chili Oxamyl 0.009 0.009 Dried chili Parathion 0.004 0.01 Spices Parathion-methyl 0.003 0.03 Spices Permethrin 0.05 1.5 Spices/ dried chili Phenthoate 0.003 Spices Phorate 0.0007 0.003 Spices Phosalone 0.02 0.3 Spices Phosphamidon 0.0005 Dried chili Piperonyl butoxide 0.2 Dried chili Pirimicarb 0.02 0.1 Dried chili Pirimiphos-methyl 0.03 Spices/ dried chili Procymidone 0.1 Dried chili Profenofos 0.01 Dried chili Propamocarb 0.1 Dried chili Pyrethrins 0.04 0.2 Dried chili Quintozene 0.01 Spices/ dried chili Spinosad 0.02 Dried chili Tebuconazole 0.03 Dried chili Tebufenozide 0.02 0.9 Dried chili Tolylfluanid 0.08 0.5 Dried chili Triadimefon 0.03 0.08 Dried chili Triadimenol 0.03 0.08 Dried chili Vinclozolin 0.01 Dried chili
Long-term intake The results of intake calculations show that the IEDI for spices was below 1% of the ADI in all diets. The Meeting concluded that spice consumption would not change the risk assessment based on all other uses of the compounds. The results are given in Table 39. The calculated TMDIs for dried chili peppers did not exceed 5% of the ADI in any GEMS/Food diet for abamectin, benalaxyl, cyfluthrin, cypermethrin, diazinon, dichlofulanid, dinocap, dithiocarbamates, fenpropathrin, fenvalerate, imidacoprid, metalaxyl, methoxyfenozide, permethrin, piperonyl butoxide, propamocarb, pyrethrins, quintozene, spinosad, tebuconazole, tolylfluanid,

spices, pesticide residues in
1157
triadimefon and triadimenol. The Meeting concluded that dried chili pepper consumption would not change the risk assessment based on all other uses of these compounds. The residues of acephate, azinphos-methyl, carbaryl, carbendazim, chlorothalonil, chlorpyrifos, chlorpyrifos-methyl, cyhexatin, cyromazine, dicofol, dimethoate, ethephon, ethoprophos, fenarimol, methamidophos, methomyl, monocrotophos, oxamyl, phosphamidon, procymidone, profenofos, tebufenozide and vinclozolin in dried chili pepper contribute more than 5% of the ADI in at least one diet. The Meeting concluded that a complete long-term intake assessment for these compounds should be carried out taking into account their residues in all other commodities.
Residues resulting from the use of dimethoate on peppers exceed the ADI (430% in the European diet) on chili pepper alone. The Meeting could not conclude that its use would not present a health public concern. The detailed results are given in Table 40. Short-term intake The IESTI values for spices ranged from <1% to 170% (mevinphos) of the acute RfD.
For chili peppers intake values at or above the acute RfD were calculated for dimethoate (120%), methamidophos (100%) and oxamyl (270%). The intakes expressed in mg/kg bw/day were similar for children and for the general population for both spices and chili peppers. The Meeting concluded that short-term intake of pesticide residues, other than those listed above, from spice and dried chili consumption is unlikely to present a public health concern. Table 39. Summary of results of IEDI and IE STI calculations for spices
Long-term intake, % of ADI1 Short-term intake, % of acute RfD1
Compound
Mid-East Far-East African Latin American
European Adult Children
Diet (g/kg bw/day) 0.043 0.055 0.030 0.008 0.008 1.75 1.67 Acephate 0 0 0 0 0 0 0 Azinphos-methyl 0 0 0 0 0 Chlorpyrifos 0 0 0 0 0 5 5 Chlorpyrifos-methyl 0 0 0 0 0 Cypermethrin 0 0 0 0 0 Diazinon 0 0 0 0 0 20 20 Dichlorvos 0 0 0 0 0 Dicofol 0 0 0 0 0 Dimethoate 0 0 0 0 0 25 25 Disulfoton 0 0 0 0 0 5 5 Endosulfan 0 0 0 0 0 30 25 Ethion 0 0 0 0 0 Fenitrothion 0 0 0 0 0 25 25 Iprodione 0 0 0 0 0 Malathion 0 0 0 0 0 0 0 Metalaxyl 0 0 0 0 0 Methamidophos 0 0 0 0 0 0 0 Mevinphos 0 0 0 0 0 170 160 Parathion 0 0 0 0 0 Parathion-methyl 0 0 0 0 0 20 20 Permethrin 0 0 0 0 0 Phenthoate 0 0 0 0 0

spices, pesticide residues in
1158
Long-term intake, % of ADI1 Short-term intake, % of acute RfD1
Compound
Mid-East Far-East African Latin American
European Adult Children
Diet (g/kg bw/day) 0.043 0.055 0.030 0.008 0.008 1.75 1.67 Phorate 0 0 0 0 0 Phosalone 0 0 0 0 0 0 0 Pirimicarb 0 0 0 0 0 Pirimiphos-methyl 0 0 0 0 0 Quintozene 0 0 0 0 0 Vinclozolin 0 0 0 0 0
1 Rounded figures
Table 40. Summary of results of TMDI (% ADI) and IESTI (% of acute RfD) calculations based on MRLs proposed for dried chili peppers.
Long-term intake, % of ADI1 Short-term intake, % of
acute RfD1 Compound
Mid-East Far-East African Latin American European Adults Children Diet (g/kg bw/day) 0.057 0.038 0.090 0.040 0.173 0.472 0.477 Abamectin 1 0 1 0 2 Acephate 30 20 45 20 90 50 50 Azinphos-methyl 10 10 20 10 35 Benalaxyl 0 0 0 0 0 Carbaryl 35 20 60 25 110 10 10 Carbendazim 5 5 5 5 10 Chlorothalonil 10 10 20 10 40 Chlorpyrifos 10 10 20 10 35 10 10 Chlorpyrifos-methyl 5 0 5 0 10 Cyfluthrin 0 0 0 0 0 Cyhexatin 0 5 5 5 10 Cypermethrin 0 0 0 0 0 Cyromazine 5 0 5 0 10 Diazinon 0 0 0 0 0 0 0 Dichlofluanid 0 0 0 0 1 Dicofol 30 20 45 20 90 Dimethoate 140 90 230 100 430 120 120 Dinocap 0 0 0 0 0 Dithiocarbamates 0 0 5 0 5 Ethephon 5 5 10 5 20 50 50 Ethoprophos 5 0 5 0 10 0 0 Fenarimol 5 0 5 0 10 Fenpropathrin 5 0 5 0 5 Fenvalerate 0 0 0 0 5 Imidacloprid 0 0 0 0 0 0 0 Metalaxyl 0 0 0 0 0 Methamidophos 30 20 50 20 90 90 100 Methomyl 5 0 5 0 10 20 20 Methoxyfenozide 0 0 0 5 0 0 0 Monocrotophos 20 10 30 10 60 Oxamyl 30 20 50 20 100 260 270 Permethrin 0 0 0 0 5 Phosphamidon 20 20 40 20 70 Piperonyl butoxide 0 0 0 0 0 Pirimicarb ????? Procymidone 0 0 5 0 10

spices, pesticide residues in
1159
Long-term intake, % of ADI1 Short-term intake, % of acute RfD1
Compound
Mid-East Far-East African Latin American European Adults Children Diet (g/kg bw/day) 0.057 0.038 0.090 0.040 0.173 0.472 0.477 Profenofos 30 20 50 20 90 Propamocarb 0 0 0 0 2 Pyrethrins 0 0 0 0 0 0 0 Quintozene 0 0 0 0 0 Spinosad 0 0 0 0 5 Tebuconazole 0 0 0 0 5 Tebufenozide 5 0 5 0 10 Tolylfluanid 0 0 0 0 5 0 0 Triadimefon 0 0 0 0 0 Triadimenol 0 0 0 0 0 Vinclozolin 20 10 30 10 50
1 Rounded figures
REFERENCES
ALINORM 04/24. Report of the 36th Session of the Codex Committee on Pesticide Residues, paras 235-247. 19-24 April 2004, New Delhi, India. ALINORM 03/24A. Report of the 35th Session of the Codex Committee on Pesticide Residues, paras187-200, 31 March-5 April 2003, Rotterdam, Netherlands. ALINORM 02/24. Report of the 34th Session of the Codex Committee on Pesticide Residues, The Hague, The Netherlands, 13-18 May 2002 CX/PR 04/5. Draft and Proposed Draft Maximum Residue Limits in Foods and Feeds at Steps 7 and 4. Agenda Item 7, 36th Session of the Codex Committee on Pesticide Residues, 19-24 April 2004. New Delhi, India. CX/PR 04/13. Discussion Paper on the Elaboration of MRLs for Spices. Agenda Item 12 of the 36th Session of the Codex Committee on Pesticide Residues, 19-24 April 2004. New Delhi, India (ftp://ftp.fao.org/codex/ccpr36/pr04_13e.pdf) CX/PR 03/15. Consideration of the Elaboration of MRLs for Spices, Agenda Item 12 of the 35th Session of the Codex Committee on Pesticide Residues, 31 March-5 April 2003. Rotterdam, Netherlands. (ftp://ftp.fao.org/codex/ccpr35/pr03_15e.pdf).
CX/PR 02/12. Consideration of Elaboration of MRLs For Spices, Agenda Item 10 of the 34th Session of the Codex Committee on Pesticide Residues,13-18 May 2002, The Hague, Netherlands. Dietary Exposure Evaluation Model (DEEM-FCID), Version 2.03. Exponent. 2003. López-Hernandez, J, Oruña-Concha, M J, Simal-Lozano, J, Vazquez-Blanco, M E, and Gonzalez-Castro, M J., Chemical Composition of Padrón Peppers (Capsicum annuum L.) Grown in Galicia (N.W. Spain). Food Chemistry. Vol. 57, No. 4, pp.557-559, 1996. Official methods of AOAC International, Vol. 1, 17th Edition, 2000. Method 970.52. Pesticide Analytical Manual, US Food And Drug Administration, Vol.1, 3rd Edition, 1997, E4 and C5). Pesticide Residues in Food-Report of the 2002 Joint meeting of the FAO Working Party of Experts on Pesticide Residues and the WHO Expert Committee on Pesticide Residues. pp 14-16, FAO Plant Production and Protection paper 172, 16-25 September 2002, Rome. US Nutrient Database, Nutrient Data Laboratory, Agricultural Research Service, United States Department of Agriculture (http://www.nal.usda.gov/fnic/foodcomp/search)


![PROPOSAL M1007 MAXIMUM RESIDUE LIMITS (APRIL-JUNE 2010… · 2018-06-26 · i 7 March 2011 [4-11] PROPOSAL M1007 MAXIMUM RESIDUE LIMITS (APRIL-JUNE 2010) APPROVAL REPORT Executive](https://img.pdfslide.us/doc/110x75/5f34aacb46cc7f60a30bf007/proposal-m1007-maximum-residue-limits-april-june-2010-2018-06-26-i-7-march-2011.jpg)