Embed Size (px)
Citation preview
METHOD DEVELOPMENT AND VALIDATION FOR THE SIMULTANE OUS
ESTIMATION OF ILAPRAZOLE AND DOMPERIDONE IN CAPSULE DOSAGE
FORM BY UPLC
A DissertationSubmitted to
THE TAMIL NADU Dr. M.G.R. MEDICAL UNIVERSITY
CHENNAI - 600032
In partial fulfilment of the requirements for the award of the Degree of
MASTER OF PHARMACY IN
BRANCH-V-> PHARMACEUTICAL ANALYSIS
Submitted By
RAVI DASGUPTA Reg.No:261430013
Under the Guidance of
Dr. C.N NALINI, M.Pharm., Ph.D Professor and HOD
Department of Pharmaceutical Analysis
C.L. BAID METHA COLLEGE OF PHARMACY
THORAIPAKKAM, CHENNAI – 600097
OCTOBER – 2016

Dr. C.N NALINI, M. Pharm., Ph.D
Professor and HOD
Department of Pharmaceutical Analysis
This is to certify that the project
VALIDATION FOR THE SIMULTANEOUS ESTIMATION OF
DOMPERIDONE IN CAPSULE DOSAGE FORM BY UPLC
No. 261430013in partial fulfillment
(Pharmaceutical Analysis).
LAB, PONDYCHERRY and C.L.
my supervision during the academic year 2014
Date:
Place: Chennai
M. Pharm., Ph.D .
Department of Pharmaceutical Analysis
CERTIFICATE
This is to certify that the project entitled,“ METHOD DEVELOPMENT AND
VALIDATION FOR THE SIMULTANEOUS ESTIMATION OF ILAPRAZOLE
DOMPERIDONE IN CAPSULE DOSAGE FORM BY UPLC ” submitted
fulfillment for the award of degree of Master of Pharmacy
(Pharmaceutical Analysis). The project was carried out at IDEAL ANALYTICAL
LAB, PONDYCHERRY and C.L.Baid Metha College of Pharmacy, Chennai
on during the academic year 2014-2016.
Dr. C.N NALINI, M . Pharm., Ph.D
Professor and HOD
Department of Pharmaceutical
C.L. Baid Metha college of Pharmacy
Chennai - 600097
METHOD DEVELOPMENT AND
ILAPRAZOLE AND
submitted by Regd.
Master of Pharmacy
carried out at IDEAL ANALYTICAL
ollege of Pharmacy, Chennai-97 under
. Pharm., Ph.D .
artment of Pharmaceutical Analysis
Metha college of Pharmacy

Dr. Grace Rathnam, M.Pharm., Ph.D
Principal
This is to certify that the project entitled
VALIDATION FOR THE SIMULTANEOUS ESTIMATION OF
DOMPERIDONE IN CAPSULE DOSAGE FORM BY UPLC
No. 261430013in partial fulfillment for the award of degree of
(Pharmaceutical Analysis).
LAB PONDYCHERRY and C.L.Baid
the guidance of Dr. C.N Nalini
Date:
PLACE: Chennai
Dr. Grace Rathnam, M.Pharm., Ph.D .
CERTIFICATE
This is to certify that the project entitled “ METHOD DEVELOPMENT AND
VALIDATION FOR THE SIMULTANEOUS ESTIMATION OF ILAPRAZOLE
DOMPERIDONE IN CAPSULE DOSAGE FORM BY UPLC ” submitted
in partial fulfillment for the award of degree of Master of Pharmacy
(Pharmaceutical Analysis). The projectwas carried out at IDEAL ANALYTICAL
LAB PONDYCHERRY and C.L.Baid Metha college of Pharmacy, Chennai
Dr. C.N Nalini , M. Pharm., Ph.D. during academic year 201
Dr. Grace Rathnam M. Pharm., Ph.D
Principal
C.L.Baid Metha College of Pharmacy,
Chennai - 600097
METHOD DEVELOPMENT AND
ILAPRAZOLE AND
submitted by Regd.
Master of Pharmacy
was carried out at IDEAL ANALYTICAL
Metha college of Pharmacy, Chennai-97 under
during academic year 2014-2016
Grace Rathnam M. Pharm., Ph.D .
Metha College of Pharmacy,


DECLARATION
I hereby declare that this dissertation entitled, “ METHOD DEVELOPMENT AND
VALIDATION FOR THE SIMULTANEOUS ESTIMATION OF ILAPR AZOLE AND
DOMPERIDONE IN CAPSULE DOSAGE FORM BY UPLC” has been originally
carried out by me under the guidance and supervision of Dr. C.N Nalini, M. Pharm.,
Ph.D., Department of Pharmaceutical Analysis, C.L.Baid Metha College of
Pharmacy, Chennai – 97 during the academic year 2014-2016. The work embodied
in this thesis is original, and is not submitted in part or full for any other degree of this
or any other University.
Date: [Reg. No: 261430013]
Place: Chennai Dept. of Pharmaceutical Analysis

Acknowledgement
“Success is how high you bounce when you hit bottom ”
“If you can dream it, you can do it”
It affords me an immense pleasure to acknowledge with gratitude the help
and guidance rendered to me by a host of people, whom, I owe a substantial
measure for the completion of the dissertation.
Firstly, I glad to have the blessings of God and my Parents in the
implementation of our thought of doing this project. I thank God for providing me
strength and power to overcome all the hurdles and hindrances that come in the way
of doing the project work.
I take this golden opportunity to express my humble gratitude and respect to
my guide Dr. C.N Nalini, M. Pharm., Ph.D., Professorand HOD, Department of
Pharmaceutical Analysis, C.L.Baid Metha College of Pharmacy, Chennai – 97, for
her inspiring guidance, constant encouragement and intellectual suggestions
throughout the course of the dissertation.
I express our profound sense of gratitude to our honorable PrincipleDr. Grace
Rathnam, M. Pharm., Ph.D. Principal, C.L.Baid Metha College of Pharmacy.
I acknowledge my sincere thanks to Dr. Vijaya Nagarajan, M. Pharm., Ph.D.,
Dr. Amuthalakshmi, M. Pharm., Ph.D., C.L Baid Metha College of Pharmacy, for
their valuable suggestions throughout my thesis work.
I would like to use this opportunity to thank K. Maruthappapandian and R.
Parmaguru, Managing Directors, Ideal Analytical and Research Institution
Pondicherryfor their kind co-operation rendered in fulfilling my work.
I would like to thank Mr. Srinivasa Raghavan, Stores In-Charge, Mrs.
Yogeswari lab assistant Mr. Ganesh Bahadur Security officer for their help to fulfil
my research work.

I extend my sincere thanks to Librarian M. Rajalakskmi, C.L Baid Metha
College of Pharmacy in helping me to utilize the library facilities for references.
I thank all non-teaching staff members of our college including Mrs. R. Usha,
Mrs. Valli and Mrs. A.P. Kalpakam for their help extended during my project work.
I profusely thank to all my classmates and juniors for their timely help and
good wishes.
And also I thank one and all, who helped me directly or indirectly for the
successful completion of my project work.
Last but not least I am highly grateful and dedicated to my sistersfor their
moral support.
Date: RAVI DASGUPTA
Reg.No: 261430013
Dept. of Pharmaceutical Analysis

i
CONTENTS
CHAPTER NO.
TITLE PAGE NO.
1 INTRODUCTION 1-32
2 DRUG PROFILE 33-38
3 LITERATURE REVIEW 39-44
4 AIM AND PLAN OF WORK 45-47
5 MATERIALS AND EQUIPMENTS 48-50
6 ANALYTICAL METHOD DEVELOPMENT AND OPTIMIZTION
51-70
7 VALIDATION OF DEVELOPED METHOD 71-103
8 RESULTS AND DISCUSSION 104-108
9 SUMMARY AND CONCLUSION 109-112
10 BIBLIOGRAPHY 113-117

ii
LIST OF TABLES
TABLE NO.
TITLE PAGE NO.
1.1 Comparison between and HPLC and UPLC 18
1.2 Literature from industrial committees and regulatory agencies 27
1.3 Comparison of Validation Parameters Required for HPLC Assay Methods 28
5.1 List of instruments used during validation studies 49
5.2 List of chemicals used during validation studies 50
6.1 Results of System Suitability Domperidone 60
6.2 Results of System Suitability Ilaprazole 61
6.3 Linearity results for Domperidone and Ilaprazole 65
6.4 Tabular column for the assay of Capsule sample 70
7.1 Results of System Suitability Domperidone 78
7.2 Results of System Suitability Ilaprazole 79
7.3 Tabular column for the assay of Capsule sample 82
7.4 Linearity results for Domperidone and Ilaprazole 86
7.5 Tabular Column for Recovery Solution 89
7.6 Accuracy results of Domperidone 94
7.7 Accuracy results of Ilaprazole 95
7.8 Method precision results for Domperidone & Ilaprazole 98
7.9 LOD & LOQ Determination 99
7.10 Robustness observation of Domperidone 102
7.11 Robustness observation of Ilaprazole 103
8.1 Tabular column for analytical parameters 105
8.2 Results of assay of DPD & IPZ in capsule dosage form 105
8.3 Results of Validation Parameters 106

iii
LIST OF FIGURES
FIGURE NO. TITLE
PAGE NO.
1.1 Adsorption phenomenon in chromatography 10
1.2 Partition phenomenon in chromatography 11
1.3 Ion exchange phenomenon in chromatography 11
1.4 Molecular Exchange phenomenon in chromatography 12
1.5 High-Performance Liquid Chromatography [HPLC] System 13
1.6 Ultra-Performance Liquid Chromatography [UPLC] Instrument 15
6.1 Trial chromatogram 1 for Ilaprazole and Domperidone 54
6.2 Trial chromatogram 2 for Ilaprazole and Domperidone 55
6.3 Trial chromatogram 3 for Ilaprazole and Domperidone 56
6.4 Trial chromatogram 4 for Ilaprazole and Domperidone 57
6.5 Chromatogram of System Suitability of Standard, Replicate Injection 01 59
6.6 Chromatogram of System Suitability of Standard, Replicate Injection 02 59
6.7 Chromatogram of System Suitability of Standard, Replicate Injection 03 59
6.8 Chromatogram of System Suitability of Standard, Replicate Injection 04 60
6.9 Chromatogram of System Suitability of Standard, Replicate Injection 05 60
6.10 Chromatogram of linearity solution (80%) 63
6.11 Chromatogram of linearity solution (90%) 64
6.12 Chromatogram of linearity solution (100%) 64
6.13 Chromatogram of linearity solution (110%) 64
6.14 Chromatogram of linearity solution (120%) 65
6.15 Calibration graph of Domperidone 66
6.16 Calibration graph of Ilaprazole 66
6.17 Chromatogram of Sample (Marketed Capsule) 69
7.1 Chromatogram of blank 75
7.2 Chromatogram of Ilaprazole (WS) 75

iv
FIGURE NO. TITLE PAGE
NO.
7.3 Chromatogram of Domperidone (WS) 75
7.4 Chromatogram of sample solution 76
7.5 Chromatogram of System Suitability of Standard, Replicate Injection 01 77
7.6 Chromatogram of System Suitability of Standard, Replicate Injection 02 77
7.7 Chromatogram of System Suitability of Standard, Replicate Injection 03 77
7.8 Chromatogram of System Suitability of Standard, Replicate Injection 04 78
7.9 Chromatogram of System Suitability of Standard, Replicate Injection 05 78
7.10 Chromatogram of Sample (Marketed Capsule) 81
7.11 Chromatogram of linearity solution (80%) 84
7.12 Chromatogram of linearity solution (90%) 84
7.13 Chromatogram of linearity solution (100%) 85
7.14 Chromatogram of linearity solution (110%) 85
7.15 Chromatogram of linearity solution (120%) 85
7.16 Calibration graph of Domperidone 86
7.17 Calibration graph of Ilaprazole 87
7.18 Chromatogram of accuracy 100% injection 01 90
7.19 Chromatogram of accuracy 100% injection 02 90
7.20 Chromatogram of accuracy 100% injection 03 90
7.21 Chromatogram of accuracy 110% injection 01 91
7.22 Chromatogram of accuracy 110% injection 02 91
7.23 Chromatogram of accuracy 110% injection 03 91
7.24 Chromatogram of accuracy 120% injection 01 92
7.25 Chromatogram of accuracy 120% injection 02 92
7.26 Chromatogram of accuracy 120% injection 03 92
7.27 Chromatogram of accuracy 130% injection 01 93
7.28 Chromatogram of accuracy 130% injection 02 93

v
FIGURE NO. TITLE PAGE
NO.
7.29 Chromatogram of accuracy 130% injection 03 93
7.30 Chromatogram of Precision solution – l 96
7.31 Chromatogram of Precision solution – lI 96
7.32 Chromatogram of Precision solution – lII 97
7.33 Chromatogram of Precision solution – lV 97
7.34 Chromatogram of Precision solution – V 97
7.35 Chromatogram of Precision solution –Vl 98
7.36 Chromatogram of robustness at wavelength 286 nm 100
7.37 Chromatogram of robustness at wavelength 290 nm 100
7.38 Chromatogram of robustness (flow rate at 0.375 ml /min) 101
7.39 Chromatogram of robustness (flow rate at 0.425 ml /min) 101
LIST OF ABBEREVIATIONS
ACN : Acetonitrile
API : Active Pharmaceutical Ingredient
AR : Analytical Reagent
AU : Absorbance unit
BP : British Pharmacopoeia
DPD : Domperidone
FDA : Food and Drug Administration
gm : Gram
HPLC : High-Performance Liquid Chromatography
ICH : International Conference on Harmonization
ID : Internal diameter
IP : Indian Pharmacopoeia
IPZ : Ilaprazole
LC : Liquid Chromatography
LOD : Limit of Detection
LOQ : Limit of Quantification
mg : Milligram
µg : Microgram

min : Minute
ml : millilitre
N : Theoretical Plates
NMT : Not More Than
NLT : Not Less Than
nm : Nanometer
QA : Quality Assurance
QC : Quality Control
R2 : Correlation Coefficient
RP-HPLC : Reverse Phase High-Performance Liquid Chromatography
RP-UPLC : Reverse Phase Ultra-Performance Liquid Chromatography
RS : Related Substance
RSD : Relative Standard Deviation
S/N : Signal / Noise
SD : Standard Deviation
UPLC : Ultra- Performance Liquid Chromatography
USP : United States Pharmacopoeia
v/v : Volume / Volume
WHO : World Health Organization

METHOD DEVELOPMENT AND VALIDATION FOR THE SIMULTANE OUS ESTIMATION OF ILAPRAZOLE AND DOMPERIDONE IN CAP SULE DOSAGE FORM BY UPLC
Department of Pharmaceutical Analysis Page 1
INTRODUCTION
METHOD DEVELOPMENT AND VALIDATION FOR THE SIMULTANE OUS ESTIMATION OF ILAPRAZOLE AND DOMPERIDONE IN CAP SULE DOSAGE FORM BY UPLC
Department of Pharmaceutical Analysis Page 2
1. INTRODUCTION
Pharmaceutical analysis plays a vital role in the Quality Assurance and Quality control of
bulk drugs. Analytical chemistry involves separation, identification, and determining the relative
amounts of components in a sample matrix. Pharmaceutical analysis is a specialized branch of
analytical chemistry that derives its principles from various branches of sciences like physics,
microbiology, nuclear science, and electronics etc. Qualitative analysis is required before a
quantitative analysis can be undertaken.
Analytical chemistryis defined asthescience and art of developing sensitive, reliable and
accurate method for determining the composition of materials in terms of elements or compounds
which they contain. Pharmaceutical analysis comprises those procedures necessary to determine the
identity, strength, quality and purity of drug and chemicals Pharmaceutical analysis deals mainly
with bulk materials, dosage forms and more recently, biological samples in support of bio-
pharmaceutical and pharmacokinetic studies.[1]
Pharmaceutical analysts in research and development (R&D) of pharmaceutical industry
plays a very comprehensive role in new drug development and follow up activities toassure that a
new drug product meets the established standards, its stability and continued to meet the purported
quality throughout its shelf life.
The different activity of R&D includes drug development, (synthesis and manufacture),
formulation, clinical trials, evaluations and finally launching i.e. finished products.
Closelyassociated with these are regulatory and quality assurance functions.
Analytical method development and validation is a good research in the field of
Pharmaceutical analysis, utilized to determine the drug content in bulk and pharmaceutical dosage
forms and in biological fluids like blood, serum, urine etc. In view of the industrial scenario and
literature, it was noted that chromatographic techniques like HPLC, LC–MS/MS methods have

METHOD DEVELOPMENT AND VALIDATION FOR THE SIMULTANE OUS ESTIMATION OF ILAPRAZOLE AND DOMPERIDONE IN CAP SULE DOSAGE FORM BY UPLC
Department of Pharmaceutical Analysis Page 3
created revolutionary precision and accuracy in quantification of drugs in Formulation and in
biological fluids even at low concentration.[2]
Need for pharmaceutical Analysis[3]
� New drug development.
� Method Validation as for ICH Guidelines
� Research in Pharmaceutical Sciences
� Clinical Pharmacokinetic Studies
When promising results are obtained from explorative validation performed during the
method development phase, then only full validation should be stared. The process of validating a
method cannot be separated from the actual development of method conditions.
A diversity of analytical techniques such as spectroscopy (UV-Visible), gas
chromatography (GC), high performance liquid chromatography (HPLC), Ultra performance liquid
chromatography (UPLC) supercritical fluid chromatography (SFC), capillary electrophoresis (CE)
coupled with selective detectors (diode-array detector (DAD) and mass spectrometry (MS) are
normally used to accomplish the above requirements.
In spite of various techniques existing, HPLC and UPLC has become a universal tool for
pharmaceutical and biomedical research, as well as product analysis. The accessibility of fully
automated systems, excellent quantitative precision, accuracy, sensitivity, selectivity and increased
selection of column stationary phases, applicability to a lane variety of sample, Matrices and ability
to hyphenate with several spectroscopic detectors has made HPLC or UPLC the instrument of
choice for the analysis of most categories of drugs.
METHOD DEVELOPMENT AND VALIDATION FOR THE SIMULTANE OUS ESTIMATION OF ILAPRAZOLE AND DOMPERIDONE IN CAP SULE DOSAGE FORM BY UPLC
Department of Pharmaceutical Analysis Page 4
Correspondingly, HPLC or UPLC methods are profusely used in the field of biomedical
analysis, viz. therapeutic drug monitoring, pharmacokinetic and bioequivalence studies. The assay
of drugs in blood, plasma and tissues presents analytical challenges. The drug substance is typically
present at low concentrations, bound to proteinaceous material and endogenous compounds
typically present in the samples can interfere with the analysis. For these reasons, the analytical
methods usually be highly sensitive to detect analytes at low concentrations and required a sample
pre-treatment procedure such as liquid-liquid extraction (LLE) or solid phase extraction (SPE), to
isolate the analyte from the complex biological matrix. Hence, high sensitivity and automation of
sample processing tools to deal with large number of samples are strong incentives for the
consideration of HPLC or UPLC methods in biomedical analysis.
UPLC comes from HPLC .Ultra Performance Liquid Chromatography (UPLC) is a
relatively new technique giving new possibilities in liquid chromatography, especially concerning
decrease of time and solvent consumption. This enhanced the demand for UPLC methods for the
simultaneous determination of drugs in pharmaceutical mixtures.[4]
1.1 TYPES
Traditionally, analytical chemistry has been split in to two main types, qualitative and
quantitative:
1.1.1 Qualitative
• Qualitative inorganic analysis seeks to establish the presence of a given element or inorganic
compound in sample.
• Qualitative organic analysisseeks to establish the presence of a givenfunctional group or
Organic compound in a sample.

METHOD DEVELOPMENT AND VALIDATION FOR THE SIMULTANE OUS ESTIMATION OF ILAPRAZOLE AND DOMPERIDONE IN CAP SULE DOSAGE FORM BY UPLC
Department of Pharmaceutical Analysis Page 5
1.1.2Quantitative
• Quantitative analysis seeks to establish the amount of given element or compound in a
sample.
Most modern analytical chemistry is categorized by two different approaches such
asAnalyticaltargets or analytical methods[5].
� By Analytical Targets
• Bio analytical chemistry
• Material analysis
• Chemical analysis
• Environmental analysis
• Forensics
� By Analytical Methods
• Spectroscopy
• Mass spectroscopy
• Spectrophotometry and colorimetric
• Chromatography and Electrophoresis
• Crystallography
• Microscopy
• Electrochemistry
� Traditional analytical techniques
• Titration
• Gravimetry
• Inorganic qualitative analysis
� Instrumental analysis
• Spectroscopy
• Mass spectroscopy
• Crystallography
• Electrochemical Analysis
• Thermal analysis
• Separation
• Hybrid Techniques
• Microscopy
Analytical chemistry research is largely driven by performance (sensitivity, selectivity, robustness,
linear range , accuracy, precision, and speed), and cost ( purchase, operation, training, time, and
space).
Analytical chemistry has played critical roles In the understanding of basic science to a
variety of practical applications, such as biomedical applications, environmental monitoring,
quality control of industrial manufacturing, forensic science and so on.
Pharmaceutical analysis plays a very significant role in quality control of
pharmaceuticals through a rigid check on raw materials used in manufacturing of formulations
and on finished products. It also plays an important role building up the quality productsthrough
METHOD DEVELOPMENT AND VALIDATION FOR THE SIMULTANE OUS ESTIMATION OF ILAPRAZOLE AND DOMPERIDONE IN CAP SULE DOSAGE FORM BY UPLC
Department of Pharmaceutical Analysis Page 6
in processquality control. Pharmaceutical analysis is the application of principles of analytical
chemistry to drug analysis.
The analytical chemistry may be defined as the science of developing sensitive, relative
and accurate methods for determining the composition of materials in terms of elements or
compounds which they contain.The most importantcomponent aspectanalysis is quantitative
chemical analysis. In the presence age, the physical, chemical andbiological analysis, involve
computerized techniques to facilitate better result.[6]
1.2. ANALYTICAL TECHNIQUES [7]
SPECTROSCOPY APPLICATIONS
Atomic Absorption and Emission
spectroscopy(AAS/AES)
To analyse alkali and alkaline earth metals indilute solution,
natural liquids, and extracts at trace levels.
Ultraviolet-visibleSpectroscopy
(UV/Vis)
To analyse molecular (organic) and ionic species capable
ofabsorbingat UV orVisible wave lengths in dilute solutions.
Fourier Transform
infraredSpectroscopy(FT-IR)
To analyse only molecular compounds(Organiccompounds,
natural products, polymers, etc.).
Fourier Transform
RamanSpectroscopy (FT-Raman)
To analyse molecular (organic) compounds which are not
responding well in the IR region and hence, it is an alternative
IR.
Nuclear Magnetic
ResonanceSpectroscopy
To identify and characterize the organic and inorganic
compounds.
Microwave spectroscopy To analyse simple gaseous molecules in far in region to study
their stereo chemistry.
Electron spin resonance
Spectroscopy (ESR)
To study the information and lifetime of the free radicals
formed in organic reactions and all finds applications in
biological works.
Molecular
Fluorescencespectroscopy
To study the molecular and ionic compounds in dilute
solutions capable giving fluorescence, applications in vitamin
analysis.

METHOD DEVELOPMENT AND VALIDATION FOR THE SIMULTANE OUS ESTIMATION OF ILAPRAZOLE AND DOMPERIDONE IN CAP SULE DOSAGE FORM BY UPLC
Department of Pharmaceutical Analysis Page 7
1.2.1 CHROMATOGRAPHY
1.2.2 THERMAL ANALYSIS
1.2.3 X-RAY TECHNIQUE
X-ray fluorescence(XRF)
Spectrometry
To identify the elements and their states present in the surface
of the materials.
X-ray Diffractometry(XRD) To study the crystalline properties of solid substances.
1.2.4 MICROSCOPY
Scanning electron
microscopy(SEM)
To Study the topography, electronic structure and
compositions of metals, ceramics, polymers, composites and
biological materials.
Transmission electron
microscopy(TEM)
To study the local structures, morphology, and Dispersion of
multi-component polymers, cross sections of crystallizations
of metallic alloys, semiconductors, microstructure of
composites, etc.
Scanning probe microscopy(SPM) To study the hardness and topography of materials like
ceramics, polymers, composites, etc. on a nano scale range.
High Performance Liquid
chromatography
To separate and analyse complex mixtures or solutions which
include liquids and solids and solids of both organic and
inorganic origins.
Gas chromatography To separate and analyse mixtures of volatile organic
compounds, solvent extracts and gases.
Thermo gravimetric analysis
(TGA)
To study the mass charges of materials like polymers, glasses,
ceramics, etc., such as evaporation ,decomposition gas
absorption, desorption, dehydration etc.,
Thermo mechanical analysis
(TMA)
To study the expansion coefficient of composite and laminate
materials.
Differential thermal analysis
(DTA)
To study the exothermic and endothermic behaviour of clay
materials, ceramics, ores, etc.,

METHOD DEVELOPMENT AND VALIDATION FOR THE SIMULTANE OUS ESTIMATION OF ILAPRAZOLE AND DOMPERIDONE IN CAP SULE DOSAGE FORM BY UPLC
Department of Pharmaceutical Analysis Page 8
1.2.5 ELECTRO-CHEMICAL TECHNIQUES
Polarography To study and determine metals, metal complexes, and organic
compounds in trace levels.
Capillary electrophoresis(CE) To study and characterize biologically active compounds like
proteins, amino acids and bio- molecules.
1.2.6 MISCELLANEOUS TECHNIQUES
Total organic carbon analyser
(TOC)
To monitor pollutants in environmental studies by
determining the carbon contents of the trace compounds.
Elemental Analyser(CHN/S)
To estimate percentage compositions of elements like carbon,
hydrogen, nitrogen, and sulphur present in newly synthesized
organic compounds, pharmaceuticals, etc.
Polarimetry To analyse and quantitative optically active compounds like
sugar.
Circular Dichroism(CD) and
optical Rotatory Dispersion(ORD)
To get the structural information of optically active
compounds like, amino acids, proteins etc.
Vibrational Circular
Dichroism(VCD)
and Vibrational Linear
Dichroism(VLD)
Same as above but in the IR region. VLD measurement is
employed to study the molecular orientations of
thin polymer films.
Mass spectrometry(MS) To identify the organic compounds. Often used as
detectors with HPLC and GC.
Laser Light scattering
system(LLIS)
In the study ofmacromolecules like polymers, Gels, proteins,
etc. for determining molecular mass and size and their
associations.

METHOD DEVELOPMENT AND VALIDATION FOR THE SIMULTANE OUS ESTIMATION OF ILAPRAZOLE AND DOMPERIDONE IN CAP SULE DOSAGE FORM BY UPLC
Department of Pharmaceutical Analysis Page 9
1.3 CHROMATOGRAPHY
1.3.1 Introduction to Chromatography
Chromatography is relatively a new technique which was first invented by M. Tswett, a
botanist in 1906 in Warsaw. In that year, he was successful in doing the separation of chlorophyll,
Xanthophyll and several other coloured substances by percolating vegetable extracts through a
column of calcium carbonate. The calcium carbonate column acted as an adsorbent and the different
substances got adsorbed to different extent and this gives rise to coloured bands at different
positions, ion the column. Tswett termed this system of coloured bands as the chromatogram and
the method as chromatography after the Greek words Chroma and graphs meaning “colour” and
“writing” respectively. However, in the majority of chromatographic procedures no coloured
products are formed and the term is a misnomer.
Chromatography is a non-destructive procedure[8] for resolving a multi-component mixture
of trace, minor, or major constituents into its individual fractions. Different variations may be
applied to solids, liquids, and gases. While chromatography may be applied both quantitatively, it is
primarily a separation tools.
1.3.2 Definition of Chromatograph
Chromatography may be defined as a method of separating a mixture of components into
individualcomponents through equilibrium distribution between two phases. Essentially, the
technique of chromatography is based on the differences in the rate at which the components of a
mixture move through a porous medium (called stationary phase) under the influence of some
solvent or gas (called moving phase)[8].
The chromatography method of separation [8], in general, involves the following steps:
1. Adsorption or retention of a substance or separation, in general involves the following steps:
2. Separation of the adsorbed substances by the mobile phase.
3. Recovery of the separated substances by a continuous flow of the mobile phase, the method
being called elution.
4. Qualitative and quantities analysis of the eluted substances.

METHOD DEVELOPMENT AND VALIDATION FOR THE SIMULTANE OUS ESTIMATION OF ILAPRAZOLE AND DOMPERIDONE IN CAP SULE DOSAGE FORM BY UPL
Department of Pharmaceutical Analysis
1.3.3 Classification of Chromatographic Techniques
� According to nature
and mobile phase:
� Gas Solid chromatography
� Gas liquid chromatography
� Solid liquid chromatography
� Liquid liquid chromatography
1.3.3.1 Adsorption Chromatography:
Adsorption chromatography
around. It utilizes a mobile liquid or gaseous phase that is
a stationary solid phase. The equilibration between the mobile and stationary phase
the separation of different solutes.
Figure 1.1 A
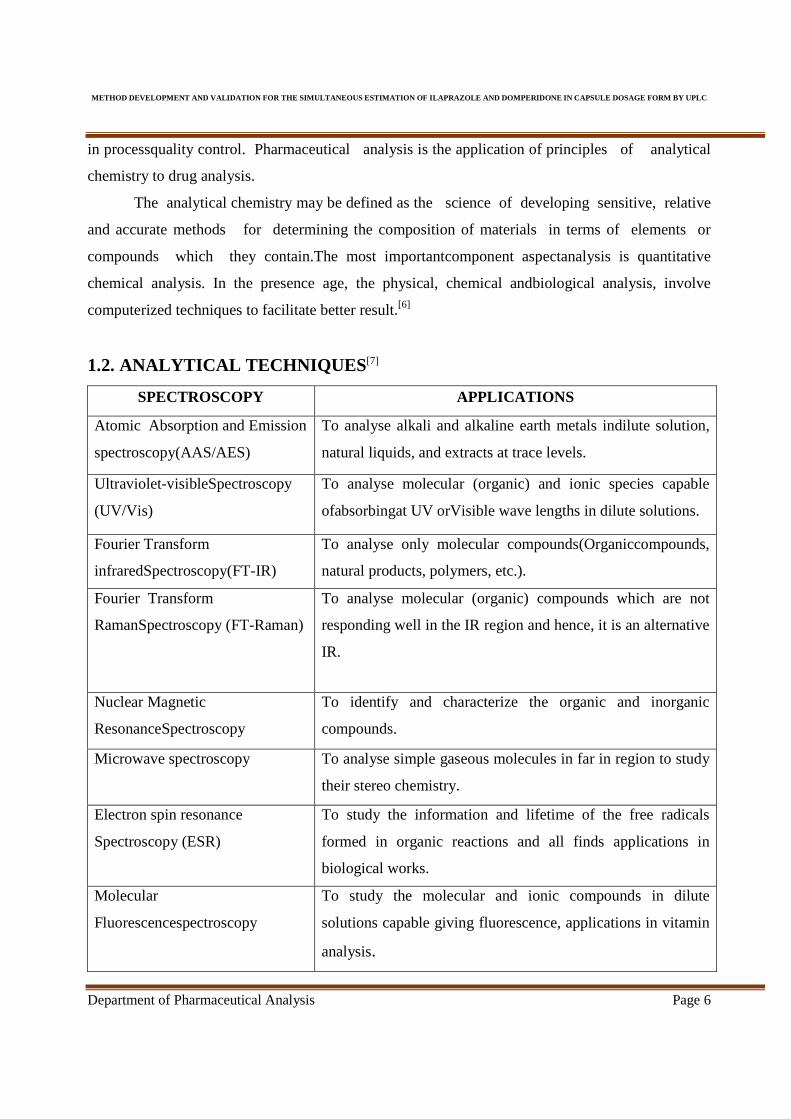
1.3.3.2 Partition Chromatography:
This form of chromatography is based on a thin film formed on the surface of a solid
by a liquid stationary phase. Solute equilibrates between the mobile phase and the
METHOD DEVELOPMENT AND VALIDATION FOR THE SIMULTANE OUS ESTIMATION OF ILAPRAZOLE AND DOMPERIDONE IN CAP SULE DOSAGE FORM BY UPL
nalysis
f Chromatographic Techniques
of stationary
chromatography
Gas liquid chromatography
Solid liquid chromatography
Liquid liquid chromatography
� According to mechanisms of
separation:
� Adsorption chromatography
� Partition chromatography
� Ion exchange chromatography
� Molecular exclusion
chromatography
� Af finity chromatography
� Chiral chromatography
Adsorption Chromatography:
Adsorption chromatography[8]is probably one of the oldest types of chromatography
around. It utilizes a mobile liquid or gaseous phase that is adsorbed onto the surface of
a stationary solid phase. The equilibration between the mobile and stationary phase
the separation of different solutes.
1.1 Adsorption phenomenon in chromatography
Chromatography:
This form of chromatography is based on a thin film formed on the surface of a solid
by a liquid stationary phase. Solute equilibrates between the mobile phase and the
METHOD DEVELOPMENT AND VALIDATION FOR THE SIMULTANE OUS ESTIMATION OF ILAPRAZOLE AND DOMPERIDONE IN CAP SULE DOSAGE FORM BY UPLC
Page 10
According to mechanisms of
Adsorption chromatography
Partition chromatography
Ion exchange chromatography
Molecular exclusion
chromatography
finity chromatography
Chiral chromatography
is probably one of the oldest types of chromatography
adsorbed onto the surface of
a stationary solid phase. The equilibration between the mobile and stationary phaseaccounts for
dsorption phenomenon in chromatography
This form of chromatography is based on a thin film formed on the surface of a solidsupport
by a liquid stationary phase. Solute equilibrates between the mobile phase and thestationary liquid.
METHOD DEVELOPMENT AND VALIDATION FOR THE SIMULTANE OUS ESTIMATION OF ILAPRAZOLE AND DOMPERIDONE IN CAP SULE DOSAGE FORM BY UPL
Department of Pharmaceutical Analysis
Figure 1.2
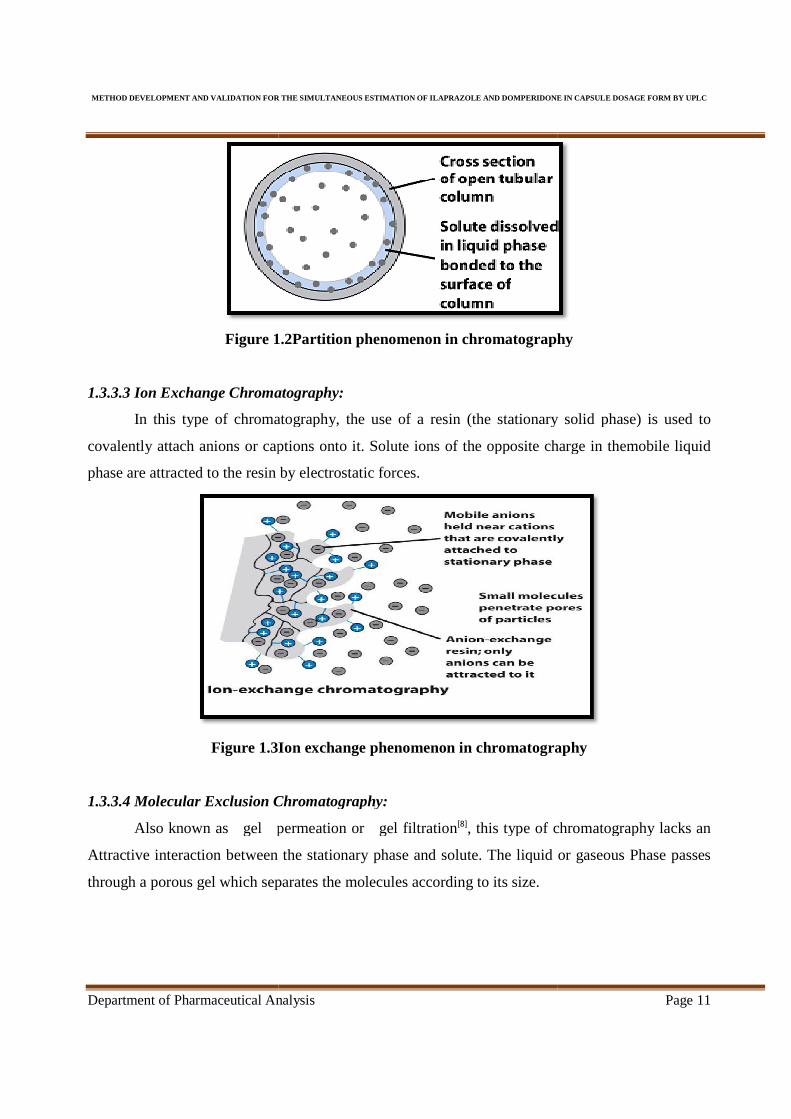
1.3.3.3 Ion Exchange Chromatography:
In this type of chromatography, the use of a resin (the stationary solid phase) is used to
covalently attach anions or captions onto it. Solute ions of the opposite charge in the
phase are attracted to the resin by electrostatic forces.
Figure 1.3Ion exchange phenomenon in chromatography
1.3.3.4 Molecular Exclusion Chromatography:
Also known as gel permeation or gel filtration
Attractive interaction between the
through a porous gel which separates the molecules
METHOD DEVELOPMENT AND VALIDATION FOR THE SIMULTANE OUS ESTIMATION OF ILAPRAZOLE AND DOMPERIDONE IN CAP SULE DOSAGE FORM BY UPL
nalysis
1.2Partition phenomenon in chromatography
Ion Exchange Chromatography:
In this type of chromatography, the use of a resin (the stationary solid phase) is used to
ovalently attach anions or captions onto it. Solute ions of the opposite charge in the
to the resin by electrostatic forces.
Ion exchange phenomenon in chromatography
Molecular Exclusion Chromatography:
Also known as gel permeation or gel filtration[8], this type of chromatography lacks
Attractive interaction between the stationary phase and solute. The liquid or
porous gel which separates the molecules according to its size.
METHOD DEVELOPMENT AND VALIDATION FOR THE SIMULTANE OUS ESTIMATION OF ILAPRAZOLE AND DOMPERIDONE IN CAP SULE DOSAGE FORM BY UPLC
Page 11
aphy
In this type of chromatography, the use of a resin (the stationary solid phase) is used to
ovalently attach anions or captions onto it. Solute ions of the opposite charge in themobile liquid
Ion exchange phenomenon in chromatography
type of chromatography lacks an
hase and solute. The liquid or gaseous Phase passes

METHOD DEVELOPMENT AND VALIDATION FOR THE SIMULTANE OUS ESTIMATION OF ILAPRAZOLE AND DOMPERIDONE IN CAP SULE DOSAGE FORM BY UPL
Department of Pharmaceutical Analysis
Figure 1.4Molecular Exchange phenomenon in chromatography
The pores are normally small and exclude the larger solute molecules, but allow smaller
molecules to enter the gel, causing them to flow through a larger volume. This causes the
molecules to pass through the column at a faster rate than the smaller ones.
1.3.3.5 Affinity Chromatography:
Affinity chromatography
phases. This technique is mostly used the field of biotechnology, micro biology, biochemistry
etc.
1.3.3.6 Chiral Phase Chromato
Separations of opticalisomer can
operate for different types of stationary
used for this type ofchromatography aremostly chemically
separation, HPLC and HPTLC methods
because of itssimplicity, precision
1.3.3.7 High Performance Liquid
The acronym HPLC, coined by the late Prf.
originally indicated the fact that high pressure was used to genera
chromatography in packed columns
METHOD DEVELOPMENT AND VALIDATION FOR THE SIMULTANE OUS ESTIMATION OF ILAPRAZOLE AND DOMPERIDONE IN CAP SULE DOSAGE FORM BY UPL
nalysis
Molecular Exchange phenomenon in chromatography
normally small and exclude the larger solute molecules, but allow smaller
olecules to enter the gel, causing them to flow through a larger volume. This causes the
molecules to pass through the column at a faster rate than the smaller ones.
Affinity Chromatography:
Affinity chromatography[8] uses the affinity of the sample with specific stationary
phases. This technique is mostly used the field of biotechnology, micro biology, biochemistry
Chiral Phase Chromatography:
of opticalisomer can be done by using stationary phases
of stationary phasesand different samples.The stationary phases
type ofchromatography aremostly chemically bonded silica gel
separation, HPLC and HPTLC methods have widely been exploited in
, precision, accuracy, andreproducibility of results.
High Performance Liquid Chromatography
nym HPLC, coined by the late Prf. Casaba Horvath for his 1970
originally indicated the fact that high pressure was used to generate the flow required for liquid
chromatography in packed columns[9].
METHOD DEVELOPMENT AND VALIDATION FOR THE SIMULTANE OUS ESTIMATION OF ILAPRAZOLE AND DOMPERIDONE IN CAP SULE DOSAGE FORM BY UPLC
Page 12
Molecular Exchange phenomenon in chromatography
normally small and exclude the larger solute molecules, but allow smaller
olecules to enter the gel, causing them to flow through a larger volume. This causes thelarger
uses the affinity of the sample with specific stationary
phases. This technique is mostly used the field of biotechnology, micro biology, biochemistry
stationary phases different principles
The stationary phases are
gel[8]. In chromatographic
pharmaceutical analysis
Casaba Horvath for his 1970 Pittston paper,
te the flow required for liquid
METHOD DEVELOPMENT AND VALIDATION FOR THE SIMULTANE OUS ESTIMATION OF ILAPRAZOLE AND DOMPERIDONE IN CAP SULE DOSAGE FORM BY UPL
Department of Pharmaceutical Analysis
In the beginning, pumps only had a pressure capability of 500 psi. This was called high
pressure liquid chromatography, or HPLC
The early 1970s saw a tremendous leap in technology. These new HPLC instruments could
develop up to 6,000 psi of pressure, and incorpo
HPLC really began to take hold in the mid
With continued advances in performance during this time (smaller particles, even higher
pressure), the acronym HPLC remained the same, but the na
liquid chromatography.
High performance liquid chromatography
analytical chemistry. It has the ability to separate, identify, and quantitative the compounds that are
present in any sample that can be dissolved in a liquid
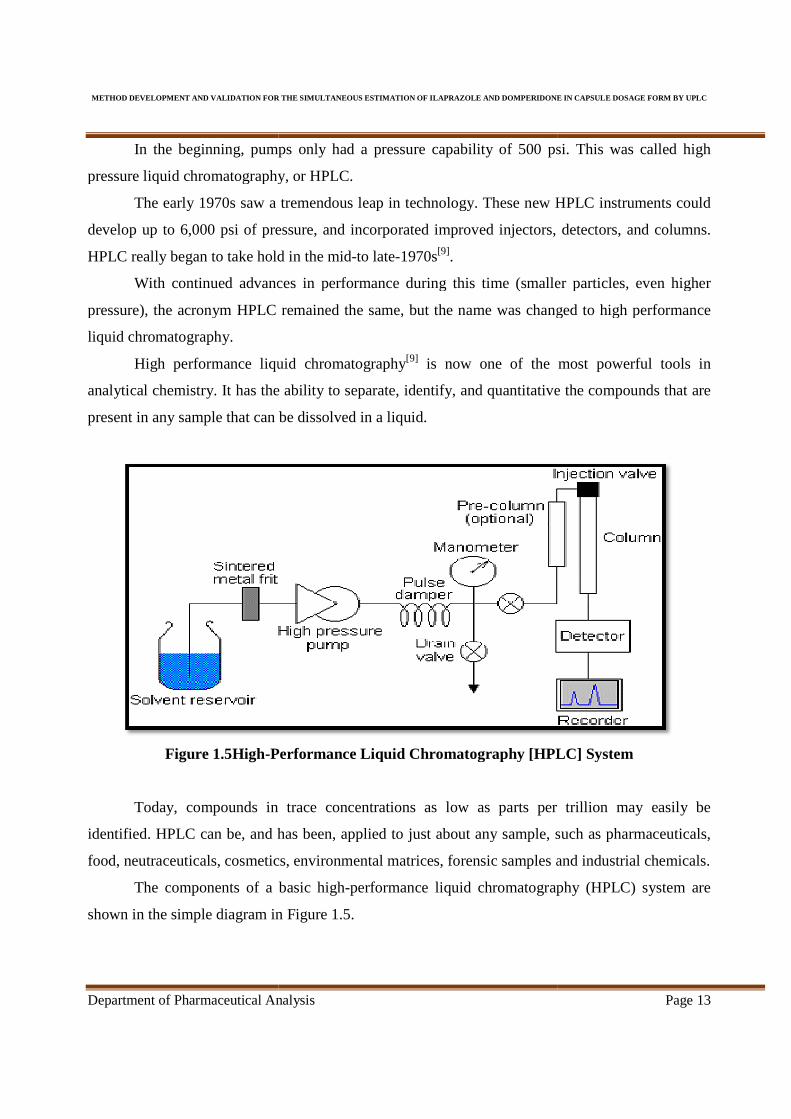
Figure 1.5High-Performance Liquid Chromatography [
Today, compounds in trace concentrations as low as parts per trillion may easily be
identified. HPLC can be, and has been, applied to just about any s
food, neutraceuticals, cosmetics,
The components of a basic high
shown in the simple diagram in Figure
METHOD DEVELOPMENT AND VALIDATION FOR THE SIMULTANE OUS ESTIMATION OF ILAPRAZOLE AND DOMPERIDONE IN CAP SULE DOSAGE FORM BY UPL
nalysis
beginning, pumps only had a pressure capability of 500 psi. This was called high
pressure liquid chromatography, or HPLC.
The early 1970s saw a tremendous leap in technology. These new HPLC instruments could
develop up to 6,000 psi of pressure, and incorporated improved injectors, detectors, and columns.
HPLC really began to take hold in the mid-to late-1970s[9].
With continued advances in performance during this time (smaller particles, even higher
pressure), the acronym HPLC remained the same, but the name was changed to high performance
High performance liquid chromatography[9] is now one of the most powerful tools in
analytical chemistry. It has the ability to separate, identify, and quantitative the compounds that are
present in any sample that can be dissolved in a liquid.
Performance Liquid Chromatography [HPLC] System
Today, compounds in trace concentrations as low as parts per trillion may easily be
identified. HPLC can be, and has been, applied to just about any sample, such as pharmaceuticals,
smetics, environmental matrices, forensic samples and industrial chemicals.
The components of a basic high-performance liquid chromatography (HPLC)
shown in the simple diagram in Figure 1.5.
METHOD DEVELOPMENT AND VALIDATION FOR THE SIMULTANE OUS ESTIMATION OF ILAPRAZOLE AND DOMPERIDONE IN CAP SULE DOSAGE FORM BY UPLC
Page 13
beginning, pumps only had a pressure capability of 500 psi. This was called high
The early 1970s saw a tremendous leap in technology. These new HPLC instruments could
rated improved injectors, detectors, and columns.
With continued advances in performance during this time (smaller particles, even higher
me was changed to high performance
is now one of the most powerful tools in
analytical chemistry. It has the ability to separate, identify, and quantitative the compounds that are
HPLC] System
Today, compounds in trace concentrations as low as parts per trillion may easily be
ample, such as pharmaceuticals,
and industrial chemicals.
performance liquid chromatography (HPLC) system are
METHOD DEVELOPMENT AND VALIDATION FOR THE SIMULTANE OUS ESTIMATION OF ILAPRAZOLE AND DOMPERIDONE IN CAP SULE DOSAGE FORM BY UPLC
Department of Pharmaceutical Analysis Page 14
A reservoir (Solvent Delivery) holds the solvent (called the mobile phase, because it
moves). A high-pressure pump solvent manager is used to generate and meter a specified flow rate
of mobile phase, typically millilitres per minute.
An injector (sample manager or auto sampler) is able to introduce (inject) the sample into
the continuously flowing mobile phase stream that carries the sample into the HPLC column.
The column contains the chromatographic packing material needed to effect the separation.
This packing material is called the stationary phase because it is held in place by the column
hardware. A detector is needed to see the separated compound bands as they elute from the HPLC
column (most compounds have no colour, so we cannot see them with our eyes).
The mobile phase exits the detector and can be sent to waste, or collected, as desired. When
the mobile phase contains a separated compound band, HPLC provides the ability to collect this
fraction of the elute containing that purified compound for further study. This is called preparative
chromatography. The high-pressure tubing and fittings are used to interconnect the pump, injector,
column, and detector components to form the conduit for the mobile phase, sample, and separated
compound bands.
The detector is wired to the computer data station, the HPLC system component that records
the electrical signal needed to generate the chromatogram on its display and to identify and
quantitative the concentration of the sample constituents. Since sample compound characteristics
can be very different, several types of detectors have been developed. For example, if a compound
can absorb ultraviolet light, a UV-absorbance detector is used. If the compound fluoresces, a
fluorescence detector is used. If the compound does not have either of these characteristics, a more
universal type of detector is used, such as an evaporative-light-scattering detector (ELSD). The
most powerful approach is the use multiple detectors in series.
For example, a UV and/or ELSD detector may be used in combination with a mass
spectrometer (MS) to analyse the results of the chromatographic separation. This provides, from a
single injection, more comprehensive information about an analyte. The practice of coupling a mass
spectrometer to an HPLC system is called LC/MS.
METHOD DEVELOPMENT AND VALIDATION FOR THE SIMULTANE OUS ESTIMATION OF ILAPRAZOLE AND DOMPERIDONE IN CAP SULE DOSAGE FORM BY UPL
Department of Pharmaceutical Analysis
1.3.3.8 Ultra Performance Liquid C
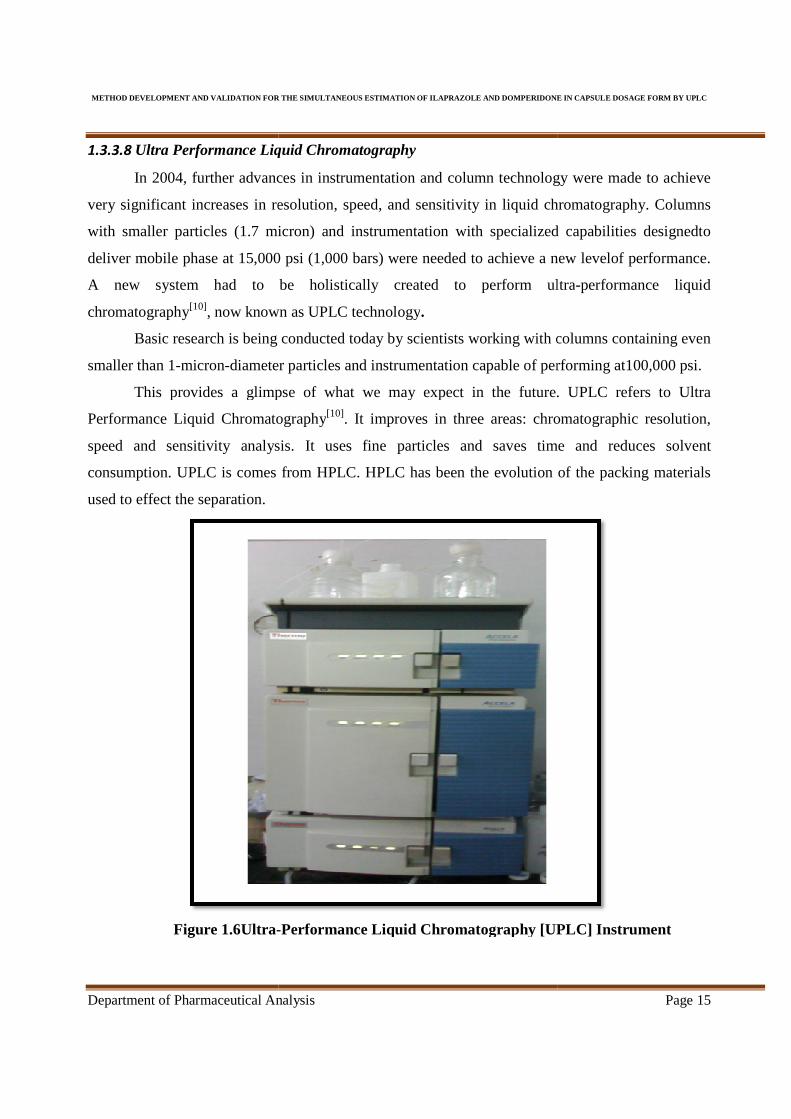
In 2004, further advances in instrumentation and column technology were made to achieve
very significant increases in resolution
with smaller particles (1.7 micron) and instrumentation with specialized
deliver mobile phase at 15,000 psi (1,000 bars) were needed to achieve a
A new system had to be holistically created to perform ultra
chromatography[10], now known as UPLC technology
Basic research is being conducted today by scientists worki
smaller than 1-micron-diameter particles and instrumentation capable of performing at100,000 psi.
This provides a glimpse of what we may expect in the future. U
Performance Liquid Chromatography
speed and sensitivity analysis. It uses fine particles and saves time and reduces solvent
consumption. UPLC is comes from HPLC. HPLC has been the evolution of the packing materials
used to effect the separation.
Figure 1.6Ultra-
METHOD DEVELOPMENT AND VALIDATION FOR THE SIMULTANE OUS ESTIMATION OF ILAPRAZOLE AND DOMPERIDONE IN CAP SULE DOSAGE FORM BY UPL
nalysis
Ultra Performance Liquid Chromatography
In 2004, further advances in instrumentation and column technology were made to achieve
in resolution, speed, and sensitivity in liquid chromatography. Columns
with smaller particles (1.7 micron) and instrumentation with specialized
deliver mobile phase at 15,000 psi (1,000 bars) were needed to achieve a new levelof
new system had to be holistically created to perform ultra
, now known as UPLC technology.
Basic research is being conducted today by scientists working with columns containing even
diameter particles and instrumentation capable of performing at100,000 psi.
This provides a glimpse of what we may expect in the future. U
Liquid Chromatography[10]. It improves in three areas: chroma
sensitivity analysis. It uses fine particles and saves time and reduces solvent
comes from HPLC. HPLC has been the evolution of the packing materials
-Performance Liquid Chromatography [UPLC] Instrument
METHOD DEVELOPMENT AND VALIDATION FOR THE SIMULTANE OUS ESTIMATION OF ILAPRAZOLE AND DOMPERIDONE IN CAP SULE DOSAGE FORM BY UPLC
Page 15
In 2004, further advances in instrumentation and column technology were made to achieve
, speed, and sensitivity in liquid chromatography. Columns
with smaller particles (1.7 micron) and instrumentation with specialized capabilities designedto
new levelof performance.
new system had to be holistically created to perform ultra-performance liquid
ng with columns containing even
diameter particles and instrumentation capable of performing at100,000 psi.
This provides a glimpse of what we may expect in the future. UPLC refers to Ultra
. It improves in three areas: chromatographic resolution,
sensitivity analysis. It uses fine particles and saves time and reduces solvent
comes from HPLC. HPLC has been the evolution of the packing materials
Performance Liquid Chromatography [UPLC] Instrument
METHOD DEVELOPMENT AND VALIDATION FOR THE SIMULTANE OUS ESTIMATION OF ILAPRAZOLE AND DOMPERIDONE IN CAP SULE DOSAGE FORM BY UPLC
Department of Pharmaceutical Analysis Page 16
An underlying principle of HPLC dictates that as column packing particle size decreases,
efficiency and thus resolution also increases. As particle size decreases to less than 2.5µm, there is a
significant gain in efficiency and it’s doesn’t diminish at increased linear velocities or flow rates
according to the common Van Demeter equation. By using smaller particles, speed and peak
capacity (number of peaks resolved per unit time) can be extended to new limits which is known as
Ultra Performance.
The classic separation method of HPLC (High Performance Liquid Chromatography)[10] has
many advantages like robustness, ease of use, good selectivity and adjustable sensitivity. The main
limitation is lack of efficiency compared to gas chromatography or the capillary electrophoresis due
to low diffusion coefficients in liquid phase, involving slow diffusion of analytes in the stationary
phase. The Van Demeter equation shows that efficiency increases with the use of smaller size
particles but this leads to a rapid increase in back pressure, since most of the HPLC system can
operate only up to 400 bar. That is why short columns filled with particles of about 2µm are used
with these systems, to accelerate the analysis without loss of efficiency.
To improve the efficiency of HPLC separations, the following can be done,
(1) Work at higher temperatures
(2) Use of monolithic columns
1.3.3.8.1Principle
The UPLC is based on the principal of use of stationary phase consisting of particles less
than2 μm (while HPLC columns are typically filled with particles of 3 to 5 μm). The underlying
principles of this evolution are governed by the van Demeter equation, which is an empirical
formula that describes the relationship between linear velocity (flow rate) and plate height (HETP
or column efficiency).
The Van Demeter curve, governed by an equation with three components shows that the
usable flow range for a good efficiency with small diameter particles is much greater than for larger
diameters.
H=A+B/v+Cv
Where;
A, Band Care constants
Vis the linear velocity, the carrier gas flow rate.

METHOD DEVELOPMENT AND VALIDATION FOR THE SIMULTANE OUS ESTIMATION OF ILAPRAZOLE AND DOMPERIDONE IN CAP SULE DOSAGE FORM BY UPLC
Department of Pharmaceutical Analysis Page 17
� The A term is independent of velocity and represents "eddy" mixing. It is smallest when the
packed column particles are small and uniform.
� The B term represents axial diffusion or the natural diffusion tendency of molecules. This
effect is diminished at high flow rates and so this term is divided by v.
� The C term is due to kinetic resistance to equilibrium in the separation process. The kinetic
resistance is the time lag involved in moving from the gas phase to the packing stationary
phase and back again. The greater the flow of gas, the more a molecule on the packing tends
to lag behind molecules in the mobile phase. Thus this term is proportional to v.
Therefore it is possible to increase throughput, and thus the speed of analysis without affecting
the chromatographic performance. The advent of UPLC has demanded the development of a new
instrumental system for liquid chromatography, which can take advantage of the separation
performance (by reducing dead volumes) and consistentwith the pressures (about 8000 to 15,000
PSI, compared with 2500 to 5000 PSI in HPLC). Efficiency is proportional to column length and
inversely proportional to the particle size. Therefore, the column can be shortened by the same
factor as the particle size without loss of resolution. The application of UPLC resulted in the
detection of additional drug metabolites, superior separation and improved spectral quality.
� Advantages
• Drastically decreases the run time compared to HPLC.
• Provides selectivity, sensitivity and dynamic range of LC analysis.
• The time spent on optimizing new methods can also be greatly reduced.
• Expands the scope of Multi residue method
• UPLC’s fast resolving power quickly quantifies related and unrelated compounds.
• Use of very fine particle size of novel separation materials reduces the analysis time.
• Operation cost is reduced and less solvent consumption.
• Increases sample throughput and enables manufacturers to produce more material that
consistently meet or exceeds the product specifications, potentially eliminating
variability, failed batches, or the need to re-work material.
• The time needed for column equilibration while using gradient elution and during
method validation is much shorter.

METHOD DEVELOPMENT AND VALIDATION FOR THE SIMULTANE OUS ESTIMATION OF ILAPRAZOLE AND DOMPERIDONE IN CAP SULE DOSAGE FORM BY UPL
Department of Pharmaceutical Analysis
� Disadvantages
• One of the major disadvantages in UPLC is the higher back pressures compared to
conventional HPLC which in turn may reduce the life of the columns.
• This backpressure can be
• In addition, the phases of less than 2
limited use.
Table 1.1Comparison between and HPLC and UPLC
Characteristics
Particle size
Maximum back pressure
Analytical column
Column dimensions
Column temperature
Injection volume
1.3.4Parameters in chromatography
� Retention time(Rt)
• Retention time[11] is the time of elution
METHOD DEVELOPMENT AND VALIDATION FOR THE SIMULTANE OUS ESTIMATION OF ILAPRAZOLE AND DOMPERIDONE IN CAP SULE DOSAGE FORM BY UPL
nalysis
One of the major disadvantages in UPLC is the higher back pressures compared to
conventional HPLC which in turn may reduce the life of the columns.
This backpressure can be reduced by increasing the column temperature.
In addition, the phases of less than 2μm are generally non regenerable
Comparison between and HPLC and UPLC
HPLC
3 to 5m Less than 2m
35-40MPa 103.Mp
Altima C18 Acuity UPLC BEH C
150X3.2mm 150X2.1mm
300C 650c
5µL(std.In100% Me OH) 2µL(std.In100% ME OH)
chromatography
is the time of elution of peak maximum after injection of compound.
METHOD DEVELOPMENT AND VALIDATION FOR THE SIMULTANE OUS ESTIMATION OF ILAPRAZOLE AND DOMPERIDONE IN CAP SULE DOSAGE FORM BY UPLC
Page 18
One of the major disadvantages in UPLC is the higher back pressures compared to
conventional HPLC which in turn may reduce the life of the columns.
reduced by increasing the column temperature.
non regenerable and thus have
UPLC
Less than 2m
103.Mpa
Acuity UPLC BEH C18
150X2.1mm
2µL(std.In100% ME OH)(7)
after injection of compound.
METHOD DEVELOPMENT AND VALIDATION FOR THE SIMULTANE OUS ESTIMATION OF ILAPRAZOLE AND DOMPERIDONE IN CAP SULE DOSAGE FORM BY UPLC
Department of Pharmaceutical Analysis Page 19
� Retention volume (Vr)
Retention volume[11] is the volume of mobile phase to elute 50% of the compound from
the column. It is the product of retention time and flow rate.
Component Retention volume (Vr) could split into two parts:
� Reduced retention volume is the volume of the eluent that passed through the column
while the component
� Dead volume is the volume of the eluent that passed the column while the component was
moving with the liquid phase.
� Separation factor(S):
Separation factor[11] is the ratio of partition coefficient of the two components to
be separated.
It can be expressed and determined by using the following equation:
S=Kb /Ka=tb-t0/ta-t0
Wheret0 = retention time of unretained substance.
Kb = partition coefficients of b and a
tb,ta = retention time of substance of band a
S = depends in liquid phase, column temperature
If there is more difference in partition coefficient between two compounds, the peaks are far
apart and the separation factors are more. If the separation coefficients of two compounds
are similar, then the peaks are closer and the separation factor is less.
� Capacity factor (k')
It is the measure of how well the sample molecule is retained by the column during
an isocratic separation. It is affected by solvent composition, separation and aging and
temperature of separation[11].
K' = V1-V0/V0
Where V1 = retention volume at apex of the peak.
V0 = void volume of system where an unretained component elutes.

METHOD DEVELOPMENT AND VALIDATION FOR THE SIMULTANE OUS ESTIMATION OF ILAPRAZOLE AND DOMPERIDONE IN CAP SULE DOSAGE FORM BY UPLC
Department of Pharmaceutical Analysis Page 20
� Selectivity (α)
• The selectivity is a measure of relative retention of two components in a mixture.
• Selectivity[11] is the ratio of the capacity factors of both corresponding peaks.
• It can be calculated by following formula:
� Resolution (r):
Resolution expresses the separation of two components in a mixture that determined by the
following equation:
Where,
� t2and t1 are the retention times of the two components.
� w2andw1 are the corresponding widths at the bases of the peaks obtained by
� Extrapolating the relatively straight sides of the peaks to the baseline.
Where electronic integrators are used, it may be convenient to determinethe resolution, R,
by the following equation:
Where by W1 h/2 andW2 h/2 are the widths at half-height of corresponding peaks.
For better separation, the ideal value of R is 1.5

METHOD DEVELOPMENT AND VALIDATION FOR THE SIMULTANE OUS ESTIMATION OF ILAPRAZOLE AND DOMPERIDONE IN CAP SULE DOSAGE FORM BY UPL
Department of Pharmaceutical Analysis
� Theoretical plates (N)
The number of theoretical plates
following equation:
Where,
� T is retention time of the peak
� W is the
� Wh/2 is width at half
• Value of theoretical plates, higher than 4000 is indicating good column performance
� Height Equivalent to a Theoretical Plate
A theoretical plate[11] is an ima
solute between stationary phase and mobile phase
a functional unit of the column.
A theoretical plate can be
HETP is less, the column is more
HETP =length of the column /no. of theore
HETP is given by Van Demeter
Where
METHOD DEVELOPMENT AND VALIDATION FOR THE SIMULTANE OUS ESTIMATION OF ILAPRAZOLE AND DOMPERIDONE IN CAP SULE DOSAGE FORM BY UPL
nalysis
N):
The number of theoretical plates[11] is a measure of column efficiency. It is
is retention time of the peak
the width of the peak.
/2 is width at half-height of the peak.
Value of theoretical plates, higher than 4000 is indicating good column performance
Equivalent to a Theoretical Plate(HETP):
is an imaginary or hypothetical unit of a column where distribution of
tionary phase and mobile phase has attained equilibrium.
a functional unit of the column.
can be of any height, which describes the efficiency of
column is more efficient. If HETP is more, the column is less efficient.
/no. of theoretical plates
is given by Van Demeter equation.
HETP = A+B/u+Cu
METHOD DEVELOPMENT AND VALIDATION FOR THE SIMULTANE OUS ESTIMATION OF ILAPRAZOLE AND DOMPERIDONE IN CAP SULE DOSAGE FORM BY UPLC
Page 21
is a measure of column efficiency. It is expressed by
Value of theoretical plates, higher than 4000 is indicating good column performance.
column where distribution of
equilibrium. It can also be called as
of any height, which describes the efficiency of separation. If
column is less efficient.

METHOD DEVELOPMENT AND VALIDATION FOR THE SIMULTANE OUS ESTIMATION OF ILAPRAZOLE AND DOMPERIDONE IN CAP SULE DOSAGE FORM BY UPL
Department of Pharmaceutical Analysis
A=Eddy diffusion term or multiple path diffusion which arises
This can be minimized by uniformity
B = longitudinal diffusion term or molecular diffusion.
C = Effect of mass transfer.
U = flow rate
� Asymmetry factor:
The asymmetry factor is a measure of peak
of the peak to the back slope divided by the distance from
slope, with all measurements made at 10% of the maximum peak height.
• Fronting:
Fronting[11] is due to the saturation of stationary phase and can be avoided by using
less quantity of sample.
METHOD DEVELOPMENT AND VALIDATION FOR THE SIMULTANE OUS ESTIMATION OF ILAPRAZOLE AND DOMPERIDONE IN CAP SULE DOSAGE FORM BY UPL
nalysis
or multiple path diffusion which arises due to the packing of the
This can be minimized by uniformity of packing.
longitudinal diffusion term or molecular diffusion.
Effect of mass transfer.
low rate or velocity of mobile phase.
is a measure of peak tailing. It is defined as the distance from the center line
of the peak to the back slope divided by the distance from the center line of the peak to the
all measurements made at 10% of the maximum peak height.
is due to the saturation of stationary phase and can be avoided by using
METHOD DEVELOPMENT AND VALIDATION FOR THE SIMULTANE OUS ESTIMATION OF ILAPRAZOLE AND DOMPERIDONE IN CAP SULE DOSAGE FORM BY UPLC
Page 22
the packing of the column.
as the distance from the center line
the center line of the peak to the front
is due to the saturation of stationary phase and can be avoided by using

METHOD DEVELOPMENT AND VALIDATION FOR THE SIMULTANE OUS ESTIMATION OF ILAPRAZOLE AND DOMPERIDONE IN CAP SULE DOSAGE FORM BY UPLC
Department of Pharmaceutical Analysis Page 23
• Tailing:
It is due to the more active adsorption sites can be eliminated by support pretreatment,
more polar mobile phased increasing the amount of liquid phase.
1.3.5 Method Development and Optimization of Chromatographic Conditions
Methods for analysing drugs in multi component dosage forms can be developed if the
nature of the sample, namely, its molecular weight, polarity, ionic character and the solubility
parameter are in hand. Until and unless considerable trial and error procedures have not performed,
an exact recipe for HPLC cannot be provided[12].
The most difficult problem usually is where to start, what type of column is worth trying
with what kind of mobile phase. In general one begins with reversed phase chromatography, when
the compounds are hydrophilic in nature with many polar groups and are water soluble.
1.3.5.1Selection of stationary phase/ column:
Selection of the column is the initial and the most noteworthy step in method development.
The proper choice of separation column includes three different approaches.
1. Selection of separation system
2. The particle size and the nature of the column packing
3. The physical parameters of the column i.e. the length and the diameter.
Some of the crucial parameters considered while selecting chromatographic Columns. They
are length and diameter of the column, packing material, Shape of the particle, Size of the particles,
% of Carbon loading, Pore volume, Surface area and End capping. The column is selected
depending on the nature of the solute and the information about the analyte, Reversed phase mode
of chromatography facilitates information about the analyte.
Reversed phase mode of chromatography[12] facilitates a wide range of columns like dim
ethylsilane (C2), butylsilane (C4), octylsilane (C8), octadecylsilane (C18), base deactivated silane
(C18) BDS, cyanopropyl (CN), nitro, amino etc.
METHOD DEVELOPMENT AND VALIDATION FOR THE SIMULTANE OUS ESTIMATION OF ILAPRAZOLE AND DOMPERIDONE IN CAP SULE DOSAGE FORM BY UPLC
Department of Pharmaceutical Analysis Page 24
1.3.5.2Selection of mobile phase:
The primary objective in selection and optimization of mobile phase[12] is to achieve
optimum separation of all the individual impurities and degrades from one other and from analyte
peak. In liquid chromatography, the solute retention is governed by the solute distribution factor,
which reflects the different interactions of the solute-stationary phase, solute-mobile phase and the
mobile phase-stationary phase.
For a given stationary phase, the retention of the given solute depends directly upon the
mobile phase, the nature and the composition of which has to be judiciously selected in order to get
appropriate and required solute retention. The mobile phase has to be adapted in terms of elution
strength (solute retention) and solvent selectivity (solute separation).
Solvent polarity is the key word in chromatographic separations since a polar mobile phase
will give rise to low solute retention in normal phase and high solute retention in reverse phase LC.
The selectivity will be particularly altered if the buffer PH is close to thepKaof the analytes;
the solvent strength is a measure of its ability to pull analyte from the column. It is generally
controlled by the concentration of the solvent with the highest strength. Buffers, pH of the buffer,
mobile phase composition are the parameters, which shall be taken into consideration while
selecting and optimizing the mobile phase.
Firstly, Buffer and its strength play an important role in deciding the peak symmetries and
separations. Some of the most, commonly employed buffers are Phosphate buffer (Potassium di
hydrogen phosphate, Di-potassium hydrogen phosphate, Sodium dihydrogen phosphate, Disodium
hydrogen phosphate), Phosphoric acid buffers prepared using O-Phosphoric acid, Acetate buffers
(Ammonium acetate, Sodium acetate) and Acetic acid buffers prepared using acetic acid.
The retention time[12] also depends on the molar strengths of the buffer. Molar strength is
increasingly proportional to retention times. The strength of the buffer can be increased, if
necessary, to achieve the required separations. The solvent strength is a measure of its ability to pull
analytes from the column. It is generally controlled by the concentration of the solvent with the
highest strength. Secondly, pH plays an important role in achieving the chromatographic
separations as it controls the elution properties by controlling the ionization characteristics.
Ware conducted using buffers having different pH to obtain the required separations. It is
important to maintain the pH of the mobile phase in the range of 2.0to8.0 as most columns do not
METHOD DEVELOPMENT AND VALIDATION FOR THE SIMULTANE OUS ESTIMATION OF ILAPRAZOLE AND DOMPERIDONE IN CAP SULE DOSAGE FORM BY UPLC
Department of Pharmaceutical Analysis Page 25
withstand the pH which is outside this range. This is due to the fact that the Siloxane linkage area
gets cleaved below pH 2.0, while pH valued is above 8.0, silica may dissolve.
Finally, by choosing the optimum mobile phase[12] composition most of the
chromatographic separations can be achieved. This is due to the fact that fairly large amount of
selectivity can be achieved by choosing the qualitative and quantitative composition of aqueous and
organic portions. Most widely used solvents in reverse phase chromatography are methanol and
acetonitrile. Experiments were conducted with mobile phases having buffers with different pH and
different organic phases to check for the best separations between the impurities. A mobile phase
which gives separation of all the impurities and degrades from the analyte peak and which is rugged
with variations of both aqueous and organic phase by at least ±0.2% is preferred.
The low solubility of the sample in the mobile phase can also cause bad peak shapes. It is
always advisable to use the same solvents for the preparation of sample solution for the preparation
of sample solution as the mobile phase to avoid precipitation of the compounds in the column
injector.
Optimizations are often started only after a reasonable chromatogram has been obtained. A
reasonable chromatogram means symmetrical peaks in the chromatogram and detection of all the
compounds. By slight modification of the mobile phase composition, the position of the peaks can
be predicted within the range of investigated changes. An optimized chromatogram is the one in
which all the peaks are symmetrical and are well separated in less run time.

METHOD DEVELOPMENT AND VALIDATION FOR THE SIMULTANE OUS ESTIMATION OF ILAPRAZOLE AND DOMPERIDONE IN CAP SULE DOSAGE FORM BY UPLC
Department of Pharmaceutical Analysis Page 26
1.3.6Validation
The word “validation”[13] means “Assessment” of validity or action of validity or action of
providing effectiveness’.
1.3.6.1 Definitions
FDA defines validation as “establish the documented evidence which provides a high of assurance
that a specific process will consistently produce a product of predetermined specifications and
quantity attributes”[14].
WHO action of providing that, any procedure, process, equipment, material, activity, or system
actually leads to the expected results[15].
EUMGP define validation as “action of proving in accordance with the principle of Good
manufacturing practice (GMP), that any material, activity or system actually lead to expected
result”[15].
AUSTRALIANGMP defines validation as “the action of proving that any material, process,
activity, procedure, system, equipment or mechanism and intended results”[15].
1.3.6.2 Method Validation Guidelines
Regulatory agencies and European community, Japan and United States published a number
of guidelines to assist pharmaceutical companies in validation of analytical methods for drug
substances[13-15].
Regulatory agencies such as:
� International Conference on Harmonization (ICH)
� Food and Drug Administration (FDA)
� United States Pharmacopoeia (USP)
METHOD DEVELOPMENT AND VALIDATION FOR THE SIMULTANE OUS ESTIMATION OF ILAPRAZOLE AND DOMPERIDONE IN CAP SULE DOSAGE FORM BY UPLC
Department of Pharmaceutical Analysis Page 27
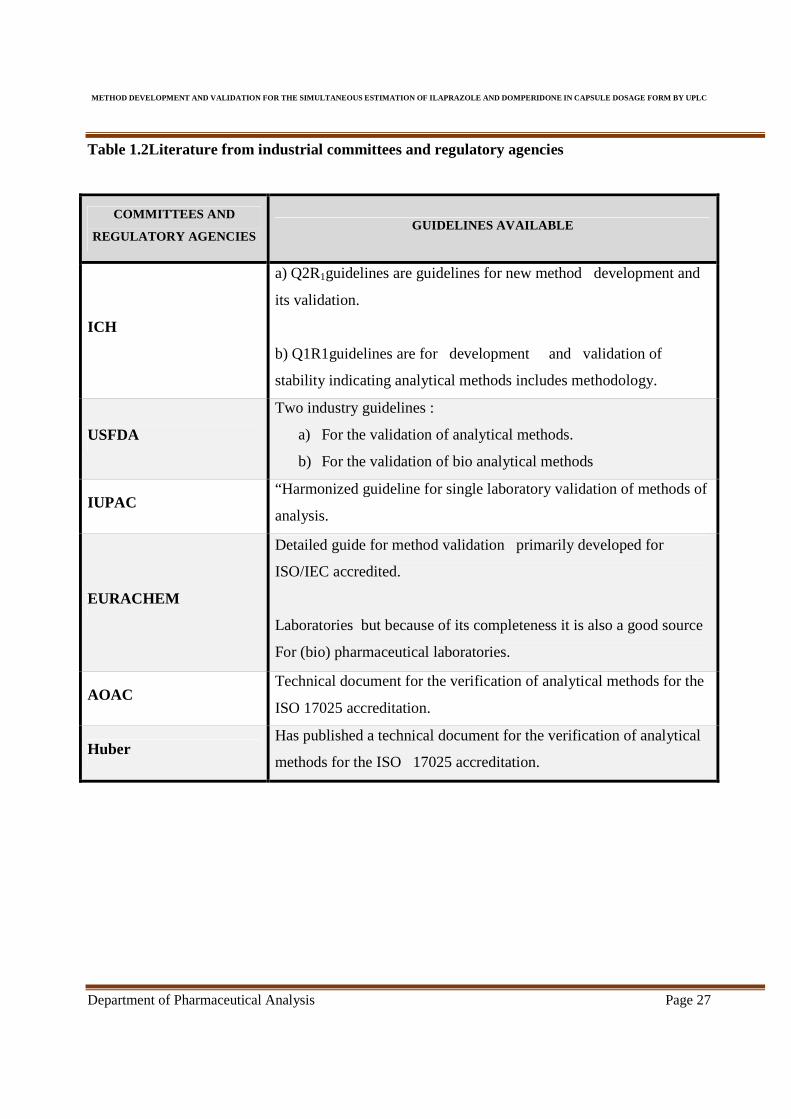
Table 1.2Literature from industrial committees and regulatory agencies
COMMITTEES AND
REGULATORY AGENCIES GUIDELINES AVAILABLE
ICH
a) Q2R1guidelines are guidelines for new method development and
its validation.
b) Q1R1guidelines are for development and validation of
stability indicating analytical methods includes methodology.
USFDA
Two industry guidelines :
a) For the validation of analytical methods.
b) For the validation of bio analytical methods
IUPAC “Harmonized guideline for single laboratory validation of methods of
analysis.
EURACHEM
Detailed guide for method validation primarily developed for
ISO/IEC accredited.
Laboratories but because of its completeness it is also a good source
For (bio) pharmaceutical laboratories.
AOAC Technical document for the verification of analytical methods for the
ISO 17025 accreditation.
Huber Has published a technical document for the verification of analytical
methods for the ISO 17025 accreditation.
METHOD DEVELOPMENT AND VALIDATION FOR THE SIMULTANE OUS ESTIMATION OF ILAPRAZOLE AND DOMPERIDONE IN CAP SULE DOSAGE FORM BY UPLC
Department of Pharmaceutical Analysis Page 28
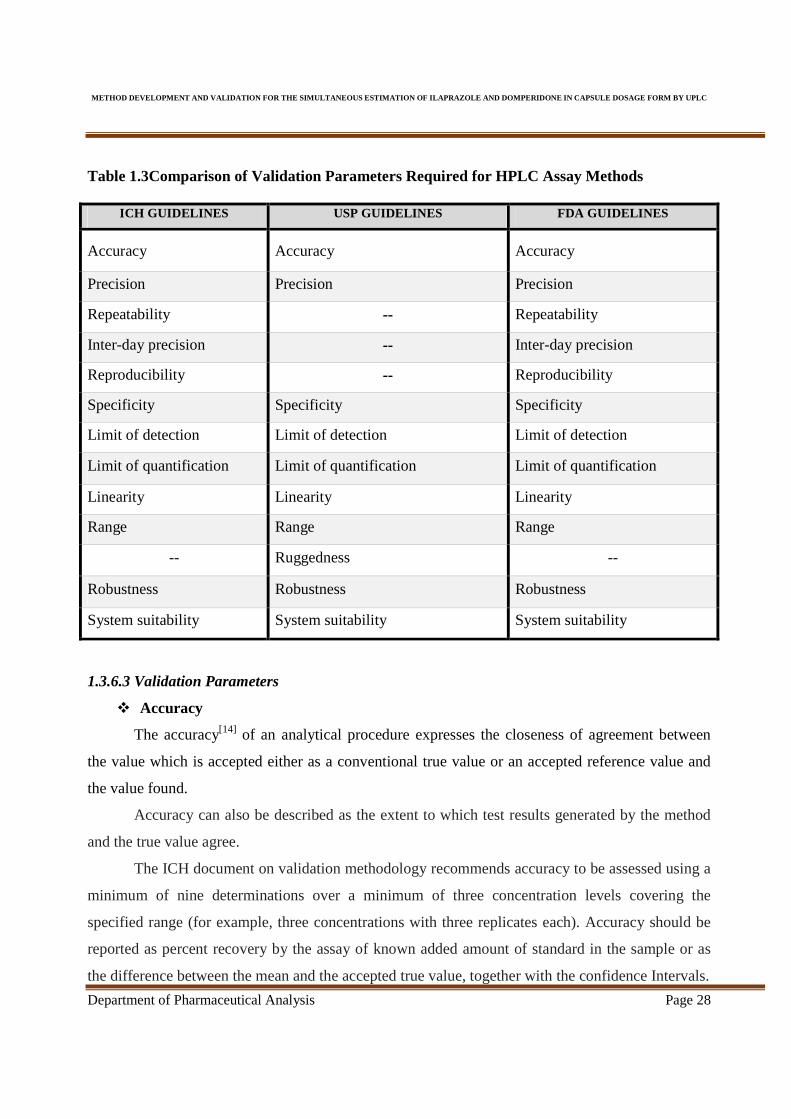
Table 1.3Comparison of Validation Parameters Required for HPLC Assay Methods
1.3.6.3 Validation Parameters
� Accuracy
The accuracy[14] of an analytical procedure expresses the closeness of agreement between
the value which is accepted either as a conventional true value or an accepted reference value and
the value found.
Accuracy can also be described as the extent to which test results generated by the method
and the true value agree.
The ICH document on validation methodology recommends accuracy to be assessed using a
minimum of nine determinations over a minimum of three concentration levels covering the
specified range (for example, three concentrations with three replicates each). Accuracy should be
reported as percent recovery by the assay of known added amount of standard in the sample or as
the difference between the mean and the accepted true value, together with the confidence Intervals.
ICH GUIDELINES USP GUIDELINES FDA GUIDELINES
Accuracy Accuracy Accuracy
Precision Precision Precision
Repeatability -- Repeatability
Inter-day precision -- Inter-day precision
Reproducibility -- Reproducibility
Specificity Specificity Specificity
Limit of detection Limit of detection Limit of detection
Limit of quantification Limit of quantification Limit of quantification
Linearity Linearity Linearity
Range Range Range
-- Ruggedness --
Robustness Robustness Robustness
System suitability System suitability System suitability
METHOD DEVELOPMENT AND VALIDATION FOR THE SIMULTANE OUS ESTIMATION OF ILAPRAZOLE AND DOMPERIDONE IN CAP SULE DOSAGE FORM BY UPLC
Department of Pharmaceutical Analysis Page 29
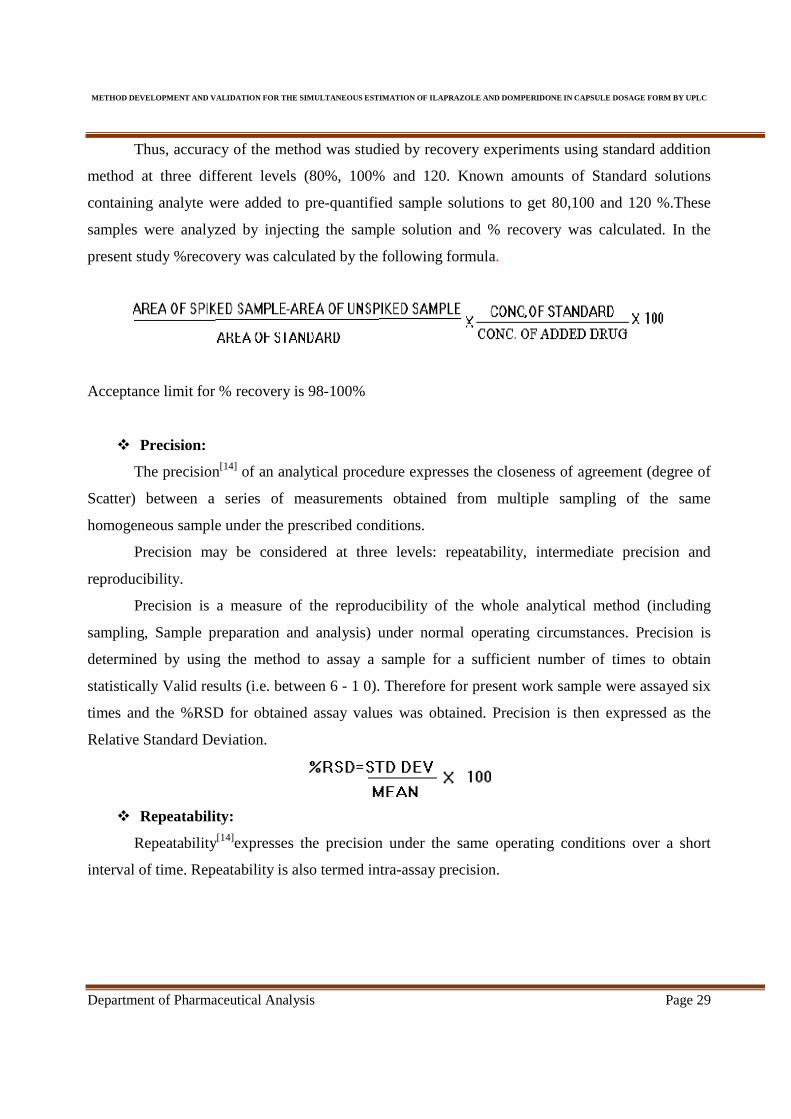
Thus, accuracy of the method was studied by recovery experiments using standard addition
method at three different levels (80%, 100% and 120. Known amounts of Standard solutions
containing analyte were added to pre-quantified sample solutions to get 80,100 and 120 %.These
samples were analyzed by injecting the sample solution and % recovery was calculated. In the
present study %recovery was calculated by the following formula.
Acceptance limit for % recovery is 98-100%
� Precision:
The precision[14] of an analytical procedure expresses the closeness of agreement (degree of
Scatter) between a series of measurements obtained from multiple sampling of the same
homogeneous sample under the prescribed conditions.
Precision may be considered at three levels: repeatability, intermediate precision and
reproducibility.
Precision is a measure of the reproducibility of the whole analytical method (including
sampling, Sample preparation and analysis) under normal operating circumstances. Precision is
determined by using the method to assay a sample for a sufficient number of times to obtain
statistically Valid results (i.e. between 6 - 1 0). Therefore for present work sample were assayed six
times and the %RSD for obtained assay values was obtained. Precision is then expressed as the
Relative Standard Deviation.
� Repeatability:
Repeatability[14]expresses the precision under the same operating conditions over a short
interval of time. Repeatability is also termed intra-assay precision.

METHOD DEVELOPMENT AND VALIDATION FOR THE SIMULTANE OUS ESTIMATION OF ILAPRAZOLE AND DOMPERIDONE IN CAP SULE DOSAGE FORM BY UPLC
Department of Pharmaceutical Analysis Page 30
� Intermediate Precision:
Intermediate precision[14] expresses within-laboratories variations; different days, different
analysts, different equipment, etc. The objective of intermediate precision validation is to verify that
in the same laboratory the method will provide the same results once the development phases over.
The objective is also extent to verify that the method will provide the same results in different
laboratories (ruggedness).
� Reproducibility:
Reproducibility[14] expresses the precision between laboratories (collaborative studies,
usually applied to standardization of methodology).
� Specificity:
ICH defines specificity as “the ability to assess unequivocally the analyte in the presence of
components which may be expected to be present. Typically this might include impurities,
degradants, matrix, etc.”USP<1225>refers to the same definition but also comments that other
reputable authorities such as IUPAC and AOAC use the term “selectivity” for the same meaning.
This reserves the use of “specific” for those procedures that produce a response for a single analyte
only. ISO/IEC most likely has the same understanding because it requires a method to be
“Selective” rather than specific. Our goal is to distinguish and quantify the response of the target
compounds from the responses of all other compounds Selectivity is the ability to measure
accurately and specifically the analyte in the presence of components that may be expected to be
present in the sample matrix.
Specificity[14] for an assay ensures that the signal measured comes from the substance of
interest and that there is no interference from excipient and/or degradation products and/or
impurities. Determination of this can be carried out by assessing the peak identity and purity.
� Quantitation:
� Limit of detection (LOD) and
� Limit of quantitation (LOQ) study
Explanation for the LOD and LOQ
METHOD DEVELOPMENT AND VALIDATION FOR THE SIMULTANE OUS ESTIMATION OF ILAPRAZOLE AND DOMPERIDONE IN CAP SULE DOSAGE FORM BY UPL
Department of Pharmaceutical Analysis
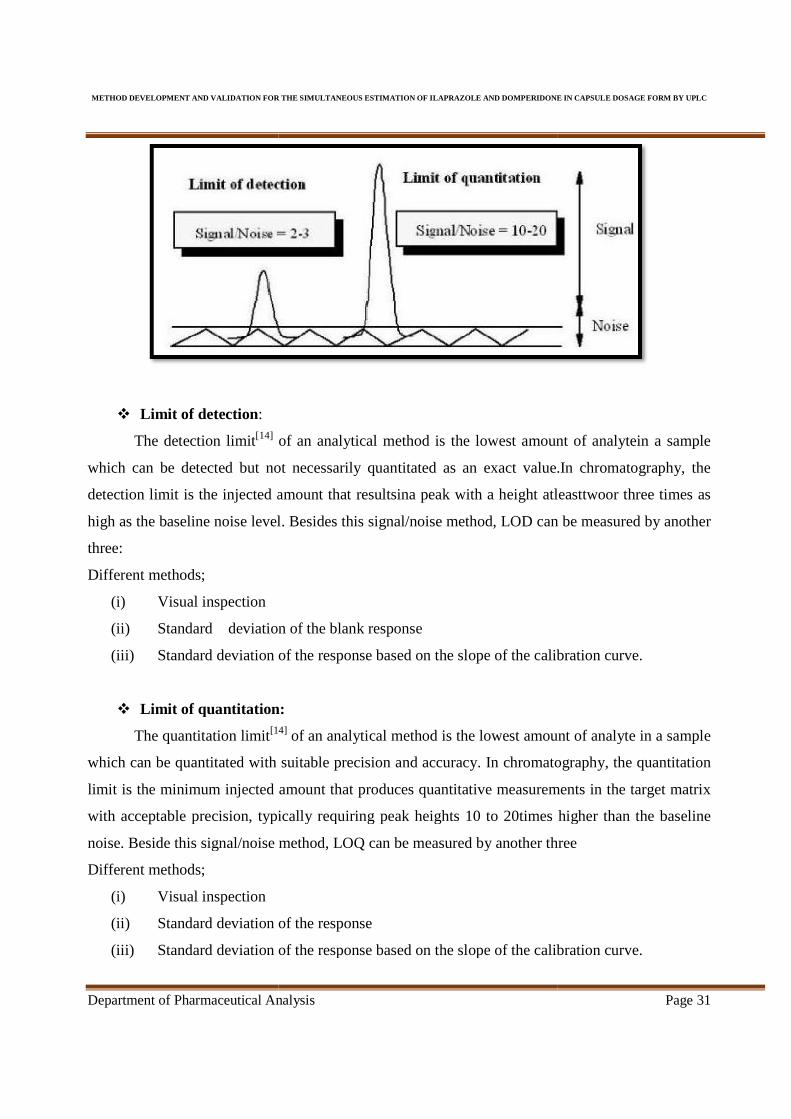
� Limit of detection:
The detection limit[14] of an analytical method is the lowest amount
which can be detected but not nece
detection limit is the injected amount that results
high as the baseline noise level
three:
Different methods;
(i) Visual inspection
(ii) Standard deviation of the blank
(iii) Standard deviation of the response based on the slope of the
� Limit of quantitation:
The quantitation limit[14
which can be quantitated with suitable precision and accuracy.
limit is the minimum injected amount
with acceptable precision, typically requiring peak heights 10 to 20
noise. Beside this signal/noise method, LOQ can be measured by another three
Different methods;
(i) Visual inspection
(ii) Standard deviation of the response
(iii) Standard deviation of the response based on the slope of the calibration curve.
METHOD DEVELOPMENT AND VALIDATION FOR THE SIMULTANE OUS ESTIMATION OF ILAPRAZOLE AND DOMPERIDONE IN CAP SULE DOSAGE FORM BY UPL
nalysis
of an analytical method is the lowest amount
which can be detected but not necessarily quantitated as an exact value.In chromatography, the
detection limit is the injected amount that resultsina peak with a height atleasttwo
evel. Besides this signal/noise method, LOD can be measured by another
deviation of the blank response
deviation of the response based on the slope of the calibration curve.
Limit of quantitation: 4] of an analytical method is the lowest amount of
which can be quantitated with suitable precision and accuracy. In chromatography, the quantitation
is the minimum injected amount that produces quantitative measurements in th
precision, typically requiring peak heights 10 to 20times higher than the baseline
noise. Beside this signal/noise method, LOQ can be measured by another three
deviation of the response
deviation of the response based on the slope of the calibration curve.
METHOD DEVELOPMENT AND VALIDATION FOR THE SIMULTANE OUS ESTIMATION OF ILAPRAZOLE AND DOMPERIDONE IN CAP SULE DOSAGE FORM BY UPLC
Page 31
of an analytical method is the lowest amount of analytein a sample
value.In chromatography, the
height atleasttwoor three times as
can be measured by another
alibration curve.
method is the lowest amount of analyte in a sample
In chromatography, the quantitation
measurements in the target matrix
times higher than the baseline
noise. Beside this signal/noise method, LOQ can be measured by another three
deviation of the response based on the slope of the calibration curve.

METHOD DEVELOPMENT AND VALIDATION FOR THE SIMULTANE OUS ESTIMATION OF ILAPRAZOLE AND DOMPERIDONE IN CAP SULE DOSAGE FORM BY UPLC
Department of Pharmaceutical Analysis Page 32
� Linearity:
The linearity[14] of an analytical procedure is its ability (within a given range) to obtain test
results which are directly proportional to the concentration (amount) of analyte in the sample. This
is the method's ability (within a given range) to obtain results which are either directly, or after
mathematical transformation proportional to the concentration of the analyte within a given range.
Linearity is determined by calculating the regression line using a mathematical treatment of
the results (i.e. least mean squares) vs. analyte concentration. Calibration curve was constructed by
plotting peak area versus concentrations of analyte.
� Range:
The range[14] of an analytical procedure is the interval between the upper and lower
concentration (Amounts) of analyte in the sample (including these concentrations) for which it has
been demonstrated that the analytical procedure has a suitable level of precision, accuracy and
linearity. The range is normally expressed in the same units as the test results. For assay tests, ICH
requires the minimum specified range to be 80 to 120 percent of the test concentration.
� Robustness:
The robustness[14] of an analytical procedure is a measure of its capacity to remain
unaffected by small but deliberate variations in method parameters and provides an indication of its
reliability during normal usage. Thus Ruggedness is the degree of reproducibility of results
obtained by the analysis of the same sample under a variety of normal test conditions i.e. different
analysts, laboratories, instruments, reagents, assay temperatures, small variations in mobile phase,
different days etc. (i.e. from laboratory to laboratory, from analyst to analyst.)
METHOD DEVELOPMENT AND VALIDATION FOR THE SIMULTANE OUS ESTIMATION OF ILAPRAZOLE AND DOMPERIDONE IN CAP SULE DOSAGE FORM BY UPLC
Department of Pharmaceutical Analysis Page 33
DRUG PROFILE
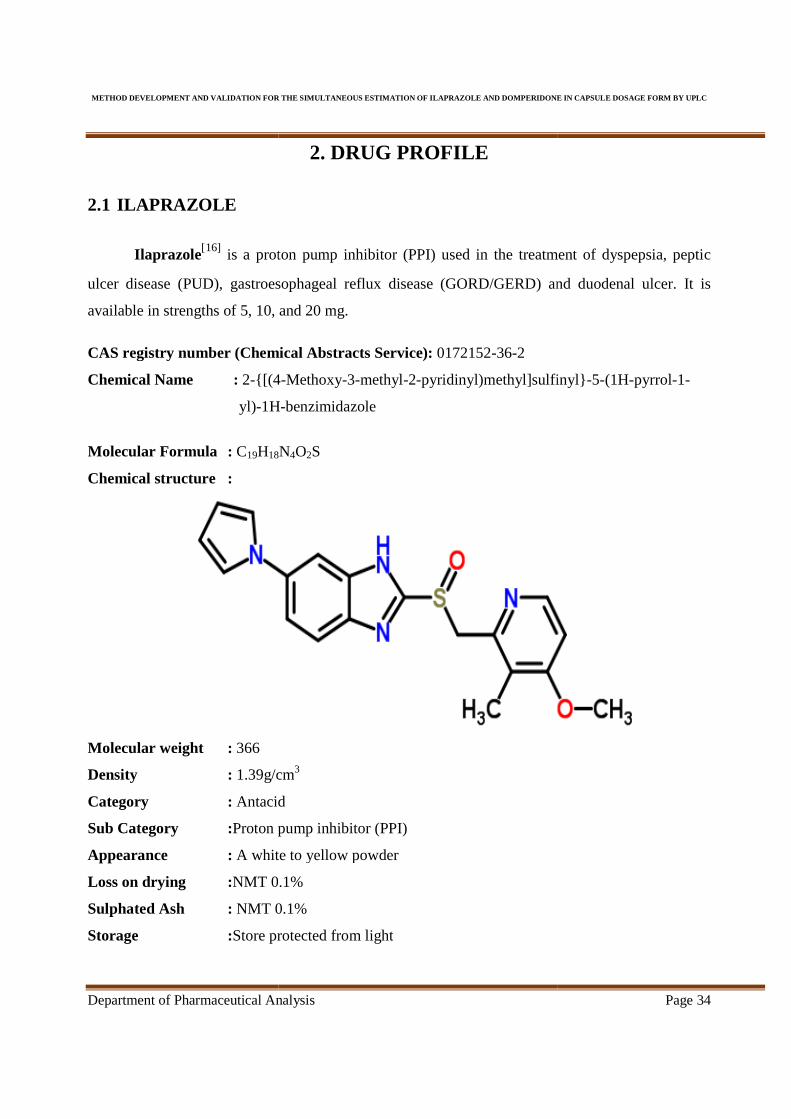
METHOD DEVELOPMENT AND VALIDATION FOR THE SIMULTANE OUS ESTIMATION OF ILAPRAZOLE AND DOMPERIDONE IN CAP SULE DOSAGE FORM BY UPL
Department of Pharmaceutical Analysis
2.1 ILAPRAZOLE
Ilaprazole[16] is a proton pump inhibitor
ulcer disease (PUD), gastroesophag
available in strengths of 5, 10, and 20
CAS registry number (Chemical Abstracts Service):
Chemical Name : 2-{[(4
yl)-1H
Molecular Formula : C19H18
Chemical structure :
Molecular weight : 366
Density : 1.39g/cm
Category : Antacid
Sub Category :Proton pump inhibitor (PPI)
Appearance : A white to yellow powder
Loss on drying :NMT 0.1%
Sulphated Ash : NMT 0.1%
Storage :Store protected from light
METHOD DEVELOPMENT AND VALIDATION FOR THE SIMULTANE OUS ESTIMATION OF ILAPRAZOLE AND DOMPERIDONE IN CAP SULE DOSAGE FORM BY UPL
nalysis
2. DRUG PROFILE
proton pump inhibitor (PPI) used in the treatment of
gastroesophageal reflux disease (GORD/GERD) and
available in strengths of 5, 10, and 20 mg.
CAS registry number (Chemical Abstracts Service): 0172152-36-2
{[(4 -Methoxy-3-methyl-2-pyridinyl)methyl]sulfinyl}
1H-benzimidazole
18N4O2S
1.39g/cm3
cid
Proton pump inhibitor (PPI)
A white to yellow powder
NMT 0.1%
NMT 0.1%
Store protected from light
METHOD DEVELOPMENT AND VALIDATION FOR THE SIMULTANE OUS ESTIMATION OF ILAPRAZOLE AND DOMPERIDONE IN CAP SULE DOSAGE FORM BY UPLC
Page 34
(PPI) used in the treatment of dyspepsia, peptic
(GORD/GERD) and duodenal ulcer. It is
pyridinyl)methyl]sulfinyl}-5-(1H-pyrrol-1-

METHOD DEVELOPMENT AND VALIDATION FOR THE SIMULTANE OUS ESTIMATION OF ILAPRAZOLE AND DOMPERIDONE IN CAP SULE DOSAGE FORM BY UPLC
Department of Pharmaceutical Analysis Page 35
Foreign Names :
• Ilaprazolum (Latin)
• Ilaprazol (German)
• Ilaprazole (French)
• Ilaprazol (Spanish)
Brand Names :
• Noltec
Ilyang, South Korea
• Yi Li An
Livzon Pharma Group, China
Mechanism of Action: Suppresses gastric basal and suppresses acid secretion by inhibiting the
parietal cell H+/K+ ATP pump.
Adverse reactions :
The most common side effects are:
• Nausea and Vomiting
• Dizziness
• Diarrhea
• Constipation
• Abdominal Pain
• Wind and Bloating
• Skin Rashes
• Headaches
Longer Term Side Effects Include:
• Increase Hip Fracture Risk If Over 50 years Old And On Long Term Treatment
• More Susceptible To Iron Deficiency Anemia
• Increased Risk Of Pneumonia In older People
• Vitamin B12 Deficiency

METHOD DEVELOPMENT AND VALIDATION FOR THE SIMULTANE OUS ESTIMATION OF ILAPRAZOLE AND DOMPERIDONE IN CAP SULE DOSAGE FORM BY UPLC
Department of Pharmaceutical Analysis Page 36
2.2 DOMPERIDONE
Domperidone[17] belongs to the class of organic compounds known as benzimidazoles. These
are organic compounds containing a benzene ring fused to an imidazole ring (five member ring
containing a nitrogen atom, 4 carbon atoms, and two double bonds).
This drug is developed by Janssen Pharmaceutical that acts as a peripherally selective antagonist
of the dopamineD2 and D3 receptors. It is administered orally, rectally, or intravenously.
Domperidone is used to relieve nausea and vomiting; to increase the transit of food through the
stomach (that is, as a prokinetic agent via increasing gastrointestinal peristalsis); and to promote
lactation (breast milk production) by release of prolactin. It is also used in scientific research to
study the biological function of dopamine, an important neurotransmitter and hormone, in the body.
Domperidone is available in the form of tablets, orally disintegrating tablets (based on Zydis
technology), suspension and suppositories.
CAS registry number (Chemical Abstracts Service): 0057808-66-9
Kingdom : Organic compounds
Super class :Organo heterocyclic compound
Class : Benzimidazoles
Appearance :A white or almost white powder
Storage :Store protected from light
Brand name :
• Motilium
• MotinormCosti
• Nomit
• Brulium
• Molax
• Motaline
• Moperid
• Monlobia
• Motidone
• Motilex
Chemical Name : 5-chloro-1-{1-[3-(2-oxo-2,3-dihydro-benzoimidazol-1-yl)-propyl]-
piperidin-4- yl}-1,3-dihydro-benzoimidazol-2-one
Molecular Formula : C22H24ClN5O2

METHOD DEVELOPMENT AND VALIDATION FOR THE SIMULTANE OUS ESTIMATION OF ILAPRAZOLE AND DOMPERIDONE IN CAP SULE DOSAGE FORM BY UPLC
Department of Pharmaceutical Analysis Page 37
Chemical structure :
Molecular weight : 425
Solubility :
� Soluble in 0.1M HCl
� Slightly soluble in 0.1M NaOH
� Insoluble in Water
Category : Antiemetic agent, Prokinetic agent
Percentage Purity :≥98%
Loss on drying :NMT 0.5%
Half Life : 7 hours
Protein Binding : 91% - 93%
Foreign Names
• Domperidonum (Latin)
• Domperidon (German)
• Domperidone (French)
• Domperidona(Spanish)
Mechanism of Action: Domperidone is a peripheral dopamine D2 and D3 receptor antagonist. It
provides relief from nausea by blocking receptors at the chemoreceptor trigger zone (a location in
the nervous system that mediates nausea) at the floor of the fourth ventricle (a location near the
brain). It increases motility in the upper gastrointestinal tract to a moderate degree and increases
lower oesophageal sphincter pressure by blocking dopamine receptors in the gastric antrum and the
METHOD DEVELOPMENT AND VALIDATION FOR THE SIMULTANE OUS ESTIMATION OF ILAPRAZOLE AND DOMPERIDONE IN CAP SULE DOSAGE FORM BY UPLC
Department of Pharmaceutical Analysis Page 38
duodenum. It blocks dopamine receptors in the anterior pituitary gland increasing release of
prolactin which in turn increases lactation. Domperidone may be more useful in some patients and
cause harm in others by way of the genetics of the person, such as polymorphisms in the drug
transporter geneABCB1 (which encodes P-glycoprotein), the voltage-gated potassium
channelKCNH2 gene (hERG/Kv11.1), and the α1D—adrenoceptorADRA1D gene.
Adverse reactions :
� Penetration of immature blood brain barrier.
� Cardiac side effects
� Hyperprolactinemia
� Mastodynia (breast pain/tenderness)
� Galactorrhea (inappropriate or excessive milk production/secretion
Uses:
• Antiemetic
• Domperidone is useful in diabetic and idiopathic gastroparesis.
• Domperidone can be used to relieve gastrointestinal symptoms in Parkinson's disease.
• Functional dyspepsia: Domperidone may be used infunctional dyspepsia in both adults and
children.
• Pediatric reflux: Domperidone has been found effective in the treatment of pediatricreflux.
However some specialists consider it to be an excessively powerful drug for treating babies
with reflux.

METHOD DEVELOPMENT AND VALIDATION FOR THE SIMULTANE OUS ESTIMATION OF ILAPRAZOLE AND DOMPERIDONE IN CAP SULE DOSAGE FORM BY UPLC
Department of Pharmaceutical Analysis Page 39
LITERATURE REVIEW

METHOD DEVELOPMENT AND VALIDATION FOR THE SIMULTANE OUS ESTIMATION OF ILAPRAZOLE AND DOMPERIDONE IN CAP SULE DOSAGE FORM BY UPLC
Department of Pharmaceutical Analysis Page 40
3. LITERATURE REVIEW
P. Venkateswarlu et al., have reported “Determination of Ilaprazole and Domperidone in
Individual Dosage form Tablets by RP-HPLC”. A simple, sensitive and precise high performance
liquid chromatographic method for the analysis of Ilaprazole and Domperidone was developed,
validated and used for the determination of compounds in commercial pharmaceutical products.
The compounds were well separated an isocratically on a C18 column inertisil C18, 5 μm, [250 mm
× 4.6 mm] utilizing a mobile phase consisting of acetonitrile: phosphate buffer (60:40, v/v, pH 7.0)
at a flow rate of 1.0 ml/min with UV detection at 243 nm. The retention time of Ilaprazole and
Domperidone was found to be 2.543 min and 7.245 min respectively. The method was found
selective and peaks of Ilaprazole and Domperidone were well separated. The proposed method is
linear (r2 = 0.999 for Ilaprazole and Domperidone), accurate with 99.5 % recovery for Ilaprazole
and 99.4 % recovery for Domperidone and precise (% RSD < 1 %). The method was used to
determine potency of commercial product and potency was found within limit.[18]
SnehaJansari K et al.,have reported “Development and validation of stability indicating method
for simultaneous estimation of Ciprofloxacin hydrochloride and Tinidazole using RP-UPLC
method”. The sample was analyzed by reverse phase C18 column (Purospher Star 100×2.1 mm,
2μm) as stationary phase and Phosphate Buffer: Acetonitrile (80:20) as a mobile phase and pH 3.0
was adjusted by Orthophosporic acid at a flow rate of 0.3 ml/min. Quantification was achieved of
Ciprofloxacin HCl at 278.5 nm and of Tinidazole at 317.5 nm with PDA detector. The retention
time for Ciprofloxacin HCl and Tinidazole was found to be 1.71 and 2.22 minute respectively. The
linearity for Ciprofloxacin HCl and Tinidazole was obtained in the concentration range of 3.125-
43.75 μg/ml and 3.75-52.5 μg/ml with mean accuracies of 99.77% and 99.75% respectively.[19]
C Rambabu et al.,have reported“Development and Validation of RP-UPLC Method for
Simultaneous Estimation of Abacavir Sulphate and Lamivudine in Combined Tablet Dosage
Form” . Chromatographic separations were carried using Acquity BEH C8 (100 mm x 2.1 mm) 1.7
μm column) with a mobile phase composition of TTriethylamine phosphate buffer (pH 2.5) and
methanol in the ratio 50:50% (V/V) have been delivered at a flow rate of 0.5 ml min‐1 and the
detection was carried out using UV detector at wavelength 230 nm. The retention time for
METHOD DEVELOPMENT AND VALIDATION FOR THE SIMULTANE OUS ESTIMATION OF ILAPRAZOLE AND DOMPERIDONE IN CAP SULE DOSAGE FORM BY UPLC
Department of Pharmaceutical Analysis Page 41
Abacavirsulphate and Lamivudine were 0.83 and 1.62 minute respectively. The correlation
coefficient values in linearity were found to be 0.9999 for both at concentration range 2.509‐50.190
μg mL‐1 and 20.093 ‐ 401.860 μg mL‐1 respectively. The recovery results were found in the range
from 99.47‐ 101.08%.[20]
T. Sivakkumar et al., have reported “Development and validation of a rapid-chemo metrics
assisted RP-HPLC method with PDA detection for the simultaneous estimation of Domperidone
and Ilaprazole in pure and pharmaceutical formulation”. A simple, rapid, accurate and precise
chemo metrics assisted RP-HPLC method was developed, optimized and validated for the
simultaneous estimation of the Domperidone and Ilaprazole in pure and pharmaceutical
formulation. The developed method was optimized by using Central composite design (CCD) in
resoponse surface methodology (RSM). Separation of Domperidone and Ilaprazole was achieved on
phenomenex C18 column (150 X4.6 mm i.d, 5μ particle size) with mobile phase containing 64.89%
of acetonitrile and 35.11 % of ammonium acetate buffer (14.18mM) was delivered at a flow rate of
1.2 ml/min. Detection was carried out at 286nm by photodiode array detection. Retention time was
found to be 1.661 for Domperidone and 2.420 for Ilaprazole. The developed and optimized method
was validated successfully as ICH guidelines. Linearity of Domperidone and Ilaprazole were found
to be 30-90μg/ml and 10-30 μg/ml with their correlation coefficient (R2) of 0.9997 and 0.9995
respectively.LOD and LOQ were found to be 158.12ng/ml and 479.16ng/ml for Domperidone and
101.68 ng/ml and 308.12ng/ml for Ilaprazole. The % RSD value of accuracy and precision study
was found to be less than 2 %. Hence this proposed method is useful for the simultaneous
estimation of Domperidone and Ilaprazole in pure and pharmaceutical dosage form.[21]
Z. N. Patel et al., have reported “RP-HPLC Method for Simultaneous Estimation of Levosulpiride
and Pantoprazole Sodium in Tablet Dosage Form”. A simple, economic, selective, precise, and
stability-indicating RP-HPLC method for analysis of Levosulpiride and Pantoprazole sodium was
developed and validated according to ICH guidelines. The quantification of the drug was carried
out using Hypercil BDS C18250mm×4.6mm× 5μm or its equivalent in isocratic mode, with mobile
phase comprising of Water: Acetonitrile: Triethylamine (60: 40: 0.25 v/v/v) the flow rate was
1ml/min and the detection was carried at 225 nm. The retention time for Levosulpiride and
Pantoprazole sodium was found to be 3.597 and 5.147min respectively. The percentage assay for
METHOD DEVELOPMENT AND VALIDATION FOR THE SIMULTANE OUS ESTIMATION OF ILAPRAZOLE AND DOMPERIDONE IN CAP SULE DOSAGE FORM BY UPLC
Department of Pharmaceutical Analysis Page 42
Levosulpiride and Pantoprazole sodium was found to be 99.56% and 98.44% respectively. The
method was also applied for the determination of Levosulpiride and Pantoprazole sodium in the
presence of their degradation products formed under variety of stress conditions. Proposed method
was validated for precision, accuracy, linearity range, specificity and robustness.[22]
Umadurai M et al., have reported “Development and validation of a rapid UPLC Assay method
for the simultaneous estimation of Paroxetine and Clonazepam in tablet dosage form”.
Chromatographic separation was performed on Thermofischer scientific Hypercel C18 column (50x
2.1mm,1.8μm) column with mobile phase comprising of mixture of Acetonitrile: Methanol:
Potassium di hydrogen orthophosphate buffer (8:52:40 )buffer (pH 3, adjusted with Ortho
phosphoric acid) at the flow rate 0.5 ml/min. The detection was carried out at 265 nm. The retention
times of Paroxetine and Clonazepam were found to be 1.28 and 2.45 mins respectively with a run
time of 4 mins, theoretical levels for Paroxetine and Clonazepam were 4144and 5067 respectively,
with a resolution of 8.09.[23]
Sevak Manan R et al., have reported “Development& validation of RP-UPLC method for
simultaneous estimation of Ofloxacin and Ornidazole in their combine dosage form including stress
study”. The sample was analyzed by RP-UPLC instrument using reverse phase C18 column
(Purospher Star 100×2.1 mm, Merck Specialities) as stationary phase and Phosphate Buffer:
Acetonitrile (70:30 v/v) as a mobile phase [where PH of the buffer was adjusted to 2.5 by using Tri
ethyl amine (1ml / lit buffer) and Orthophosphoric acid at a flow rate of 0. 4 ml/min. TUV detector
was used for the detection at 294 nm. The retention time for Ofloxacin and Ornidazole was found to
be 0.648 and 1.158 minute respectively. The linearity for both the drugs was obtained in the
concentration range of 2-14 μg/ml and 5-35 μg/ml.[24]
ParamasivamBalan et al., have reported “Development and validation of stability-indicating RP-
UPLC method for simultaneous estimation of Thiocolchicoside and Aceclofenac in combined
dosage form”. The chromatographic separation was carried out by Thermo Scientific UPLC
Instrument, Accela 1250 Pump, auto sampler with PDA detector, using column Thermo
ScientificHypersil gold C18, (50 x 2.1mm) particle size 1.9μm using 5% ammonium acetate buffer
and methanol in the ratio of 40:60, pH was adjusted to 5 with Orthophosphoric acid as mobile phase
METHOD DEVELOPMENT AND VALIDATION FOR THE SIMULTANE OUS ESTIMATION OF ILAPRAZOLE AND DOMPERIDONE IN CAP SULE DOSAGE FORM BY UPLC
Department of Pharmaceutical Analysis Page 43
at a flow rate of 250 μl/min with the detection at 276nm. The run times of the TCC and ACF were
about 0.697 and 1.125 minutes, respectively. The detector response is linear from 4.8 μg/mlto 7.2
μg/ml and 63.8 μg/ml to 96 μg/ml concentrations for TCC and ACF respectively. The detection
limit and quantification limit was 0.076μg and 0.23μg for TCC and 0.27μg and 0.71μg for ACF.
The percentage of assay of TCC and ACF were about 99.50% and 99.96% respectively.[25]
R.A Tamboliet al., have reported “Development and Validation of RP-HPLC Method for
Simultaneous Estimation of Ilaprazole and Domperidone in Pharmaceutical Dosage Form”. A
specific, accurate, precise and reproducible RP-HPLC method was developed and
subsequently validated for the simultaneous determination of Ilaprazole and Domperidone in
pharmaceutical dosage form. The proposed HPLC method utilizes Hypersil (Thermo scientific) C18
column (250 mm × 4.6 mm id, 5 μm particle size), and mobile phase consisting of
methanol:phosphate buffer (40:60) and pH adjusted to 4.0 with 0.1M glacial acetic acid at a flow
rate of 1.0 ml/min. Quantitation was achieved with UV detection at 230 nm based on peak area with
linear calibration curves at concentration ranges 5-15 μg/ml for Ilaprazole and 15-45 μg/ml for
Domperidone. The retention time of Ilaprazole and Domperidone were found to be 3.433 min and
5.860 min respectively. The method was validated in terms of accuracy, precision, linearity,
limits of detection, limits of quantitation and robustness. This method has been successively applied
to marketed formulation and no interference from the formulation excipients was found.[26]
Pradeep G. Shelke et al.,have reported “Validated Stability-indicating assay method for
determination of Ilaprazole in bulk drug and tablets by high performance liquid chromatography”.
A validated stability-indicating HPLC method was reported for the determination of Ilaprazole in
bulk drug and tablet. The drug was subjected to the various stress conditions as per the ICH
guidelines. The degradation behavior of Ilaprazole was studied under hydrolytic, oxidative,
photolytic and thermal conditions and was found to be unstable in almost all conditions except
under alkaline and photolytic conditions. The separation of drug and its degraded products was
carried out on Kinetex C- 18 100A (5μ, 250×4.6 mm) column. The initial mobile phase
composition used was Acetonitrile and water in the ratio 50:70v/v for 1 min then changed to
70:30v/v in next 6 min and finally equilibrated back to initial composition in 14min. The method
was applied for the determination of Ilaprazole in marketed tablet formulation. The detection was
carried at 305 nm using PDA detector with a flow rate of 1.0ml/min and injection volume 20μl. The
METHOD DEVELOPMENT AND VALIDATION FOR THE SIMULTANE OUS ESTIMATION OF ILAPRAZOLE AND DOMPERIDONE IN CAP SULE DOSAGE FORM BY UPLC
Department of Pharmaceutical Analysis Page 44
validation of developed method was performed for linearity, accuracy, precision, selectivity and
specificity and robustness.[27]
Darshil B. Shah et al., have reported in a review article “Analytical method for determination of
proton pump inhibitors in bulk and indifferent dosage forms”. Proton pump inhibitor is very
effectively used in gastric disorder for reducing acid secretion. They very potent in nature and used
only after therapy with histamine-2 (H2) receptor antagonists, known as H2 blockers, have been
unsuccessful for symptoms of reflux. PPIs are inactivated by exposure to gastric acid, due to rapid
degradation of these drugs in acidic and aqueous media, it is challenging to develop analytical
method where in stability of drug is least hampered. This review entitles different methods
developed for determination of PPIs like UV-Spectroscopy, liquid Chromatography and LC-MS.[28]
Kamala Govinda Rao et al., have reported “Method Development and Validation for Simultaneous
Estimation of Omeprazole and Domperidone by RP-HPLC”. The developed RP-HPLC method
allows rapid and precise determinations of Omeprazole and Domperidone, the scope of the present
work was to expand and optimization of the chromatographic conditions, to develop RP-HPLC
method. A series of mobile phases were tried, among the various mobile phases as methanol and
0.1% ammonium acetate an ideal mobile phase, since it gave a good resolution and peak shapes
with perfect optimization. The flow rate was optimized at 1 ml/min. The linearity and correlation
coefficient of Omeprazole and Domperidone were found to be 10–50 ug/ml, and 10.10–50.50 ug/ml
0.9996, and 0.998 respectively. The limit of detection for Omeprazole and Domperidone was found
to be 1.76 and 2.0 and the limit of quantification was found to be 1.87 and 1.48. The method was
known to be accurate with the assay method. The % assay was found to be 97 and 98.12. The
developed method was showed to a good accuracy and precision. The % RSD is for Omeprazole
and Domperidone is 041 and 1.41. The Isocratic elution technique developed for the determination
of Omeprazole and Domperidone ideally suited for rapid and routine analysis. This method shows
that good reproducibility of the results. Furthermore this method was simple, sensitive, and
accurate. Degradation studies were done, here the drug stability results were in the range of
acceptance criteria 85–115%.[29]

METHOD DEVELOPMENT AND VALIDATION FOR THE SIMULTANE OUS ESTIMATION OF ILAPRAZOLE AND DOMPERIDONE IN CAP SULE DOSAGE FORM BY UPLC
Department of Pharmaceutical Analysis Page 45
AIM AND PLAN OF
WORK

METHOD DEVELOPMENT AND VALIDATION FOR THE SIMULTANE OUS ESTIMATION OF ILAPRAZOLE AND DOMPERIDONE IN CAP SULE DOSAGE FORM BY UPLC
Department of Pharmaceutical Analysis Page 46
4. AIM AND PLAN OF WORK
4.1 AIM
To develop and validate a new method for the simultaneous determination of Ilaprazole and
Domperidone in capsule dosage form by Ultra Performance Liquid Chromatography [UPLC].
4.2 OBJECTIVE
The literature review revealed that there are several methods reported for the estimation
Ilaprazole and Domperidone alone or in combination with other drugs in their pharmaceutical
dosage forms but none of the method available for the estimation of these drugs in the selected
pharmaceutical dosage form by this intended method (UPLC).
It is common to administer two or more drugs in a single formulation and it may be to
reduce the number of medicaments to be taken at a time for better patient compliance. It is a
challenging task for the analyst to develop a simple analytical method for simultaneous estimation
of multiple drug formulations with desired degree of accuracy and precision. In the present work
attempts have been made to develop Rapid UPLC method of analysis for a simultaneous estimation
of selected two drugs in capsule dosage form.
Hence on the basis of the literature survey, it was thought to develop a precise, accurate,
simple, rapid and reliable method for estimation of Ilaprazole and Domperidone in capsules dosage
form using the following technique of UPLC.
METHOD DEVELOPMENT AND VALIDATION FOR THE SIMULTANE OUS ESTIMATION OF ILAPRAZOLE AND DOMPERIDONE IN CAP SULE DOSAGE FORM BY UPLC
Department of Pharmaceutical Analysis Page 47
4.3 PLAN OF WORK
Plan of work was designed as follows:
I. Literature collection.
II. Study of physicochemical properties of drug (pH, pKa and solubility).
III. Procurement of chemicals and API.
IV. Method development and optimization of chromatographic conditions
� Selection of diluent
� Selection of wavelength
� Choice of chromatographic method
� Selection of initial separation
� Optimize the chromatographic variables.
V. Development of UPLC method for the quantification of Ilaprazole and Domperidonein
capsules dosage form.
VI. Validation of proposed method as per ICH Q2 (R1) guidelines.

METHOD DEVELOPMENT AND VALIDATION FOR THE SIMULTANE OUS ESTIMATION OF ILAPRAZOLE AND DOMPERIDONE IN CAP SULE DOSAGE FORM BY UPLC
Department of Pharmaceutical Analysis Page 48
MATERIALS AND
EQUIPMENTS
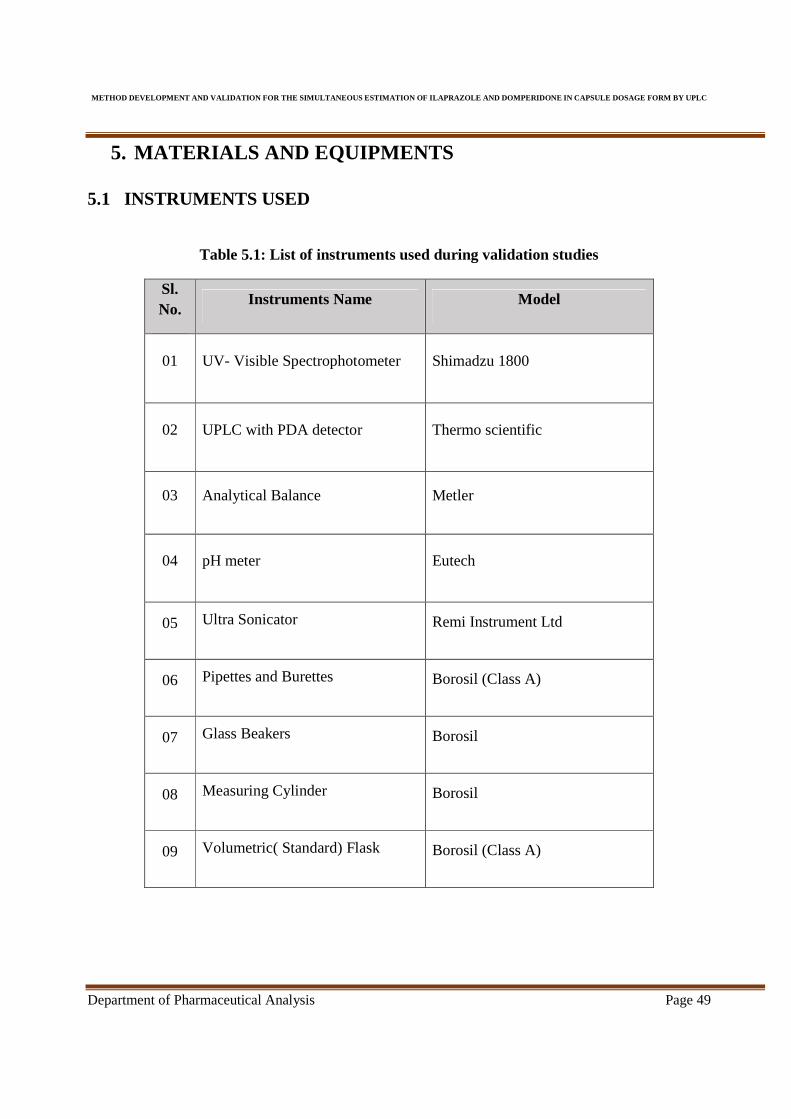
METHOD DEVELOPMENT AND VALIDATION FOR THE SIMULTANE OUS ESTIMATION OF ILAPRAZOLE AND DOMPERIDONE IN CAP SULE DOSAGE FORM BY UPLC
Department of Pharmaceutical Analysis Page 49
5. MATERIALS AND EQUIPMENTS
5.1 INSTRUMENTS USED
Table 5.1: List of instruments used during validation studies
Sl. No.
Instruments Name Model
01 UV- Visible Spectrophotometer Shimadzu 1800
02 UPLC with PDA detector Thermo scientific
03 Analytical Balance Metler
04 pH meter Eutech
05 Ultra Sonicator Remi Instrument Ltd
06 Pipettes and Burettes Borosil (Class A)
07 Glass Beakers Borosil
08 Measuring Cylinder Borosil
09 Volumetric( Standard) Flask Borosil (Class A)

METHOD DEVELOPMENT AND VALIDATION FOR THE SIMULTANE OUS ESTIMATION OF ILAPRAZOLE AND DOMPERIDONE IN CAP SULE DOSAGE FORM BY UPLC
Department of Pharmaceutical Analysis Page 50
5.2 DRUGS AND CHEMICALS USED
Ilaprazole and Domperidone was obtained from Aeon Formulations Pvt. Ltd.(Puducherry,
India) as gift sample and marketed formulation Ilavieon DSR capsules(Ilaprazole 10 mg and
Domperidone30mg) manufactured by Aeon Formulations Pvt. Ltd. was procured form local
market of Chennai.
Table 5.2: List of chemicals used during validation studies
Sl No.
Materials Manufacturer Batch no/
Control No
01 Triethylamine MERCK SF3S630365
02 Ammonium acetate MERCK QE4Q641100
03 Phosphoric acid MERCK PM2P523951
04 Acetic acid MERCK CJ4C640904
05 Methanol HIMEDIA MET/1510032
06 Acetonitrile MERCK DL4DF41617
07 HPLC water MILLI-Q 112871

METHOD DEVELOPMENT AND VALIDATION FOR THE SIMULTANE OUS ESTIMATION OF ILAPRAZOLE AND DOMPERIDONE IN CAP SULE DOSAGE FORM BY UPLC
Department of Pharmaceutical Analysis Page 51
ANALYTICAL METHOD DEVELOPMENT AND
OPTIMIZATION

METHOD DEVELOPMENT AND VALIDATION FOR THE SIMULTANE OUS ESTIMATION OF ILAPRAZOLE AND DOMPERIDONE IN CAP SULE DOSAGE FORM BY UPLC
Department of Pharmaceutical Analysis Page 52
6. ANALYTICAL METHOD DEVELOPMENT
AND OPTIMIZTION
A good method development strategy should require only as many experimental runs as are
necessary to achieve the desired final result. Finally method development should be as simple as
possible, and it should allow the use of sophisticated tools such as computer modelling. The
important factors, which are to be taken into account to obtain reliable quantitative analysis, are
� Careful sampling and sample preparation.
� Precise sample injection.
� Appropriate choice of the column.
� Choice of the operating conditions to obtain the adequate resolution of mixture.
� Reliable performance of the recording and data handling systems.
� Suitable integration/peak height measurement techniques.
� The mode of calculation best suited for the purpose.
� Validation of the developed method.
Stock Solution A(Ilaprazole)
Weighed accurately about 20.03 mg of Ilaprazole and transferred it to a 50 ml standard flask and
sufficient methanol was added to dissolve it. Then the solution was sonicated for 10 minutes and
made the volume up to the mark with methanol. Final concentration was 400.6μg/ml.
Stock Solution B (Domperidone)
Weighed accurately about 61.18mg of Domperidone and transferred it to a 50 ml standard flask and
sufficient methanol was added to dissolve it. Then the solution was sonicated for 10 minutes and
made the volume up to the mark with methanol. Final concentration was 1223.6μg /ml.

METHOD DEVELOPMENT AND VALIDATION FOR THE SIMULTANE OUS ESTIMATION OF ILAPRAZOLE AND DOMPERIDONE IN CAP SULE DOSAGE FORM BY UPL
Department of Pharmaceutical Analysis
Standard Solution Preparation
1 ml of stock solution A and 1
standard flask. This was then diluted with 30 ml of
with same solvent. This was marked and labelled as
of Ilaprazole and 12.236μg/ml of
membrane filter.
Selection Of Wavelength
The sensitivity of the UPLC method that uses PDA detection depends upon the proper
selection of the wavelength. An ideal wavelength is one that gives good response for the drugs to be
detected. In the entire UV visible region both the drugs were strongly a
wavelength was selected for further studies.
Wavelength Selection of Combined Drugs (Domperidone and Ilaprazole)
METHOD DEVELOPMENT AND VALIDATION FOR THE SIMULTANE OUS ESTIMATION OF ILAPRAZOLE AND DOMPERIDONE IN CAP SULE DOSAGE FORM BY UPL
nalysis
Preparation
1 ml of stock solution A and 1 ml of stock solution B were mixed in a 10
n diluted with 30 ml of methanol. The volume was made up to
with same solvent. This was marked and labelled as standard solution which
/ml of Domperidone. Resulting solution was then filtered with 0.45 µ
Of Wavelength (λmax)
The sensitivity of the UPLC method that uses PDA detection depends upon the proper
selection of the wavelength. An ideal wavelength is one that gives good response for the drugs to be
the entire UV visible region both the drugs were strongly absorbed
wavelength was selected for further studies.
Wavelength Selection of Combined Drugs (Domperidone and Ilaprazole)
METHOD DEVELOPMENT AND VALIDATION FOR THE SIMULTANE OUS ESTIMATION OF ILAPRAZOLE AND DOMPERIDONE IN CAP SULE DOSAGE FORM BY UPLC
Page 53
100 ml dried and cleaned
. The volume was made up to 100 ml
solution which contains 4.006 μg/ml
. Resulting solution was then filtered with 0.45 µ
The sensitivity of the UPLC method that uses PDA detection depends upon the proper
selection of the wavelength. An ideal wavelength is one that gives good response for the drugs to be
bsorbed at 288 nm. So this
Wavelength Selection of Combined Drugs (Domperidone and Ilaprazole)
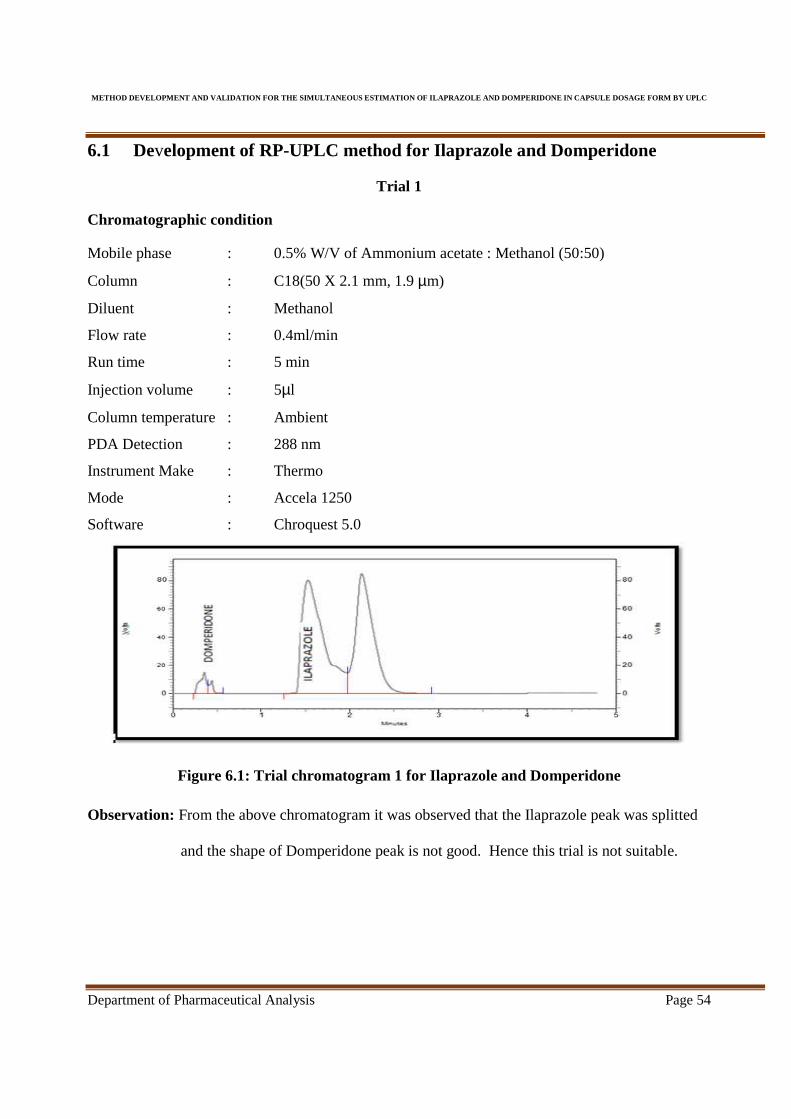
METHOD DEVELOPMENT AND VALIDATION FOR THE SIMULTANE OUS ESTIMATION OF ILAPRAZOLE AND DOMPERIDONE IN CAP SULE DOSAGE FORM BY UPLC
Department of Pharmaceutical Analysis Page 54
6.1 Development of RP-UPLC method for Ilaprazole and Domperidone
Trial 1
Chromatographic condition
Mobile phase : 0.5% W/V of Ammonium acetate : Methanol (50:50)
Column : C18(50 X 2.1 mm, 1.9 µm)
Diluent : Methanol
Flow rate : 0.4ml/min
Run time : 5 min
Injection volume : 5µl
Column temperature : Ambient
PDA Detection : 288 nm
Instrument Make : Thermo
Mode : Accela 1250
Software : Chroquest 5.0
Figure 6.1: Trial chromatogram 1 for Ilaprazole and Domperidone
Observation: From the above chromatogram it was observed that the Ilaprazole peak was splitted
and the shape of Domperidone peak is not good. Hence this trial is not suitable.
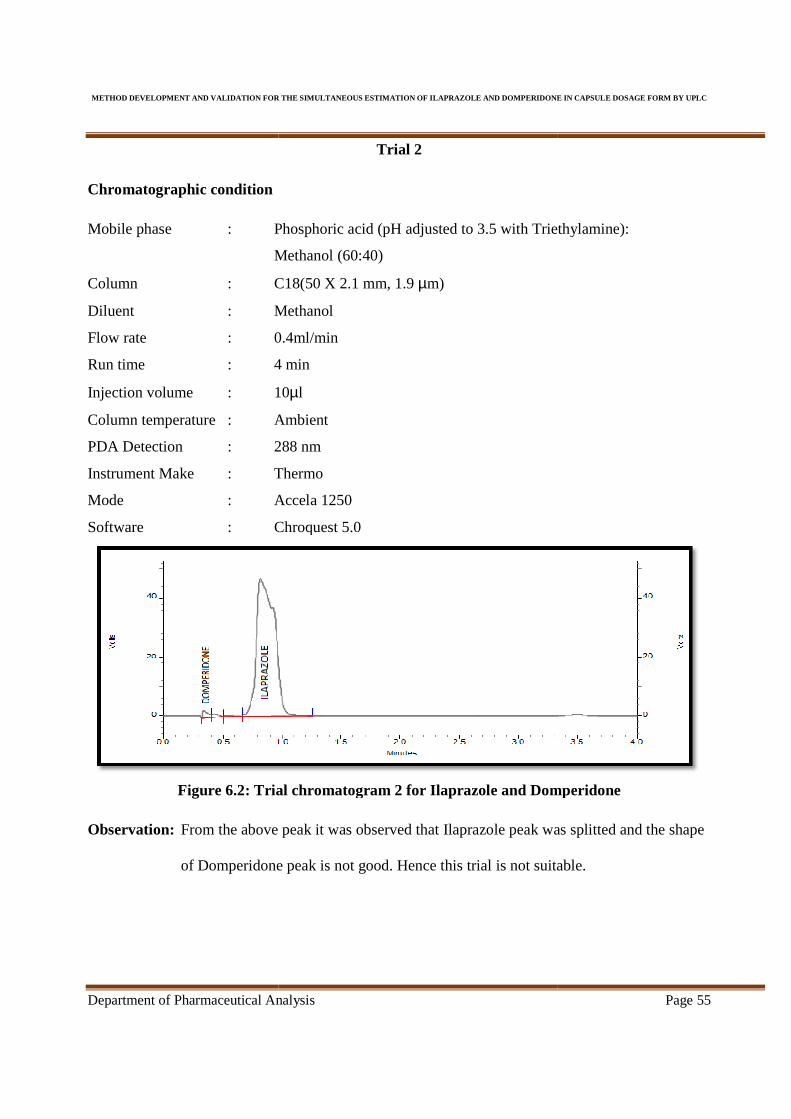
METHOD DEVELOPMENT AND VALIDATION FOR THE SIMULTANE OUS ESTIMATION OF ILAPRAZOLE AND DOMPERIDONE IN CAP SULE DOSAGE FORM BY UPL
Department of Pharmaceutical Analysis
Chromatographic condition
Mobile phase : P
Methanol (60:40)
Column : C18(50 X 2.1 mm, 1.9
Diluent : Methanol
Flow rate : 0.4ml/min
Run time : 4 min
Injection volume : 10
Column temperature : Ambient
PDA Detection : 288 nm
Instrument Make : Thermo
Mode : Accela 1250
Software : Chroquest 5.0
Figure 6.2: Trial chromatogram
Observation: From the above peak it was observed that
of Domperidone
METHOD DEVELOPMENT AND VALIDATION FOR THE SIMULTANE OUS ESTIMATION OF ILAPRAZOLE AND DOMPERIDONE IN CAP SULE DOSAGE FORM BY UPL
nalysis
Trial 2
Phosphoric acid (pH adjusted to 3.5 with Triethylamine
Methanol (60:40)
C18(50 X 2.1 mm, 1.9 µm)
Methanol
0.4ml/min
4 min
10µl
Ambient
288 nm
Thermo
Accela 1250
Chroquest 5.0
Trial chromatogram 2 for Ilaprazole and Domperidone
the above peak it was observed that Ilaprazole peak was splitted and the shape
of Domperidone peak is not good. Hence this trial is not suitable.
METHOD DEVELOPMENT AND VALIDATION FOR THE SIMULTANE OUS ESTIMATION OF ILAPRAZOLE AND DOMPERIDONE IN CAP SULE DOSAGE FORM BY UPLC
Page 55
Triethylamine):
Domperidone
Ilaprazole peak was splitted and the shape
Hence this trial is not suitable.
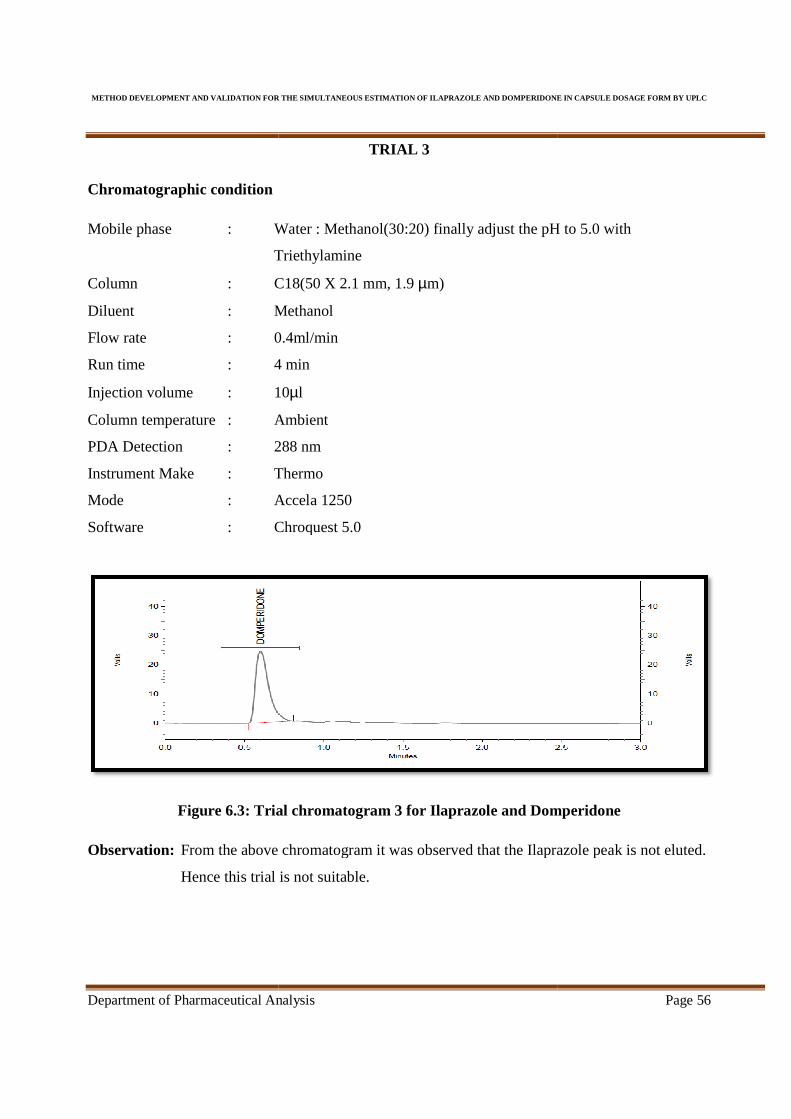
METHOD DEVELOPMENT AND VALIDATION FOR THE SIMULTANE OUS ESTIMATION OF ILAPRAZOLE AND DOMPERIDONE IN CAP SULE DOSAGE FORM BY UPL
Department of Pharmaceutical Analysis
Chromatographic condition
Mobile phase : Water : Methanol(30:20)
Triethylamine
Column : C18(50 X 2.1 mm, 1.9
Diluent : Methanol
Flow rate : 0.4ml/min
Run time : 4 min
Injection volume : 10
Column temperature : Ambient
PDA Detection : 288 nm
Instrument Make : Thermo
Mode : Accela 1250
Software : Chroquest 5.0
Figure 6.3: Trial chromatogram
Observation: From the above chromatogram it was observed that the
Hence this trial is not suitable.
METHOD DEVELOPMENT AND VALIDATION FOR THE SIMULTANE OUS ESTIMATION OF ILAPRAZOLE AND DOMPERIDONE IN CAP SULE DOSAGE FORM BY UPL
nalysis
TRIAL 3
Water : Methanol(30:20) finally adjust the pH to 5.0 with
Triethylamine
C18(50 X 2.1 mm, 1.9 µm)
Methanol
0.4ml/min
4 min
10µl
Ambient
288 nm
Thermo
Accela 1250
Chroquest 5.0
Trial chromatogram 3 for Ilaprazole and Domperidone
From the above chromatogram it was observed that the Ilaprazole peak is not eluted
Hence this trial is not suitable.
METHOD DEVELOPMENT AND VALIDATION FOR THE SIMULTANE OUS ESTIMATION OF ILAPRAZOLE AND DOMPERIDONE IN CAP SULE DOSAGE FORM BY UPLC
Page 56
adjust the pH to 5.0 with
Domperidone
Ilaprazole peak is not eluted.

METHOD DEVELOPMENT AND VALIDATION FOR THE SIMULTANE OUS ESTIMATION OF ILAPRAZOLE AND DOMPERIDONE IN CAP SULE DOSAGE FORM BY UPLC
Department of Pharmaceutical Analysis Page 57
Trial 4
Chromatographic condition
Mobile phase : Water : Methanol : ACN : Acetic Acid (30:20:50:0.3) finally adjust
the pH to 5.0 with Triethylamine
Column : C18(50 X 2.1 mm, 1.9 µm)
Diluent : Methanol
Flow rate : 0.4ml/min
Run time : 3 min
Injection volume : 10µl
Column temperature : Ambient
PDA Detection : 288 nm
Instrument Make : Thermo
Mode : Accela 1250
Software : Chroquest 5.0
Figure 6.4: Trial chromatogram 4 for Ilaprazole and Domperidone
DRUG RETENTION
TIME AREA
AREA
%
THEORETICAL
PLATES (USP)
RESOLUTION
(USP) ASYMMETRY
DPD 0.598 145852 32.27 2249 0.00 1.70
IPZ 2.072 306090 67.73 2589 16.81 1.85
Total 451942 100.00
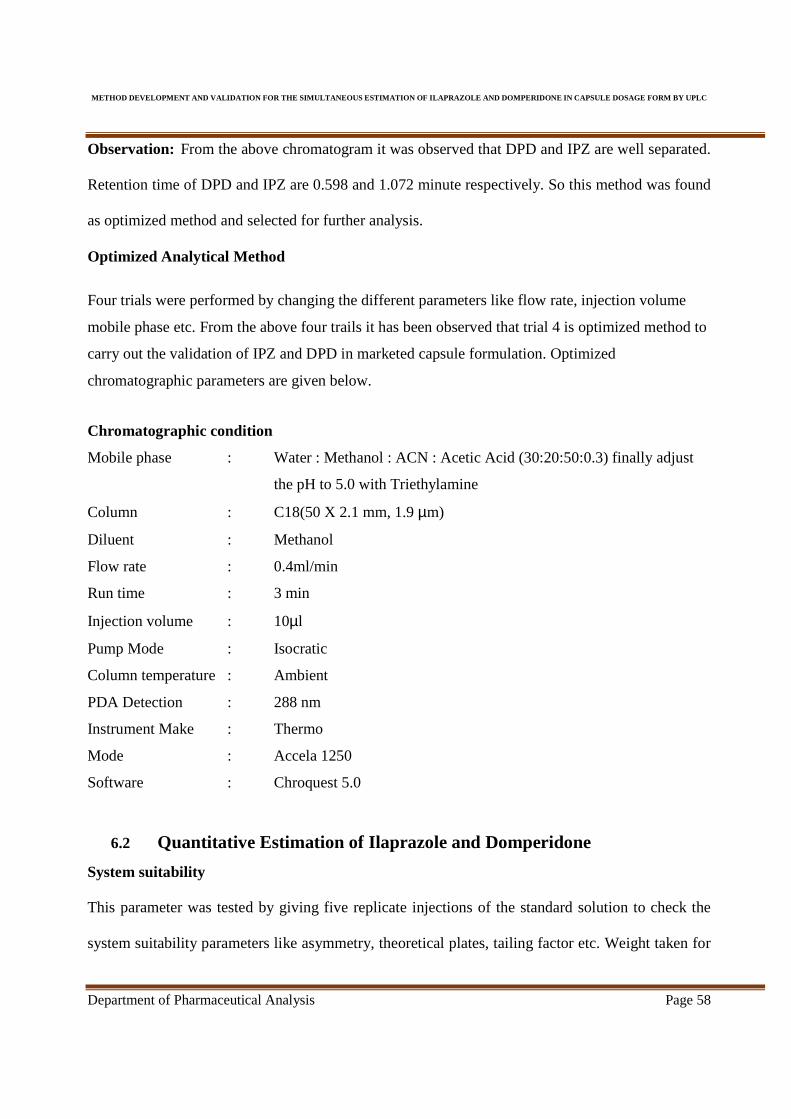
METHOD DEVELOPMENT AND VALIDATION FOR THE SIMULTANE OUS ESTIMATION OF ILAPRAZOLE AND DOMPERIDONE IN CAP SULE DOSAGE FORM BY UPLC
Department of Pharmaceutical Analysis Page 58
Observation: From the above chromatogram it was observed that DPD and IPZ are well separated.
Retention time of DPD and IPZ are 0.598 and 1.072 minute respectively. So this method was found
as optimized method and selected for further analysis.
Optimized Analytical Method
Four trials were performed by changing the different parameters like flow rate, injection volume
mobile phase etc. From the above four trails it has been observed that trial 4 is optimized method to
carry out the validation of IPZ and DPD in marketed capsule formulation. Optimized
chromatographic parameters are given below.
Chromatographic condition
Mobile phase : Water : Methanol : ACN : Acetic Acid (30:20:50:0.3) finally adjust
the pH to 5.0 with Triethylamine
Column : C18(50 X 2.1 mm, 1.9 µm)
Diluent : Methanol
Flow rate : 0.4ml/min
Run time : 3 min
Injection volume : 10µl
Pump Mode : Isocratic
Column temperature : Ambient
PDA Detection : 288 nm
Instrument Make : Thermo
Mode : Accela 1250
Software : Chroquest 5.0
6.2 Quantitative Estimation of Ilaprazole and Domperidone
System suitability
This parameter was tested by giving five replicate injections of the standard solution to check the
system suitability parameters like asymmetry, theoretical plates, tailing factor etc. Weight taken for

METHOD DEVELOPMENT AND VALIDATION FOR THE SIMULTANE OUS ESTIMATION OF ILAPRAZOLE AND DOMPERIDONE IN CAP SULE DOSAGE FORM BY UPLC
Department of Pharmaceutical Analysis Page 59
stock solution A & B were 51.28 mg of IPZ and 12.65 mg of DPD respectively. Suitability
parameters were calculated and given in table6.1& 6.2.
Figure 6.5: Chromatogram of System Suitability of Standard, Replicate Injection 01
Figure 6.6: Chromatogram of System Suitability of Standard, Replicate Injection 02
Figure 6.7: Chromatogram of System Suitability of Standard, Replicate Injection 03
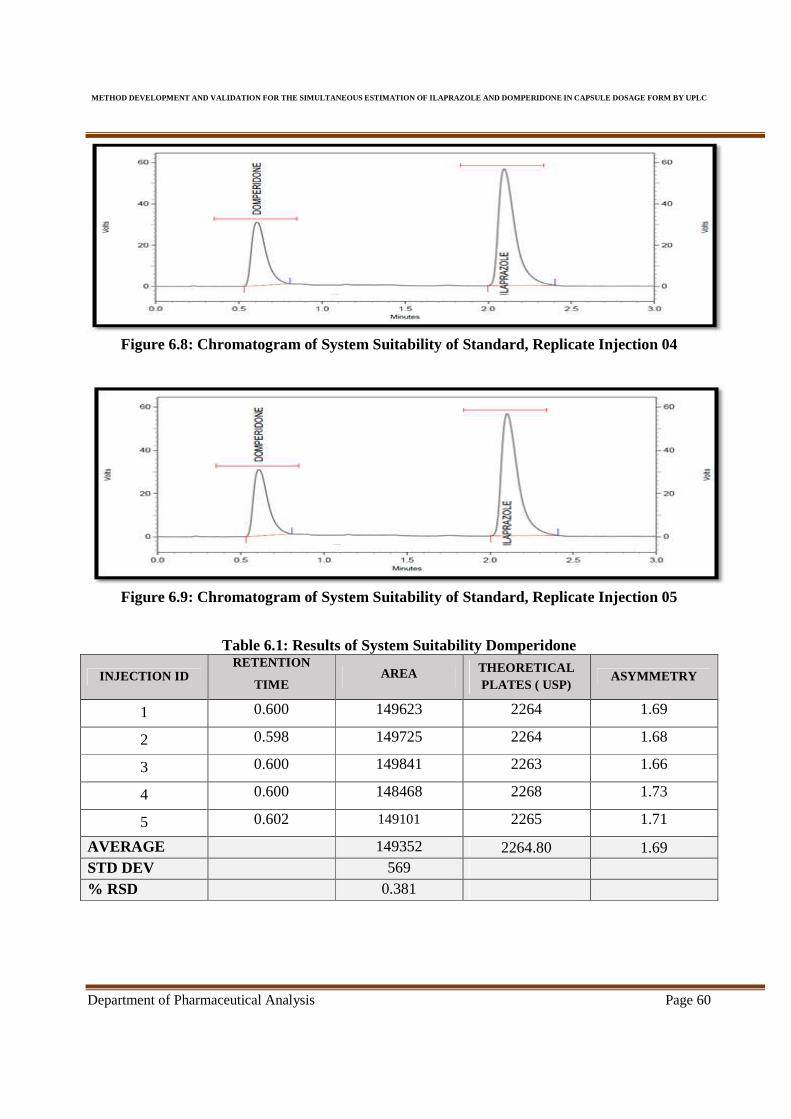
METHOD DEVELOPMENT AND VALIDATION FOR THE SIMULTANE OUS ESTIMATION OF ILAPRAZOLE AND DOMPERIDONE IN CAP SULE DOSAGE FORM BY UPLC
Department of Pharmaceutical Analysis Page 60
Figure 6.8: Chromatogram of System Suitability of Standard, Replicate Injection 04
Figure 6.9: Chromatogram of System Suitability of Standard, Replicate Injection 05
Table 6.1: Results of System Suitability Domperidone
INJECTION ID RETENTION
TIME AREA THEORETICAL
PLATES ( USP) ASYMMETRY
1 0.600 149623 2264 1.69
2 0.598 149725 2264 1.68
3 0.600 149841 2263 1.66
4 0.600 148468 2268 1.73
5 0.602 149101 2265 1.71
AVERAGE 149352 2264.80 1.69 STD DEV 569 % RSD 0.381
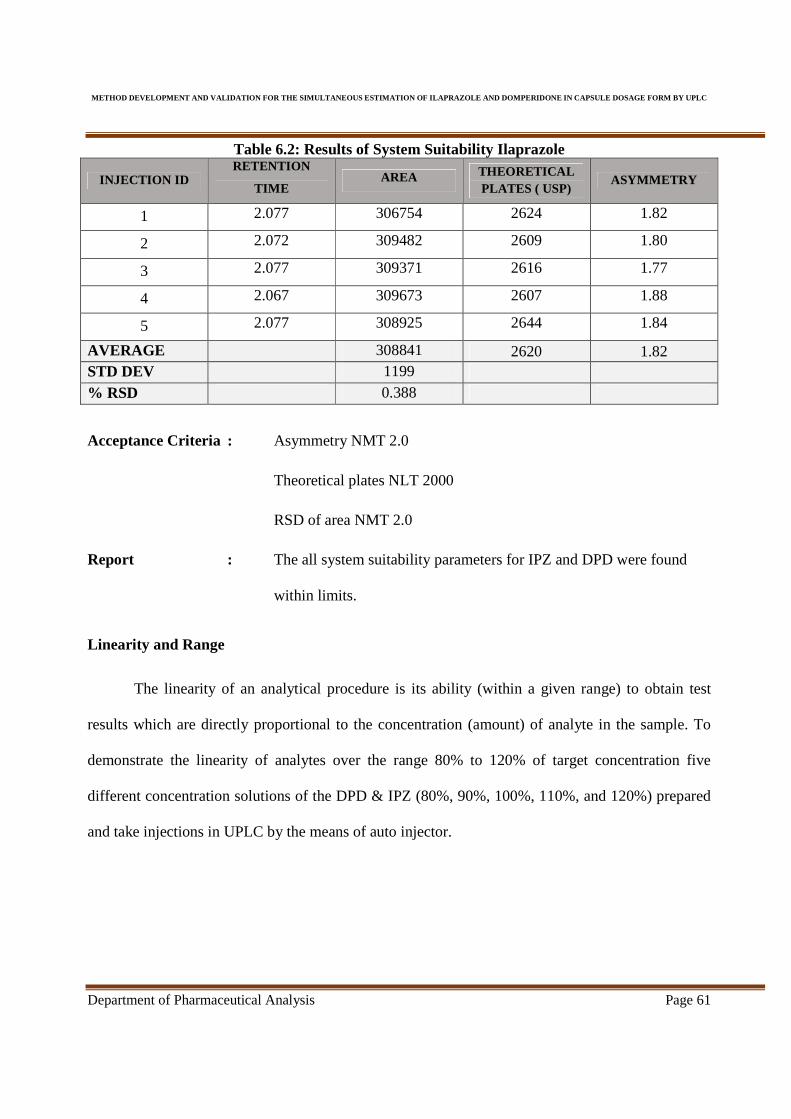
METHOD DEVELOPMENT AND VALIDATION FOR THE SIMULTANE OUS ESTIMATION OF ILAPRAZOLE AND DOMPERIDONE IN CAP SULE DOSAGE FORM BY UPLC
Department of Pharmaceutical Analysis Page 61
Table 6.2: Results of System Suitability Ilaprazole INJECTION ID
RETENTION
TIME AREA THEORETICAL
PLATES ( USP) ASYMMETRY
1 2.077 306754 2624 1.82
2 2.072 309482 2609 1.80
3 2.077 309371 2616 1.77
4 2.067 309673 2607 1.88
5 2.077 308925 2644 1.84
AVERAGE 308841 2620 1.82 STD DEV 1199 % RSD 0.388
Acceptance Criteria : Asymmetry NMT 2.0
Theoretical plates NLT 2000
RSD of area NMT 2.0
Report : The all system suitability parameters for IPZ and DPD were found
within limits.
Linearity and Range
The linearity of an analytical procedure is its ability (within a given range) to obtain test
results which are directly proportional to the concentration (amount) of analyte in the sample. To
demonstrate the linearity of analytes over the range 80% to 120% of target concentration five
different concentration solutions of the DPD & IPZ (80%, 90%, 100%, 110%, and 120%) prepared
and take injections in UPLC by the means of auto injector.

METHOD DEVELOPMENT AND VALIDATION FOR THE SIMULTANE OUS ESTIMATION OF ILAPRAZOLE AND DOMPERIDONE IN CAP SULE DOSAGE FORM BY UPLC
Department of Pharmaceutical Analysis Page 62
Procedure
Stock Solution A (Ilaprazole) Weighed accurately about 20 mg of Ilaprazole and transferred it to a 50 ml standard
flask and sufficient methanol was added to dissolve it. Then the solution was sonicated for
10 minutes and made the volume up to the mark with methanol. Final concentration was
400μg/ml.
Stock Solution B (Domperidone) Weighed accurately about 60 mg of Domperidone and transferred it to a 50 ml
standard flask and sufficient methanol was added to dissolve it. Then the solution was
sonicated for 10 minutes and made the volume up to the mark with methanol. Final
concentration was 1200 μg /ml.
Actual weight taken,
For stock solution A (Ilaprazole) = 20.03 mg
For stock solution B (Domperidone) = 61.18 mg
Preparation of 80% Solution:
Dilute 0.8 ml of stock solution A and 0.8 ml of stock solution B in 100 ml volumetric flask and
make up the volume up to the mark with same diluent.
Preparation of 90% Solution:
Dilute 0.9 ml of stock solution A and 0.9 ml of stock solution B in 100 ml volumetric flask and
make up the volume up to the mark with same diluent.

METHOD DEVELOPMENT AND VALIDATION FOR THE SIMULTANE OUS ESTIMATION OF ILAPRAZOLE AND DOMPERIDONE IN CAP SULE DOSAGE FORM BY UPLC
Department of Pharmaceutical Analysis Page 63
Preparation of 100% Solution: Dilute 1 ml of stock solution A and 1 ml of stock solution B in 100 ml volumetric flask and make
up the volume up to the mark with same diluent.
Preparation of 110% Solution: Dilute 1.1 ml of stock solution A and 1.1 ml of stock solution B in 100 ml volumetric flask and
make up the volume up to the mark with same diluent.
Preparation of 120% Solution: Dilute 1.2 ml of stock solution A and 1.2 ml of stock solution B in 100 ml volumetric flask and
make up the volume up to the mark with same diluent.
Figure 6.10: Chromatogram of linearity solution (80%)
DRUG RETENTION
TIME AREA
AREA
%
THEORETICAL
PLATES (USP)
RESOLUTION
(USP) ASYMMETRY
DPD 0.603 115657 32.29 2282 0.00 1.73
IPZ 2.078 242560 67.71 2695 16.76 1.85
Total 358217 100.00

METHOD DEVELOPMENT AND VALIDATION FOR THE SIMULTANE OUS ESTIMATION OF ILAPRAZOLE AND DOMPERIDONE IN CAP SULE DOSAGE FORM BY UPLC
Department of Pharmaceutical Analysis Page 64
Figure 6.11: Chromatogram of linearity solution (90%)
Figure 6.12: Chromatogram of linearity solution (100%)
Figure 6.13: Chromatogram of linearity solution (110%)
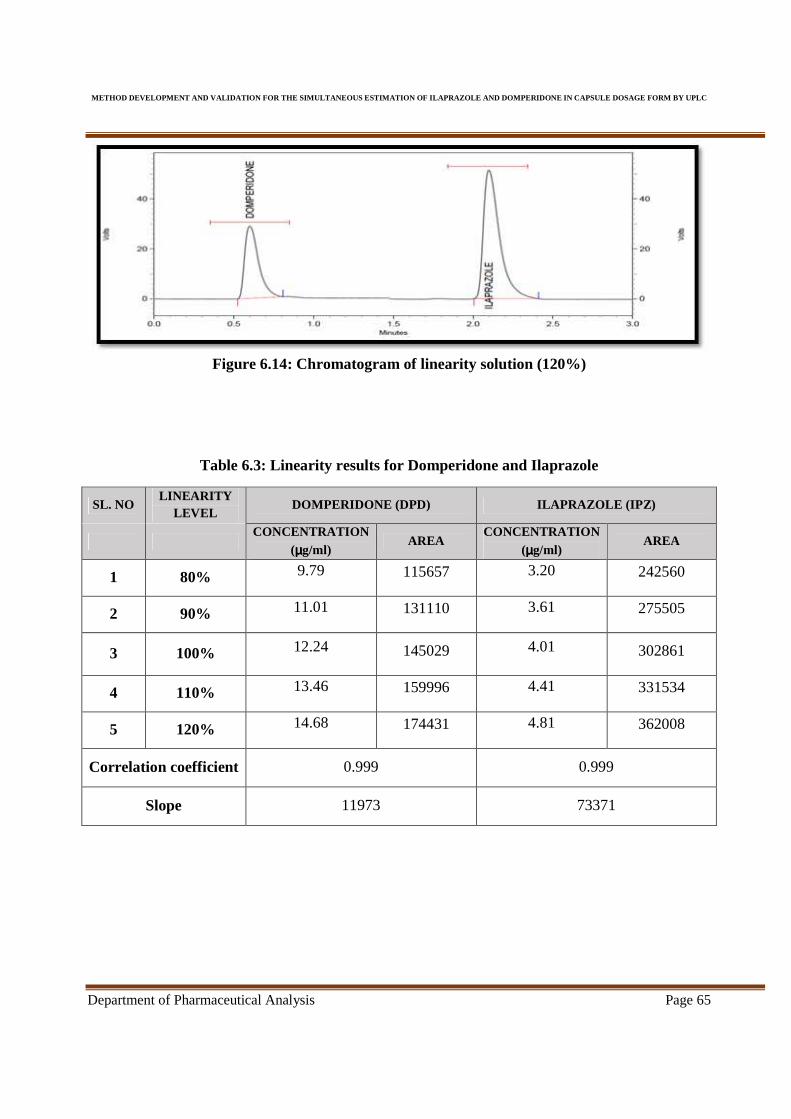
METHOD DEVELOPMENT AND VALIDATION FOR THE SIMULTANE OUS ESTIMATION OF ILAPRAZOLE AND DOMPERIDONE IN CAP SULE DOSAGE FORM BY UPLC
Department of Pharmaceutical Analysis Page 65
Figure 6.14: Chromatogram of linearity solution (120%)
Table 6.3: Linearity results for Domperidone and Ilaprazole
SL. NO LINEARITY
LEVEL DOMPERIDONE (DPD) ILAPRAZOLE (IPZ)
CONCENTRATION
(µµµµg/ml) AREA
CONCENTRATION (µµµµg/ml)
AREA
1 80% 9.79 115657 3.20 242560
2 90% 11.01 131110 3.61 275505
3 100% 12.24 145029 4.01 302861
4 110% 13.46 159996 4.41 331534
5 120% 14.68 174431 4.81 362008
Correlation coefficient 0.999 0.999
Slope 11973 73371
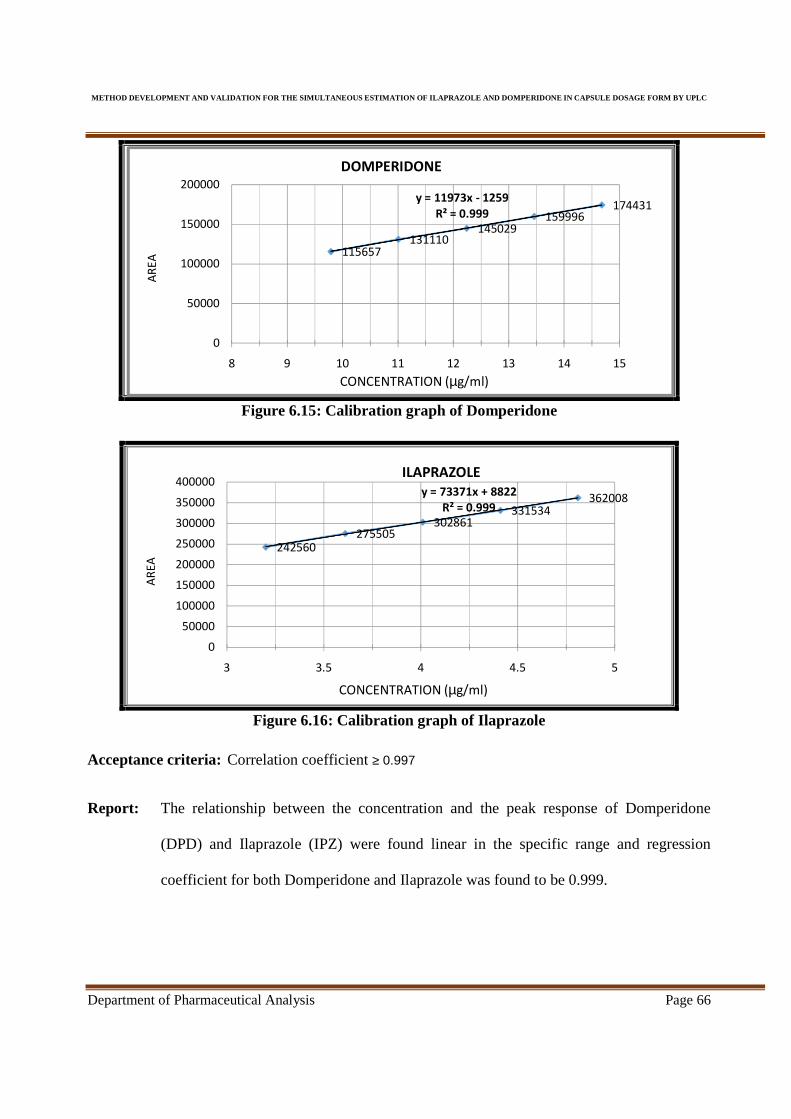
METHOD DEVELOPMENT AND VALIDATION FOR THE SIMULTANE OUS ESTIMATION OF ILAPRAZOLE AND DOMPERIDONE IN CAP SULE DOSAGE FORM BY UPLC
Department of Pharmaceutical Analysis Page 66
Figure 6.15: Calibration graph of Domperidone
Figure 6.16: Calibration graph of Ilaprazole
Acceptance criteria: Correlation coefficient ≥ 0.997
Report: The relationship between the concentration and the peak response of Domperidone
(DPD) and Ilaprazole (IPZ) were found linear in the specific range and regression
coefficient for both Domperidone and Ilaprazole was found to be 0.999.
115657131110
145029159996
174431y = 11973x - 1259
R² = 0.999
0
50000
100000
150000
200000
8 9 10 11 12 13 14 15
AR
EA
DOMPERIDONE
CONCENTRATION (µg/ml)
242560275505
302861331534
362008y = 73371x + 8822
R² = 0.999
0
50000
100000
150000
200000
250000
300000
350000
400000
3 3.5 4 4.5 5
AR
EA
ILAPRAZOLE
CONCENTRATION (µg/ml)
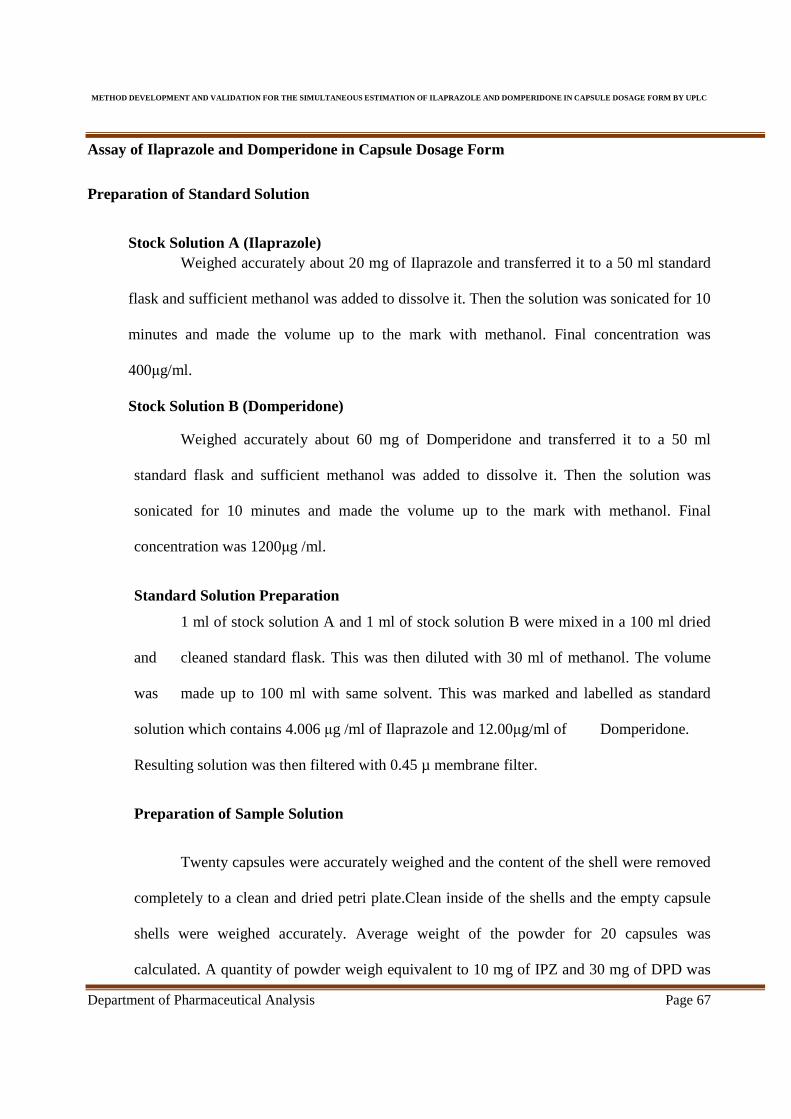
METHOD DEVELOPMENT AND VALIDATION FOR THE SIMULTANE OUS ESTIMATION OF ILAPRAZOLE AND DOMPERIDONE IN CAP SULE DOSAGE FORM BY UPLC
Department of Pharmaceutical Analysis Page 67
Assay of Ilaprazole and Domperidone in Capsule Dosage Form
Preparation of Standard Solution
Stock Solution A (Ilaprazole) Weighed accurately about 20 mg of Ilaprazole and transferred it to a 50 ml standard
flask and sufficient methanol was added to dissolve it. Then the solution was sonicated for 10
minutes and made the volume up to the mark with methanol. Final concentration was
400μg/ml.
Stock Solution B (Domperidone)
Weighed accurately about 60 mg of Domperidone and transferred it to a 50 ml
standard flask and sufficient methanol was added to dissolve it. Then the solution was
sonicated for 10 minutes and made the volume up to the mark with methanol. Final
concentration was 1200μg /ml.
Standard Solution Preparation
1 ml of stock solution A and 1 ml of stock solution B were mixed in a 100 ml dried
and cleaned standard flask. This was then diluted with 30 ml of methanol. The volume
was made up to 100 ml with same solvent. This was marked and labelled as standard
solution which contains 4.006 μg /ml of Ilaprazole and 12.00μg/ml of Domperidone.
Resulting solution was then filtered with 0.45 µ membrane filter.
Preparation of Sample Solution
Twenty capsules were accurately weighed and the content of the shell were removed
completely to a clean and dried petri plate.Clean inside of the shells and the empty capsule
shells were weighed accurately. Average weight of the powder for 20 capsules was
calculated. A quantity of powder weigh equivalent to 10 mg of IPZ and 30 mg of DPD was

METHOD DEVELOPMENT AND VALIDATION FOR THE SIMULTANE OUS ESTIMATION OF ILAPRAZOLE AND DOMPERIDONE IN CAP SULE DOSAGE FORM BY UPLC
Department of Pharmaceutical Analysis Page 68
weighed and transferred to a 25 ml volumetric flask and sufficient diluent was added to
dissolve it. Then the solution was sonicated for 10 min. Final volume was adjusted with the
same solvent and filtered through 0.45 µ membrane filter. 1 ml of the solution was pipetted
out in a 100 ml dried and cleaned standard flask. This was then diluted with 30 ml of
methanol. The volume was made up to 100 ml with same solvent. Resulting solution was
then filtered through 0.45 µ membrane filter. The sample solution contains 4µg/ml of
Ilaprazole and 12 µg/ml of Domperidone.
Procedure:
Standard and sample solution were loaded on vial and injected into the chromatographic
system with the help of auto injector separately. Injection has to be carried out by 5 replication of
standard followed by sample.
Average weight of 20 capsules = 320.0 mg
Weight taken = 316.18 mg
Label claim: 10 mg of Ilaprazole
30 mg of Domperidone
Purity of Working Standard purity
Ilaprazole : 99.48%
Domperidone : 99.22%
Weight taken for standard Solution
Ilaprazole : 20.03 mg
Domperidone : 61.18 mg
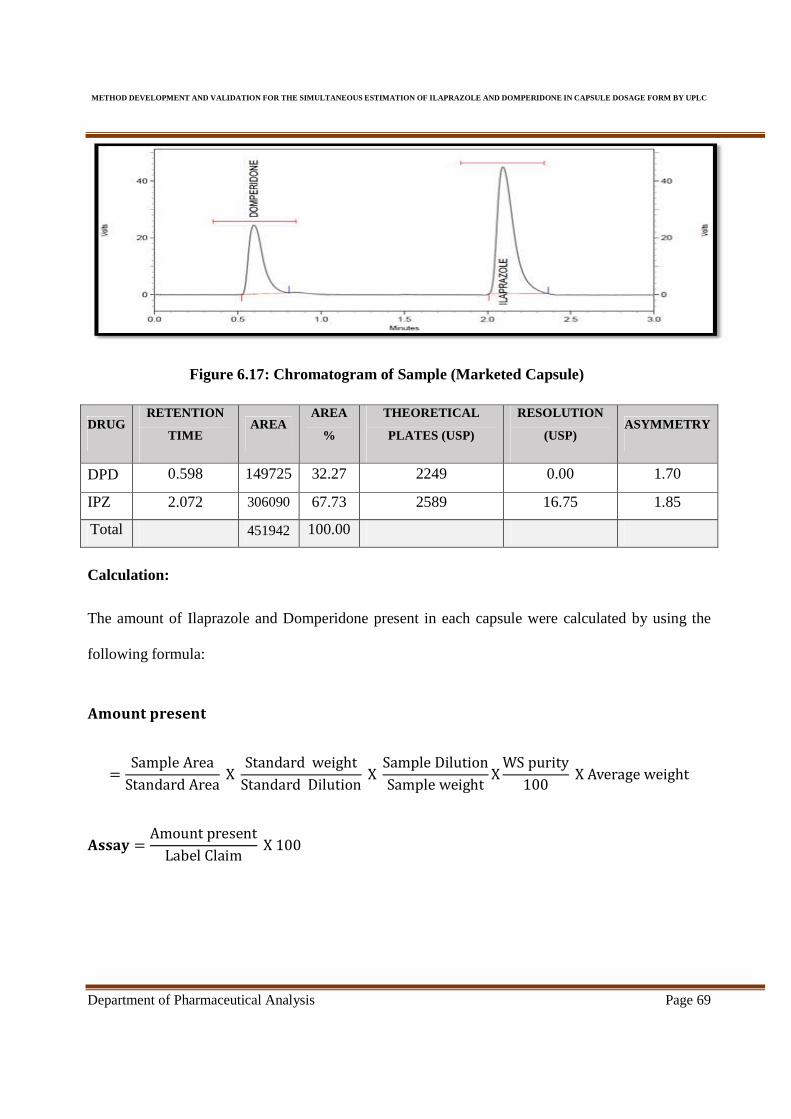
METHOD DEVELOPMENT AND VALIDATION FOR THE SIMULTANE OUS ESTIMATION OF ILAPRAZOLE AND DOMPERIDONE IN CAP SULE DOSAGE FORM BY UPLC
Department of Pharmaceutical Analysis Page 69
Figure 6.17: Chromatogram of Sample (Marketed Capsule)
DRUG RETENTION
TIME AREA
AREA
%
THEORETICAL
PLATES (USP)
RESOLUTION
(USP) ASYMMETRY
DPD 0.598 149725 32.27 2249 0.00 1.70
IPZ 2.072 306090 67.73 2589 16.75 1.85
Total 451942 100.00
Calculation:
The amount of Ilaprazole and Domperidone present in each capsule were calculated by using the
following formula:
������ ����
=Sample Area
Standard Area X
Standard weight
Standard Dilution X
Sample Dilution
Sample weightX
WS purity
100 X Average weight
���%& =Amount present
Label Claim X 100
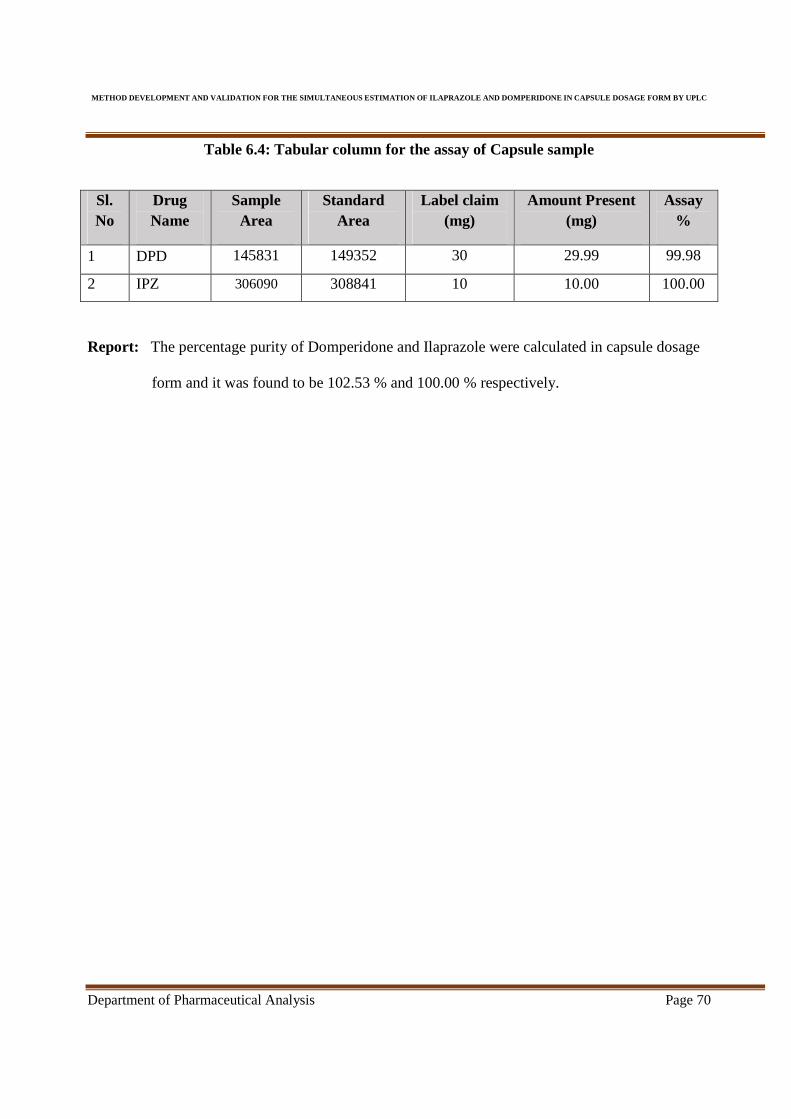
METHOD DEVELOPMENT AND VALIDATION FOR THE SIMULTANE OUS ESTIMATION OF ILAPRAZOLE AND DOMPERIDONE IN CAP SULE DOSAGE FORM BY UPLC
Department of Pharmaceutical Analysis Page 70
Table 6.4: Tabular column for the assay of Capsule sample
Sl. No
Drug Name
Sample Area
Standard Area
Label claim (mg)
Amount Present (mg)
Assay %
1 DPD 145831 149352 30 29.99 99.98
2 IPZ 306090 308841 10 10.00 100.00
Report: The percentage purity of Domperidone and Ilaprazole were calculated in capsule dosage
form and it was found to be 102.53 % and 100.00 % respectively.
METHOD DEVELOPMENT AND VALIDATION FOR THE SIMULTANE OUS ESTIMATION OF ILAPRAZOLE AND DOMPERIDONE IN CAP SULE DOSAGE FORM BY UPLC
Department of Pharmaceutical Analysis Page 71
VALIDATION OF
DEVELOPED METHOD

METHOD DEVELOPMENT AND VALIDATION FOR THE SIMULTANE OUS ESTIMATION OF ILAPRAZOLE AND DOMPERIDONE IN CAP SULE DOSAGE FORM BY UPLC
Department of Pharmaceutical Analysis Page 72
7. VALIDATION OF DEVELOPED METHOD
7.1 PREPARATION OF SOLUTION
7.1.1 Preparation of mobile phase
Water, Methanol, Acetonitrile and Acetic acid were mixed in the ratio of
30:20:50:0.3andthe pH was adjusted to 5.0 with Triethylamine. Sonicated the solution by the help
of ultra sonicator for 20 minutes and filtered with 0.45 µ membrane filter.
7.1.2 Preparation of working standard solution
Stock Solution A (Ilaprazole) Weighed accurately about 20 mg of Ilaprazole and transferred it to a 50 ml standard
flask and sufficient methanol was added to dissolve it. Then the solution was sonicated for 10
minutes and made the volume up to the mark with methanol. Final concentration was
400μg/ml.
Stock Solution B (Domperidone)
Weighed accurately about 60mg of Domperidone and transferred it to a 50 ml
standard flask and sufficient methanol was added to dissolve it. Then the solution was
sonicated for 10 minutes and made the volume up to the mark with methanol. Final
concentration was 1200μg /ml.
7.1.3 Standard Solution Preparation
1 ml of stock solution A and 1 ml of stock solution B were mixed in a 100 ml dried and
cleaned standard flask. This was then diluted with 30 ml of methanol. The volume was made up to
100 ml with same solvent. This was marked and labelled as standard stock solution which contains

METHOD DEVELOPMENT AND VALIDATION FOR THE SIMULTANE OUS ESTIMATION OF ILAPRAZOLE AND DOMPERIDONE IN CAP SULE DOSAGE FORM BY UPLC
Department of Pharmaceutical Analysis Page 73
4.006μg /ml of Ilaprazole and 12.00μg/ml of Domperidone. Resulting solution was then filtered
with 0.45 µ membrane filter.
6.1.4 Preparation of Sample solutions
Twenty capsules were accurately weighed and the content of the shell were removed
completely to a clean and dried petri plate.Clean inside of the shells and the empty capsule shells
were weighed accurately. Average weight of the powder for 20 capsules was calculated.A quantity
of powder weigh equivalent to 10mg of IPZ and 30 mg of DPD was weighed and transferred to a25
ml volumetric flask and sufficient diluent was added to dissolve it. Then the solution was sonicated
for 10 min. Final volume was adjusted with the same solvent and filtered through 0.45 µ membrane
filter. 1 ml of the solution was pipetted out in a 100 ml dried and cleaned standard flask. This was
then diluted with 30 ml of methanol. The volume was made up to 100 ml with same solvent.
Resulting solution was then filtered through 0.45 µ membrane filter.
The sample solution contains 4µg/ml of Ilaprazole and 12µg/ml of Domperidone. The
amount of Ilaprazole and Domperidone present in each capsule were calculated by using the
following formula:
Amount present
=Sample Area
Standard Area X
Standard weight
Standard Dilution X
Sample Dilution
Sample weightX
Percentage purity
100 X Average weight
% Amount present =Amount present
Label Claim X 100
METHOD DEVELOPMENT AND VALIDATION FOR THE SIMULTANE OUS ESTIMATION OF ILAPRAZOLE AND DOMPERIDONE IN CAP SULE DOSAGE FORM BY UPLC
Department of Pharmaceutical Analysis Page 74
7.2 ANALYTICAL METHOD VALIDATION
The developed method was validated according to ICH guidelines
Method validation of Ilaprazole and Domperidone
The mobile phase was prepared and all parameters were set as per the above optimized method.
7.2.1 Specificity
Specificity is the ability to assess unequivocally the analyte in the presence of components
which may be expected to be present. The specificity of the method was evaluated with regard to
interference due to presence of any other excipients. The figure shows that drug was clearly
separated from its excipients. Thus, the UPLC method presented in this study is selective.
Lack of specificity of an individual analytical procedure may be compensated by other
supporting analytical procedures.
Identification of Ilaprazole and Domperidone: Solutions of standard and Sample were prepared
as per test method and injected into the chromatographic system.
Acceptance criteria: Chromatogram of Standard and sample should be identical with near /same
retention time.
Blank interference: A study to establish the interference, blank detection was conducted. Mobile
phase was injected as per the test method.
Acceptance criteria: Chromatogram of blank did not show any peak at the retention time of
analyte peak.
The blank, standard solution and sample solution were loaded on vial and chromatogram was
recorded.
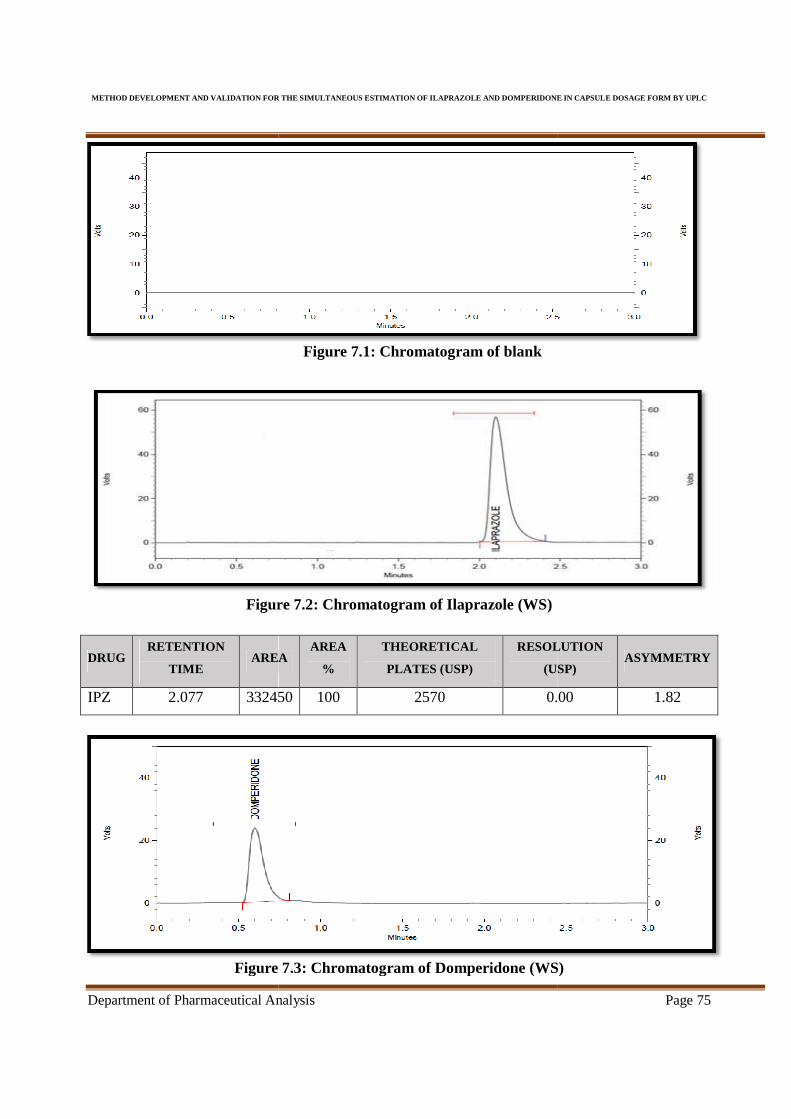
METHOD DEVELOPMENT AND VALIDATION FOR THE SIMULTANE OUS ESTIMATION OF ILAPRAZOLE AND DOMPERIDONE IN CAP SULE DOSAGE FORM BY UPL
Department of Pharmaceutical Analysis
Figure 7.2
DRUG RETENTION
TIME AREA
IPZ 2.077 332450
Figure
METHOD DEVELOPMENT AND VALIDATION FOR THE SIMULTANE OUS ESTIMATION OF ILAPRAZOLE AND DOMPERIDONE IN CAP SULE DOSAGE FORM BY UPL
nalysis
Figure 7.1: Chromatogram of blank
Figure 7.2: Chromatogram of Ilaprazole (WS)
AREA AREA
%
THEORETICAL
PLATES (USP)
RESOLUTION
(USP)
332450 100 2570 0.00
Figure 7.3: Chromatogram of Domperidone (WS)
METHOD DEVELOPMENT AND VALIDATION FOR THE SIMULTANE OUS ESTIMATION OF ILAPRAZOLE AND DOMPERIDONE IN CAP SULE DOSAGE FORM BY UPLC
Page 75
RESOLUTION
(USP) ASYMMETRY
0.00 1.82
: Chromatogram of Domperidone (WS)

METHOD DEVELOPMENT AND VALIDATION FOR THE SIMULTANE OUS ESTIMATION OF ILAPRAZOLE AND DOMPERIDONE IN CAP SULE DOSAGE FORM BY UPLC
Department of Pharmaceutical Analysis Page 76
DRUG RETENTION
TIME AREA
AREA
%
THEORETICAL
PLATES (USP)
RESOLUTION
(USP) ASYMMETRY
DPD 0.600 143549 100 2244 0.00 1.68
Figure 7.4: Chromatogram of sample solution
DRUG RETENTION
TIME AREA
AREA
%
THEORETICAL
PLATES (USP)
RESOLUTION
(USP) ASYMMETRY
DPD 0.600 149841 32.63 2263 0.00 1.66
IPZ 2.077 309371 67.37 2616 16.78 1.77
Total 459212 100.00
Report : Chromatogram of blank did not show any peak at the retention time of analytepeak
and retention time of standard and sample were identical.
7.2.2 System suitability
This parameter was tested by giving five replicate injections of the standard solution to check the
system suitability parameters like asymmetry, theoretical plates, tailing factor etc. Weight taken for
stock solution A & B were 51.28 mg of IPZ and 12.65 mg of DPD respectively. Suitability
parameters were calculated and given in table 7.1 & 7.2.
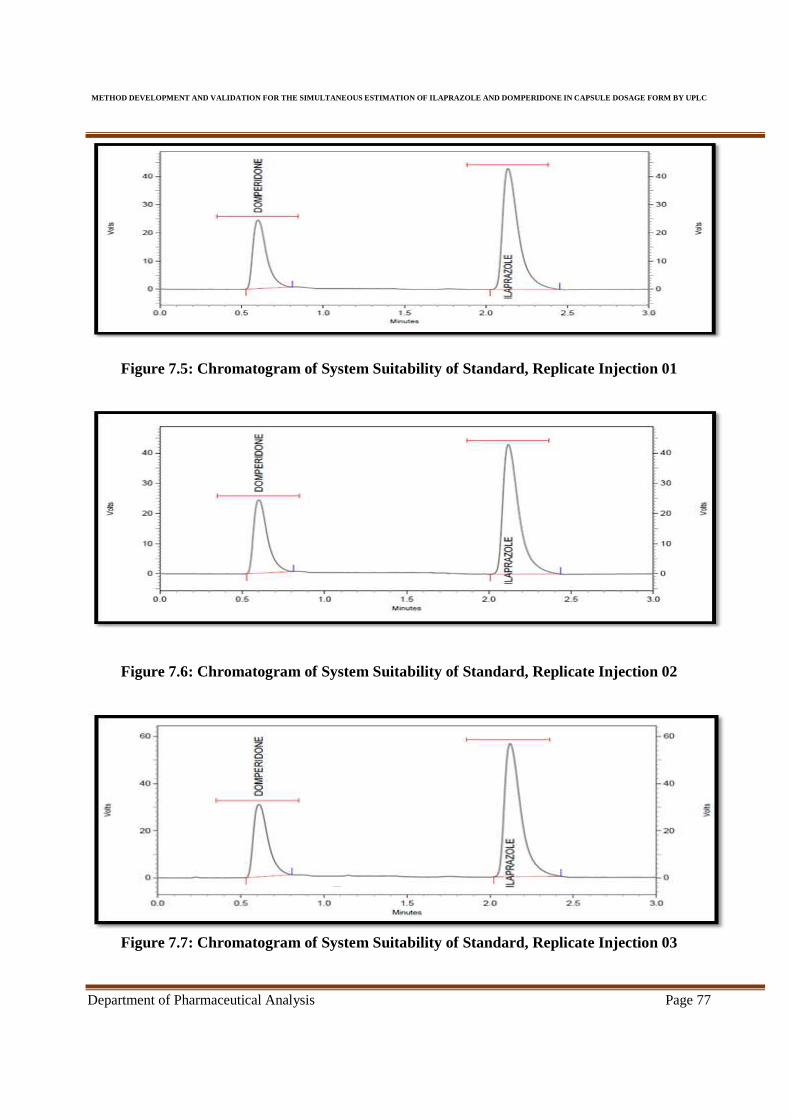
METHOD DEVELOPMENT AND VALIDATION FOR THE SIMULTANE OUS ESTIMATION OF ILAPRAZOLE AND DOMPERIDONE IN CAP SULE DOSAGE FORM BY UPLC
Department of Pharmaceutical Analysis Page 77
Figure 7.5: Chromatogram of System Suitability of Standard, Replicate Injection 01
Figure 7.6: Chromatogram of System Suitability of Standard, Replicate Injection 02
Figure 7.7: Chromatogram of System Suitability of Standard, Replicate Injection 03
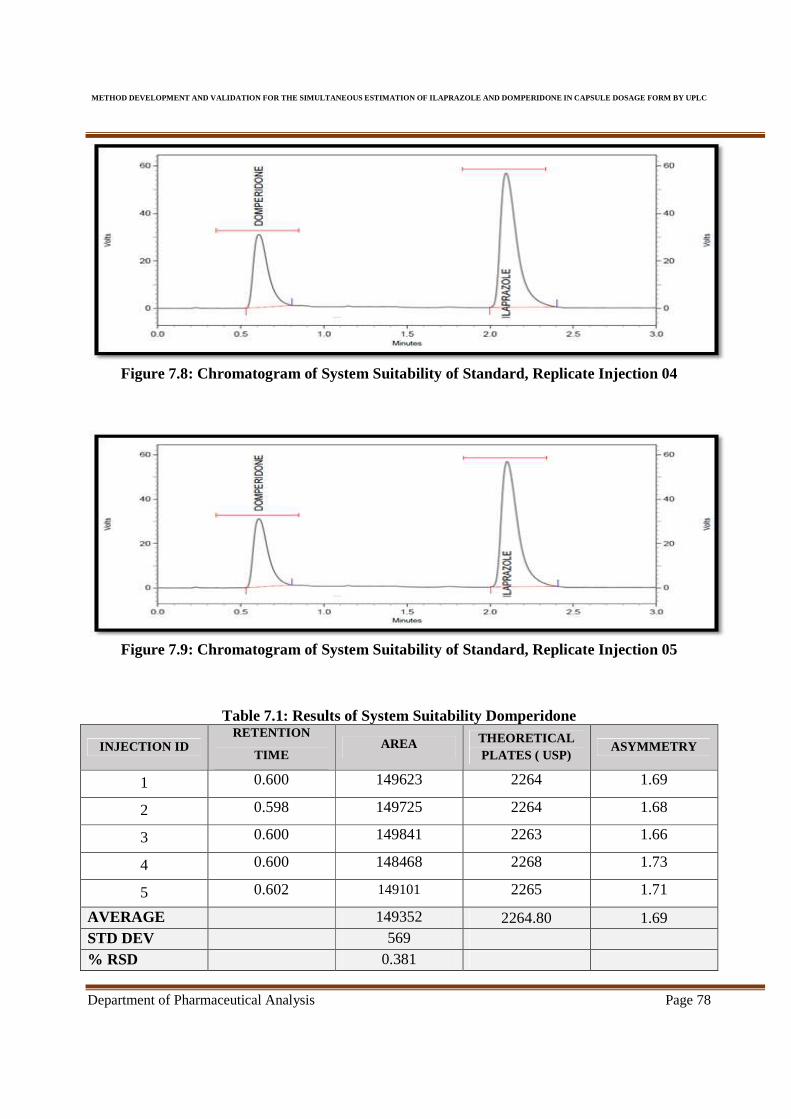
METHOD DEVELOPMENT AND VALIDATION FOR THE SIMULTANE OUS ESTIMATION OF ILAPRAZOLE AND DOMPERIDONE IN CAP SULE DOSAGE FORM BY UPLC
Department of Pharmaceutical Analysis Page 78
Figure 7.8: Chromatogram of System Suitability of Standard, Replicate Injection 04
Figure 7.9: Chromatogram of System Suitability of Standard, Replicate Injection 05
Table 7.1: Results of System Suitability Domperidone
INJECTION ID RETENTION
TIME AREA THEORETICAL
PLATES ( USP) ASYMMETRY
1 0.600 149623 2264 1.69
2 0.598 149725 2264 1.68
3 0.600 149841 2263 1.66
4 0.600 148468 2268 1.73
5 0.602 149101 2265 1.71
AVERAGE 149352 2264.80 1.69 STD DEV 569 % RSD 0.381

METHOD DEVELOPMENT AND VALIDATION FOR THE SIMULTANE OUS ESTIMATION OF ILAPRAZOLE AND DOMPERIDONE IN CAP SULE DOSAGE FORM BY UPLC
Department of Pharmaceutical Analysis Page 79
Table 7.2: Results of System Suitability Ilaprazole INJECTION ID
RETENTION
TIME AREA THEORETICAL
PLATES ( USP) ASYMMETRY
1 2.077 306754 2624 1.82
2 2.072 309482 2609 1.80
3 2.077 309371 2616 1.77
4 2.067 309673 2607 1.88
5 2.077 308925 2644 1.84
AVERAGE 308841 2620 1.82 STD DEV 1199 % RSD 0.388
Acceptance Criteria : Asymmetry NMT 2.0
Theoretical plates NLT 2000
RSD of area NMT 2.0
Report : The all system suitability parameters for IPZ and DPD were found
within limits.
7.2.3 Assay of Ilaprazole and Domperidone in Capsule Dosage Form
7.2.3.1 Preparation of Standard Solution
Stock Solution A (Ilaprazole) Weighed accurately about 20 mg of Ilaprazole and transferred it to a 50 ml standard
flask and sufficient methanol was added to dissolve it. Then the solution was sonicated for 10
minutes and made the volume up to the mark with methanol. Final concentration was
400μg/ml.
Stock Solution B (Domperidone)
Weighed accurately about 60mg of Domperidone and transferred it to a 50 ml
standard flask and sufficient methanol was added to dissolve it. Then the solution was
METHOD DEVELOPMENT AND VALIDATION FOR THE SIMULTANE OUS ESTIMATION OF ILAPRAZOLE AND DOMPERIDONE IN CAP SULE DOSAGE FORM BY UPLC
Department of Pharmaceutical Analysis Page 80
sonicated for 10 minutes and made the volume up to the mark with methanol. Final
concentration was 1200μg /ml.
Standard Solution Preparation
1 ml of stock solution A and 1 ml of stock solution B were mixed in a 100 ml dried
and cleaned standard flask. This was then diluted with 30 ml of methanol. The volume
was made up to 100 ml with same solvent. This was marked and labelled as standard
solution which contains 4.006 μg /ml of Ilaprazole and 12.00μg/ml of Domperidone.
Resulting solution was then filtered with 0.45 µ membrane filter.
7.2.3.2 Preparation of Sample Solution
Twenty capsules were accurately weighed and the content of the shell were removed
completely to a clean and dried petri plate.Clean inside of the shells and the empty capsule
shells were weighed accurately. Average weight of the powder for 20 capsules was
calculated. A quantity of powder weigh equivalent to 10 mg of IPZ and 30 mg of DPD was
weighed and transferred to a 25 ml volumetric flask and sufficient diluent was added to
dissolve it. Then the solution was sonicated for 10 min. Final volume was adjusted with the
same solvent and filtered through 0.45 µ membrane filter. 1 ml of the solution was pipetted
out in a 100 ml dried and cleaned standard flask. This was then diluted with 30 ml of
methanol. The volume was made up to 100 ml with same solvent. Resulting solution was
then filtered through 0.45 µ membrane filter. The sample solution contains 4µg/ml of
Ilaprazole and 12 µg/ml of Domperidone.
Procedure:
Standard and sample solution were loaded on vial and injected into the chromatographic
system with the help of auto injector separately. Injection has to be carried out by 5 replication of
standard followed by sample.

METHOD DEVELOPMENT AND VALIDATION FOR THE SIMULTANE OUS ESTIMATION OF ILAPRAZOLE AND DOMPERIDONE IN CAP SULE DOSAGE FORM BY UPLC
Department of Pharmaceutical Analysis Page 81
Average weight of 20 capsules= 320.0 mg
Weight taken = 316.18mg
Label claim: 10 mg of Ilaprazole
30 mg of Domperidone
Purity of Working Standard purity
Ilaprazole : 99.48%
Domperidone : 99.22%
Weight taken for standard Solution
Ilaprazole : 20.03 mg
Domperidone : 61.18 mg
Figure 7.10: Chromatogram of Sample (Marketed Capsule)
DRUG RETENTION
TIME AREA
AREA
%
THEORETICAL
PLATES (USP)
RESOLUTION
(USP) ASYMMETRY
DPD 0.598 149725 32.27 2249 0.00 1.70
IPZ 2.072 306090 67.73 2589 16.75 1.85
Total 451942 100.00

METHOD DEVELOPMENT AND VALIDATION FOR THE SIMULTANE OUS ESTIMATION OF ILAPRAZOLE AND DOMPERIDONE IN CAP SULE DOSAGE FORM BY UPLC
Department of Pharmaceutical Analysis Page 82
Calculation:
The amount of Ilaprazole and Domperidone present in each capsule were calculated by using the
following formula:
������ ����
=Sample Area
Standard Area X
Standard weight
Standard Dilution X
Sample Dilution
Sample weightX
WS purity
100 X Average weight
���%& =Amount present
Label Claim X 100
Table 7.3: Tabular column for the assay of Capsule sample
Sl. No
Drug Name
Sample Area
Standard Area
Label claim (mg)
Amount Present (mg)
Assay %
1 DPD 145831 149352 30 29.99 99.98
2 IPZ 306090 308841 10 10.00 100.00
Report: The percentage purity of Domperidone and Ilaprazole were calculated in capsule dosage
form and it was found to be 102.53 % and 100.00 % respectively.
7.2.4 Linearity
The linearity of an analytical procedure is its ability (within a given range) to obtain test
results which are directly proportional to the concentration (amount) of analyte in the sample. To
demonstrate the linearity of analytes over the range 80% to 120% of target concentration five
different concentration solutions of the DPD & IPZ (80%, 90%, 100%, 110%, and 120%) prepared
and take injections in UPLC by the means of auto injector.

METHOD DEVELOPMENT AND VALIDATION FOR THE SIMULTANE OUS ESTIMATION OF ILAPRAZOLE AND DOMPERIDONE IN CAP SULE DOSAGE FORM BY UPLC
Department of Pharmaceutical Analysis Page 83
7.2.4.1 Procedure
Stock Solution A (Ilaprazole) Weighed accurately about 20 mg of Ilaprazole and transferred it to a 50 ml standard
flask and sufficient methanol was added to dissolve it. Then the solution was sonicated for
10 minutes and made the volume up to the mark with methanol. Final concentration was
400μg/ml.
Stock Solution B (Domperidone) Weighed accurately about 60 mg of Domperidone and transferred it to a 50 ml
standard flask and sufficient methanol was added to dissolve it. Then the solution was
sonicated for 10 minutes and made the volume up to the mark with methanol. Final
concentration was 1200 μg /ml.
Actual weight taken,
For stock solution A (Ilaprazole) = 20.03 mg
For stock solution B (Domperidone) = 61.18 mg
Preparation of 80% Solution:
Dilute 0.8 ml of stock solution A and 0.8 ml of stock solution B in 100 ml volumetric flask and
make up the volume up to the mark with same diluent.
Preparation of 90% Solution:
Dilute 0.9 ml of stock solution A and 0.9 ml of stock solution B in 100 ml volumetric flask and
make up the volume up to the mark with same diluent.
Preparation of 100% Solution: Dilute 1 ml of stock solution A and 1 ml of stock solution B in 100 ml volumetric flask and make
up the volume up to the mark with same diluent.
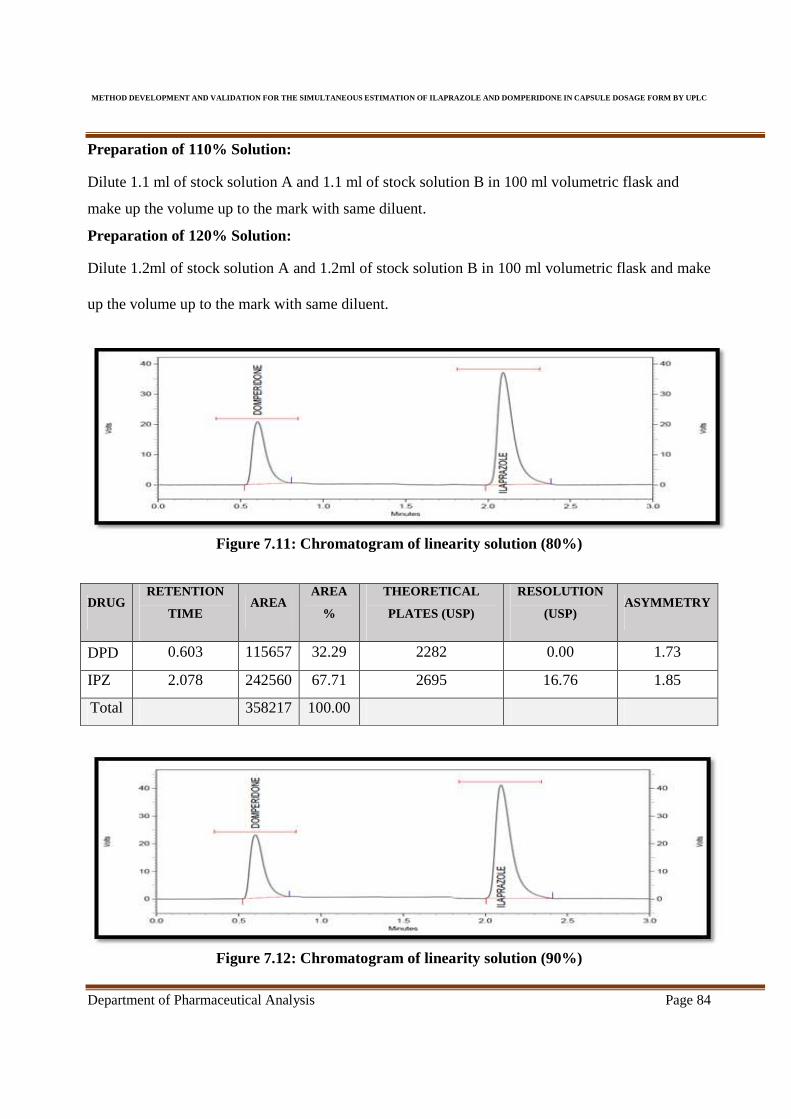
METHOD DEVELOPMENT AND VALIDATION FOR THE SIMULTANE OUS ESTIMATION OF ILAPRAZOLE AND DOMPERIDONE IN CAP SULE DOSAGE FORM BY UPLC
Department of Pharmaceutical Analysis Page 84
Preparation of 110% Solution: Dilute 1.1 ml of stock solution A and 1.1 ml of stock solution B in 100 ml volumetric flask and
make up the volume up to the mark with same diluent.
Preparation of 120% Solution: Dilute 1.2ml of stock solution A and 1.2ml of stock solution B in 100 ml volumetric flask and make
up the volume up to the mark with same diluent.
Figure 7.11: Chromatogram of linearity solution (80%)
DRUG RETENTION
TIME AREA
AREA
%
THEORETICAL
PLATES (USP)
RESOLUTION
(USP) ASYMMETRY
DPD 0.603 115657 32.29 2282 0.00 1.73
IPZ 2.078 242560 67.71 2695 16.76 1.85
Total 358217 100.00
Figure 7.12: Chromatogram of linearity solution (90%)
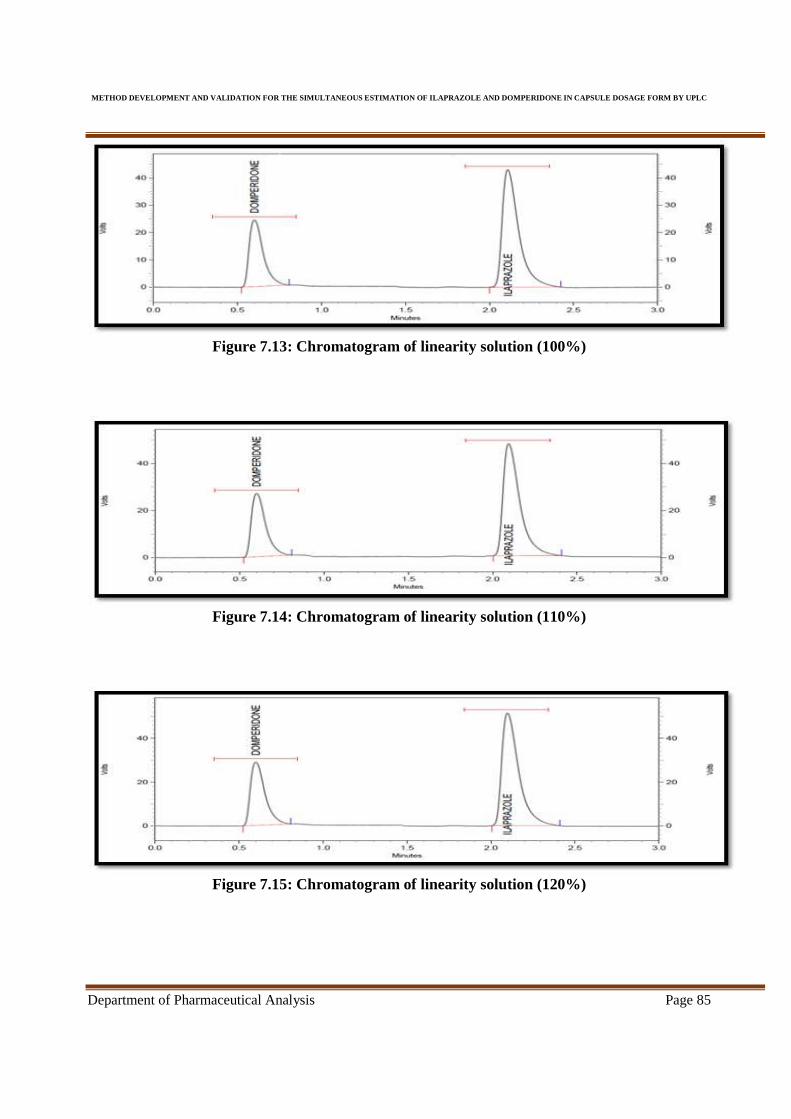
METHOD DEVELOPMENT AND VALIDATION FOR THE SIMULTANE OUS ESTIMATION OF ILAPRAZOLE AND DOMPERIDONE IN CAP SULE DOSAGE FORM BY UPLC
Department of Pharmaceutical Analysis Page 85
Figure 7.13: Chromatogram of linearity solution (100%)
Figure 7.14: Chromatogram of linearity solution (110%)
Figure 7.15: Chromatogram of linearity solution (120%)
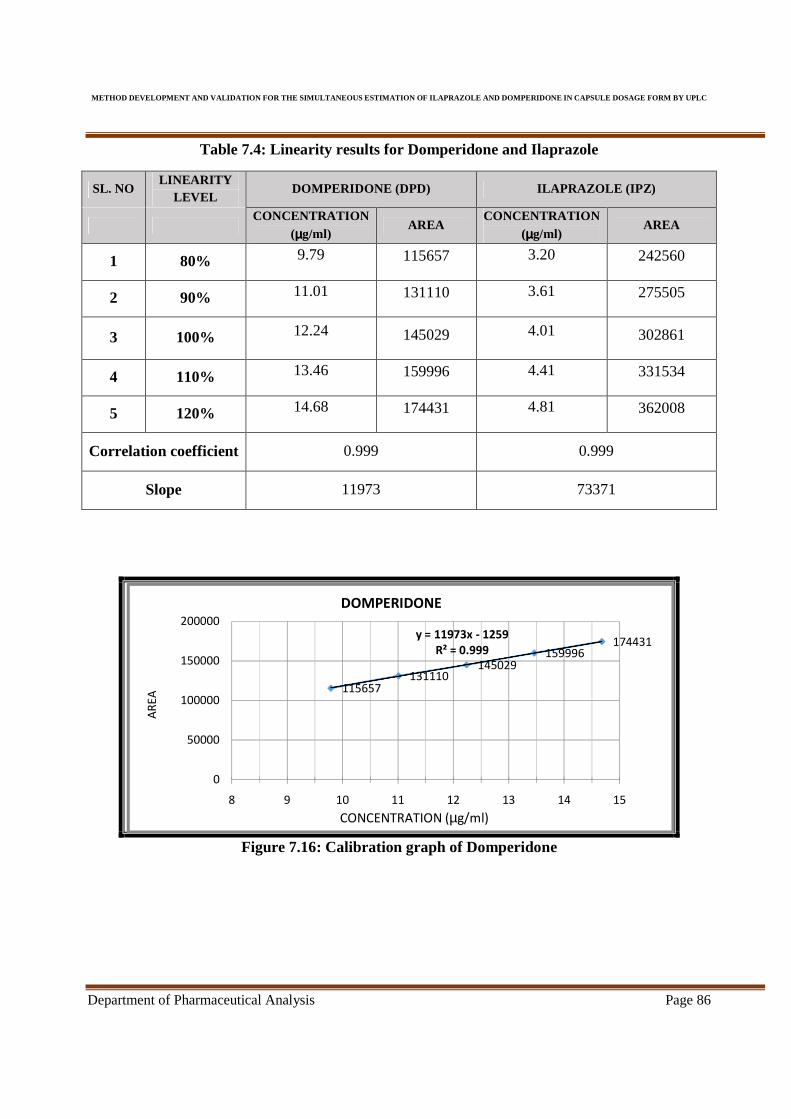
METHOD DEVELOPMENT AND VALIDATION FOR THE SIMULTANE OUS ESTIMATION OF ILAPRAZOLE AND DOMPERIDONE IN CAP SULE DOSAGE FORM BY UPLC
Department of Pharmaceutical Analysis Page 86
Table 7.4: Linearity results for Domperidone and Ilaprazole
SL. NO LINEARITY
LEVEL DOMPERIDONE (DPD) ILAPRAZOLE (IPZ)
CONCENTRATION
(µµµµg/ml) AREA
CONCENTRATION (µµµµg/ml)
AREA
1 80% 9.79 115657 3.20 242560
2 90% 11.01 131110 3.61 275505
3 100% 12.24 145029 4.01 302861
4 110% 13.46 159996 4.41 331534
5 120% 14.68 174431 4.81 362008
Correlation coefficient 0.999 0.999
Slope 11973 73371
Figure 7.16: Calibration graph of Domperidone
115657131110
145029159996
174431y = 11973x - 1259
R² = 0.999
0
50000
100000
150000
200000
8 9 10 11 12 13 14 15
AR
EA
DOMPERIDONE
CONCENTRATION (µg/ml)
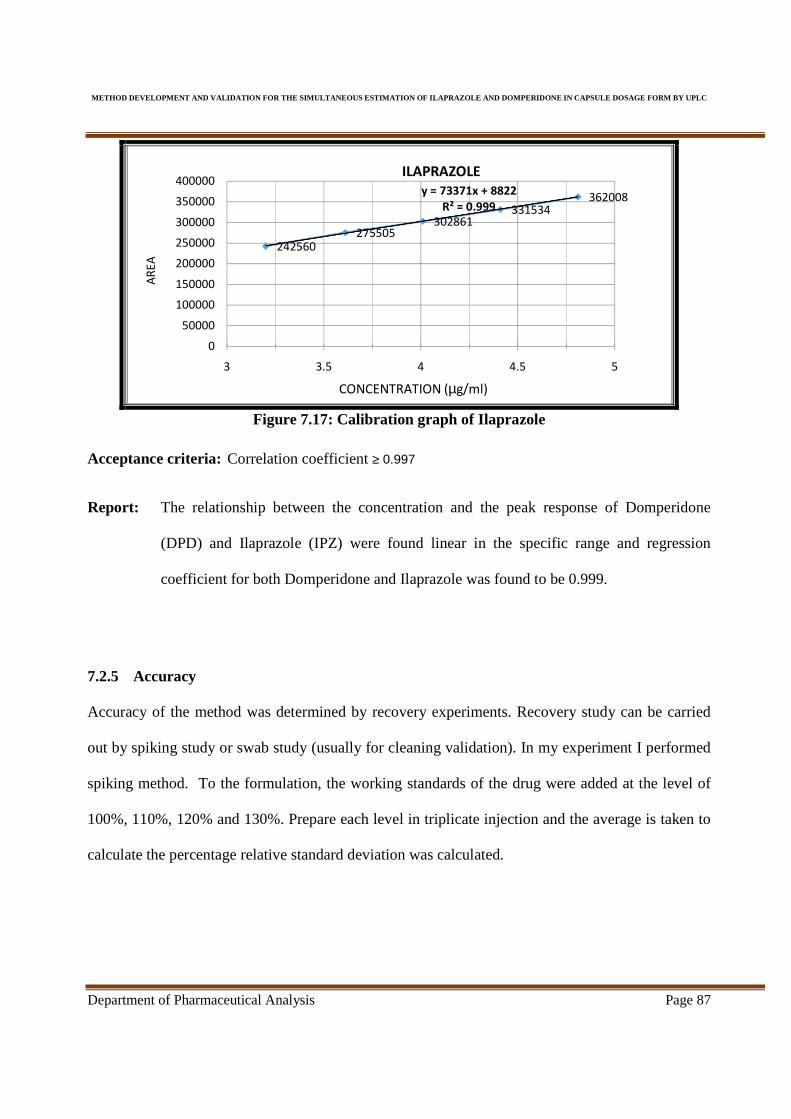
METHOD DEVELOPMENT AND VALIDATION FOR THE SIMULTANE OUS ESTIMATION OF ILAPRAZOLE AND DOMPERIDONE IN CAP SULE DOSAGE FORM BY UPLC
Department of Pharmaceutical Analysis Page 87
Figure 7.17: Calibration graph of Ilaprazole
Acceptance criteria: Correlation coefficient ≥ 0.997
Report: The relationship between the concentration and the peak response of Domperidone
(DPD) and Ilaprazole (IPZ) were found linear in the specific range and regression
coefficient for both Domperidone and Ilaprazole was found to be 0.999.
7.2.5 Accuracy
Accuracy of the method was determined by recovery experiments. Recovery study can be carried
out by spiking study or swab study (usually for cleaning validation). In my experiment I performed
spiking method. To the formulation, the working standards of the drug were added at the level of
100%, 110%, 120% and 130%. Prepare each level in triplicate injection and the average is taken to
calculate the percentage relative standard deviation was calculated.
242560275505
302861331534
362008y = 73371x + 8822
R² = 0.999
0
50000
100000
150000
200000
250000
300000
350000
400000
3 3.5 4 4.5 5
AR
EA
ILAPRAZOLE
CONCENTRATION (µg/ml)
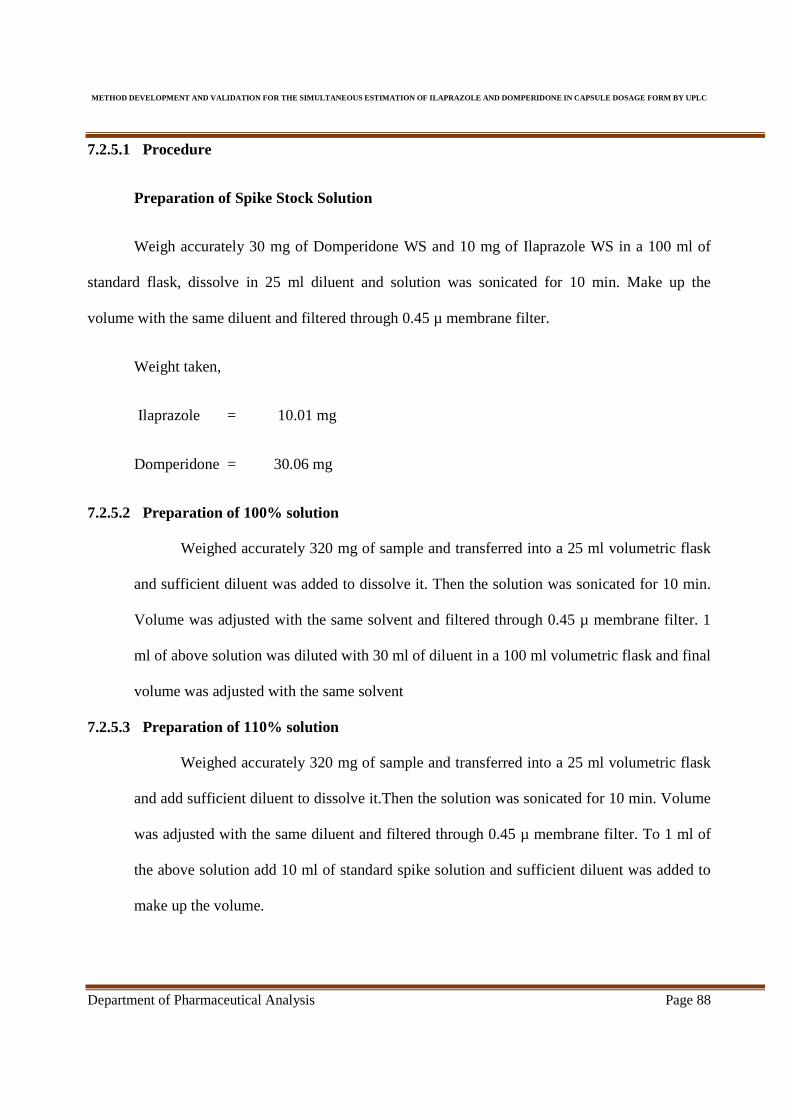
METHOD DEVELOPMENT AND VALIDATION FOR THE SIMULTANE OUS ESTIMATION OF ILAPRAZOLE AND DOMPERIDONE IN CAP SULE DOSAGE FORM BY UPLC
Department of Pharmaceutical Analysis Page 88
7.2.5.1 Procedure
Preparation of Spike Stock Solution
Weigh accurately 30 mg of Domperidone WS and 10 mg of Ilaprazole WS in a 100 ml of
standard flask, dissolve in 25 ml diluent and solution was sonicated for 10 min. Make up the
volume with the same diluent and filtered through 0.45 µ membrane filter.
Weight taken,
Ilaprazole = 10.01 mg
Domperidone = 30.06 mg
7.2.5.2 Preparation of 100% solution
Weighed accurately 320 mg of sample and transferred into a 25 ml volumetric flask
and sufficient diluent was added to dissolve it. Then the solution was sonicated for 10 min.
Volume was adjusted with the same solvent and filtered through 0.45 µ membrane filter. 1
ml of above solution was diluted with 30 ml of diluent in a 100 ml volumetric flask and final
volume was adjusted with the same solvent
7.2.5.3 Preparation of 110% solution
Weighed accurately 320 mg of sample and transferred into a 25 ml volumetric flask
and add sufficient diluent to dissolve it.Then the solution was sonicated for 10 min. Volume
was adjusted with the same diluent and filtered through 0.45 µ membrane filter. To 1 ml of
the above solution add 10 ml of standard spike solution and sufficient diluent was added to
make up the volume.

METHOD DEVELOPMENT AND VALIDATION FOR THE SIMULTANE OUS ESTIMATION OF ILAPRAZOLE AND DOMPERIDONE IN CAP SULE DOSAGE FORM BY UPLC
Department of Pharmaceutical Analysis Page 89
7.2.5.4 Preparation of 120% solution
Weighed accurately 320 mg of sample and transferred into a 25 ml volumetric flask
and add sufficient diluent to dissolve it. Then the solution was sonicated for 10 min. Volume
was adjusted with the same diluent and filtered through 0.45 µ membrane filter. To 1 ml of
the above solution add 20 ml of standard spike solution and sufficient diluent was added to
make up the volume.
7.2.5.5 Preparation of 130% solution:
Weighed accurately 320 mg of sample and transferred into a 25 ml volumetric flask
and add sufficient diluent to dissolve it. Then the solution was sonicated for 10 min. Volume
was adjusted with the same diluent and filtered through 0.45 µ membrane filter. To 1 ml of
the above solution add 30 ml of standard spike solution and sufficient diluent was added to
make up the volume.
Table 7.5: Tabular Column for Recovery Solution
ACCURACY
SOLUTION
(%)
WEIGHT
OF
SAMPLE
(mg)
THEORETICALLY
PRE-EXISTING DPD
( mg/capsule)
THEORETICALLY
PRE-EXISTING IPZ
(mg/capsule)
AMOUNT SPIKED
(mg)
VOLUME
(ml) DPD IPZ
100 320.01 29.99 10.00 -- -- --
110 320.03 29.99 10.00 10 0.122 0.040
120 320.03 29.99 10.00 20 0.245 0.080
130 320.02 29.99 10.00 30 0.367 0.120
% Recovery
=Actual calculated amount in recovery sample
Amount spiked in to the recovery sample + Calculated theoritical pre existing amount X 100
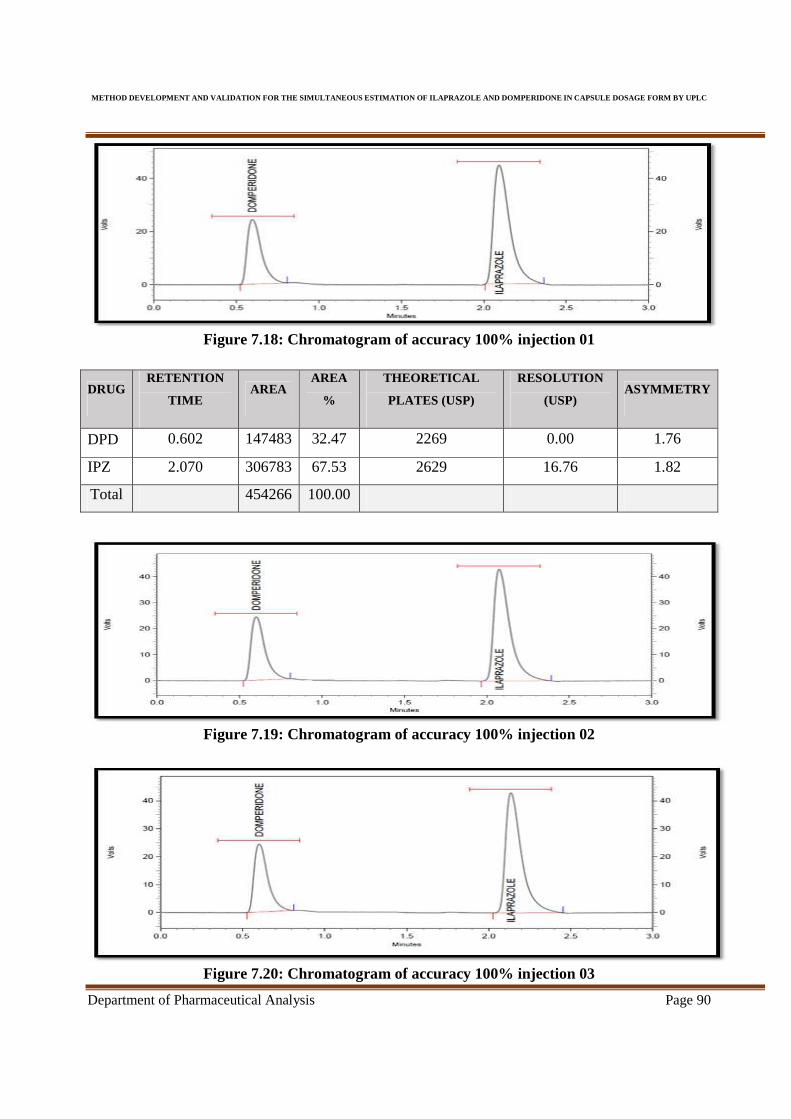
METHOD DEVELOPMENT AND VALIDATION FOR THE SIMULTANE OUS ESTIMATION OF ILAPRAZOLE AND DOMPERIDONE IN CAP SULE DOSAGE FORM BY UPLC
Department of Pharmaceutical Analysis Page 90
Figure 7.18: Chromatogram of accuracy 100% injection 01
DRUG RETENTION
TIME AREA
AREA
%
THEORETICAL
PLATES (USP)
RESOLUTION
(USP) ASYMMETRY
DPD 0.602 147483 32.47 2269 0.00 1.76
IPZ 2.070 306783 67.53 2629 16.76 1.82
Total 454266 100.00
Figure 7.19: Chromatogram of accuracy 100% injection 02
Figure 7.20: Chromatogram of accuracy 100% injection 03
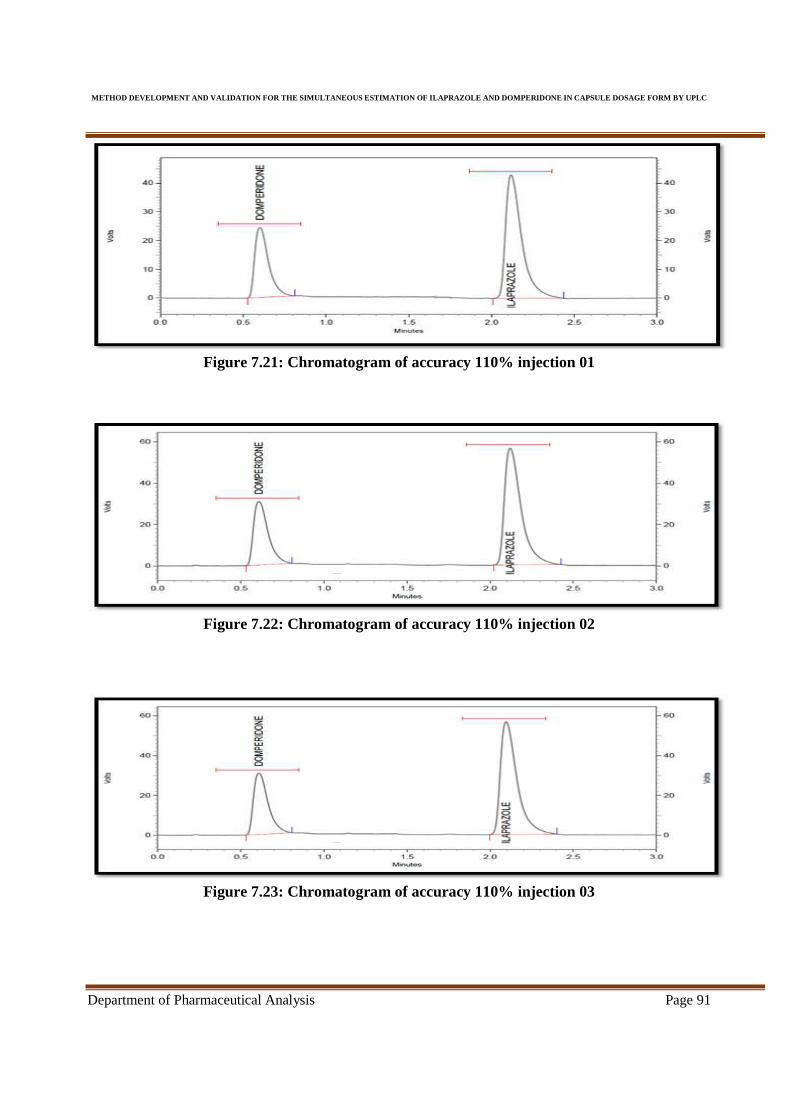
METHOD DEVELOPMENT AND VALIDATION FOR THE SIMULTANE OUS ESTIMATION OF ILAPRAZOLE AND DOMPERIDONE IN CAP SULE DOSAGE FORM BY UPLC
Department of Pharmaceutical Analysis Page 91
Figure 7.21: Chromatogram of accuracy 110% injection 01
Figure 7.22: Chromatogram of accuracy 110% injection 02
Figure 7.23: Chromatogram of accuracy 110% injection 03
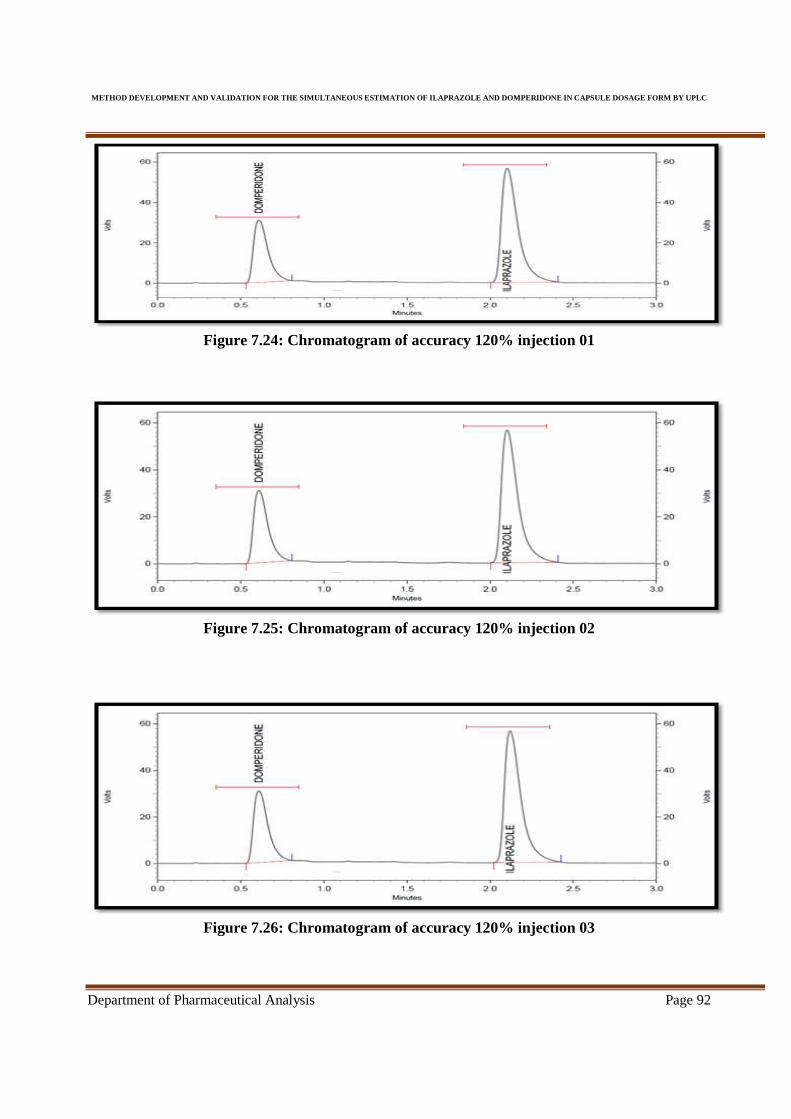
METHOD DEVELOPMENT AND VALIDATION FOR THE SIMULTANE OUS ESTIMATION OF ILAPRAZOLE AND DOMPERIDONE IN CAP SULE DOSAGE FORM BY UPLC
Department of Pharmaceutical Analysis Page 92
Figure 7.24: Chromatogram of accuracy 120% injection 01
Figure 7.25: Chromatogram of accuracy 120% injection 02
Figure 7.26: Chromatogram of accuracy 120% injection 03

METHOD DEVELOPMENT AND VALIDATION FOR THE SIMULTANE OUS ESTIMATION OF ILAPRAZOLE AND DOMPERIDONE IN CAP SULE DOSAGE FORM BY UPLC
Department of Pharmaceutical Analysis Page 93
Figure 7.27: Chromatogram of accuracy 130% injection 01
Figure 7.28: Chromatogram of accuracy 130% injection 02
Figure 7.29: Chromatogram of accuracy 130% injection 03
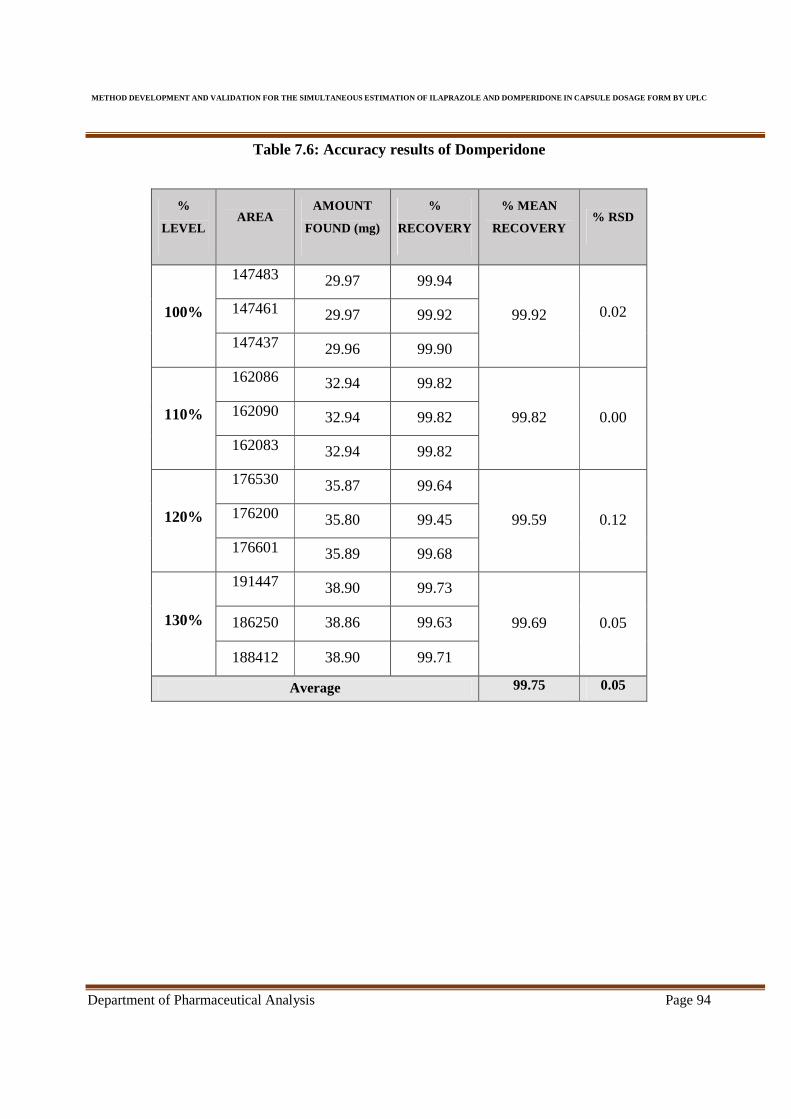
METHOD DEVELOPMENT AND VALIDATION FOR THE SIMULTANE OUS ESTIMATION OF ILAPRAZOLE AND DOMPERIDONE IN CAP SULE DOSAGE FORM BY UPLC
Department of Pharmaceutical Analysis Page 94
Table 7.6: Accuracy results of Domperidone
%
LEVEL AREA
AMOUNT
FOUND (mg)
%
RECOVERY
% MEAN
RECOVERY % RSD
100%
147483 29.97 99.94
99.92 0.02 147461 29.97 99.92
147437 29.96 99.90
110%
162086 32.94 99.82
99.82 0.00 162090 32.94 99.82
162083 32.94 99.82
120%
176530 35.87 99.64
99.59 0.12 176200 35.80 99.45
176601 35.89 99.68
130%
191447 38.90 99.73
99.69 0.05 186250 38.86 99.63
188412 38.90 99.71
Average 99.75 0.05
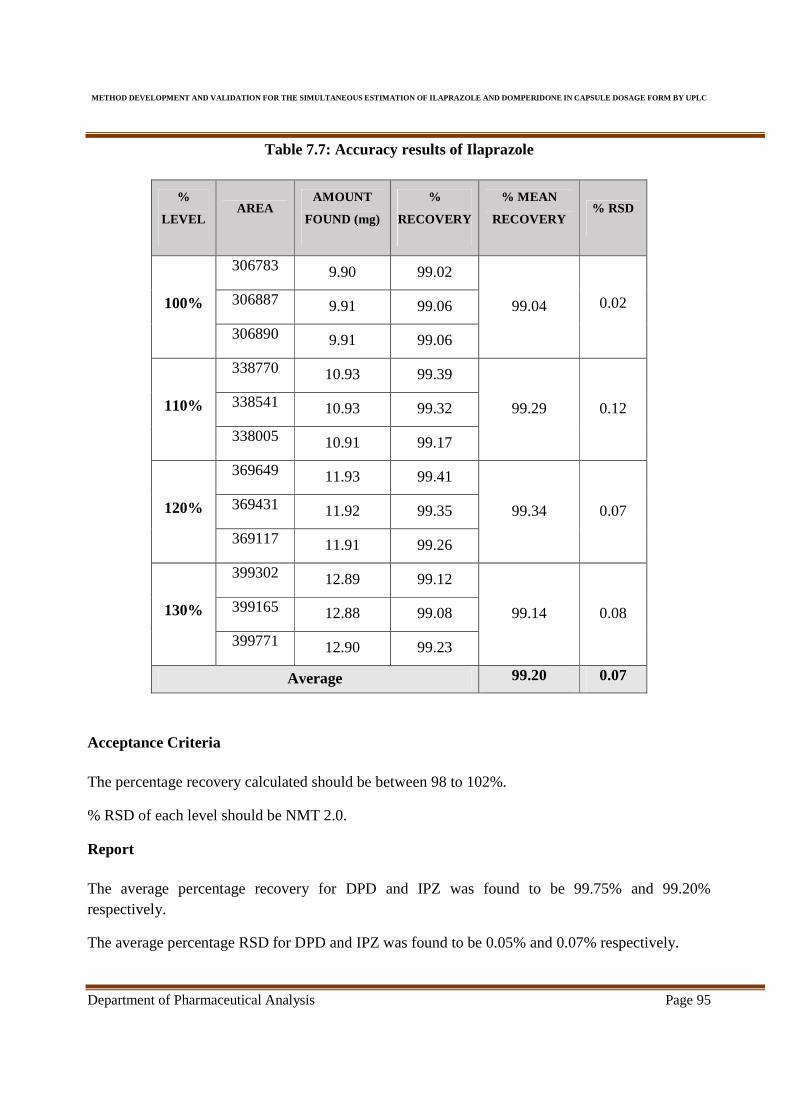
METHOD DEVELOPMENT AND VALIDATION FOR THE SIMULTANE OUS ESTIMATION OF ILAPRAZOLE AND DOMPERIDONE IN CAP SULE DOSAGE FORM BY UPLC
Department of Pharmaceutical Analysis Page 95
Table 7.7: Accuracy results of Ilaprazole
%
LEVEL AREA
AMOUNT
FOUND (mg)
%
RECOVERY
% MEAN
RECOVERY % RSD
100%
306783 9.90 99.02
99.04 0.02 306887 9.91 99.06
306890 9.91 99.06
110%
338770 10.93 99.39
99.29 0.12 338541 10.93 99.32
338005 10.91 99.17
120%
369649 11.93 99.41
99.34 0.07 369431 11.92 99.35
369117 11.91 99.26
130%
399302 12.89 99.12
99.14 0.08 399165 12.88 99.08
399771 12.90 99.23
Average 99.20 0.07
Acceptance Criteria
The percentage recovery calculated should be between 98 to 102%.
% RSD of each level should be NMT 2.0.
Report
The average percentage recovery for DPD and IPZ was found to be 99.75% and 99.20% respectively.
The average percentage RSD for DPD and IPZ was found to be 0.05% and 0.07% respectively.

METHOD DEVELOPMENT AND VALIDATION FOR THE SIMULTANE OUS ESTIMATION OF ILAPRAZOLE AND DOMPERIDONE IN CAP SULE DOSAGE FORM BY UPLC
Department of Pharmaceutical Analysis Page 96
7.2.6 Precision
Demonstrate the method precision by preparing six samples as per the test method of a
single batch representing the 100% of test concentration. Determine the assay of these samples and
evaluate the precision of the method by the % RSD of the assay results.
Figure 7.30: Chromatogram of Precision solution – l
DRUG RETENTION
TIME AREA
AREA
%
THEORETICAL
PLATES (USP)
RESOLUTION
(USP) ASYMMETRY
DPD 0.600 147059 32.46 2295 0.00 1.67
IPZ 2.073 306022 67.54 2614 16.80 1.80
Total 453081 100.00
Figure 7.31: Chromatogram of Precision solution – ll

METHOD DEVELOPMENT AND VALIDATION FOR THE SIMULTANE OUS ESTIMATION OF ILAPRAZOLE AND DOMPERIDONE IN CAP SULE DOSAGE FORM BY UPLC
Department of Pharmaceutical Analysis Page 97
Figure 7.32: Chromatogram of Precision solution – lll
Figure 7.33: Chromatogram of Precision solution – lV
Figure 7.34: Chromatogram of Precision solution – V

METHOD DEVELOPMENT AND VALIDATION FOR THE SIMULTANE OUS ESTIMATION OF ILAPRAZOLE AND DOMPERIDONE IN CAP SULE DOSAGE FORM BY UPLC
Department of Pharmaceutical Analysis Page 98
Figure 7.35: Chromatogram of Precision solution – Vl
Table 7.8: Method precision results for Domperidone & Ilaprazole
INJECTION NO.
SAMPLE WEIGHT
(mg)
DOMPERIDONE (DPD) ILAPRAZOLE (IPZ)
AREA %ASSAY AREA %ASSAY
1 316.25 147059 100.78 306022 99.97
2 316.37 147045 100.74 306022 99.94
3 316.18 147048 100.80 306076 100.00
4 316.19 147087 100.80 306019 99.99
5 316.17 147068 100.80 306024 100.00
6 316.20 147026 100.79 306093 99.99
Average 147055.50 100.79 306042.7 99.98
Standard Deviation 20.96 0.02 32.89 0.02
% RSD 0.01 0.02 0.01 0.02
Acceptance criteria: Percentage RSD ≤ 2
Report:
• The above precision study was assessed by repeatability tests.
• The % RSD for the area and assay of DPD found to be 0.01 and 0.02 respectively.
• The % RSD for the area and assay of IPZ was found to be 0.01 and 0.2 respectively.

METHOD DEVELOPMENT AND VALIDATION FOR THE SIMULTANE OUS ESTIMATION OF ILAPRAZOLE AND DOMPERIDONE IN CAP SULE DOSAGE FORM BY UPLC
Department of Pharmaceutical Analysis Page 99
7.2.7 Limit of detection (LOD) & Limit of Quantitation (L OQ)
The LOD and LOQ of DPD and IPZ shall be estimated from the standard deviation
of the response and the slope of the calibration curve by using the following formula
LOD = 2.2×5
6 LOQ =
78×5
6
Where σ = the standard deviation of the response
S = the slope of the calibration curve
Table 7.9: LOD & LOQ Determination
NAME SLOPE STANDARD DEVIATION
OF RESPONSE
LOD
(µg/ml)
LOQ
(µg/ml)
Domperidone (DPD) 11973 20.96 0.006 0.018
Ilaprazole (IPZ) 73371 32.89 0.001 0.004
Report:
• The LOD and LOQ of DPD for this method were found to be 0.006 µg/ml and 0.018µg/ml
respectively.
• The LOD and LOQ ofIPZ for this method were found to be 0.001 µg/ml and 0.004 µg/ml
respectively.
7.2.8 Robustness
Robustness of the method was checked by small deliberate changes in the method
parameters such as wavelength (±2nm) and flow rate (±0.025ml) which shall not much affect in
theoretical plates and peak asymmetry.

METHOD DEVELOPMENT AND VALIDATION FOR THE SIMULTANE OUS ESTIMATION OF ILAPRAZOLE AND DOMPERIDONE IN CAP SULE DOSAGE FORM BY UPLC
Department of Pharmaceutical Analysis Page 100
Figure 7.36: Chromatogram of robustness at wavelength 286 nm
DRUG RETENTION
TIME AREA
AREA
%
THEORETICAL
PLATES (USP)
RESOLUTION
(USP) ASYMMETRY
DPD 0.602 146223 31.82 2240 0.00 1.71
IPZ 2.082 313376 68.18 2570 16.80 1.85
Total 459599 100.00
Figure 7.37: Chromatogram of robustness at wavelength 290 nm
DRUG RETENTION
TIME AREA
AREA
%
THEORETICAL
PLATES (USP)
RESOLUTION
(USP) ASYMMETRY
DPD 0.602 144409 31.37 2276 0.00 1.58
IPZ 2.062 315859 68.63 2536 16.81 1.84
Total 460268 100.00

METHOD DEVELOPMENT AND VALIDATION FOR THE SIMULTANE OUS ESTIMATION OF ILAPRAZOLE AND DOMPERIDONE IN CAP SULE DOSAGE FORM BY UPLC
Department of Pharmaceutical Analysis Page 101
Figure 7.38: Chromatogram of robustness (flow rate at 0.375 ml /min)
DRUG RETENTION
TIME AREA
AREA
%
THEORETICAL
PLATES (USP)
RESOLUTION
(USP) ASYMMETRY
DPD 0.657 146213 32.07 2228 0.00 1.59
IPZ 1.985 309729 67.93 2265 16.75 1.80
Total 455942 100.00
Figure 7.39: Chromatogram of robustness (flow rate at 0.425 ml /min)
DRUG RETENTION
TIME AREA
AREA
%
THEORETICAL
PLATES (USP)
RESOLUTION
(USP) ASYMMETRY
DPD 0.552 143529 32.13 2254 0.00 1.64
IPZ 2.097 303132 67.87 2598 16.77 1.94
Total 446661 100.00

METHOD DEVELOPMENT AND VALIDATION FOR THE SIMULTANE OUS ESTIMATION OF ILAPRAZOLE AND DOMPERIDONE IN CAP SULE DOSAGE FORM BY UPLC
Department of Pharmaceutical Analysis Page 102
Table 7.10: Robustness observation of Domperidone
SL.
NO PARAMETER CONDITION
RETENTION
TIME
(min)
AREA THEORETICAL
PLATES (USP) ASYMMETRY
1
Wavelength
variation
286 nm 0.602 146223 2240 1.71
288 nm 0.598 145852 2249 1.7
290 nm 0.602 144409 2276 1.58
% RSD -- 0.66 -- --
2
Flow Rate
0.375ml
/min 0.657 146213 2228 1.59
0.400ml
/min 0.598 145852 2249 1.7
0.425ml
/min 0.552 143529 2254 1.64
% RSD -- 1.00 -- --

METHOD DEVELOPMENT AND VALIDATION FOR THE SIMULTANE OUS ESTIMATION OF ILAPRAZOLE AND DOMPERIDONE IN CAP SULE DOSAGE FORM BY UPLC
Department of Pharmaceutical Analysis Page 103
Table 7.11: Robustness observation of Ilaprazole
SL.
NO PARAMETER CONDITION
RETENTION
TIME
(min)
AREA THEORETICAL
PLATES (USP) ASYMMETRY
1 Wavelength
variation
286 nm 2.082 313376 2570 1.85
288 nm 2.072 306090 2589 1.85
290 nm 2.062 315859 2536 1.84
% RSD -- 1.63 -- --
2
Flow Rate
0.375ml
/min 1.985 309729 2265 1.8
0.400ml
/min 2.072 306090 2589 1.85
0.425ml
/min 2.097 303132 2598 1.94
% RSD -- 1.08 -- --
Acceptance Criteria: % RSD ≤ 2
Theoretical plates (USP) ≥ 2000
Asymmetry ≤ 2
Report:
The robustness was tested by changing the wavelength and flow rate in the chromatographic
parameters. It has been found that change in flow rate leads to little change in retention time.
The percentage RSD for wavelength variation of Domperidone and Ilaprazole was found to
0.66% and 1.63% respectively.
The percentage RSD for flow rate variation of Domperidone and Ilaprazole was found to
1.00% and 1.08% respectively.

METHOD DEVELOPMENT AND VALIDATION FOR THE SIMULTANE OUS ESTIMATION OF ILAPRAZOLE AND DOMPERIDONE IN CAP SULE DOSAGE FORM BY UPLC
Department of Pharmaceutical Analysis Page 104
RESULTS
AND DISCUSSION
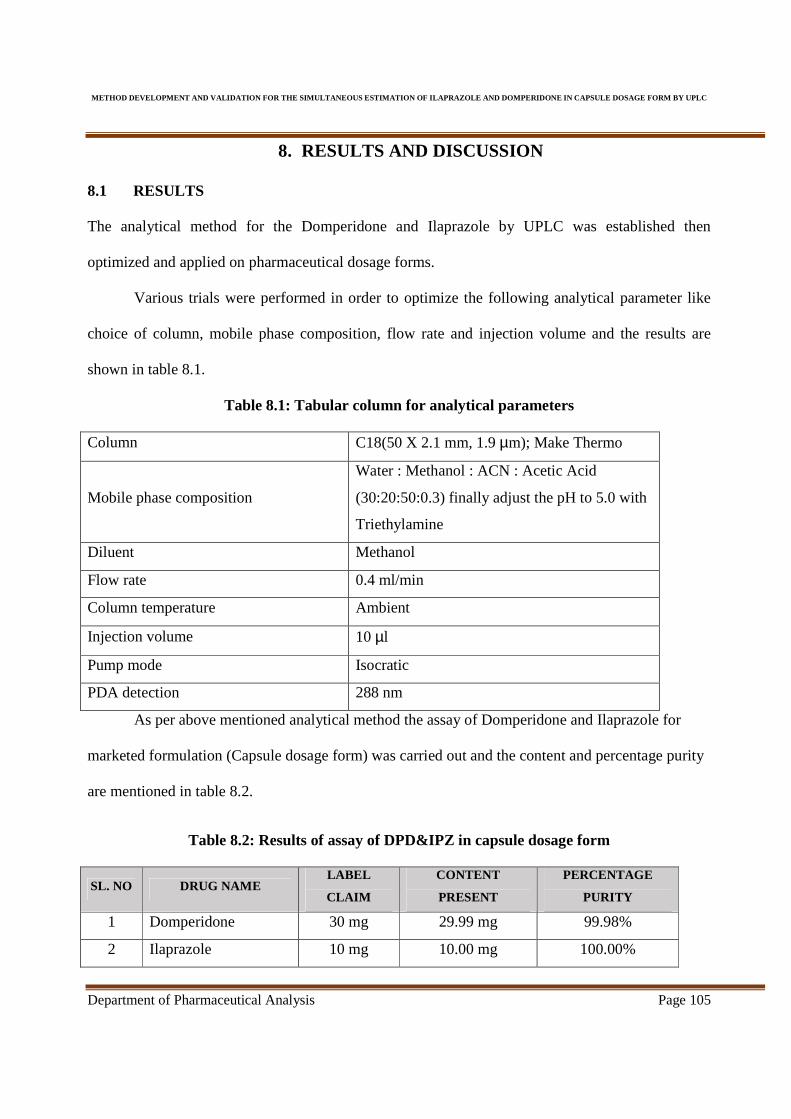
METHOD DEVELOPMENT AND VALIDATION FOR THE SIMULTANE OUS ESTIMATION OF ILAPRAZOLE AND DOMPERIDONE IN CAP SULE DOSAGE FORM BY UPLC
Department of Pharmaceutical Analysis Page 105
8. RESULTS AND DISCUSSION
8.1 RESULTS
The analytical method for the Domperidone and Ilaprazole by UPLC was established then
optimized and applied on pharmaceutical dosage forms.
Various trials were performed in order to optimize the following analytical parameter like
choice of column, mobile phase composition, flow rate and injection volume and the results are
shown in table 8.1.
Table 8.1: Tabular column for analytical parameters
Column C18(50 X 2.1 mm, 1.9 µm); Make Thermo
Mobile phase composition
Water : Methanol : ACN : Acetic Acid
(30:20:50:0.3) finally adjust the pH to 5.0 with
Triethylamine
Diluent Methanol
Flow rate 0.4 ml/min
Column temperature Ambient
Injection volume 10 µl
Pump mode Isocratic
PDA detection 288 nm
As per above mentioned analytical method the assay of Domperidone and Ilaprazole for
marketed formulation (Capsule dosage form) was carried out and the content and percentage purity
are mentioned in table 8.2.
Table 8.2: Results of assay of DPD&IPZ in capsule dosage form
SL. NO DRUG NAME LABEL
CLAIM
CONTENT
PRESENT
PERCENTAGE
PURITY
1 Domperidone 30 mg 29.99 mg 99.98%
2 Ilaprazole 10 mg 10.00 mg 100.00%

METHOD DEVELOPMENT AND VALIDATION FOR THE SIMULTANE OUS ESTIMATION OF ILAPRAZOLE AND DOMPERIDONE IN CAP SULE DOSAGE FORM BY UPLC
Department of Pharmaceutical Analysis Page 106
Table 8.3:Results of Validation Parameters
Validation
Parameter Acceptance Criteria
Observation Remarks
DPD IPZ
Specificity
The peaks of diluent and excipients
should not interfere with the main peak
and peak of standard and sample should
be identical with near retention time.
Complies Complies -
System
Suitability
Asymmetry NMT 2.0 1.69 1.82
Complies Theoretical plates NMT 2000 2264.80 2620
%RSD of area NMT 2.0 0.381 0.388
Linearity Correlation Coefficient NLT 0.997 0.999 0.999 Complies
Accuracy
The % recovery at each spike level shall
be NLT 98.0% and NMT 102.0% of the
added amount.
99.59-99.92% 99.04-99.34%
Complies
% RSD of each level should be NMT
2.0
Average %
RSD = 0.05
Average %
RSD = 0.07
Precision
The % RSD of area for the six
determinations shall be NMT 2.0. 0.01 0.01
Complies The % RSD of assay for the six
determinations shall be NMT 2.0. 0.02 0.02
LOD
(µµµµg/ml) Not specified 0.006 0.001 Suitable
LOQ
(µµµµg/ml) Not specified 0.018 0.004 Suitable
Robustness Theoretical plates (USP) ≥ 2000 Complies Complies
- Asymmetry ≤ 2 Complies Complies
METHOD DEVELOPMENT AND VALIDATION FOR THE SIMULTANE OUS ESTIMATION OF ILAPRAZOLE AND DOMPERIDONE IN CAP SULE DOSAGE FORM BY UPLC
Department of Pharmaceutical Analysis Page 107
8.2 DISCUSSION
A simple and rapid RP-UPLC method was developed for the simultaneous estimation of
Domperidone and Ilaprazole in pharmaceutical dosage form. For the analysis, the mobile phase
selected consists of mixture of Water : Methanol : ACN : Acetic Acid (30:20:50:0.3)and finally
pH was adjusted to 5.0 with Triethylamine . Column suitable for this method was found C18 (50 X
2.1 mm, 1.9 µm); Make Thermo.
From the spectral characteristic, the detection was carried out by using PDA detector at 288
nm. The retention time is for DPD&IPZ was found 0.598 min&2.072 min respectively. The
asymmetry factor was found to be 1.70 and 1.85, which indicates symmetrical nature of the peak.
Resolution (USP) between two peaks was 16.81 which will satisfy the acceptance criteria.
The specificity was performed with respect blank and identification and the chromatogram
showed was identical with near retention time with standard.
The System suitability parameter such as retention time, number of theoretical plates, and
asymmetry factor, % RSD of area were recorded and found to be within limits mentioned in table
7.1 & 7.2.
With the optimized conditions, linearity range was fixed as (80-120) % i.e. (80-120) µg/ml
of DPD and (8-12) µg/ml of IPZ. Linearity range was evaluated by the visual inspection of plot of
peak area as a function of analyte concentration and the corresponding calibration graphs were
shown in figure 6.15 & 6.16and results are shown in table 6.3. From the linearity studies, the
specified concentration range was determined. It was observed that Domperidone and Ilaprazole
were linear in the range of (9.79-14.68) µg/ml and (3.20-4.81) µg/ml respectively for the target
concentrations. The regression equation of Domperidone and Ilaprazole for concentration over its

METHOD DEVELOPMENT AND VALIDATION FOR THE SIMULTANE OUS ESTIMATION OF ILAPRAZOLE AND DOMPERIDONE IN CAP SULE DOSAGE FORM BY UPLC
Department of Pharmaceutical Analysis Page 108
peak area ratio was found to be y=11973x-1259(R² = 0.999) and y=73371x+8822(R² = 0.999)
where y is the peak area ratio and x is the concentration of DPD&IPZ in µg/ml.
The validation of proposed method was verified by recovery (spiking) studies. The
percentage recovery range was found between 99.59-99.92% for DPD and 99.04-99.34% for IPZ.
This is a good index of accuracy, specificity and repeatability of the method. The results were
tabulated in table 7.6 & 7.7. All parameters including flow rate, temperature, detection, wavelength
and sensitivity are maintained constant throughout the procedure.
The validation of the proposed method was verified by method precision where repeatability
study was performed by preparing six samples as per the test method of a single batch representing
the 100% of test concentration. The %RSD of assay and area for method precision were calculated
and the data was tabulated and shown in table 7.8.
LOD and LOQ were calculated from the linearity parameter data. The results were tabulated
and shown in table 7.9.
Robustness studies were made by varying wavelength (±2 nm) and flow rate (±0.025
ml/min) and the results were mentioned in table 7.10 & 7.11.
METHOD DEVELOPMENT AND VALIDATION FOR THE SIMULTANE OUS ESTIMATION OF ILAPRAZOLE AND DOMPERIDONE IN CAP SULE DOSAGE FORM BY UPLC
Department of Pharmaceutical Analysis Page 109
SUMMARY AND
CONCLUSION
METHOD DEVELOPMENT AND VALIDATION FOR THE SIMULTANE OUS ESTIMATION OF ILAPRAZOLE AND DOMPERIDONE IN CAP SULE DOSAGE FORM BY UPLC
Department of Pharmaceutical Analysis Page 110
8. SUMMARY & CONCLUSION
8.1 SUMMARY
From the literature review it was found that no UPLC method was carried out for the
simultaneous determination of Domperidone and Ilaprazole in capsule dosage form. Various trials
were conducted by varying the wavelength, column, mobile phase, and flow rate and injection
volume and the parameters for UPLC method for the determination of DPD and IPZcapsule dosage
form were optimized.
The scope of the present work is to expand the optimization of the chromatographic
conditions and to develop new RP-UPLC method. A series of mobile phases were tried and among
the various mobile phase comprising of mixture of Water : Methanol : ACN : Acetic Acid
(30:20:50:0.3) (pH 5.0, adjusted with Triethylamine) was chosen as an ideal mobile phase, since
it a good resolution and peak shapes with perfect optimization. The detection was carried out at 288
nm by using PDA detector. The flow rate was optimized at 0.4 ml/min.
The Specificity of DPD and IPZ were shown in Chromatograms. There was no interference
in this method and good separation between all peaks. It means no impurity was interfered and also
reveals that commonly used excipients and additives present in the capsule dosage form were not
interfering in the proposed methods. It was also found that the retention time of sample DPD and
IPZ were identical corresponding to standard DPD and IPZ.
The system suitability was found within the limits. The % RSD for DPD and IPZ were
found 0.381% and 0.388% respectively. Theoretical plates, resolution and Asymmetry factor also
found suitable.

METHOD DEVELOPMENT AND VALIDATION FOR THE SIMULTANE OUS ESTIMATION OF ILAPRAZOLE AND DOMPERIDONE IN CAP SULE DOSAGE FORM BY UPLC
Department of Pharmaceutical Analysis Page 111
The linearity obtained from calibration graph shows that DPD and IPZ were linear in the
range of (9.79-14.68) µg/ml and (3.20-4.81) µg/ml respectively. Correlation coefficient in the range
of (9.79-14.68)µg/ml for DPD and (3.20-4.81) µg/ml for IPZ were calculated and found 0.999 and
0.999 respectively.
In assay of marketed formulation the percentage purity of DPD and IPZ were found 102.53
% and 100.00% respectively which indicate that the method can be used to determine the
percentage purity of Domperidone and Ilaprazole in capsule dosage form.
Accuracy study was carried out by spiking method where calculated known amount of standard
were added for different Percentage levels (100% - 130%). The average percentage recovery for
DPD and IPZ was found to be 99.75% and 99.20% respectively. The average percentage RSD for
DPD and IPZ was found to be 0.05% and 0.07% respectively.
The limits of % recovery studies are in the range of 98-102% and the results found that
recovery values of pure drugs from the solution were as well, which indicates that the method is
accurate.
Method Precision was assessed by repeatability tests (6 determinations at the level of 100%
concentration). The % RSD for the area and assay of DPD found to be 0.01 and 0.02 respectively.
The % RSD for the area and assay of IPZ was found to be 0.01 and 0.2 respectively.
Hence method is precise for DPD and IPZ. The complete data regarding the precision was shown in
table11.
Based on standard deviation response (standard deviation of y intercept obtained from the
calibration curve) and slope, the Limit of detection (LOD) and Limit of Quantitation (LOQ) were
calculated for DPD and IPZ. The Limit of detection (LOD) of DPD and IPZ were found 0.006µg/ml
METHOD DEVELOPMENT AND VALIDATION FOR THE SIMULTANE OUS ESTIMATION OF ILAPRAZOLE AND DOMPERIDONE IN CAP SULE DOSAGE FORM BY UPLC
Department of Pharmaceutical Analysis Page 112
and 0.001µg/ml respectively. And the Limit of Quantitation (LOQ) of DPD and IPZ were found
0.018µg/ml and 0.004µg/ml respectively.
Robustness of the method was checked by small deliberate changes in the method
parameters such as wavelength (±2nm) and flow rate (±0.2ml) but these changes did not affect the
chromatographic parameter and the method results which indicate that the method is robust.
8.2 CONCLUSION
Thus the proposed method was found to be simple, accurate, precise and rapid for
simultaneous estimation of Domperidone and Ilaprazole in pharmaceutical capsule dosage form and
could be used for routine analysis. All the parameters meet the criteria of ICH guidelines for
method validation and found to be simple, sensitive, accurate and precise. It can therefore be
concluded that the reported method is more economical and can find practical application for
simultaneous analysis of the Domperidone (DPD) and Ilaprazole (IPZ) in their combined dosage
forms both in research and quality control laboratories

METHOD DEVELOPMENT AND VALIDATION FOR THE SIMULTANE OUS ESTIMATION OF ILAPRAZOLE AND DOMPERIDONE IN CAP SULE DOSAGE FORM BY UPLC
Department of Pharmaceutical Analysis Page 113
BIBLIOGRAPHY
METHOD DEVELOPMENT AND VALIDATION FOR THE SIMULTANE OUS ESTIMATION OF ILAPRAZOLE AND DOMPERIDONE IN CAP SULE DOSAGE FORM BY UPLC
Department of Pharmaceutical Analysis Page 114
9. BIBLIOGRAPHY
1. Kasture A.V, Wadodkar S.G, Mahadik K.R, and More H.N. Textbook of Pharmaceutical
Analysis – II, NiraliPrakashan, 13th Edn, 2005, pp.47-56 .
2. Chatwal GR, Anand SK. Instrumental methods of chemical Analysis, 5thedition, Himalaya
Publishing House, 2007, pp.2.566.
3. D.A. Skoog, F.J. Holler and T.A. Nieman, Principles of Instrumental Analysis, 5th edition,
Brooks Cole, 1997, pp 401.
4. Nolting B. Methods in Modern Biophysics, 3rd ed., © Springer-Verlag Berlin Heidelberg
2009.
5. Beckett A.H. and Stanlake J.B., Practical Pharmaceutical Chemistry, Part 2, CBS Publishers
and Distributors, 4thedition, 2002, pp.157-174.
6. Hokanson GC. A life cycle approach to the validation of analytical methods during
pharmaceutical product development. part II: Changes and the need for additional validation.
Pharm Tech.1994; pp. 92-100.
7. Jerkovich AD, Mellors JS and Jorgenson JW. LCGC, 21(7), 2003; 660-611.
8. Wu N, Lippert JA and Lee ML. J. Chromatogr., A, 2001, 1-12,911.
9. T.Sunil Kumar Reddy, G. Balammal and A. Saravana Kumar Ultra performance liquid
chromatography: an introduction and review. Int J of Pharm Res & Ana Vol 2 Issue 1: 2012
24-31. 2249-7781.
10. S. V.Chopade, Dr.V.R.Patil, Introduction to new chromatography technique - UPLC,
pharmatutor-art-1206, : 2011-12-27
11. Dr.S. Ravi Shankar, Textbook of Pharmaceutical Analysis. Rx Publications, Tirunelveli. 4th
Edition; pp.17/14-17/18.
METHOD DEVELOPMENT AND VALIDATION FOR THE SIMULTANE OUS ESTIMATION OF ILAPRAZOLE AND DOMPERIDONE IN CAP SULE DOSAGE FORM BY UPLC
Department of Pharmaceutical Analysis Page 115
12. Prasanna Kumar Pradhan ,DhavalMavani, Mayank Patel, NaimishRaiyani, UmeshUpadhyay.
Journal of Drug Delivery & Therapeutics; 2014, 4(4). 43-48.
13. Green JM.A practical guide to analytical method validation. Analytical chemistry.1996;
305A-09A
14. Michael E, Schartz I.S, Krull. Analytical method Development and validation. 2004:.25-46.
Resilience
15. FDA, ICH-Q2 (R1): Validation Of Analytical Procedures: Text And Methodology, Vol. 60,
U S Food And Drug Administration, Washington, DC, USA, 1995.
16. https://en.wikipedia.org/wiki/Ilaprazole
17. https://en.wikipedia.org/wiki/Domperidone
18. G. Suneetha, P. Venkateswarlu, P.S.S. Prasad and P. Murali Krishna. Asian Journal of
Chemistry; Vol. 25, No. 7 (2013), 3989-3992.
19. SnehaJansari K, Nirav Patel B, Parag Patel R, Nikita Patel N. Development and validation
of stability indicating method for simultaneous estimation of Ciprofloxacin HCL and
Tinidazole using RP-UPLC method. IOSR J Pharm. 2012 Oct; 2(5): 12-19.
20. C Rambabu, M Sarat, P Murali Krishna. Development and Validation of RP-UPLC method
for simultaneous estimation of Abacavir sulphate and Lamivudine in Combined tablet
dosage form. Int J of Chemtec Res. 2012 Sep; 4(3): 939-944.
METHOD DEVELOPMENT AND VALIDATION FOR THE SIMULTANE OUS ESTIMATION OF ILAPRAZOLE AND DOMPERIDONE IN CAP SULE DOSAGE FORM BY UPLC
Department of Pharmaceutical Analysis Page 116
21. P. Giriraj and T. Sivakkumar. Development and validation of a rapid-chemo metrics assisted
RP-HPLC method with PDA detection for the simultaneous estimation of domperidone and
ilaprazole in pure and pharmaceutical formulation. Scholars Research Library, Der
Pharmacia Lettre, 2014, 6 (4):376-385
22. Z. N. Patel*, P. B. Patel, J. D. Modi, N. N. Parikh, H. M. Chaudhari, P. K. Pradhan, U. M.
Upadhyay.Pharma Science Monitor An International Journal Of Pharmaceutical Sciences.
Pharma Science Monitor 5(2), Apr-Jun 2014.
23. UmaduraiM, and VijayaNagarajan. Development and validation of a rapid UPLC assay
method for the simultaneous estimation of Paroxetine and Clonazepam in tablet dosage
form. Int J Chem Pharm Sci. 2014 Dec; 5(4): 42-47.
24. Sevak Manan R, Patel Nirav B, Patel Kamlesh N, Desai Hemant T. Development &
validation of RP-UPLC method for simultaneous estimation of ofloxacin and ornidazole in
their combine dosage form including stress study. IOSR J Appli Chem. 2014 Sep; 7(9): 32-
35.
25. ParamasivamBalan, NagappanKannappan. Development and validation of stability-
indicating RP-UPLC method for simultaneous estimation of thiocolchicoside and
aceclofenac in combined dosage form. Int Cur Pharm J. 2014 Jun; 3(7): 296-300.

METHOD DEVELOPMENT AND VALIDATION FOR THE SIMULTANE OUS ESTIMATION OF ILAPRAZOLE AND DOMPERIDONE IN CAP SULE DOSAGE FORM BY UPLC
Department of Pharmaceutical Analysis Page 117
26. R.A Tamboli, V.C. Chauhan, M.M. Pathan, S.K. Tirgar, D.A. Shah, R.R.
Parmar.Development And Validation Of Rp-Hplc Method For Simultaneous Estimation Of
Ilaprazole And Domperidone In Pharmaceutical Dosage Form. Pharmatutor- Pharmacy
Infopedia.
27. Pradeep G. Shelke, Anil V. Chandewar, Anil P. Dewani, Alok S. Tripathib, Ravindra L.
Bakal. Validated Stability-indicating assay method for determination of Ilaprazole in bulk
drug and tablets by high performance liquid chromatography. Eurasian Journal Analytical
Chemistry 10(1): 1-9, 2015
28. Rashmi R. Yadav, Darshil B. Shah* and Dilip G. Maheshwari. Analytical method for
determination of proton pump inhibitors in bulk and in
different dosage forms. Journal of Chemical and Pharmaceutical Research, 2015, 7(10):368-
378.
29. Kamala Govinda Rao, Vadrevu Sowjanya, Haripriya Malipeddi. Method Development and
Validation for Simultaneous Estimation of Omeprazole and Domperidone by RP-HPLC.
Asian Journal of Pharmaceutical Analysis. Year : 2015, Volume : 5, Issue : 4 First page : (
195) Last page : ( 205)