Embed Size (px)
Citation preview
Estimation of Friction Coefficient Using Smart Strand
Se-Jin Jeon1),*, Sung Yong Park2), Sang-Hyun Kim1), Sung Tae Kim2), and YoungHwan Park2)
(Received June 19, 2015, Accepted August 18, 2015, Published online September 11, 2015)
Abstract: Friction in a post-tensioning system has a significant effect on the distribution of the prestressing force of tendons in
prestressed concrete structures. However, attempts to derive friction coefficients using conventional electrical resistance strain
gauges do not usually lead to reliable results, mainly due to the damage of sensors and lead wires during the insertion of strands
into the sheath and during tensioning. In order to overcome these drawbacks of the existing measurement system, the Smart Strand
was developed in this study to accurately measure the strain and prestressing force along the strand. In the Smart Strand, the core
wire of a 7-wire strand is replaced with carbon fiber reinforced polymer in which the fiber Bragg grating sensors are embedded. As
one of the applications of the Smart Strand, friction coefficients were evaluated using a full-scale test of a 20 m long beam. The test
variables were the curvature, diameter, and filling ratio of the sheath. The analysis results showed the average wobble and
curvature friction coefficients of 0.0038/m and 0.21/radian, respectively, which correspond to the middle of the range specified in
ACI 318-08 in the U.S. and Structural Concrete Design Code in Korea. Also, the accuracy of the coefficients was improved by
reducing the effective range specified in these codes by 27–34 %. This study shows the wide range of applicability of the
developed Smart Strand system.
Keywords: friction coefficient, fiber Bragg grating sensor, prestressing tendon, strand, sheath, duct,
prestressed concrete structure.
1. Introduction
The calculation and control of elongation and the pre-stressing force during tensioning of tendons are of primaryimportance in post-tensioned concrete structures. In thisrespect, the friction that occurs through the interactionbetween strands and a sheath during tensioning in a post-tensioning system has a significant effect on the distributionof prestressing force and elongation of tendons. Underesti-mation or overestimation of the friction coefficients can leadto unexpected structural behavior in terms of camber,deflection, and stress distribution (ACI 2014). Although therelevant design codes and specifications recommend that thefriction coefficients be experimentally determined (ACI2014; KCI 2012), the set-up of test specimens and mea-surement of forces or strains of tendons required to obtainthe coefficients are not easy to carry out. Furthermore, theaccuracy of the coefficients is not always guaranteedbecause of a number of variables affecting the coefficientswhile testing. Therefore, the friction coefficients that are
specified in design codes and specifications are still referredto frequently. However, the coefficients show a wide rangeof differences depending on the provisions, and are some-times expressed as a range rather than as a specific value.This has caused some confusion and trial-and-error prac-tices for designers and constructors, and has led to theinconsistent use of friction coefficients. An acceptable errorlimit of ±5 or ±7 % of the jacking force between themeasured value in a jack and the calculated value from theelongation of tendons (AASHTO 2014; ACI 2014) may stillprovide a source of discrepancy from the original calcula-tion sheet in the stress distribution of concrete as well astendons.In order to reasonably determine the friction coefficients, a
number of studies have been performed, but a standardmethod has not yet been established (Gupta 2005; Jeon et al.2009; Jeung et al. 2000; Kitani and Shimizu 2009; Moonand Lee 1997). It is found that in each method, someassumptions have been made and that each method dependson inaccurate or incomplete data. In particular, attemptsmade to derive friction coefficients using conventionalelectrical resistance strain gauges do not seem to lead toreliable results, mainly due to the damage of sensors andlead wires during the insertion of strands into a sheath andduring tensioning as well as the difficulty of gauge instal-lation on a strand. Although a load cell can be installed onthe dead end of the test specimen in the opposite side of thelive end that is subjected to jacking, the load cell can onlyprovide additional information on the prestressing force at
1)Department of Civil Systems Engineering, Ajou
University, Suwon-si, Gyeonggi-do 443-749, Korea.
*Corresponding Author; E-mail: [email protected])Structural Engineering Research Institute, Korea
Institute of Civil Engineering and Building Technology,
Goyang-si, Gyeonggi-do 411-712, Korea.
Copyright � The Author(s) 2015. This article is published
with open access at Springerlink.com
International Journal of Concrete Structures and MaterialsVol.9, No.3, pp.369–379, September 2015DOI 10.1007/s40069-015-0112-9ISSN 1976-0485 / eISSN 2234-1315
369

the dead end, which is not sufficient to determine the exactdistribution of prestressing force required to derive reliablefriction coefficients.In order to overcome these drawbacks of the existing
measurement system, the Smart Strand with the embeddedfiber Bragg grating sensors was developed in this study toaccurately measure the strain and prestressing force alongthe strand (KICT 2013; Kim et al. 2015). As one of theapplications of the Smart Strand, friction coefficients wereevaluated using a full-scale test of a 20 m long beam. Theobtained friction coefficients were compared with thosespecified in current provisions for verification and, as aresult, several improvements were proposed.
2. Friction Coefficients
2.1 Friction in Post-tensioning SystemWhile the prestressing tendons are tensioned using a jack,
the loss of prestress occurs along the tendons due to thefriction between the tendons and the sheath in a post-ten-sioning system. Figure 1 demonstrates two major types offriction. Curvature friction is induced at the curved section ofa sheath, where the tendons come into contact with thesheath during tensioning. On the other hand, wobble frictionoccurs even in a straight sheath due to the unintendeddeformation of the sheath during handling or casting ofconcrete, although the sheath is supported at a certaininterval before casting.The predictive equation of the prestressing force as
affected by the friction can be derived as shown in Eq. (1)(Nilson 1987).
Px1 ¼ Px2e� laþklð Þ ð1Þ
where Px1 and Px2 are the prestressing forces at the points ofx1 and x2 on a tendon, respectively, with x2 closer to thetensioning point, l is the curvature friction coefficient, k isthe wobble friction coefficient, a is the variation of anglebetween x1 and x2, and l is the distance between x1 and x2.
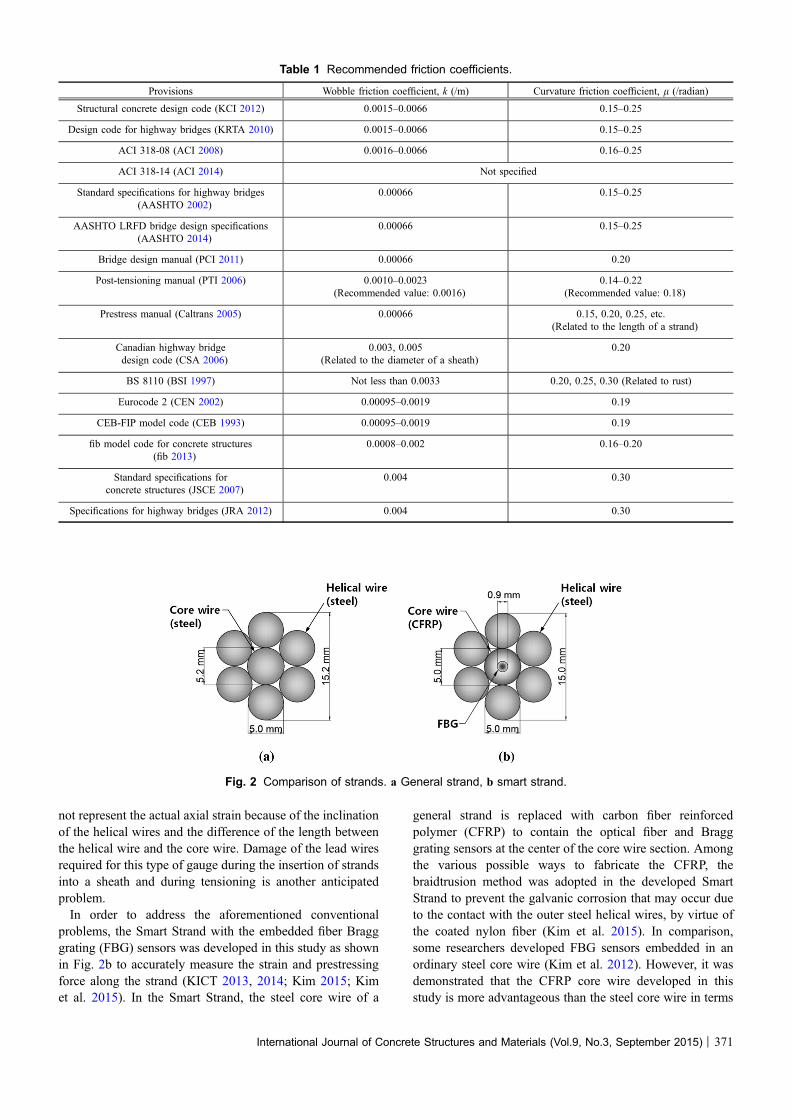
2.2 Friction Coefficients in ProvisionsThe friction coefficients specified in various codes, spec-
ifications, and manuals, etc. are summarized and comparedin Table 1. It is noted that some provisions provide differentfriction coefficients according to the type and surface con-dition of the prestressing steel and sheath. Although Table 1represents the case of strands in a galvanized metal sheaththat is most frequently used worldwide, it still shows a widerange of variation of the values from provision to provision,and even in a single provision. For the wobble friction
coefficient, the lowest value is 0.00066 as specified in sev-eral American provisions (AASHTO 2002; AASHTO 2014;Caltrans 2005; PCI 2011), whereas the highest value is0.0066 as presented in the Korean design codes (KCI 2012;KRTA 2010) and the previous ACI 318 code (ACI 2008).The difference is as much as ten times. On the other hand,most of the curvature friction coefficients fall into the rangeof 0.15–0.25, with the recommended value of around 0.20,except for the exceptionally high value specified in theJapanese specifications (JRA 2012; JSCE 2007).Therefore, a number of attempts have been made to
develop more reasonable friction coefficients. However, inseveral studies, one of the two types of friction coefficientswas assumed, while the other friction coefficient was eval-uated (Kitani and Shimizu 2009; Moon and Lee 1997); thisinvolves an intrinsic inaccuracy that is strongly affected bythe initial assumption of the value of a friction coefficient.The errors that may be induced by this type of methodologywere analyzed in some studies (Park and Gil 2004; Park andKang 2003). Some studies referred to the strains measuredby the conventional electrical resistance strain gaugesattached to the surface of a strand (Jeung et al. 2000). It isgenerally accepted, however, that the reliability of the strainsobtained by this method is somewhat questionable due to anumber of sources of uncertainty and inaccuracy. Gupta(2005) developed a technique to measure the prestressingforce at any point of a strand using a tension tester based onthe relationship between the lateral deflection and tension ofthe strand. However, it may be regarded that this methoduses an indirect measurement of tension, which possiblyinvolves some errors. Therefore, a more reliable methodol-ogy is required to derive realistic friction coefficients interms of acquirement of the actual strain distribution of astrand and evaluation of the friction coefficients using themeasured data.
3. Principle of Smart Strand
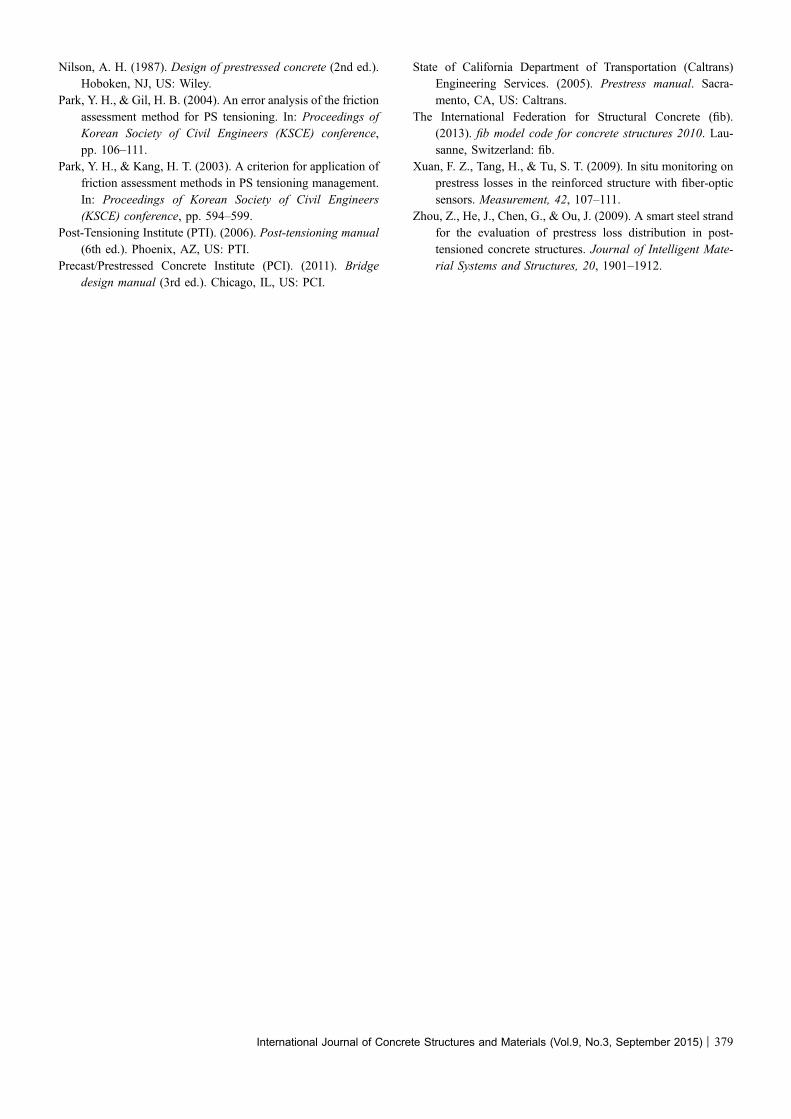
Usually, 7-wire strands with a nominal diameter of 12.7 or15.2 mm are used as prestressing tendons in prestressedconcrete (PSC) structures (ASTM 2012; KATS 011). Theseprestressing tendons consist of one core wire and six outerhelical wires made of steel as shown in Fig. 2a. When thestrain distribution along a strand needs to be measured, inmost cases, the only possibility has been to attach the usualelectrical resistance strain gauges on the helical wiresexposed outside; although it is desirable to install sensors inthe straight core wire to minimize the damage caused by thecontact between the strands and between the strand and thesheath. Moreover, the strain measured from this gauge does
Fig. 1 Friction in a post-tensioning system.
370 | International Journal of Concrete Structures and Materials (Vol.9, No.3, September 2015)
not represent the actual axial strain because of the inclinationof the helical wires and the difference of the length betweenthe helical wire and the core wire. Damage of the lead wiresrequired for this type of gauge during the insertion of strandsinto a sheath and during tensioning is another anticipatedproblem.In order to address the aforementioned conventional
problems, the Smart Strand with the embedded fiber Bragggrating (FBG) sensors was developed in this study as shownin Fig. 2b to accurately measure the strain and prestressingforce along the strand (KICT 2013, 2014; Kim 2015; Kimet al. 2015). In the Smart Strand, the steel core wire of a
general strand is replaced with carbon fiber reinforcedpolymer (CFRP) to contain the optical fiber and Bragggrating sensors at the center of the core wire section. Amongthe various possible ways to fabricate the CFRP, thebraidtrusion method was adopted in the developed SmartStrand to prevent the galvanic corrosion that may occur dueto the contact with the outer steel helical wires, by virtue ofthe coated nylon fiber (Kim et al. 2015). In comparison,some researchers developed FBG sensors embedded in anordinary steel core wire (Kim et al. 2012). However, it wasdemonstrated that the CFRP core wire developed in thisstudy is more advantageous than the steel core wire in terms
Table 1 Recommended friction coefficients.
Provisions Wobble friction coefficient, k (/m) Curvature friction coefficient, l (/radian)
Structural concrete design code (KCI 2012) 0.0015–0.0066 0.15–0.25
Design code for highway bridges (KRTA 2010) 0.0015–0.0066 0.15–0.25
ACI 318-08 (ACI 2008) 0.0016–0.0066 0.16–0.25
ACI 318-14 (ACI 2014) Not specified
Standard specifications for highway bridges(AASHTO 2002)
0.00066 0.15–0.25
AASHTO LRFD bridge design specifications(AASHTO 2014)
0.00066 0.15–0.25
Bridge design manual (PCI 2011) 0.00066 0.20
Post-tensioning manual (PTI 2006) 0.0010–0.0023(Recommended value: 0.0016)
0.14–0.22(Recommended value: 0.18)
Prestress manual (Caltrans 2005) 0.00066 0.15, 0.20, 0.25, etc.(Related to the length of a strand)
Canadian highway bridgedesign code (CSA 2006)
0.003, 0.005(Related to the diameter of a sheath)
0.20
BS 8110 (BSI 1997) Not less than 0.0033 0.20, 0.25, 0.30 (Related to rust)
Eurocode 2 (CEN 2002) 0.00095–0.0019 0.19
CEB-FIP model code (CEB 1993) 0.00095–0.0019 0.19
fib model code for concrete structures(fib 2013)
0.0008–0.002 0.16–0.20
Standard specifications forconcrete structures (JSCE 2007)
0.004 0.30
Specifications for highway bridges (JRA 2012) 0.004 0.30
Fig. 2 Comparison of strands. a General strand, b smart strand.
International Journal of Concrete Structures and Materials (Vol.9, No.3, September 2015) | 371

of mechanical property and the convenience in the fabrica-tion and embedment of the optical fibers (KICT 2013). Onthe other hand, a different type of FRP and FBG sensingtechnique to that used in this study was employed in anotherstudy (Zhou et al. 2009).Detail of the principle of the FBG sensor can be found in
many references (Jang and Yun 2009; Kim et al. 2012;Nellen et al. 1999). FBG sensors have widely been usedrecently due to a number of advantages over the conven-tional sensing technique using electrical resistance, such asnon-sensitivity to electromagnetic interference and tolerancefor extremely low or high temperatures, etc. When lightpenetrates into an optical fiber, each Bragg grating embed-ded in the optical fiber reflects light waves that have a par-ticular wavelength and transmits all other light waves. Byanalyzing the reflected light waves, the strain at the point ofeach Bragg grating can be obtained.The mechanical properties of the CFRP core wire and the
developed Smart Strand were verified through a number ofspecimen tests. Based on the stress–strain relationship curvesof the Smart Strand, in addition to the sensing purposes, itwas confirmed that the Smart Strand can be used even forstructural purposes under service load and ultimate loadconditions in most cases (KICT 2014; Kim 2015).
4. Full-Scale Test for Friction Coefficient
4.1 Test Specimen and VariablesTest variables were established to include various cases of
PSC beams or girders constructed in practice. Test variables
of the full-scale test of a PSC beam for evaluating frictioncoefficients are the diameter, curvature, and filling ratio ofsheaths as shown in Table 2. Seven, twelve and nineteenstrands are inserted into the sheath with 66, 85, and 100 mmdiameters, respectively, in usual cases. However, the effectof the filling ratio on the friction coefficients was also takeninto consideration by intentionally reducing the number ofstrands. In addition to the parabolically curved sheaths,straight sheaths were also arranged to separate the curvatureeffect from the wobble effect. The curvature shown inTable 2 does not refer to a mathematical curvature, but isdefined by the sag of a curved sheath divided by the spec-imen length. Minor lateral curvature, which is inevitablewhen arranging many sheaths at mid-span, was ignored. Thedegree of the curvature of sheaths was determined by takinginto account the ordinary curvature in PSC girder bridges,including box girders, and the intentionally increased cur-vature. Similar to an ordinary bonded post-tensioning sys-tem, the strands were not lubricated.Figure 3 shows the 20 m long full-scale test specimen,
where the height varies from 2.0 to 2.5 m to realize thelargest curvature with an economical use of concrete. Thespecified compressive strength of the specimen is 40 MPa,which is the same as that of the standard PSC girders used inKorea. Also, self-consolidating concrete with a slump flowof 600 mm was used to accommodate the casting work andto ensure complete compaction of concrete, even in the caseof congested sheaths and reinforcements.The tendons were tensioned at only one end with the
opposite end remaining as the dead end in order to increasefriction loss and thus to purposely highlight the friction
Table 2 Test variables.
Category Test variables Values
Sheath Diameter (mm) 66, 85, 100
Curvature (sag/length) 0 (straight), 0.0295, 0.0490, 0.0785
Material Galvanized metal
Strand Number 1, 7, 12, 13, 19
Nominal diameter (mm) 15.2
Ultimate strength (MPa) 1860
Lubrication Not applied
Fig. 3 Full-scale test specimen.
372 | International Journal of Concrete Structures and Materials (Vol.9, No.3, September 2015)

effect, although in practice, the tendons can also be ten-sioned at both ends. The jacking force per strand wasincreased by 20–30 MPa until it reached 180–200 kN,which nearly corresponds to the allowable tensile stressduring jacking (0.80fpu or 0.94fpy, where fpu: Ultimatestrength, and fpy: Yield strength) of the prestressing steelwith an ultimate strength of 1860 MPa (ACI 2014; KCI2012). A total of 13 Smart Strands were fabricated, wheresix strands have seven Bragg gratings (G1–G7 from deadend to live end) and the remaining seven strands have fiveBragg gratings (G1–G5 from dead end to live end) that areequally spaced along the length. Among the total number ofstrands in one sheath, Smart Strands occupied some portionand normal strands occupied the remaining portion. Thelocations of the Smart Strands in the holes of the anchorhead were determined so that various interactions related tothe friction (between strands and between the strands and asheath) can be accounted for. Figure 4 shows the arrange-ment of Smart Strands and normal strands in the case of theanchor head with 19 holes, corresponding to the sheath witha diameter of 100 mm and curvature of 0.0785 in Fig. 3. Thefigure also shows the sequence of work performed toinvestigate the effect of the filling ratio on frictioncoefficients.In addition to the FBG sensors in the Smart Strands, extra
measures were taken to complement or compare with thedata obtained by the FBG sensors. First, a load cell wasinstalled at the dead end to measure the total prestressingforce at that location. Second, electro-magnetic (EM) sensorswere installed immediately inside the jack, as shown inFig. 5a, to measure the individual jacking force of the
strands that reflects the jack loss (Cho et al. 2015). Third,electrical resistance gauges were attached to the strand sur-face corresponding to the selective locations of the FBGsensors. The dead end, i.e. the passive side of the strands,was realized by applying compressed grips as shown inFig. 5b instead of normal wedges, to ensure reuse of theSmart Strands by minimizing the damage that may possiblybe caused by the wedges. The optical fibers were connectedto lead wires and a data logger by using a fusion splice.
4.2 Test ResultsFigure 6 shows an example of the relationship between
jacking force and strains obtained in one of the 19 strands(strand A in Fig. 4) inserted in a sheath with a diameter of100 mm and curvature of 0.0785 from in Fig. 3. Strand A isan example of a Smart Strand with five Bragg gratings, whileseven gratings were also applied for some other SmartStrands. Because the strands were tensioned up to less thanthe allowable stress, the strains are within an elastic rangeand thus are almost linearly proportional to the jacking force.It can also be identified in Fig. 6 that the Smart Strands canbe utilized to check that the jacking force is correctlytransmitted through the tendons.The distribution of the prestressing force obtained at the
same Smart Strand as that shown in Fig. 6 is presented inFig. 7, where the values measured at the load cell, EMsensor, and jack are also indicated. The strains measured atthe Bragg gratings of a Smart Strand can be converted to theprestress at each grating by multiplying the modulus ofelasticity of the Smart Strand, and can further be convertedto the prestressing force by multiplying the cross sectional
Fig. 4 Arrangement of strands in an anchor head with 19 holes.
Fig. 5 Live and dead ends of test specimen. a Live end, b dead end.
International Journal of Concrete Structures and Materials (Vol.9, No.3, September 2015) | 373

area of the Smart Strand. However, the computation of theprestressing force from the strain of the core wire of a SmartStrand can further be refined by accounting for the twist ofhelical wires and the difference of the cross sectional areaand material property between the helical wires and the corewire as proposed in Eq. (2) (Cho et al. 2013; KICT 2013) inan analytical way. In a usual approximate calculation for anormal strand, Ep = 2 9 105 MPa and Ap = 138.7 mm2 areused to produce EpAp = 27,740 kN. On the other hand, therefined calculation for a Smart Strand using Eq. (2) results in(EpAp)smart = 26,007 kN.
P ¼ fcEp;cAp;c þ fhEp;hAp;h
� �ep ¼ EpAp
� �smart
ep ð2Þ
where P is the prestressing force at the location of a Bragggrating, ep is the strain measured at a Bragg grating of aSmart Strand, fc and fh are the correction factors for core wireand helical wires, respectively, Ep,c and Ep,h are the modulusof elasticity of core wire and helical wires, respectively, Ap,c
and Ap,h are the cross sectional area of core wire and helicalwires, respectively, and (EpAp)smart is the equivalent EpAp fora Smart Strand.It should be noted from Fig. 7 that the prestressing force
of each strand can be separately determined in the Smart
Strands and EM sensors in each load level (Lv. 1–Lv. 9),while only the averaged prestressing force in each strandcan be obtained in the jack and load cell system bydividing the total force by the number of strands. Thisimplies another advantage of the Smart Strands system; itcan individually predict the distribution of the prestressingforce of a specific strand. Therefore, the difference of thefriction coefficients of each strand can be evaluated in theSmart Strands system, which can be used to investigate thevariation of friction coefficients depending on the locationof a strand inside the sheath. This shows a clear contrast tothe conventional method where only the average frictioncoefficients can be derived inside a sheath using theelongation and jacking force measured at a jack, and theforce measured at a load cell installed at the dead end, ifavailable (Jeon et al. 2009). Also, it can be seen that thedifference in prestressing forces between the EM sensorand the jack refers to the amount of jack loss that occursdue to the friction inside the jack.
5. Evaluation of Friction Coefficients
5.1 MethodologyFriction coefficients can be determined by applying the
basic equation shown in Eq. (1) and the distribution ofprestressing force as presented, for example, in Fig. 7. In thisstudy, the friction coefficients were evaluated in two stepsfor sheaths with a specific diameter. First, the wobble frictioncoefficient was evaluated in the straight sheath. Since thevariation of angle (a) does not exist in the straight sheath, thewobble friction coefficient (k) can be obtained from twoprestressing forces (Px1 and Px2) that were arbitrarily selec-ted in a Smart Strand, judging from the form of Eq. (1), withthe term of la removed. The curvature friction coefficient(l) can then be evaluated from Eq. (1) by applying twoprestressing forces on a curved Smart Strand within a curvedsheath with the wobble friction coefficient maintained as thepreviously obtained value for the straight sheath of the samediameter.
Fig. 6 Jacking force–strain relationship.
Fig. 7 Distribution of prestressing force.
374 | International Journal of Concrete Structures and Materials (Vol.9, No.3, September 2015)

As can be expected, the friction coefficients obtained insuch a way vary depending on the two prestressing forceschosen. Therefore, a statistical approach is required to derivefriction coefficients that are more reliable. During the sta-tistical process, some of the friction coefficients may exhibitexceptionally high or low values when compared to theordinary range of the coefficients shown in Table 1. Thisbehavior can be attributed to the abnormal distribution ofprestressing force that can occur in a local region due to anexcessive twist of strands while inserting or jacking, or theinevitable irregularity of alignment of a sheath caused byinsufficient support combined with the casting pressure ofconcrete. Therefore, data filtering has been performed for aminority of these exceptional values based on the upper orlower limits of the friction coefficients shown in Table 1.The filtering was performed in two different ways and theresults are compared. The first case is based on the twoKorean design codes; Structural Concrete Design Code (KCI2012) and Design Code for Highway Bridges (KRTA 2010).Therefore, the wobble and curvature friction coefficients thatwere calculated outside the range of 0.0015–0.0066/m and0.15–0.25/radian, respectively, have been excluded from thestatistics. It can be identified that the values of frictioncoefficients of ACI 318-08 (ACI 2008) are almost identicalto those of the Korean design codes. In the second case, theentire provisions in Table 1 were accounted for and, as aresult, the effective range was extended to 0.00066–0.0066/mand 0.14–0.30/radian for the wobble and curvature frictioncoefficients, respectively.When Eq. (1) is used to evaluate the friction coefficients,
any two arbitrary prestressing forces measured at differentpoints can be adopted, regardless of where they are mea-sured among the Smart Strand, load cell, EM sensor, andjack. In this respect, two different approaches wereemployed in this study. First, two prestressing forces corre-sponding to the jack and one of the gratings in a SmartStrand were referred to. As mentioned previously, however,the prestressing force measured at the jack is only an averagevalue and does not represent the exact prestressing force ofthe strand under consideration. Furthermore, although fric-tion loss may also occur inside the jack and at the anchoragedevices, the jacking force does not include these losses.These are the sources that may lower the accuracy of theresulting friction coefficients. In order to cope with theseproblems, in the second method, two prestressing forcesobtained purely in two gratings of a Smart Strand wereemployed.In the above evaluation process of friction coefficients, the
accurate calculation of the distance and the variation of anglebetween two points is needed. The distance between twoarbitrary points of Bragg grating can be easily calculated, sincethe gratings are embedded at equal spaces along the strands.The variation of angle can be calculated by measuring theangle formed between two tangent lines drawn from the twograting points. In order to perform this calculation, the fol-lowing mathematical equation, Eq. (3) (Kreyszig 2011), forcalculating the length of a curve is required to inversely obtainthe horizontal distance, i.e. x coordinate, corresponding to the
grating point. The curved form of a sheath is assumed to be aparabola, as has frequently been assumed in design practice.
l ¼Z b
a
ffiffiffiffiffiffiffiffiffiffiffiffiffiffiffiffiffiffiffiffiffiffiffiffi1þ f 0ðxÞð Þ2
qdx ð3Þ
where l is the length of the partial curve of f(x) betweenx = a and x = b, and f(x) is the shape of a sheath assumedas a parabola.
5.2 Analysis ResultsThe results of the statistical analyses are presented in
Figs. 8 and 9 for wobble and curvature friction coefficients,respectively. In these figures, ‘jack-grating’ implies that thejacking force and prestressing force at a grating were usedfor analysis, while ‘grating-grating’ indicates that two pre-stressing forces obtained at two gratings were adopted. Also,‘Korean provisions’ and ‘entire provisions’ imply that thestatistical data were filtered based on the limit of the twoKorean design codes (KCI 2012; KRTA 2010) and entireprovisions shown in Table 1, respectively.The average wobble and curvature friction coefficients of
the cases shown in Figs. 8 and 9 were evaluated as 0.0038/mand 0.21/radian, respectively. Therefore, the wobble frictioncoefficient was slightly smaller than the average value of0.0041/m in the Korean design codes (KCI 2012; KRTA2010), while the curvature friction coefficient was a littlelarger than the average value of 0.2/radian in the Koreandesign codes. In general, however, the evaluated values wereclose to the average values specified in the Korean designcodes. Also, it can be observed that, in each pair of thewobble and curvature friction coefficients, if the wobblefriction coefficient is increased, the corresponding curvaturefriction coefficient decreases, and vice versa. This can beexpected as a matter of course because the two coefficientsare interrelated in Eq. (1). The difference of the values ineach group, i.e. jack-grating or grating–grating, is due to thedifference of the range used for data filtering.In most of the previous studies using the strands with FBG
sensors, only the distribution of prestressing force consid-ering prestress losses was estimated, and the friction coef-ficients were not derived (Kim et al. 2012; Xuan et al. 2009;Zhou et al. 2009). At most, the distribution of prestressingforce obtained by assuming different friction coefficientswas compared with the measured data (Kim et al. 2012). Theresearch significance of this study can be found in a directevaluation of the friction coefficients by utilizing theadvanced sensing technology using FBG embedded in astrand. When the scope is extended to the previous studiesfor proposing friction coefficients, regardless of whichmethod is adopted, the coefficients show a wide range ofvariation depending on the methodology used (Gupta 2005;Jeon et al. 2009; Kim et al. 2012; Kitani and Shimizu 2009;Moon and Lee 1997) and consistent coefficients have not yetbeen established. Another factor for this large variation maybe the difference in material and workmanship in each study.For example, the degree of wobble friction sensitively variesaccording to the supporting interval, stiffness, and surface
International Journal of Concrete Structures and Materials (Vol.9, No.3, September 2015) | 375

condition of a sheath and to the workmanship dedicated tomaintain the original shape of a sheath during the installationof the sheath and the casting of concrete.The confidence level of each friction coefficient was also
investigated as shown in Figs. 8 and 9. The 95 % confidenceinterval was calculated using the corresponding mathemati-cal equation (Kreyszig 2011) for each method, by assumingnormal distribution of the data. Although each method has anarrower band of the confidence interval, the 95 % confi-dence interval marked with dotted lines in Figs. 8 and 9 onlypresents the absolute lower and upper limits that can coverall cases with sufficient reliability. Through this type ofstatistical method, the wide range of the friction coefficientsspecified in a specific provision can be reduced to enhancethe accuracy and reliability. For example, while the range ofthe vertical axes shown in Figs. 8 and 9 corresponds to thatof ACI 318-08 (ACI 2008) and Korean design codes (KCI2012; KRTA 2010), the range can be narrowed to
0.0021–0.0058/m and 0.178–0.244/radian for wobble andcurvature friction coefficients, respectively, by applying a95 % confidence level. This means that the range wasreduced by 27 and 34 % for the wobble and curvaturefriction coefficients in this study, respectively, which mayaccommodate the choice of friction coefficients for fieldengineers and designers.
5.3 DiscussionAs mentioned earlier, a number of conventional electrical
resistance strain gauges were also implemented in this studyfor comparison with the Smart Strand system. As has beenfrequently reported, however, a large number of electricalresistance strain gauges were made unavailable due to thedamage of sensors and lead wires during insertion of strandsinto a sheath and during tensioning. The strains measured bySmart Strands were compared with those measured by theremaining electrical resistance gauges attached to the surface
Fig. 8 Wobble friction coefficient.
Fig. 9 Curvature friction coefficient.
376 | International Journal of Concrete Structures and Materials (Vol.9, No.3, September 2015)

of helical wires, corresponding to the same grating points.The data obtained using electrical resistance gauges showeda great amount of difference from those of Smart Strands,since the electrical resistance gauges may be sensitivelyaffected by such factors as the alignment of the gauges onthe helical wires and the workmanship related to the properbonding of the gauges. In the overall trend, the strains of theconventional gauges were smaller than those of SmartStrands by 20–30 % as representatively shown in Fig. 10.The difference between the strains can be attributed to thedifference in the length between the core wire and helicalwire, and the slope of the helical wire with respect to thecore wire (8.2�), etc. For example, the longer length of thehelical wire wound around the core wire can result in asmaller strain. The difference in the actual stresses betweenthe core wire and helical wire has also been investigated byCho et al. (2013). Therefore, the strains measured usingelectrical resistance gauges should be interpreted with spe-cial care, especially when applied to the strands, althoughthey are still widely used.In this study, the effect of curvature, diameter, and filling
ratio of a sheath, and the effect of the location of a strand in asheath on the friction coefficients have also been investi-gated. However, these topics will be dealt with in anotherpaper since they involved extensive analyses. This studypresented the general average friction coefficients in terms ofwobble and curvature, taking into consideration all the testvariables, since the friction coefficients are specified withoutany limited condition in most provisions as shown inTable 1.
6. Conclusions
In order to overcome the various drawbacks of the existingmeasurement system of the prestressing force of strands inPSC structures, the Smart Strand system was developed inthis study by devising a core wire made of carbon fiber
reinforced polymer with the fiber Bragg grating sensorsembedded. As one of the applications of the Smart Strand,friction coefficients were evaluated using the strain distri-bution of strands obtained from the full-scale test of a 20 mlong beam. Based on the results of the above investigation,the following conclusions can be drawn:
(1) The tests were performed for various curvatures,diameters, and filling ratios of a sheath and for variousstrand locations inside a sheath to include general cases.The analysis results showed the wobble and curvaturefriction coefficients of 0.0038/m and 0.21/radian onaverage, respectively, for general galvanized metalsheaths. These values correspond to the values withinthe middle of the range specified in ACI 318-08 in theU.S. and Structural Concrete Design Code in Korea.
(2) A wide range of friction coefficients specified in thegeneral provisions may cause some difficulty and trial-and-error in choosing an appropriate coefficient for designpurposes. Through statistical analyses using a confidenceinterval, the accuracy of the coefficients was improved byreducing the effective range. For example, the ranges inACI 318-08 in the U.S. and Structural Concrete DesignCode in Korea were reduced by 27–34 %.
(3) The strains measured using conventional electricalresistance strain gauges showed a great amount ofdifference from those of Smart Strands. In the overalltrend, the strains of conventional gauges were smallerthan those of Smart Strands by 20–30 %. The differ-ences in the strains may originate from the differencesin the length between the core wire and helical wire,and the slope of the helical wire with respect to the corewire, etc. Therefore, the strains measured using elec-trical resistance gauges should be interpreted withspecial care in terms of the strains of the strands.
(4) The effect of curvature, diameter, and filling ratio of asheath, and the effect of the location of a strand in asheath on the friction coefficients were also investi-gated, but these will be dealt with in another paper asfurther study. By applying the Smart Strand system toreliably estimate the distribution of the prestressingforce of strands, as has been demonstrated in this study,relevant provisions regarding the design of PSC struc-tures can be verified and improved, if necessary. It isalso expected that the Smart Strand system will be usedfor the maintenance or management of PSC structuresby the long-term monitoring of prestressing force.
Acknowledgments
This research was supported by a grant from a StrategicResearch Project (Development of Smart Prestressing andMonitoring Technologies for Prestressed Concrete Bridges)funded by the Korea Institute of Civil Engineering andBuilding Technology.
Fig. 10 Comparison of strains of a strand.
International Journal of Concrete Structures and Materials (Vol.9, No.3, September 2015) | 377

Open Access
This article is distributed under the terms of the CreativeCommons Attribution 4.0 International License(http://creativecommons.org/licenses/by/4.0/), which per-mits unrestricted use, distribution, and reproduction in anymedium, provided you give appropriate credit to the originalauthor(s) and the source, provide a link to the CreativeCommons license, and indicate if changes were made.
References
ACI Committee 318. (2008). Building code requirements for
structural concrete (ACI 318-08). Farmington Hills, MI,
US: American Concrete Institute (ACI).
ACI Committee 318. (2014). Building code requirements for
structural concrete (ACI 318-14). Farmington Hills, MI,
US: American Concrete Institute (ACI).
American Association of State Highway and Transportation
Officials (AASHTO). (2002). Standard specifications for
highway bridges (17th ed.). Washington, D.C., US:
AASHTO.
American Association of State Highway and Transportation
Officials (AASHTO). (2014). AASHTO LRFD bridge
design specifications (7th ed.). Washington, D.C., US:
AASHTO.
American Society for Testing and Materials (ASTM). (2012).
Standard specification for steel strand, uncoated seven-
wire for prestressed concrete (ASTM A416/A416M-12a).
West Conshohocken, PA, US: ASTM.
British Standards Institution (BSI). (1997). Structural use of
concrete (BS 8110). London, UK: BSI.
Canadian Standards Association (CSA). (2006). Canadian
highway bridge design code, CAN/CSA-S6 (10th ed.).
Mississauga, ON, Canada: CSA.
Cho, K. H., Kim, S. T., Park, S. Y., & Park, Y. H. (2013).
Computation of the strand resistance using the core wire
strain measurement. Engineering, 5, 850–855.
Cho, K. H., Park, S. Y., Cho, J. R., Kim, S. T., & Park, Y. H.
(2015). Estimation of prestress force distribution in the
multi-strand system of prestressed concrete structures.
Sensors, 15, 14079–14092.
Euro-International Committee for Concrete (CEB). (1993).
CEB-FIP model code. Lausanne, Switzerland: Thomas
Telford Services Ltd.
European Committee for Standardization (CEN). (2002). De-
sign of concrete structures (Eurocode 2). Brussels, Bel-
gium: CEN.
Gupta, P. R. (2005). Rational determination of friction losses in
post-tensioned construction (pp. 129–144). SP-231,
American Concrete Institute (ACI).
Jang, I. Y., & Yun, Y. W. (2009). Study on stress transfer
property for embedded FBG strain sensors in concrete
monitoring. International Journal of Concrete Structures
and Materials, 3(1), 33–37.
Japan Road Association (JRA). (2012). Specifications for
highway bridges-Part III. Concrete bridges. Tokyo, Japan:
JRA.
Japan Society of Civil Engineers (JSCE). (2007). Standard
specifications for concrete structures-design. Tokyo, Japan:
JSCE.
Jeon, S. J., Park, J. C., Park, I. K., & Shim, B. (2009). Esti-
mation of friction coefficients based on field data. Journal
of the Korean Society of Civil Engineers, 29(5A), 487–494.
Jeung, B. K., Han, K. B., & Park, S. K. (2000). An experimental
study on the frictional loss of stress in the prestressing
tendons. Journal of the Korean Society of Civil Engineers,
20(5-A), 797–804.
Kim, S. H. (2015). An experimental study on measurement of
friction coefficient using smart strand. Master’s thesis,
Ajou University, Suwon-si, Korea.
Kim, J. M., Kim, H. W., Park, Y. H., Yang, I. H., & Kim, Y. S.
(2012). FBG sensors encapsulated into 7-wire steel strand
for tension monitoring of a prestressing tendon. Advances
in Structural Engineering, 15(6), 907–917.
Kim, S. T., Park, Y. H., Park, S. Y., Cho, K. H., & Cho, J. R.
(2015). A sensor-type PC strand with an embedded FBG
sensor for monitoring prestress forces. Sensors, 15,
1060–1070.
Kitani, T., & Shimizu, A. (2009). Friction coefficient mea-
surement test on 13MN class tendon of PC strands for
prestressed concrete containment vessel (PCCV). In: Pro-
ceedings of 20th international conference on structural
mechanics in reactor technology (SMiRT 20), Paper 1825.
Korea Concrete Institute (KCI). (2012). Structural concrete
design code. Seoul, Korea: KCI.
Korea Institute of Civil Engineering and Building Technology
(KICT). (2013). Development of smart prestressing and
monitoring technologies for prestressed concrete bridges,
KICT 2013-167. Goyang-si, Korea: KICT.
Korea Institute of Civil Engineering and Building Technology
(KICT). (2014). Development of smart prestressing and
monitoring technologies for prestressed concrete bridges,
KICT 2014-171. Goyang-si, Korea: KICT.
Korea Road and Transportation Association (KRTA). (2010).
Design code for highway bridges. Seoul, Korea: KRTA.
Korean Agency for Technology and Standards (KATS). (2011).
Uncoated stress-relieved steel wires and strands for pre-
stressed concrete (KS D 7002). Seoul, Korea: Korean
Standards Association (KSA).
Kreyszig, E. (2011). Advanced engineering mathematics (10th
ed.). Hoboken, NJ, US: Wiley.
Moon, J. K., & Lee, J. H. (1997). A study on the determination
of prestressing force considering frictional loss in PS con-
crete structures. Journal of the Korean Society of Civil
Engineers, 17(I-1), 89–99.
Nellen, P. M., Frank, A., Broennimann, R., Meier, U., &
Sennhauser, U. J. (1999). Fiber optical Bragg grating sen-
sors embedded in CFRP wires. SPIE Proceedings, 3670,
440–449.
378 | International Journal of Concrete Structures and Materials (Vol.9, No.3, September 2015)
Nilson, A. H. (1987). Design of prestressed concrete (2nd ed.).
Hoboken, NJ, US: Wiley.
Park, Y. H., & Gil, H. B. (2004). An error analysis of the friction
assessment method for PS tensioning. In: Proceedings of
Korean Society of Civil Engineers (KSCE) conference,
pp. 106–111.
Park, Y. H., & Kang, H. T. (2003). A criterion for application of
friction assessment methods in PS tensioning management.
In: Proceedings of Korean Society of Civil Engineers
(KSCE) conference, pp. 594–599.
Post-Tensioning Institute (PTI). (2006). Post-tensioning manual
(6th ed.). Phoenix, AZ, US: PTI.
Precast/Prestressed Concrete Institute (PCI). (2011). Bridge
design manual (3rd ed.). Chicago, IL, US: PCI.
State of California Department of Transportation (Caltrans)
Engineering Services. (2005). Prestress manual. Sacra-
mento, CA, US: Caltrans.
The International Federation for Structural Concrete (fib).
(2013). fib model code for concrete structures 2010. Lau-
sanne, Switzerland: fib.
Xuan, F. Z., Tang, H., & Tu, S. T. (2009). In situ monitoring on
prestress losses in the reinforced structure with fiber-optic
sensors. Measurement, 42, 107–111.
Zhou, Z., He, J., Chen, G., & Ou, J. (2009). A smart steel strand
for the evaluation of prestress loss distribution in post-
tensioned concrete structures. Journal of Intelligent Mate-
rial Systems and Structures, 20, 1901–1912.
International Journal of Concrete Structures and Materials (Vol.9, No.3, September 2015) | 379