Embed Size (px)
Citation preview
doi:10.1016/S0301-5629(03)01050-0
● Original Contribution
ESTIMATION OF FRACTIONAL MOVING BLOOD VOLUME IN FETALLUNG USING POWER DOPPLER ULTRASOUND;
METHODOLOGICAL ASPECTS
TOMAS JANSSON,* EDGAR HERNANDEZ-ANDRADE,† GORAN LINGMAN† and KAREL MARSAL
†
Departments of *Electrical Measurements and†Obstetrics and Gynecology, Lund University, Lund, Sweden
(Received 16 October 2002;revised 10 June 2003; in final form 15 July 2003)
Abstract—Perfusion estimation of the fetal lung is an important predictor of its maturity and function afterbirth. Ultrasound (US) power Doppler has previously been used to assess the perfusion of the fetal lung, basedon the mean pixel intensity (MPI) over a region-of-interest (ROI). The drawback is that the MPI is not onlydependent on the amount of flowing blood, but also depth, gain and attenuation in overlying tissue layers. In thisstudy, power Doppler images have been analysed according to a previously published method that attempts tocompensate for such unwanted variations, resulting in a measure termed fractional moving blood volume(FMBV). A total of 29 singleton pregnancies with normally grown fetuses were evaluated after 35 weeks ofgestation. For reliable interpatient comparisons, we found it always necessary to use a well-defined section of thefetal lung. Therefore, all scans were performed in a transverse plane of the fetal thorax with a four-chamber viewof the heart, through the intercostal space. ROIs in 12 left and 17 right fetal lungs were defined (the fetal lungclosest to the transducer was always examined). No differences in estimated FMBV or MPI were found betweenleft and right lungs. Similarly, there was no significant difference between images acquired during systole anddiastole. FMBV is compensated for depth and, also, for other sources of power variation, as reflected in thecoefficient of variation: 0.14 for FMBV and 0.24 for MPI. A scan on a test phantom reveals that the power in dBis linearly related to velocity over a limited range, suggesting that FMBV might be useful for discriminatingbetween normal and decreased fetal lung perfusion. (E-mail: [email protected]) © 2003 WorldFederation for Ultrasound in Medicine & Biology.
Key Words: Doppler ultrasound, Power Doppler, Perfusion, Fetal lung.
INTRODUCTION
Fetal organ blood perfusion is related to the intrauterinegrowth and development (Guiot et al. 1992). Variousclinical conditions associated with intrauterine hypoxiacan modify the flow to different organs, either increasingor decreasing the perfusion (Yoshimura et al. 1997). Thefetal lung is one of the most critical organs at the time ofbirth. Before 32 weeks of gestation, neonatal mortalityand morbidity are closely related to lung function andimmaturity. After 32 weeks, the number of airways in-creases in relation to the number of blood vessels and tothe improvement in the respiratory function (Burri 1984).Therefore, a noninvasive estimate of lung perfusionmight greatly improve the clinical management of pre-term fetuses.
Currently, there is a large interest in ultrasound (US)contrast agents for perfusion estimation (Mulvagh et al.2000). However, safety concerns still make such proce-dures unavailable for investigations of human fetal cir-culation and standard Doppler techniques have to beemployed. Estimation of blood perfusion has been dem-onstrated using color Doppler (Bell et al. 1995; Hirsch etal. 1995; Fein et al. 1995) by analysing the density ofcoloured pixels and the mean velocity indicated by thesepixels, in a region-of-interest (ROI) in the image. PowerDoppler (Rubin et al. 1994) is more sensitive than colorDoppler and is, therefore, often preferred when analysinglow-velocity blood flows. Power Doppler images (Dubielet al. 1999; Welsh et al. 2002), have similarly been usedby calculating the mean pixel intensity (MPI) of thePower Doppler signal over the ROI. Gudmundsson et al.(1999) proposed the latter method to be used for evalu-ation of the fetal lung perfusion.
A drawback of this use of the Power Dopplermethod is that no account is taken of attenuation of the
Address correspondence to: Dr. Tomas Jansson, Department ofElectrical Measurements, P. O. Box 118, Lund University, Lund SE-221 00 Sweden. E-mail: [email protected]
Ultrasound in Med. & Biol., Vol. 29, No. 11, pp. 1551–1559, 2003Copyright © 2003 World Federation for Ultrasound in Medicine & Biology
Printed in the USA. All rights reserved0301-5629/03/$–see front matter
1551
US (Gudmundsson et al. 1998). In other words, given thesame gain setting, a superficial vessel may appearbrighter in the image than a vessel further away from theprobe. This may be alleviated to some extent by timegain compensation, but still, a vessel at a certain depthmay vary in hue from patient to patient due to differentattenuation in overlying tissue structures. Thus, whencalculating the MPI over a region, a depth/attenuationerror will be introduced that will increase the variabilityof the results obtained from a similar clinical population.
Rubin et al. (1995) proposed a method to normalizepower Doppler measurements to depth by consideringthe signal level from a region of known echogenicity(i.e., blood). Thus, pixels inside vessels will be normal-ized to the value 1 and other power values to a valuebetween 0 and 1. The normalized mean intensity over theROI will, therefore, be a value between 0 and 1, orexpressed as a percentage between 0 and 100. Thismeasure is termed fractional moving blood volume(FMBV).
One complication is that the backscattered signalfrom blood varies, mostly due to the degree of rouleauxformation. Typically, the signal amplitude from the cen-ter of the vessel is higher than that closer to the vesselwall due to the higher shear stress near the wall that tendsto separate rouleaux aggregates (Shung et al. 1992). Toovercome this problem, Rubin et al. (1997) suggested anautomated process to find a normalization value based onan analysis of the cumulative Doppler power distributionfunction (defined as the integral of the histogram ofDoppler power values within a ROI). Their results sug-gested that a compensation of depth, attenuation andreceiver gain was achieved using the proposed method.The same group has studied this measure, along withother measures obtained in colour Doppler, in breast andprostate tumors using three-dimensional acquisition tocover the whole organ (Carson et al. 1997; Potdevin et al.2001; Moskalik et al. 2001).
We propose a somewhat different strategy in anattempt to obtain more reproducible FMBV estimates. Inthe fetal lung, the heart may serve as an anatomicallandmark, from which it is possible to define an area inthe lung that will be comparable between different fe-tuses. Consequently, FMBV estimates from different pa-tients will be easier to compare. The strategy of a stan-dardized section may also be applied to other organs.
The main goal of the present study was to evaluatethe methodological aspects of FMBV estimation in fetallung, using the automated process described by Rubin etal. (1997), in combination with the strategy mentionedabove. Specifically, the study investigated if the normal-ization procedure would compensate for differences inmeasurement depth (and other sources, reflected in thevariability), for differences in detected power from right
and left fetal lungs (if there were any) and in imagesobtained during systole and diastole. An objective wasalso to study the influence of the wall filter on thedetected power signals.
MATERIALS AND METHODS
A total of 29 uncomplicated singleton pregnancieswith normal growth fetuses were investigated after 35weeks of gestation. The fetal lung closest to the US probewas examined (left lung, n � 12; right lung, n � 17). Thecolor box was located in the dorsal portion of the lungand kept as small as possible to obtain the best possiblespatial resolution and frame rate. All scans were per-formed through the intercostal space in a standardisedtransverse plane of the fetal thorax with a four-chamberview of the heart.
An ATL HDI-5000 (Philips Medical Systems, ATLUltrasound, Bothell, WA) US scanner was used for themeasurements together with a 7–4-MHz curved-arraytransducer. The equipment settings for the power Dopp-ler mode were optimised and kept through all examina-tions as: medium persistence, high sensitivity, normalline density, normal image display, maximum dynamicrange, high frame rate, 79–81% of gain range, high wallfilter and a pulse-repetition frequency (PRF) of 500 Hz.The colour priority used was the standard setting pro-duced by the clinical program in use (OB/Gen). Theoption HDI-zoom was used to magnify the ROI. Theoutput power was reduced to keep the mechanical andthermal indices below 1.0.
A minimum of 20 consecutive frames per investiga-tion were recorded in the absence of substantial maternaland fetal movements and during suspended maternalrespiration. The original US data were transferred to astandard personal computer (PC) for off-line analysis ina dedicated computer program (HDI-Lab 1.81, PhilipsMedical Systems, ATL Ultrasound, Bothell, WA). Theprogram gives the possibility to reselect an ROI exclud-ing information coming from other tissues and to eval-uate the power Doppler information in dB.
Six frames without movement artifacts from eachfetus were selected for the final analysis, three of them insystole and three in diastole. Systole was defined fromthe grey-scale image when the atrioventricular valveswere closed, and diastole when the valves were open.
Individual frames were chosen for off-line analysisso that no flash artifact (“colour blooming” in the US raydirection) was present and so that the signal was obtainedthrough the intercostal space. The latter criterion wasdetermined from the grey-scale image, when there wasno acoustic shadow from the ribs.
ROIs were reselected off-line from the grey-scaleimage only, to avoid bias from the presence or absence of
1552 Ultrasound in Medicine and Biology Volume 29, Number 11, 2003
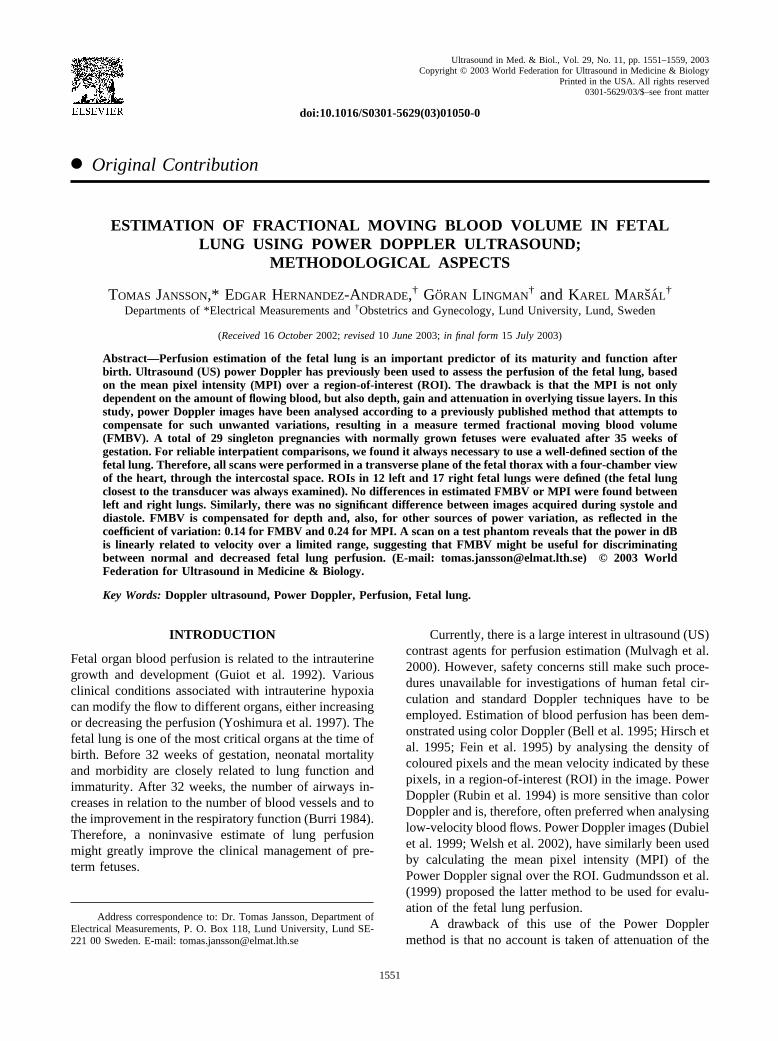
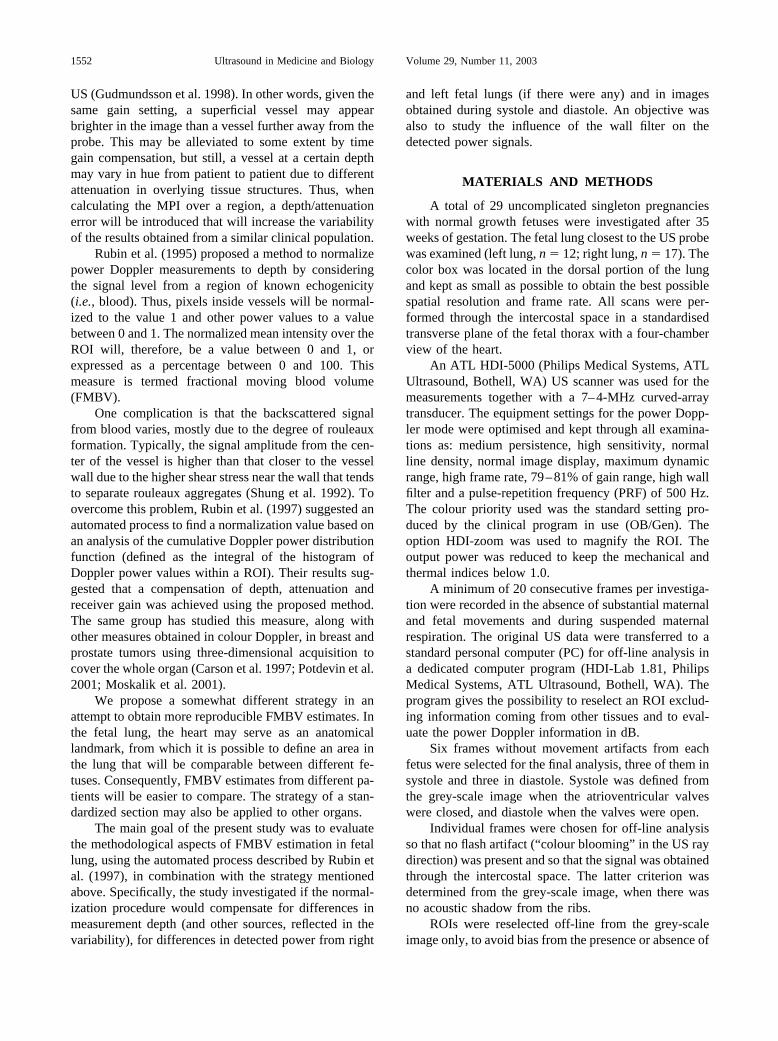
colour data. For the right lung, the ROI was delineatedby a baseline going trough the right atrium, the crossingpoint of the interventricular and interatrial septa and theleft ventricle. For the left lung, the ROI was delineatedwith a baseline crossing the insertion of both atrioven-tricular valves. The signals from the lung tissue posteriorto those boundary lines were then analysed (see Figs. 1and 2).
The power values within this region were exportedto a file and processed in MATLAB� (The Math Works,Natick, MA) according to the algorithm suggested byRubin et al. (1997). The basic idea was to find a powervalue to be used as a normalisation factor, that liessomewhere between the low power values at the vesselwall and the highest values in the center of the vessel.
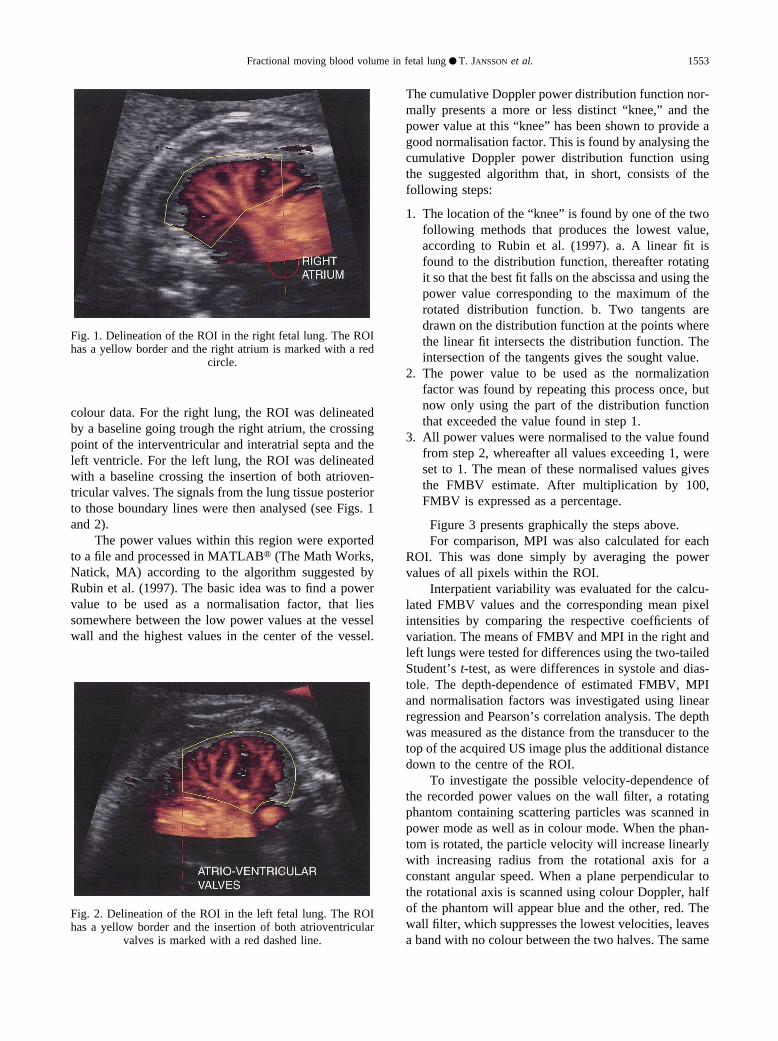
The cumulative Doppler power distribution function nor-mally presents a more or less distinct “knee,” and thepower value at this “knee” has been shown to provide agood normalisation factor. This is found by analysing thecumulative Doppler power distribution function usingthe suggested algorithm that, in short, consists of thefollowing steps:
1. The location of the “knee” is found by one of the twofollowing methods that produces the lowest value,according to Rubin et al. (1997). a. A linear fit isfound to the distribution function, thereafter rotatingit so that the best fit falls on the abscissa and using thepower value corresponding to the maximum of therotated distribution function. b. Two tangents aredrawn on the distribution function at the points wherethe linear fit intersects the distribution function. Theintersection of the tangents gives the sought value.
2. The power value to be used as the normalizationfactor was found by repeating this process once, butnow only using the part of the distribution functionthat exceeded the value found in step 1.
3. All power values were normalised to the value foundfrom step 2, whereafter all values exceeding 1, wereset to 1. The mean of these normalised values givesthe FMBV estimate. After multiplication by 100,FMBV is expressed as a percentage.
Figure 3 presents graphically the steps above.For comparison, MPI was also calculated for each
ROI. This was done simply by averaging the powervalues of all pixels within the ROI.
Interpatient variability was evaluated for the calcu-lated FMBV values and the corresponding mean pixelintensities by comparing the respective coefficients ofvariation. The means of FMBV and MPI in the right andleft lungs were tested for differences using the two-tailedStudent’s t-test, as were differences in systole and dias-tole. The depth-dependence of estimated FMBV, MPIand normalisation factors was investigated using linearregression and Pearson’s correlation analysis. The depthwas measured as the distance from the transducer to thetop of the acquired US image plus the additional distancedown to the centre of the ROI.
To investigate the possible velocity-dependence ofthe recorded power values on the wall filter, a rotatingphantom containing scattering particles was scanned inpower mode as well as in colour mode. When the phan-tom is rotated, the particle velocity will increase linearlywith increasing radius from the rotational axis for aconstant angular speed. When a plane perpendicular tothe rotational axis is scanned using colour Doppler, halfof the phantom will appear blue and the other, red. Thewall filter, which suppresses the lowest velocities, leavesa band with no colour between the two halves. The same
Fig. 1. Delineation of the ROI in the right fetal lung. The ROIhas a yellow border and the right atrium is marked with a red
circle.
Fig. 2. Delineation of the ROI in the left fetal lung. The ROIhas a yellow border and the insertion of both atrioventricular
valves is marked with a red dashed line.
Fractional moving blood volume in fetal lung ● T. JANSSON et al. 1553
band appears in power Doppler between two reddish andyellow halves.
The phantom was produced from agar and containedsmall, sparsely and randomly distributed glass particlesas scattering objects. The manufacturing procedure, aswell as relevant acoustical parameters, have been de-scribed elsewhere (Jansson et al. 2002). The phantomhad a cylindrical shape, with a diameter of 34 mm and alength of 120 mm. It was moulded to a holder so that itcould be rotated in a water bath around its axis by a smallDC motor (Dunkermotoren, Bonndorf/Schwartzwald,Germany), geared at a ratio of 1:100.
The phantom was rotated in a plastic container, withthe US probe mounted to the side wall of the tank. Thephantom was scanned in power mode using the samesettings as for the clinical examinations, except for thegain. This was adjusted so that the zero velocity point inthe center of the phantom gave a value of 0 dB power(corresponding to 44% gain). The color Doppler settingswere similar, except for the gain (10%) and the PRF,which was set to 350 Hz, producing a velocity range of�5.3 to 5.3 cm/s.
Image sequences from both modes were transferredto the computer for off-line analysis in the dedicatedsoftware (HDI-lab). A line through the centre of thephantom and parallel to the transducer surface wasdrawn and analysed for power level and velocity infor-mation. The small angular error in estimated velocity,due to the curvature of the transducer, was neglected.
RESULTS
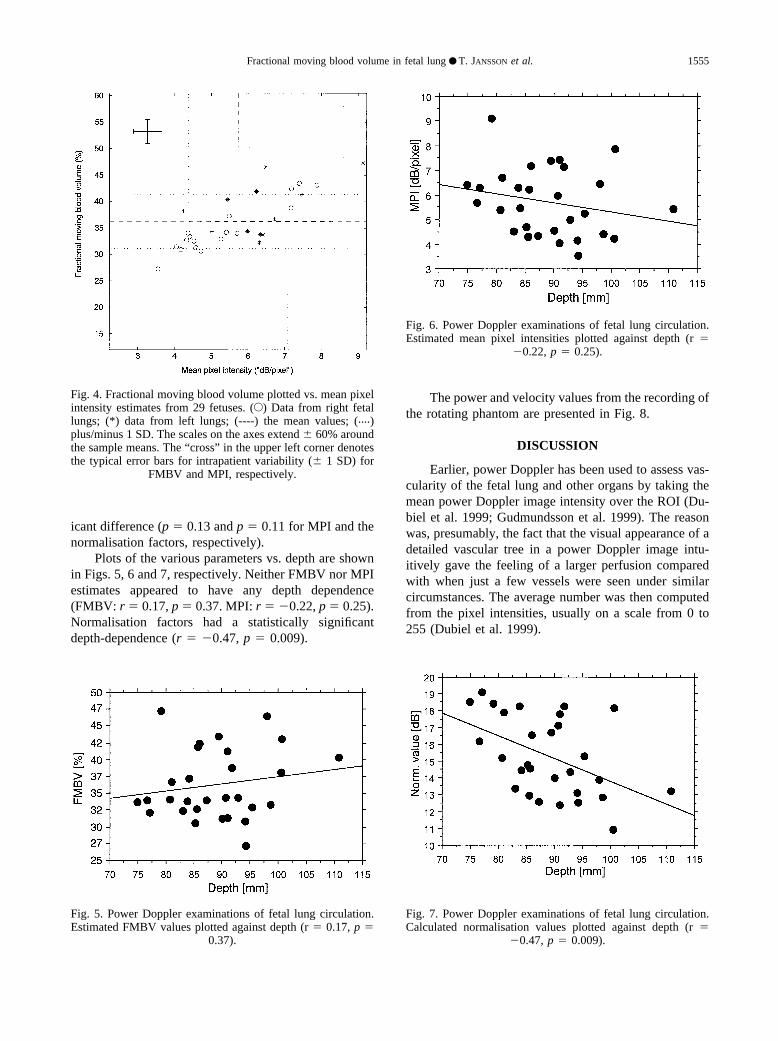
The mean FMBV estimate of six frames from eachpatient vs. the mean MPI from the same frames is pre-sented in Fig. 4. The mean of FMBV and mean MPI forall patients were 36.2% and 5.72 dB/pixel, respectively(ranges 27–47%, 3.55–9.13 dB/pixel). The SD, were5.13% and 1.36 dB/pixel, respectively. Thus, the coeffi-cients of variation for the two measures were 0.14(FMBV) and 0.24 (MPI).
Indicated in Fig. 4 is also the typical (average)intrapatient variability of FMBV and MPI; that is, theSD, for the six frames used for the analysis. This was2.4% and 0.43 dB/pixel, respectively (ranges 1.4–4.7%and 0.16–1.34 dB/pixel). The intrapatient SD for thenormalisation factor was 0.97 dB (range 0.28–2.28).
There was no statistically significant difference be-tween the 12 left lungs and 17 right lungs that wereexamined, for either of investigated parameters (p �0.33, p � 0.24 and p � 0.20 for FMBV, MPI and thenormalisation factor, respectively).
FMBV estimates did not differ significantly forframes analysed in systole vs. diastole (p � 0.49). MPIand normalisation factors showed a weak but nonsignif-
Fig. 3. Principle of finding the normalization factor. Step 1:tangents are drawn from the intersections of the linear fit withthe cumulative distribution function. Step 2: a tangent to thedistribution function, parallell to the linear fit, is found. Step 3:the cumulative distribution function is redrawn, but now onlyfrom the lowest value found in steps 1 and 2. The normalisation
value is found by repeating steps 1 and 2.
1554 Ultrasound in Medicine and Biology Volume 29, Number 11, 2003
icant difference (p � 0.13 and p � 0.11 for MPI and thenormalisation factors, respectively).
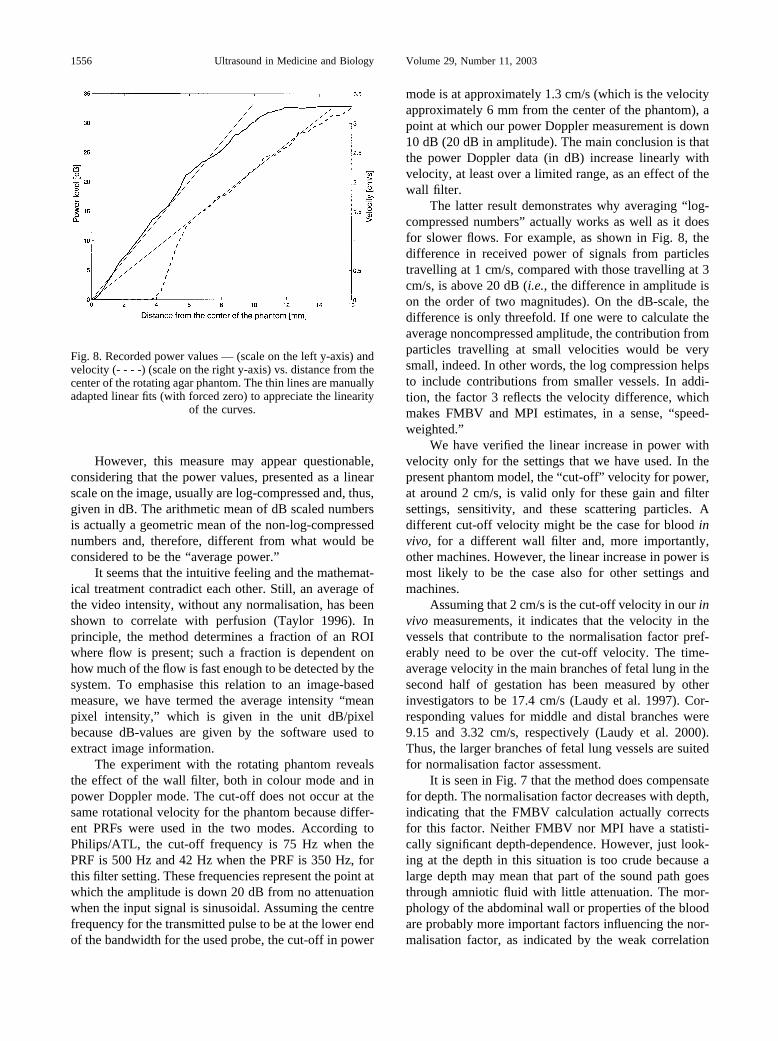
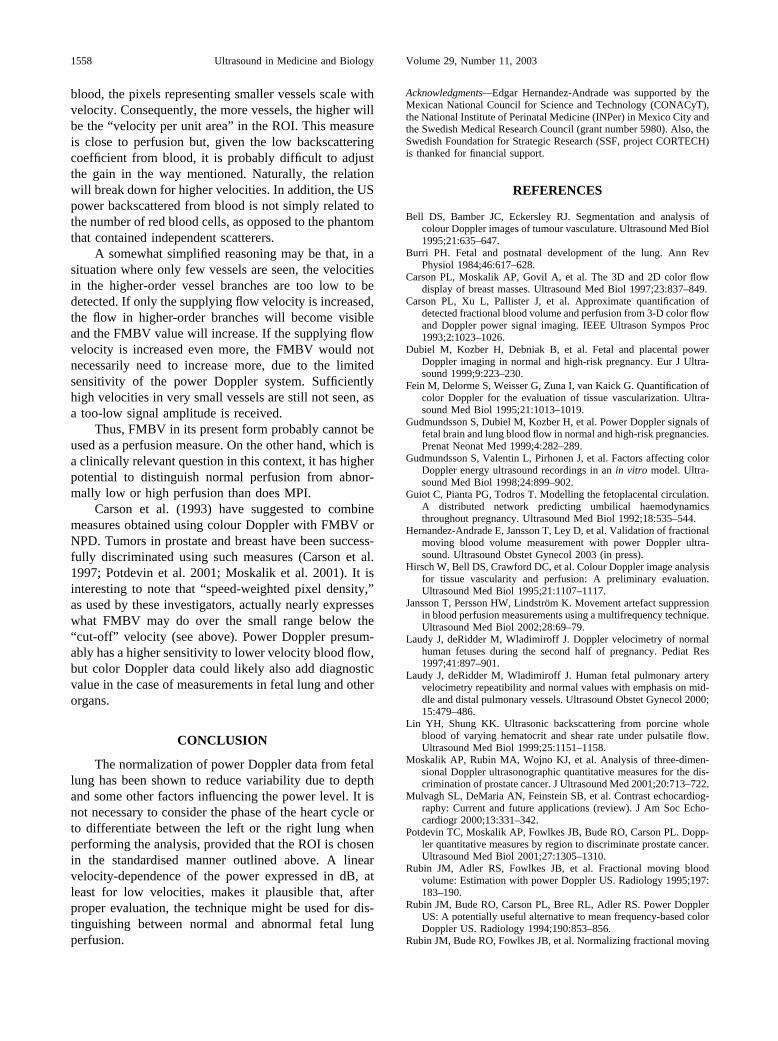
Plots of the various parameters vs. depth are shownin Figs. 5, 6 and 7, respectively. Neither FMBV nor MPIestimates appeared to have any depth dependence(FMBV: r � 0.17, p � 0.37. MPI: r � �0.22, p � 0.25).Normalisation factors had a statistically significantdepth-dependence (r � �0.47, p � 0.009).
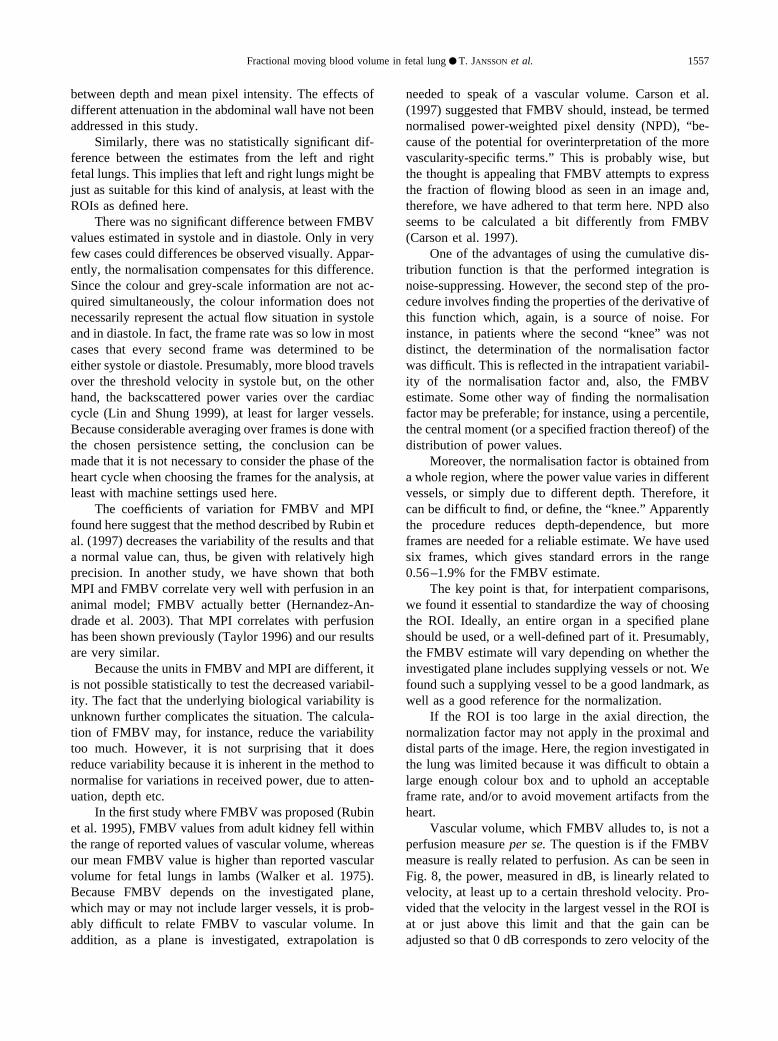
The power and velocity values from the recording ofthe rotating phantom are presented in Fig. 8.
DISCUSSION
Earlier, power Doppler has been used to assess vas-cularity of the fetal lung and other organs by taking themean power Doppler image intensity over the ROI (Du-biel et al. 1999; Gudmundsson et al. 1999). The reasonwas, presumably, the fact that the visual appearance of adetailed vascular tree in a power Doppler image intu-itively gave the feeling of a larger perfusion comparedwith when just a few vessels were seen under similarcircumstances. The average number was then computedfrom the pixel intensities, usually on a scale from 0 to255 (Dubiel et al. 1999).
Fig. 4. Fractional moving blood volume plotted vs. mean pixelintensity estimates from 29 fetuses. (E) Data from right fetallungs; (*) data from left lungs; (----) the mean values; (....)plus/minus 1 SD. The scales on the axes extend � 60% aroundthe sample means. The “cross” in the upper left corner denotesthe typical error bars for intrapatient variability (� 1 SD) for
FMBV and MPI, respectively.
Fig. 5. Power Doppler examinations of fetal lung circulation.Estimated FMBV values plotted against depth (r � 0.17, p �
0.37).
Fig. 6. Power Doppler examinations of fetal lung circulation.Estimated mean pixel intensities plotted against depth (r �
�0.22, p � 0.25).
Fig. 7. Power Doppler examinations of fetal lung circulation.Calculated normalisation values plotted against depth (r �
�0.47, p � 0.009).
Fractional moving blood volume in fetal lung ● T. JANSSON et al. 1555
However, this measure may appear questionable,considering that the power values, presented as a linearscale on the image, usually are log-compressed and, thus,given in dB. The arithmetic mean of dB scaled numbersis actually a geometric mean of the non-log-compressednumbers and, therefore, different from what would beconsidered to be the “average power.”
It seems that the intuitive feeling and the mathemat-ical treatment contradict each other. Still, an average ofthe video intensity, without any normalisation, has beenshown to correlate with perfusion (Taylor 1996). Inprinciple, the method determines a fraction of an ROIwhere flow is present; such a fraction is dependent onhow much of the flow is fast enough to be detected by thesystem. To emphasise this relation to an image-basedmeasure, we have termed the average intensity “meanpixel intensity,” which is given in the unit dB/pixelbecause dB-values are given by the software used toextract image information.
The experiment with the rotating phantom revealsthe effect of the wall filter, both in colour mode and inpower Doppler mode. The cut-off does not occur at thesame rotational velocity for the phantom because differ-ent PRFs were used in the two modes. According toPhilips/ATL, the cut-off frequency is 75 Hz when thePRF is 500 Hz and 42 Hz when the PRF is 350 Hz, forthis filter setting. These frequencies represent the point atwhich the amplitude is down 20 dB from no attenuationwhen the input signal is sinusoidal. Assuming the centrefrequency for the transmitted pulse to be at the lower endof the bandwidth for the used probe, the cut-off in power
mode is at approximately 1.3 cm/s (which is the velocityapproximately 6 mm from the center of the phantom), apoint at which our power Doppler measurement is down10 dB (20 dB in amplitude). The main conclusion is thatthe power Doppler data (in dB) increase linearly withvelocity, at least over a limited range, as an effect of thewall filter.
The latter result demonstrates why averaging “ log-compressed numbers” actually works as well as it doesfor slower flows. For example, as shown in Fig. 8, thedifference in received power of signals from particlestravelling at 1 cm/s, compared with those travelling at 3cm/s, is above 20 dB (i.e., the difference in amplitude ison the order of two magnitudes). On the dB-scale, thedifference is only threefold. If one were to calculate theaverage noncompressed amplitude, the contribution fromparticles travelling at small velocities would be verysmall, indeed. In other words, the log compression helpsto include contributions from smaller vessels. In addi-tion, the factor 3 reflects the velocity difference, whichmakes FMBV and MPI estimates, in a sense, “speed-weighted.”
We have verified the linear increase in power withvelocity only for the settings that we have used. In thepresent phantom model, the “cut-off” velocity for power,at around 2 cm/s, is valid only for these gain and filtersettings, sensitivity, and these scattering particles. Adifferent cut-off velocity might be the case for blood invivo, for a different wall filter and, more importantly,other machines. However, the linear increase in power ismost likely to be the case also for other settings andmachines.
Assuming that 2 cm/s is the cut-off velocity in our invivo measurements, it indicates that the velocity in thevessels that contribute to the normalisation factor pref-erably need to be over the cut-off velocity. The time-average velocity in the main branches of fetal lung in thesecond half of gestation has been measured by otherinvestigators to be 17.4 cm/s (Laudy et al. 1997). Cor-responding values for middle and distal branches were9.15 and 3.32 cm/s, respectively (Laudy et al. 2000).Thus, the larger branches of fetal lung vessels are suitedfor normalisation factor assessment.
It is seen in Fig. 7 that the method does compensatefor depth. The normalisation factor decreases with depth,indicating that the FMBV calculation actually correctsfor this factor. Neither FMBV nor MPI have a statisti-cally significant depth-dependence. However, just look-ing at the depth in this situation is too crude because alarge depth may mean that part of the sound path goesthrough amniotic fluid with little attenuation. The mor-phology of the abdominal wall or properties of the bloodare probably more important factors influencing the nor-malisation factor, as indicated by the weak correlation
Fig. 8. Recorded power values — (scale on the left y-axis) andvelocity (- - - -) (scale on the right y-axis) vs. distance from thecenter of the rotating agar phantom. The thin lines are manuallyadapted linear fits (with forced zero) to appreciate the linearity
of the curves.
1556 Ultrasound in Medicine and Biology Volume 29, Number 11, 2003
between depth and mean pixel intensity. The effects ofdifferent attenuation in the abdominal wall have not beenaddressed in this study.
Similarly, there was no statistically significant dif-ference between the estimates from the left and rightfetal lungs. This implies that left and right lungs might bejust as suitable for this kind of analysis, at least with theROIs as defined here.
There was no significant difference between FMBVvalues estimated in systole and in diastole. Only in veryfew cases could differences be observed visually. Appar-ently, the normalisation compensates for this difference.Since the colour and grey-scale information are not ac-quired simultaneously, the colour information does notnecessarily represent the actual flow situation in systoleand in diastole. In fact, the frame rate was so low in mostcases that every second frame was determined to beeither systole or diastole. Presumably, more blood travelsover the threshold velocity in systole but, on the otherhand, the backscattered power varies over the cardiaccycle (Lin and Shung 1999), at least for larger vessels.Because considerable averaging over frames is done withthe chosen persistence setting, the conclusion can bemade that it is not necessary to consider the phase of theheart cycle when choosing the frames for the analysis, atleast with machine settings used here.
The coefficients of variation for FMBV and MPIfound here suggest that the method described by Rubin etal. (1997) decreases the variability of the results and thata normal value can, thus, be given with relatively highprecision. In another study, we have shown that bothMPI and FMBV correlate very well with perfusion in ananimal model; FMBV actually better (Hernandez-An-drade et al. 2003). That MPI correlates with perfusionhas been shown previously (Taylor 1996) and our resultsare very similar.
Because the units in FMBV and MPI are different, itis not possible statistically to test the decreased variabil-ity. The fact that the underlying biological variability isunknown further complicates the situation. The calcula-tion of FMBV may, for instance, reduce the variabilitytoo much. However, it is not surprising that it doesreduce variability because it is inherent in the method tonormalise for variations in received power, due to atten-uation, depth etc.
In the first study where FMBV was proposed (Rubinet al. 1995), FMBV values from adult kidney fell withinthe range of reported values of vascular volume, whereasour mean FMBV value is higher than reported vascularvolume for fetal lungs in lambs (Walker et al. 1975).Because FMBV depends on the investigated plane,which may or may not include larger vessels, it is prob-ably difficult to relate FMBV to vascular volume. Inaddition, as a plane is investigated, extrapolation is
needed to speak of a vascular volume. Carson et al.(1997) suggested that FMBV should, instead, be termednormalised power-weighted pixel density (NPD), “be-cause of the potential for overinterpretation of the morevascularity-specific terms.” This is probably wise, butthe thought is appealing that FMBV attempts to expressthe fraction of flowing blood as seen in an image and,therefore, we have adhered to that term here. NPD alsoseems to be calculated a bit differently from FMBV(Carson et al. 1997).
One of the advantages of using the cumulative dis-tribution function is that the performed integration isnoise-suppressing. However, the second step of the pro-cedure involves finding the properties of the derivative ofthis function which, again, is a source of noise. Forinstance, in patients where the second “knee” was notdistinct, the determination of the normalisation factorwas difficult. This is reflected in the intrapatient variabil-ity of the normalisation factor and, also, the FMBVestimate. Some other way of finding the normalisationfactor may be preferable; for instance, using a percentile,the central moment (or a specified fraction thereof) of thedistribution of power values.
Moreover, the normalisation factor is obtained froma whole region, where the power value varies in differentvessels, or simply due to different depth. Therefore, itcan be difficult to find, or define, the “knee.” Apparentlythe procedure reduces depth-dependence, but moreframes are needed for a reliable estimate. We have usedsix frames, which gives standard errors in the range0.56–1.9% for the FMBV estimate.
The key point is that, for interpatient comparisons,we found it essential to standardize the way of choosingthe ROI. Ideally, an entire organ in a specified planeshould be used, or a well-defined part of it. Presumably,the FMBV estimate will vary depending on whether theinvestigated plane includes supplying vessels or not. Wefound such a supplying vessel to be a good landmark, aswell as a good reference for the normalization.
If the ROI is too large in the axial direction, thenormalization factor may not apply in the proximal anddistal parts of the image. Here, the region investigated inthe lung was limited because it was difficult to obtain alarge enough colour box and to uphold an acceptableframe rate, and/or to avoid movement artifacts from theheart.
Vascular volume, which FMBV alludes to, is not aperfusion measure per se. The question is if the FMBVmeasure is really related to perfusion. As can be seen inFig. 8, the power, measured in dB, is linearly related tovelocity, at least up to a certain threshold velocity. Pro-vided that the velocity in the largest vessel in the ROI isat or just above this limit and that the gain can beadjusted so that 0 dB corresponds to zero velocity of the
Fractional moving blood volume in fetal lung ● T. JANSSON et al. 1557
blood, the pixels representing smaller vessels scale withvelocity. Consequently, the more vessels, the higher willbe the “velocity per unit area” in the ROI. This measureis close to perfusion but, given the low backscatteringcoefficient from blood, it is probably difficult to adjustthe gain in the way mentioned. Naturally, the relationwill break down for higher velocities. In addition, the USpower backscattered from blood is not simply related tothe number of red blood cells, as opposed to the phantomthat contained independent scatterers.
A somewhat simplified reasoning may be that, in asituation where only few vessels are seen, the velocitiesin the higher-order vessel branches are too low to bedetected. If only the supplying flow velocity is increased,the flow in higher-order branches will become visibleand the FMBV value will increase. If the supplying flowvelocity is increased even more, the FMBV would notnecessarily need to increase more, due to the limitedsensitivity of the power Doppler system. Sufficientlyhigh velocities in very small vessels are still not seen, asa too-low signal amplitude is received.
Thus, FMBV in its present form probably cannot beused as a perfusion measure. On the other hand, which isa clinically relevant question in this context, it has higherpotential to distinguish normal perfusion from abnor-mally low or high perfusion than does MPI.
Carson et al. (1993) have suggested to combinemeasures obtained using colour Doppler with FMBV orNPD. Tumors in prostate and breast have been success-fully discriminated using such measures (Carson et al.1997; Potdevin et al. 2001; Moskalik et al. 2001). It isinteresting to note that “speed-weighted pixel density,”as used by these investigators, actually nearly expresseswhat FMBV may do over the small range below the“cut-off” velocity (see above). Power Doppler presum-ably has a higher sensitivity to lower velocity blood flow,but color Doppler data could likely also add diagnosticvalue in the case of measurements in fetal lung and otherorgans.
CONCLUSION
The normalization of power Doppler data from fetallung has been shown to reduce variability due to depthand some other factors influencing the power level. It isnot necessary to consider the phase of the heart cycle orto differentiate between the left or the right lung whenperforming the analysis, provided that the ROI is chosenin the standardised manner outlined above. A linearvelocity-dependence of the power expressed in dB, atleast for low velocities, makes it plausible that, afterproper evaluation, the technique might be used for dis-tinguishing between normal and abnormal fetal lungperfusion.
Acknowledgments—Edgar Hernandez-Andrade was supported by theMexican National Council for Science and Technology (CONACyT),the National Institute of Perinatal Medicine (INPer) in Mexico City andthe Swedish Medical Research Council (grant number 5980). Also, theSwedish Foundation for Strategic Research (SSF, project CORTECH)is thanked for financial support.
REFERENCES
Bell DS, Bamber JC, Eckersley RJ. Segmentation and analysis ofcolour Doppler images of tumour vasculature. Ultrasound Med Biol1995;21:635–647.
Burri PH. Fetal and postnatal development of the lung. Ann RevPhysiol 1984;46:617–628.
Carson PL, Moskalik AP, Govil A, et al. The 3D and 2D color flowdisplay of breast masses. Ultrasound Med Biol 1997;23:837–849.
Carson PL, Xu L, Pallister J, et al. Approximate quantification ofdetected fractional blood volume and perfusion from 3-D color flowand Doppler power signal imaging. IEEE Ultrason Sympos Proc1993;2:1023–1026.
Dubiel M, Kozber H, Debniak B, et al. Fetal and placental powerDoppler imaging in normal and high-risk pregnancy. Eur J Ultra-sound 1999;9:223–230.
Fein M, Delorme S, Weisser G, Zuna I, van Kaick G. Quantification ofcolor Doppler for the evaluation of tissue vascularization. Ultra-sound Med Biol 1995;21:1013–1019.
Gudmundsson S, Dubiel M, Kozber H, et al. Power Doppler signals offetal brain and lung blood flow in normal and high-risk pregnancies.Prenat Neonat Med 1999;4:282–289.
Gudmundsson S, Valentin L, Pirhonen J, et al. Factors affecting colorDoppler energy ultrasound recordings in an in vitro model. Ultra-sound Med Biol 1998;24:899–902.
Guiot C, Pianta PG, Todros T. Modelling the fetoplacental circulation.A distributed network predicting umbilical haemodynamicsthroughout pregnancy. Ultrasound Med Biol 1992;18:535–544.
Hernandez-Andrade E, Jansson T, Ley D, et al. Validation of fractionalmoving blood volume measurement with power Doppler ultra-sound. Ultrasound Obstet Gynecol 2003 (in press).
Hirsch W, Bell DS, Crawford DC, et al. Colour Doppler image analysisfor tissue vascularity and perfusion: A preliminary evaluation.Ultrasound Med Biol 1995;21:1107–1117.
Jansson T, Persson HW, Lindstrom K. Movement artefact suppressionin blood perfusion measurements using a multifrequency technique.Ultrasound Med Biol 2002;28:69–79.
Laudy J, deRidder M, Wladimiroff J. Doppler velocimetry of normalhuman fetuses during the second half of pregnancy. Pediat Res1997;41:897–901.
Laudy J, deRidder M, Wladimiroff J. Human fetal pulmonary arteryvelocimetry repeatibility and normal values with emphasis on mid-dle and distal pulmonary vessels. Ultrasound Obstet Gynecol 2000;15:479–486.
Lin YH, Shung KK. Ultrasonic backscattering from porcine wholeblood of varying hematocrit and shear rate under pulsatile flow.Ultrasound Med Biol 1999;25:1151–1158.
Moskalik AP, Rubin MA, Wojno KJ, et al. Analysis of three-dimen-sional Doppler ultrasonographic quantitative measures for the dis-crimination of prostate cancer. J Ultrasound Med 2001;20:713–722.
Mulvagh SL, DeMaria AN, Feinstein SB, et al. Contrast echocardiog-raphy: Current and future applications (review). J Am Soc Echo-cardiogr 2000;13:331–342.
Potdevin TC, Moskalik AP, Fowlkes JB, Bude RO, Carson PL. Dopp-ler quantitative measures by region to discriminate prostate cancer.Ultrasound Med Biol 2001;27:1305–1310.
Rubin JM, Adler RS, Fowlkes JB, et al. Fractional moving bloodvolume: Estimation with power Doppler US. Radiology 1995;197:183–190.
Rubin JM, Bude RO, Carson PL, Bree RL, Adler RS. Power DopplerUS: A potentially useful alternative to mean frequency-based colorDoppler US. Radiology 1994;190:853–856.
Rubin JM, Bude RO, Fowlkes JB, et al. Normalizing fractional moving
1558 Ultrasound in Medicine and Biology Volume 29, Number 11, 2003

blood volume estimates with power Doppler US: Defining a stableintravascular point with the cumulative power distribution function.Radiology 1997;205:757–765.
Shung KK, Cloutier G, Lim CC. The effects of hematocrit, shear rate,and turbulence on ultrasonic Doppler spectrum from blood. IEEETrans Biomed Eng 1992;39:462–469.
Taylor GA. Regional cerebral blood flow estimates in newborn lambusing amplitude-mode color Doppler ultrasound. Pediatr Radiol1996;26:282–286.
Walker AM, Alcarn DG, Cannata JC, Malone JE, Ritchie BC. Effect ofventilation on pulmonary blood volume of the fetal lamb. J AppPhysiol 1975;39:969–975.
Welsh AW, Rubin J, Fowlkes B, Fisk N. Quantification of fetal powerDoppler: Determination of the intravascular standardization point.(Abst. F12). Ultrasound Obstet Gynecol 2001;18(Suppl. 1):14.
Yoshimura S, Masuzaki H, Gotoh H, Ishimaru T. Fetal redistribution ofblood flow and amniotic fluid volume in growth-retarded fetuses.Early Hum Dev 1997;47:297–304.
Fractional moving blood volume in fetal lung ● T. JANSSON et al. 1559