Embed Size (px)
Citation preview
1/19/2010 1
Estimating Turning Points using Large Data Sets (work in progress)
James H. Stock, Harvard University and the NBER
Mark W. Watson, Princeton University and the NBER
2nd International Conference in Memory of Carlo Giannini
Banca d’Italia
January 20, 2010

1/19/2010 2
Dating business cycles is easy ….
or is it?
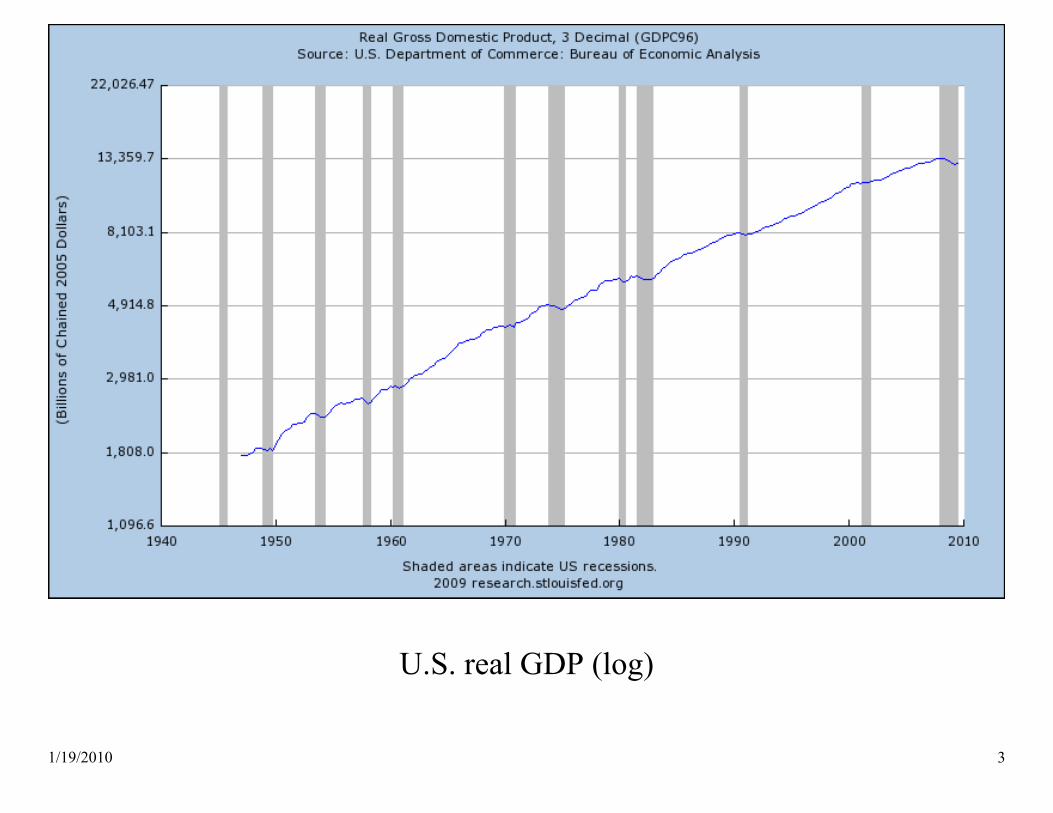
1/19/2010 3
U.S. real GDP (log)
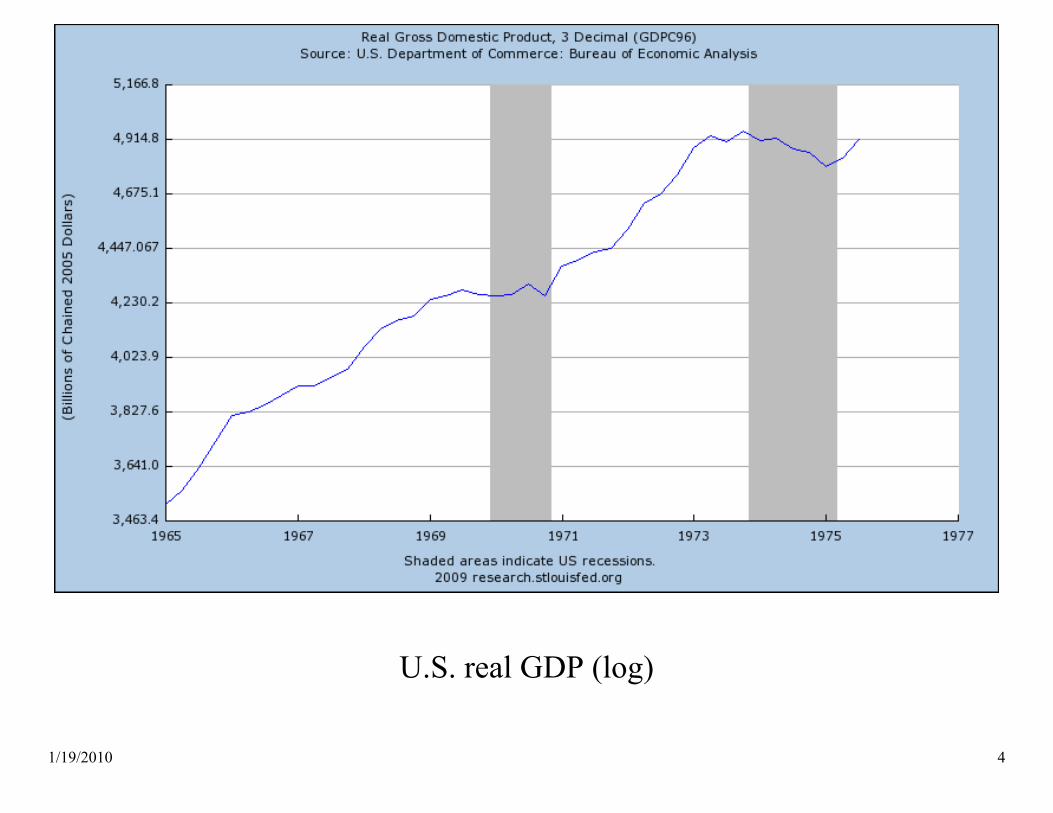
1/19/2010 4
U.S. real GDP (log)

1/19/2010 5
U.S. real GDP (log)

1/19/2010 6
Total Nonfarm Employment & Industrial Production (logs)

1/19/2010 7
What is a turning point? Burns and Mitchell (1946)
… A reference scale of business cycles must be extracted from the fallible indications provided by time series for varied economic activities…. (p. 76) [more than 1000 in all, with various spans] In many cases the turning points of different series were bunched so closely that we could not go far astray. But there were cases in which the turning points were widely scattered, and others in which they were concentrated around two separate dates. If there was little else to guide us, we placed the reference turn toward the close of the transition period. (p. 77-80)
1/19/2010 8
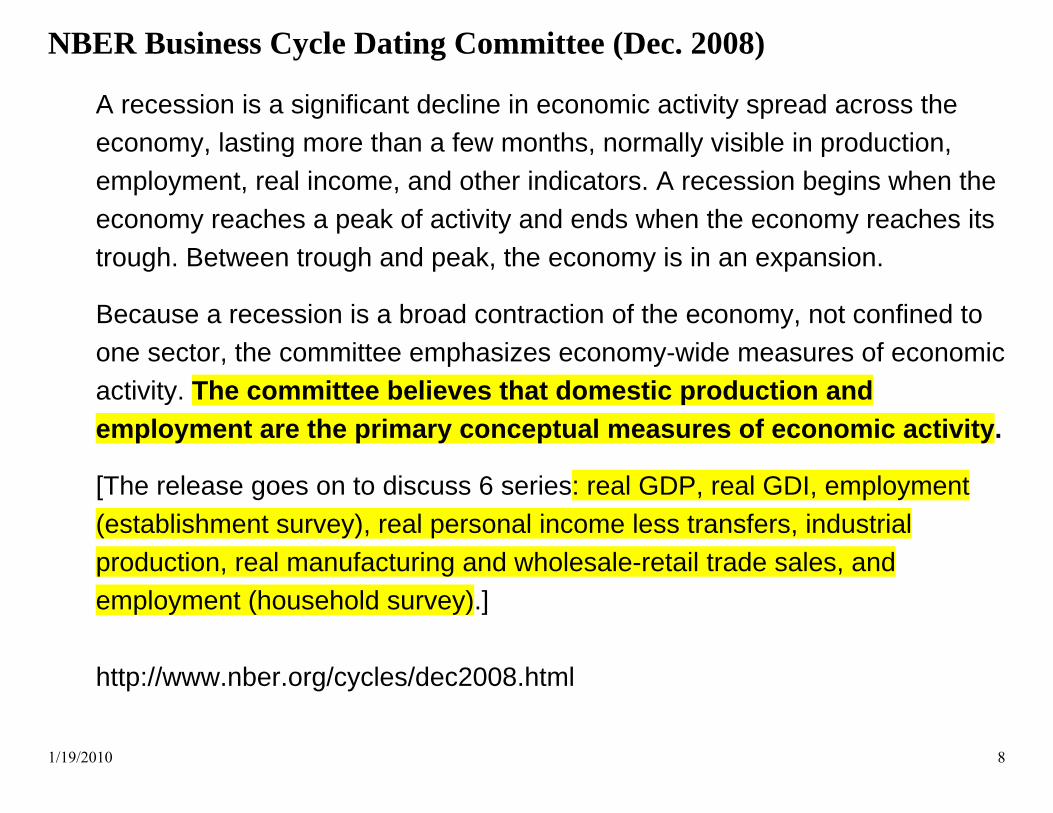
NBER Business Cycle Dating Committee (Dec. 2008)
A recession is a significant decline in economic activity spread across the economy, lasting more than a few months, normally visible in production, employment, real income, and other indicators. A recession begins when the economy reaches a peak of activity and ends when the economy reaches its trough. Between trough and peak, the economy is in an expansion.
Because a recession is a broad contraction of the economy, not confined to one sector, the committee emphasizes economy-wide measures of economic activity. The committee believes that domestic production and employment are the primary conceptual measures of economic activity.
[The release goes on to discuss 6 series: real GDP, real GDI, employment (establishment survey), real personal income less transfers, industrial production, real manufacturing and wholesale-retail trade sales, and employment (household survey).] http://www.nber.org/cycles/dec2008.html
1/19/2010 9
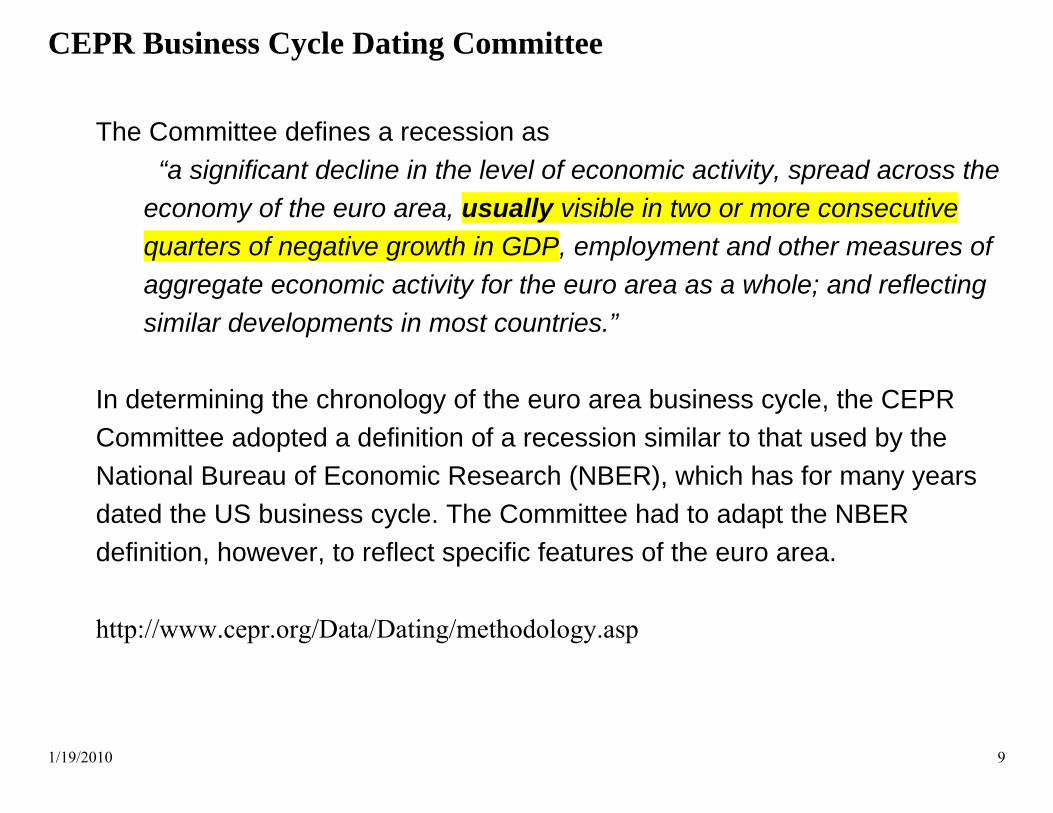
CEPR Business Cycle Dating Committee
The Committee defines a recession as “a significant decline in the level of economic activity, spread across the economy of the euro area, usually visible in two or more consecutive quarters of negative growth in GDP, employment and other measures of aggregate economic activity for the euro area as a whole; and reflecting similar developments in most countries.”
In determining the chronology of the euro area business cycle, the CEPR Committee adopted a definition of a recession similar to that used by the National Bureau of Economic Research (NBER), which has for many years dated the US business cycle. The Committee had to adapt the NBER definition, however, to reflect specific features of the euro area.
http://www.cepr.org/Data/Dating/methodology.asp
1/19/2010 10
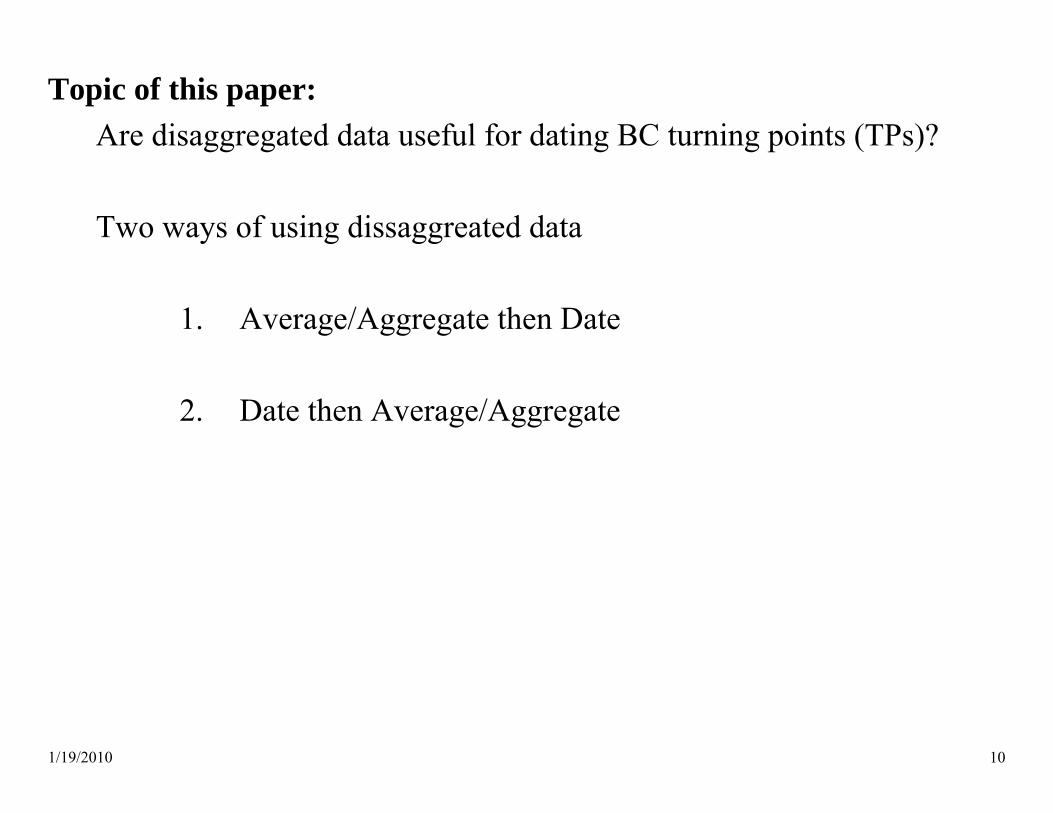
Topic of this paper:
Are disaggregated data useful for dating BC turning points (TPs)? Two ways of using dissaggreated data
1. Average/Aggregate then Date
2. Date then Average/Aggregate

1/19/2010 11
Monthly data set: • 270 disaggregates (total) of employment, IP, personal income, & sales,
U.S. • Monthly, focus on 1959:1 – 2009:7 • Lots of missing data (blocks)
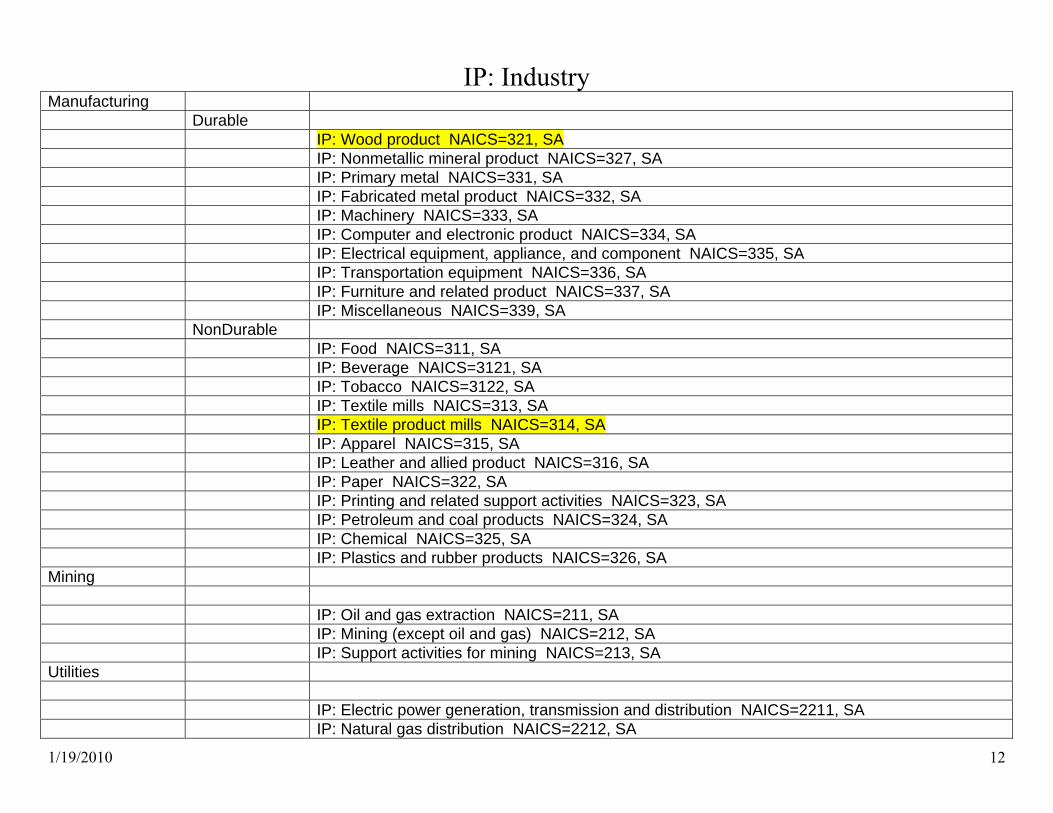
1/19/2010 12
IP: Industry Manufacturing Durable IP: Wood product NAICS=321, SA IP: Nonmetallic mineral product NAICS=327, SA IP: Primary metal NAICS=331, SA IP: Fabricated metal product NAICS=332, SA IP: Machinery NAICS=333, SA IP: Computer and electronic product NAICS=334, SA IP: Electrical equipment, appliance, and component NAICS=335, SA IP: Transportation equipment NAICS=336, SA IP: Furniture and related product NAICS=337, SA IP: Miscellaneous NAICS=339, SA NonDurable IP: Food NAICS=311, SA IP: Beverage NAICS=3121, SA IP: Tobacco NAICS=3122, SA IP: Textile mills NAICS=313, SA IP: Textile product mills NAICS=314, SA IP: Apparel NAICS=315, SA IP: Leather and allied product NAICS=316, SA IP: Paper NAICS=322, SA IP: Printing and related support activities NAICS=323, SA IP: Petroleum and coal products NAICS=324, SA IP: Chemical NAICS=325, SA IP: Plastics and rubber products NAICS=326, SA Mining IP: Oil and gas extraction NAICS=211, SA IP: Mining (except oil and gas) NAICS=212, SA IP: Support activities for mining NAICS=213, SA Utilities IP: Electric power generation, transmission and distribution NAICS=2211, SA IP: Natural gas distribution NAICS=2212, SA
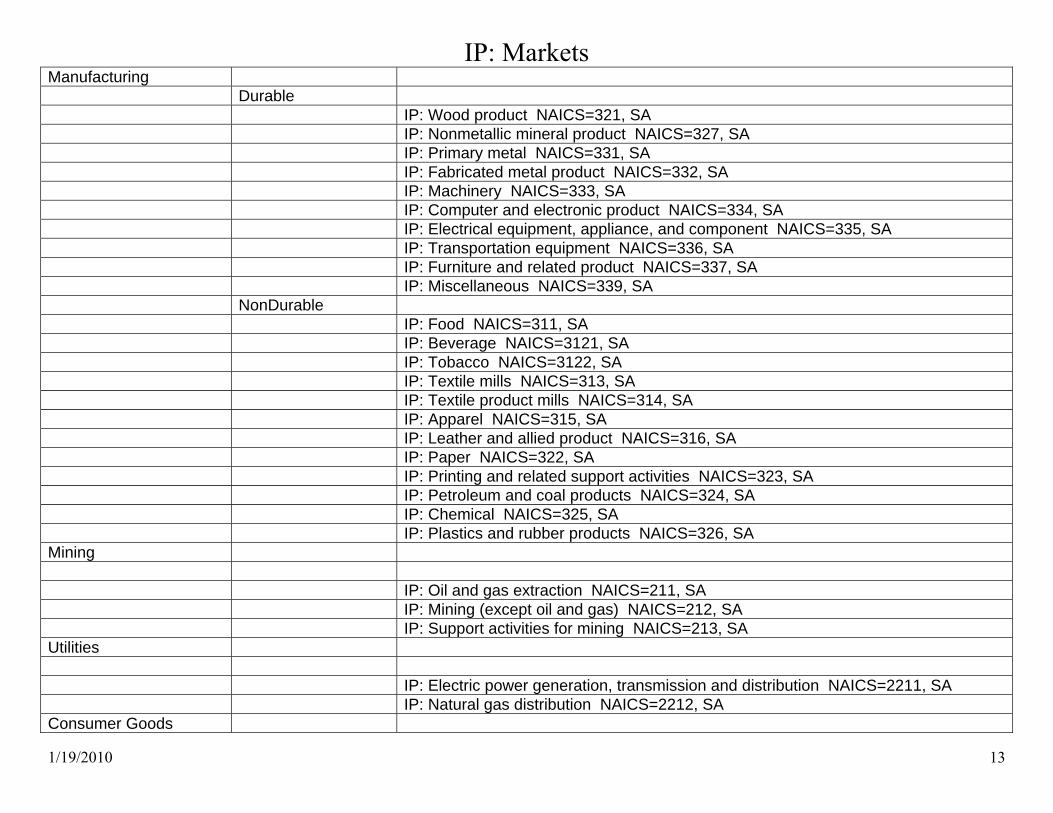
1/19/2010 13
IP: Markets Manufacturing Durable IP: Wood product NAICS=321, SA IP: Nonmetallic mineral product NAICS=327, SA IP: Primary metal NAICS=331, SA IP: Fabricated metal product NAICS=332, SA IP: Machinery NAICS=333, SA IP: Computer and electronic product NAICS=334, SA IP: Electrical equipment, appliance, and component NAICS=335, SA IP: Transportation equipment NAICS=336, SA IP: Furniture and related product NAICS=337, SA IP: Miscellaneous NAICS=339, SA NonDurable IP: Food NAICS=311, SA IP: Beverage NAICS=3121, SA IP: Tobacco NAICS=3122, SA IP: Textile mills NAICS=313, SA IP: Textile product mills NAICS=314, SA IP: Apparel NAICS=315, SA IP: Leather and allied product NAICS=316, SA IP: Paper NAICS=322, SA IP: Printing and related support activities NAICS=323, SA IP: Petroleum and coal products NAICS=324, SA IP: Chemical NAICS=325, SA IP: Plastics and rubber products NAICS=326, SA Mining IP: Oil and gas extraction NAICS=211, SA IP: Mining (except oil and gas) NAICS=212, SA IP: Support activities for mining NAICS=213, SA Utilities IP: Electric power generation, transmission and distribution NAICS=2211, SA IP: Natural gas distribution NAICS=2212, SA Consumer Goods

1/19/2010 14
Durables IP: Automotive products, SA IP: Autos and trucks, consumer, SA IP: Auto parts and allied goods, SA IP: Other durable goods, SA IP: Computers, video and audio equipment, SA IP: Appliances, furniture, and carpeting, SA IP: Miscellaneous durable goods, SA NonDurables IP: Foods and tobacco, SA IP: Clothing, SA IP: Chemical products, SA IP: Paper products, SA IP: Miscellaneous nondurable goods, SA IP: Consumer energy products, SA IP: Fuels, SA IP: Residential utilities, SA Equipment IP: Transit equipment, SA IP: Information processing and related equipment, SA IP: Industrial and other equipment, SA IP: Industrial equipment, SA IP: Other equipment, SA IP: Oil and gas well drilling and manufactured homes, SA IP: Defense and space equipment, SA Materials Durable Goods IP: Consumer parts, SA IP: Equipment parts, SA IP: Computer and other board assemblies and parts, SA IP: Semiconductors, printed circuit boards, and other, SA IP: Other equipment parts, SA IP: Other durable materials, SA IP: Basic metals, SA IP: Miscellaneous durable materials, SA NonDurable Goods IP: Textile materials, SA
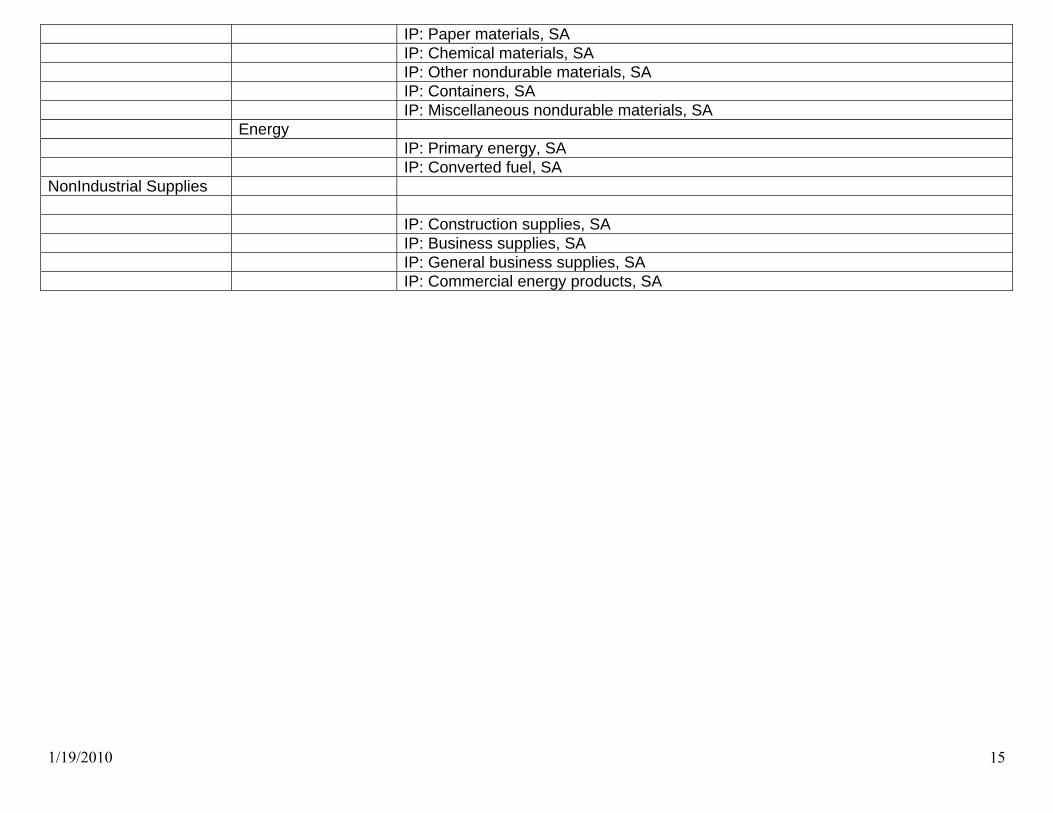
1/19/2010 15
IP: Paper materials, SA IP: Chemical materials, SA IP: Other nondurable materials, SA IP: Containers, SA IP: Miscellaneous nondurable materials, SA Energy IP: Primary energy, SA IP: Converted fuel, SA NonIndustrial Supplies IP: Construction supplies, SA IP: Business supplies, SA IP: General business supplies, SA IP: Commercial energy products, SA
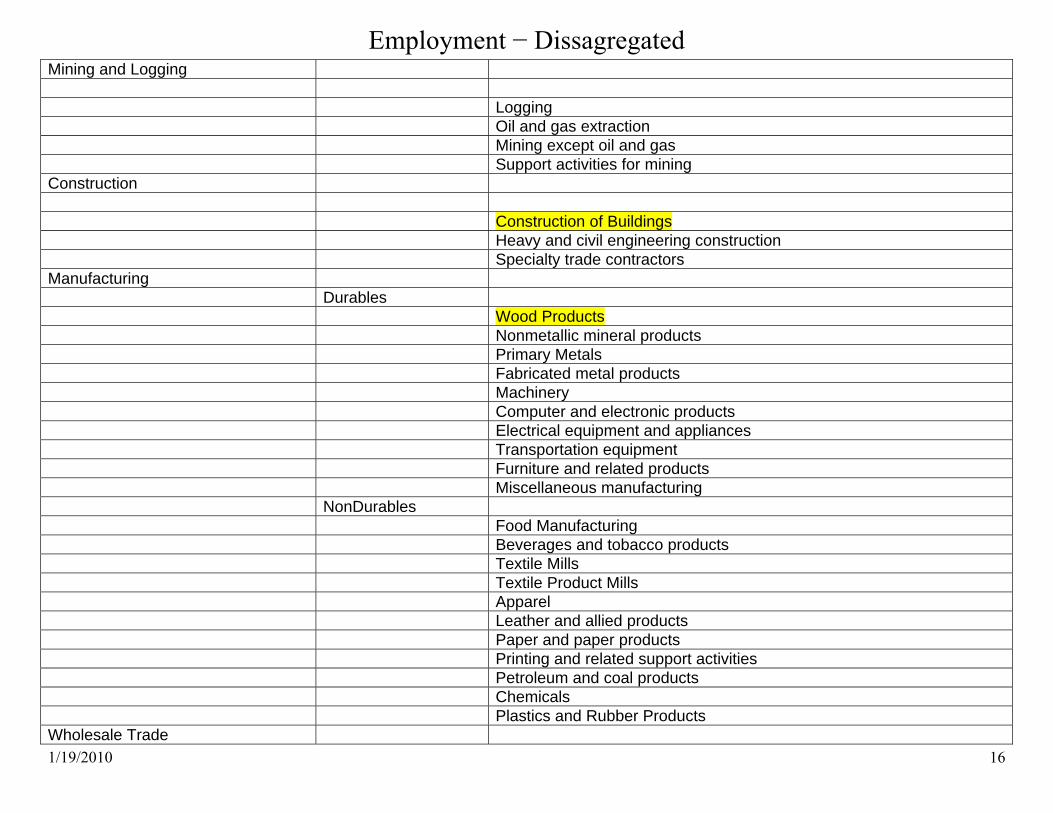
1/19/2010 16
Employment − Dissagregated Mining and Logging Logging Oil and gas extraction Mining except oil and gas Support activities for mining Construction Construction of Buildings Heavy and civil engineering construction Specialty trade contractors Manufacturing Durables Wood Products Nonmetallic mineral products Primary Metals Fabricated metal products Machinery Computer and electronic products Electrical equipment and appliances Transportation equipment Furniture and related products Miscellaneous manufacturing NonDurables Food Manufacturing Beverages and tobacco products Textile Mills Textile Product Mills Apparel Leather and allied products Paper and paper products Printing and related support activities Petroleum and coal products Chemicals Plastics and Rubber Products Wholesale Trade

1/19/2010 17
Durable Goods NonDurable Goods Electronic markets and agents and brokers Retail Trade Motor vehicle and parts dealers Furniture and home furnishings stores Electronics and appliance stores Building material and garden supply stores Food and beverage stores Health and personal care stores Gasoline stations Clothing and clothing accessories stores Sporting goods, hobby, boo, and music stores General merchandise stores Miscellaneous store retailers Nonstore retailers Transportation and warehousing
Air transportation Rail transportation Water transportation Truck transportation Transit and ground passenger transportation Pipeline transportation Scenic and sightseeing transportation Support activities for transportation Couriers and messengers Warehousing and storage Utilities Utilities Informatio Publishing industries Motion picture and sound recording industries
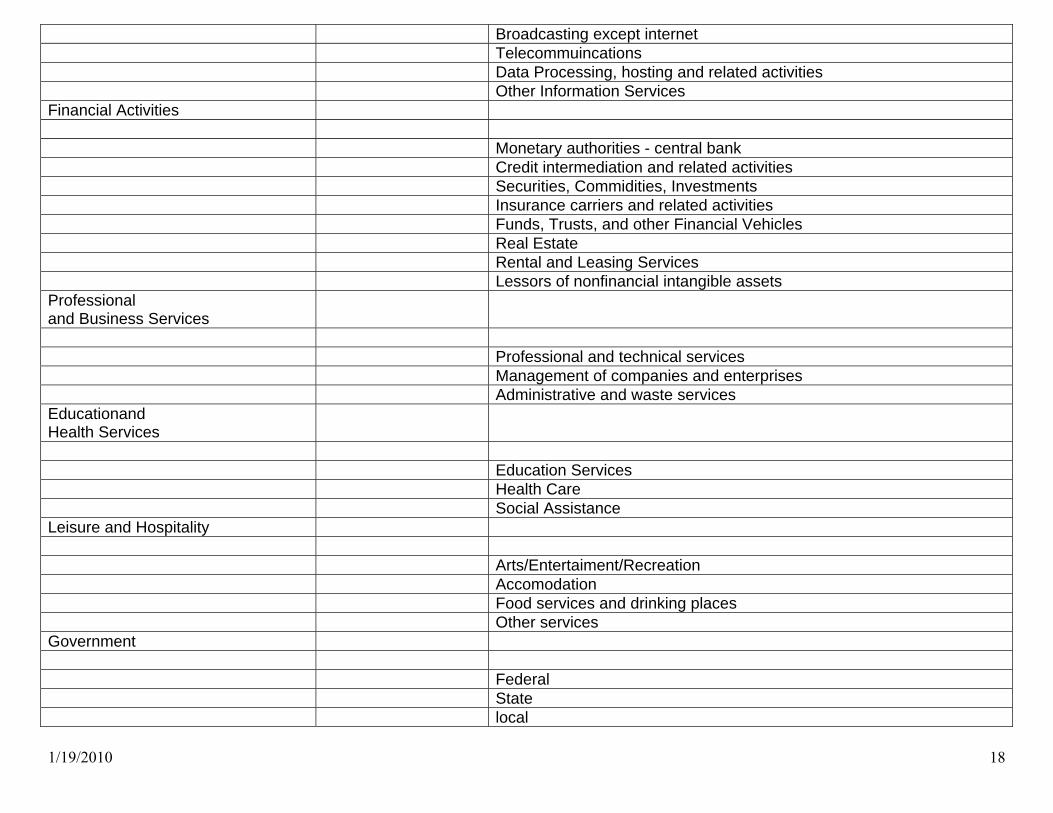
1/19/2010 18
Broadcasting except internet Telecommuincations Data Processing, hosting and related activities Other Information Services Financial Activities Monetary authorities - central bank Credit intermediation and related activities Securities, Commidities, Investments Insurance carriers and related activities Funds, Trusts, and other Financial Vehicles Real Estate Rental and Leasing Services Lessors of nonfinancial intangible assets Professional and Business Services
Professional and technical services Management of companies and enterprises Administrative and waste services Educationand Health Services
Education Services Health Care Social Assistance Leisure and Hospitality Arts/Entertaiment/Recreation Accomodation Food services and drinking places Other services Government Federal State local
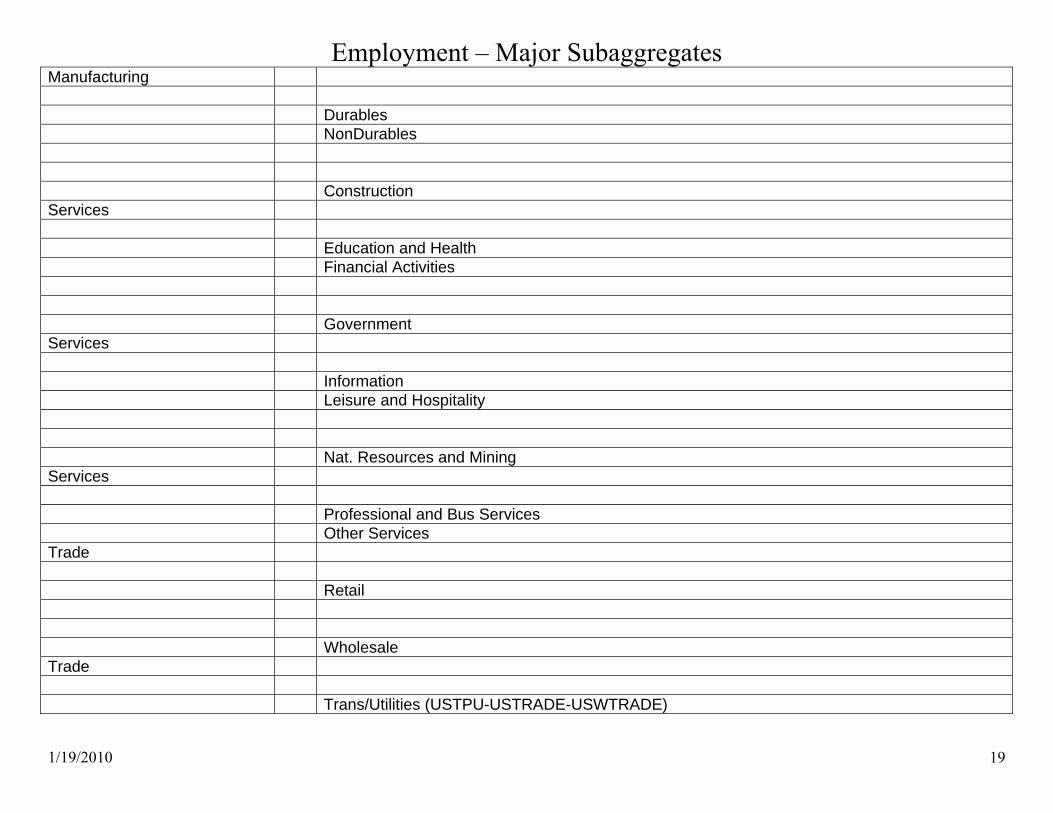
1/19/2010 19
Employment – Major Subaggregates Manufacturing Durables NonDurables Construction Services Education and Health Financial Activities Government Services Information Leisure and Hospitality Nat. Resources and Mining Services Professional and Bus Services Other Services Trade Retail Wholesale Trade Trans/Utilities (USTPU-USTRADE-USWTRADE)
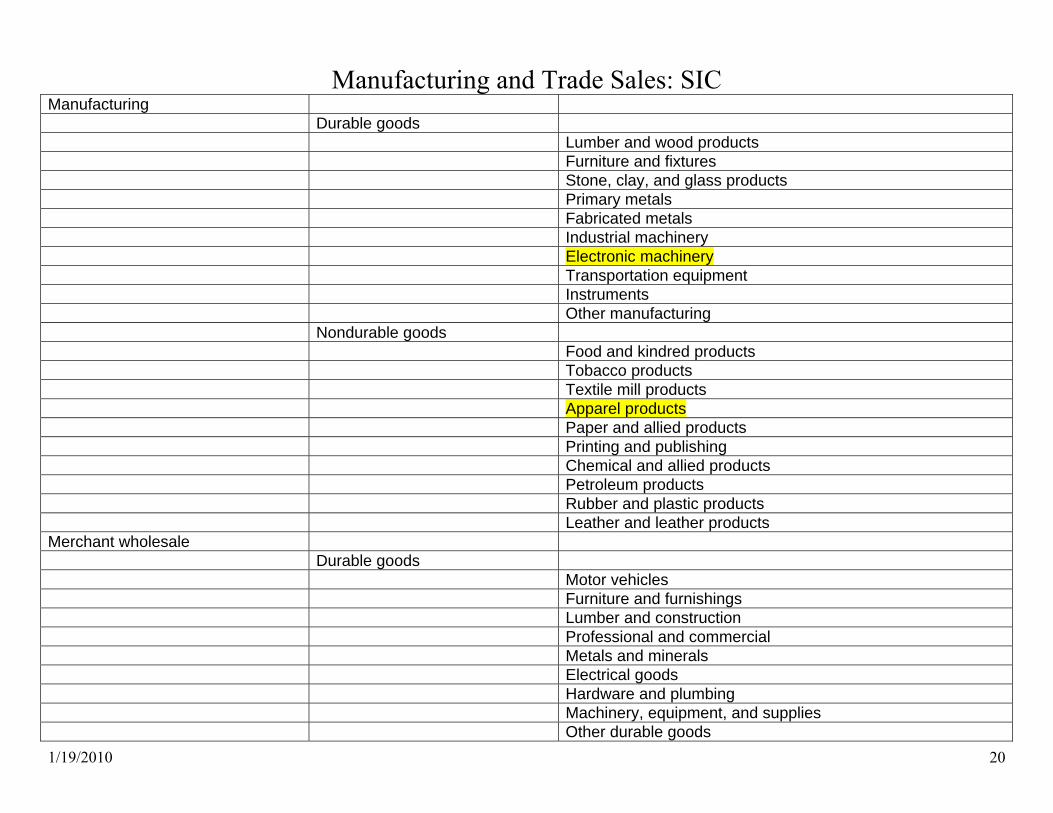
1/19/2010 20
Manufacturing and Trade Sales: SIC Manufacturing Durable goods Lumber and wood products Furniture and fixtures Stone, clay, and glass products Primary metals Fabricated metals Industrial machinery Electronic machinery Transportation equipment Instruments Other manufacturing Nondurable goods Food and kindred products Tobacco products Textile mill products Apparel products Paper and allied products Printing and publishing Chemical and allied products Petroleum products Rubber and plastic products Leather and leather products Merchant wholesale Durable goods Motor vehicles Furniture and furnishings Lumber and construction Professional and commercial Metals and minerals Electrical goods Hardware and plumbing Machinery, equipment, and supplies Other durable goods
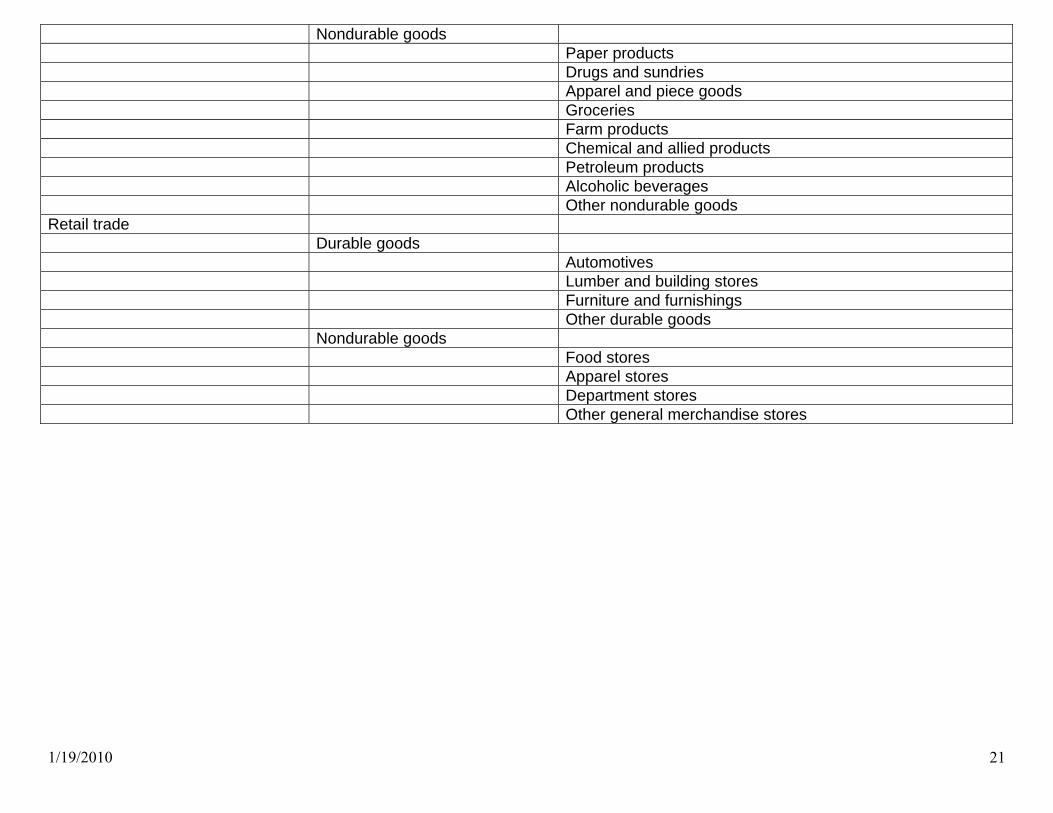
1/19/2010 21
Nondurable goods Paper products Drugs and sundries Apparel and piece goods Groceries Farm products Chemical and allied products Petroleum products Alcoholic beverages Other nondurable goods Retail trade Durable goods Automotives Lumber and building stores Furniture and furnishings Other durable goods Nondurable goods Food stores Apparel stores Department stores Other general merchandise stores

1/19/2010 22
Manufacturing and Trade Sales: NAICS Manufacturing industries Durable goods manufacturing industries Wood product manufacturing Nonmetallic mineral product manufacturing Primary metal manufacturing Fabricated metal product manufacturing Machinery manufacturing Computer and electronic product manufacturing Electrical equipment, appliance, and component
manufacturing Transportation equipment manufacturing Furniture and related product manufacturing Miscellaneous durable goods manufacturing Nondurable goods manufacturing industries Food manufacturing Beverage and tobacco product manufacturing Textile mills Textile product mills Apparel manufacturing Leather and allied product manufacturing Paper manufacturing Printing and related support activities Petroleum and coal product manufacturing Chemical manufacturing Plastics and rubber product manufacturing Merchant wholesale industries
Durable goods merchant wholesale industries
Motor vehicles, parts, and supplies wholesalers Furniture and home furnishings wholesalers Lumber and other construction materials wholesalers Professional and commercial equipment wholesalers Metal and mineral (except petroleum) wholesalers Electrical goods wholesalers
1/19/2010 23
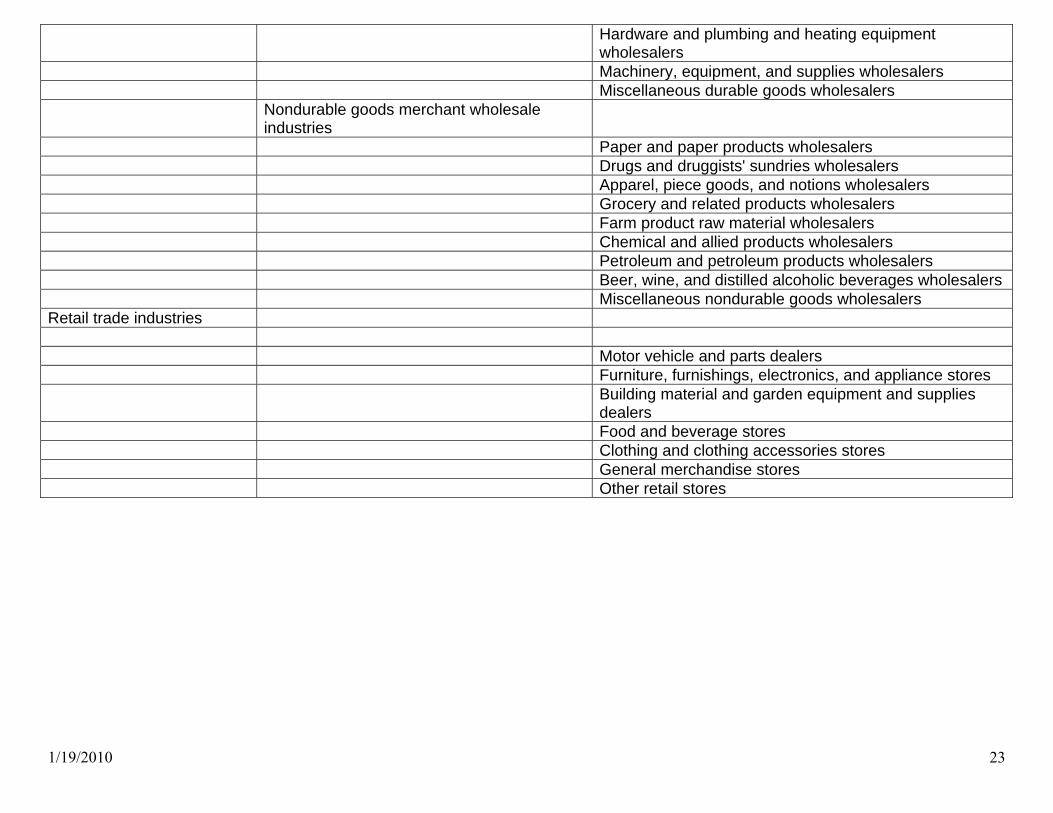
Hardware and plumbing and heating equipment wholesalers
Machinery, equipment, and supplies wholesalers Miscellaneous durable goods wholesalers Nondurable goods merchant wholesale
industries
Paper and paper products wholesalers Drugs and druggists' sundries wholesalers Apparel, piece goods, and notions wholesalers Grocery and related products wholesalers Farm product raw material wholesalers Chemical and allied products wholesalers Petroleum and petroleum products wholesalers Beer, wine, and distilled alcoholic beverages wholesalers Miscellaneous nondurable goods wholesalers Retail trade industries Motor vehicle and parts dealers Furniture, furnishings, electronics, and appliance stores Building material and garden equipment and supplies
dealers Food and beverage stores Clothing and clothing accessories stores General merchandise stores Other retail stores
1/19/2010 24
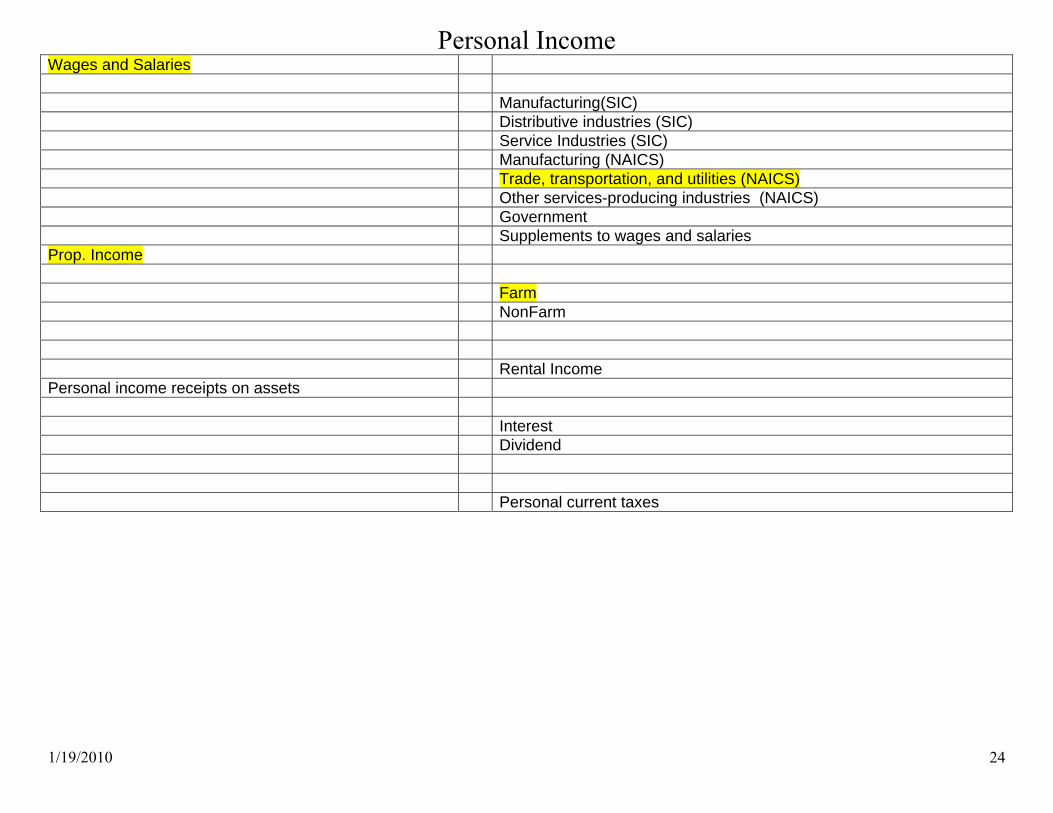
Personal Income Wages and Salaries Manufacturing(SIC) Distributive industries (SIC) Service Industries (SIC) Manufacturing (NAICS) Trade, transportation, and utilities (NAICS) Other services-producing industries (NAICS) Government Supplements to wages and salaries Prop. Income Farm NonFarm Rental Income Personal income receipts on assets Interest Dividend Personal current taxes
1/19/2010 25
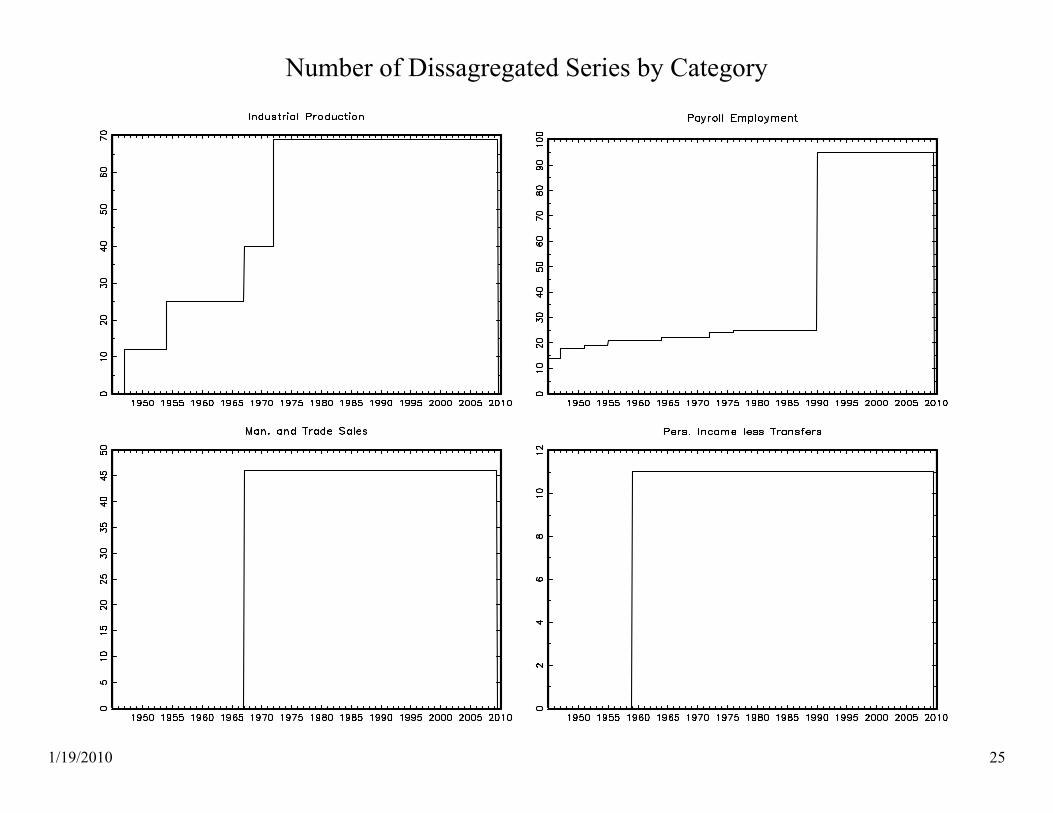
Number of Dissagregated Series by Category
1/19/2010 26
A first look at the data
1/19/2010 27
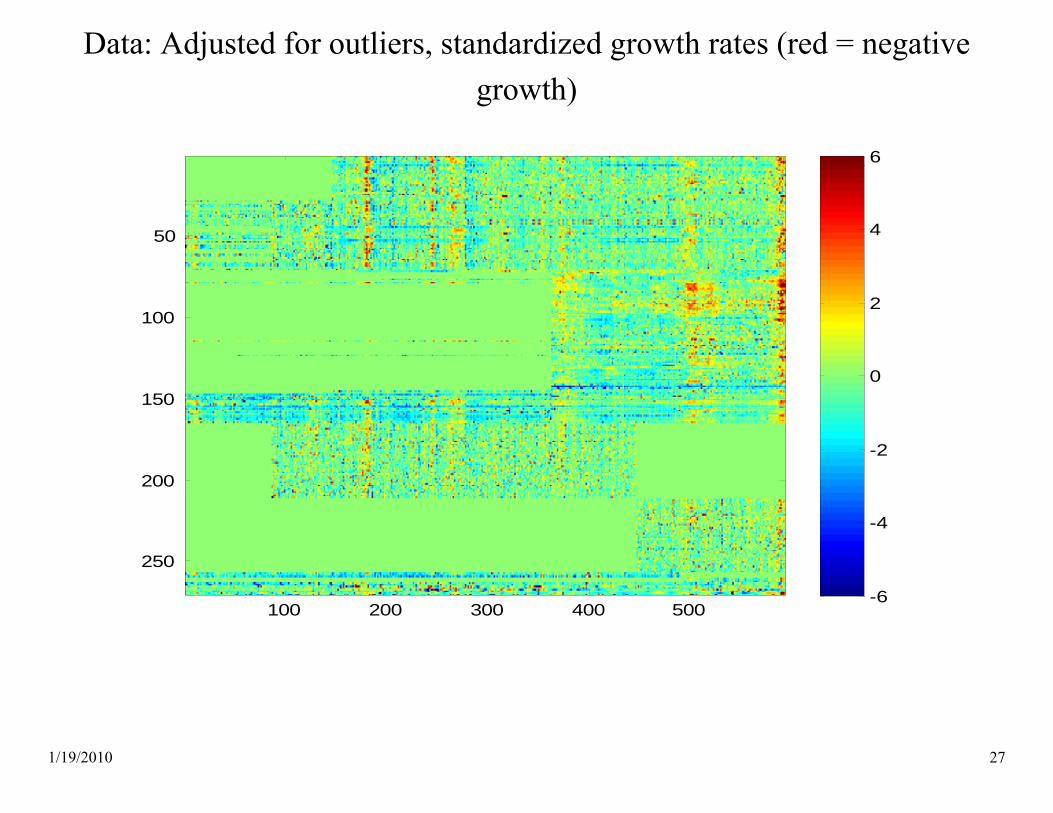
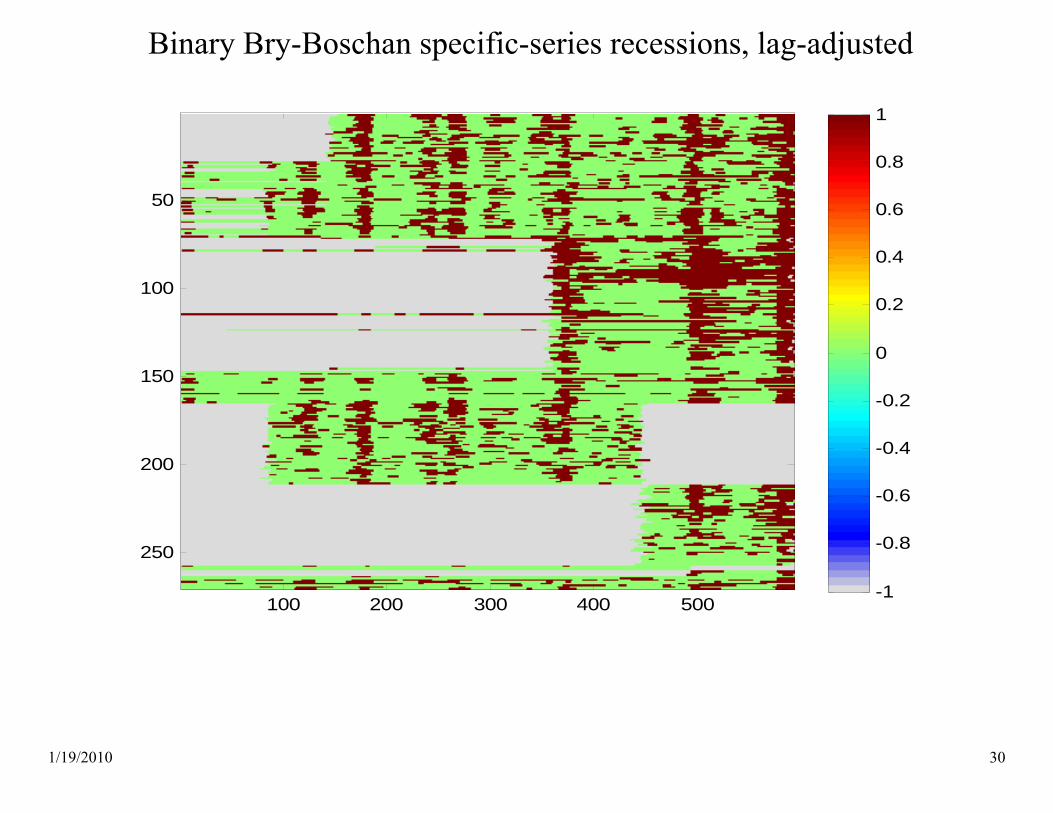
Data: Adjusted for outliers, standardized growth rates (red = negative growth)
100 200 300 400 500
50
100
150
200
250
-6
-4
-2
0
2
4
6
1/19/2010 28
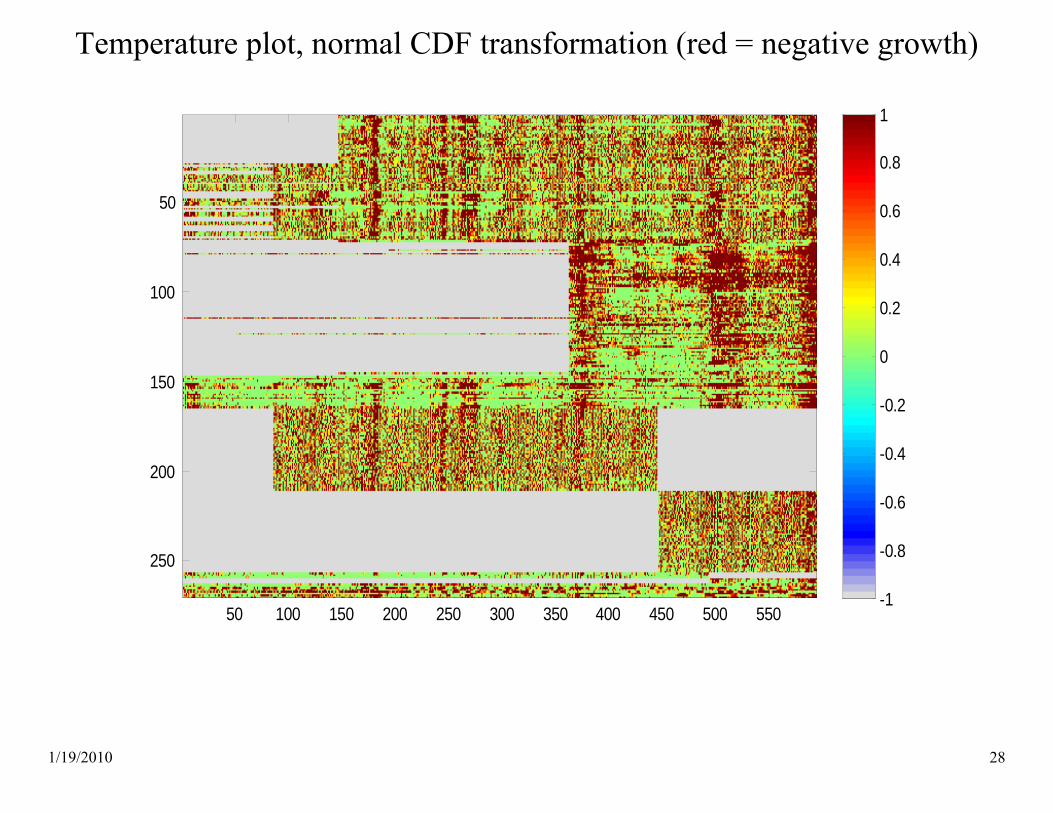
Temperature plot, normal CDF transformation (red = negative growth)
50 100 150 200 250 300 350 400 450 500 550
50
100
150
200
250
-1
-0.8
-0.6
-0.4
-0.2
0
0.2
0.4
0.6
0.8
1
1/19/2010 29
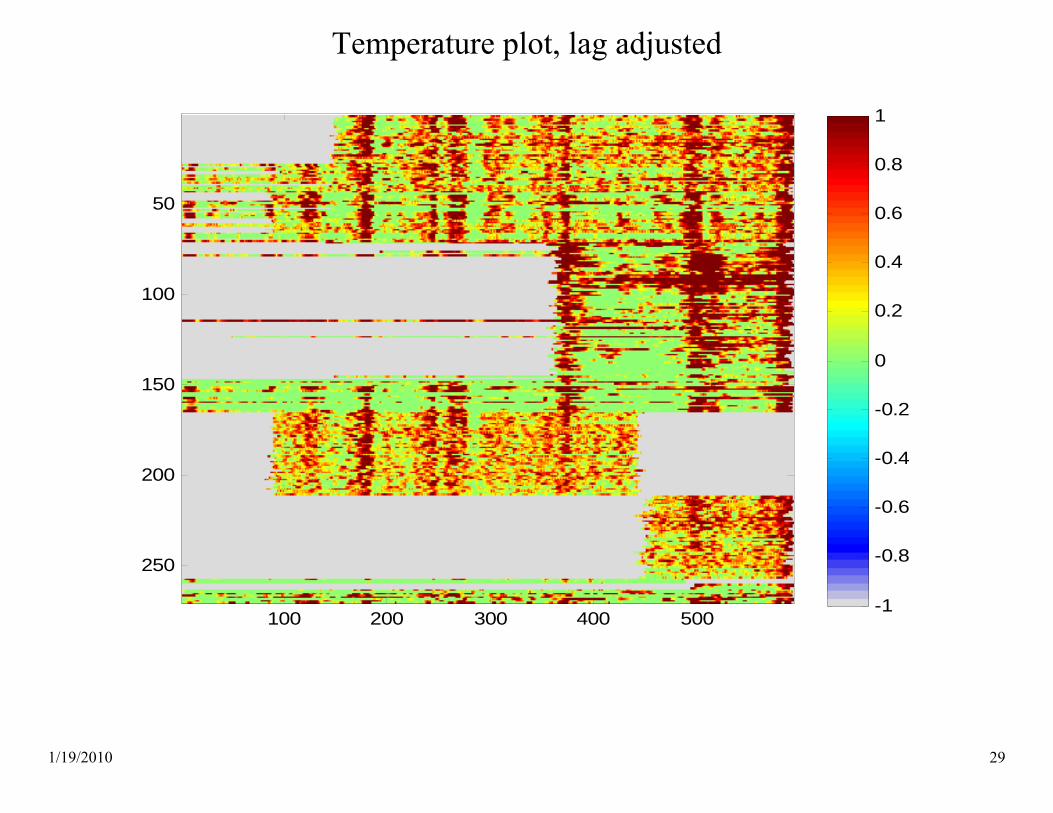
Temperature plot, lag adjusted
100 200 300 400 500
50
100
150
200
250
-1
-0.8
-0.6
-0.4
-0.2
0
0.2
0.4
0.6
0.8
1
1/19/2010 30
Binary Bry-Boschan specific-series recessions, lag-adjusted
100 200 300 400 500
50
100
150
200
250
-1
-0.8
-0.6
-0.4
-0.2
0
0.2
0.4
0.6
0.8
1

1/19/2010 31
Outline
1) Literature review (brief) 2) Econometric theory I: Specific cycles 3) Econometric theory II: Reference cycles 4) Empirical results I: Aggregates 5) Empirical results II: Disaggregates 6) Conclusions

1/19/2010 32
1) Literature review (brief, incomplete) Early literature
Burns and Mitchell (1946), Zarnowitz (1972), Zarnowitz and Moore (1991), Vaccara and Zarnowitz (1977), Bry and Boschan (1971)
Nonparametric Wecker (1979), Canova (1994), Zellner and Hong (1991), Harding and Pagan (2002, 2003, 2006, 2009), Watson (1994)
Parametric/filtering Stock-Watson (1989, 1991), Hamilton (1989), Kim and Nelson (1999), Chauvet and Hamilton (2005), Kauppi and Saikkonen (2008), Chauvet and Piger (2003, 2008), Startz (2008), Berge and Jordà (2009), Morley and Piger (2009), Hamilton and Owyang (2009)
1/19/2010 33
2) Econometric theory I: Specific cycles Some econometric theory questions: • What is the estimand • What are good estimators? • How to quantify (sampling) uncertainty? • Does the theory of optimal estimation entail the use of disaggregated
data? Empirical questions: • Is there a trivial model for the NBER estimand? • How do methods based on the aggregates perform? • How do methods based on disaggregates perform? • Do disaggregates help in estimating TPs?
1/19/2010 34
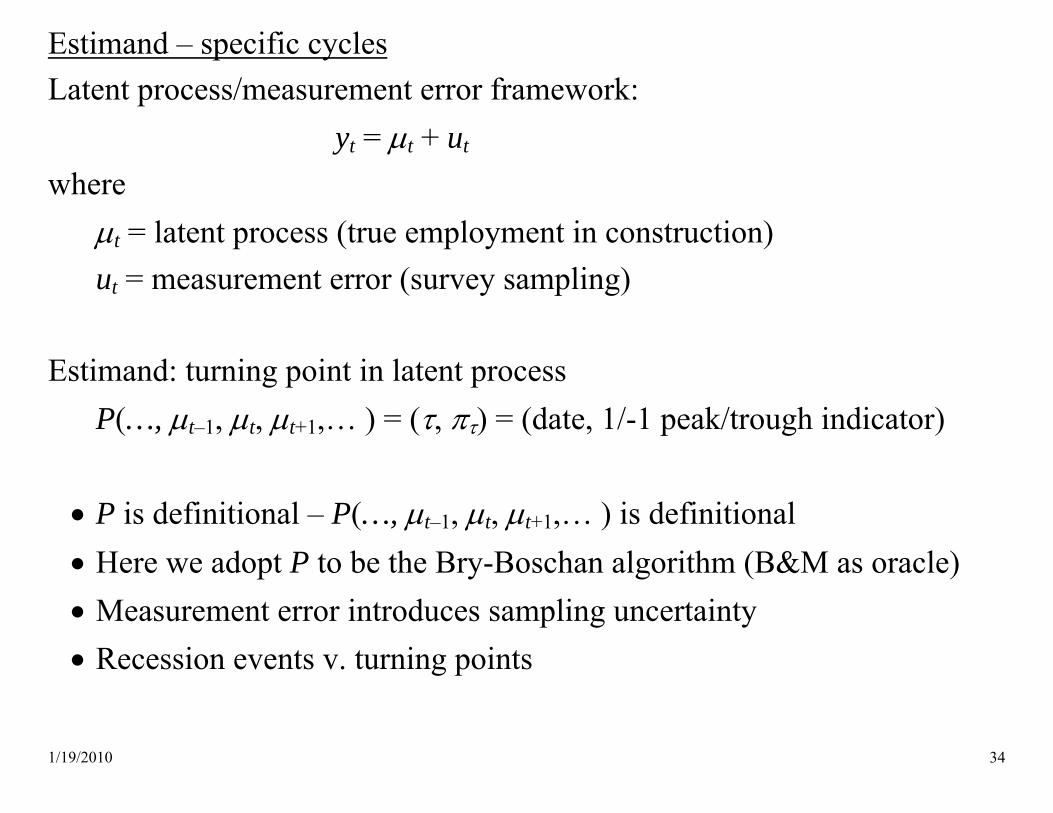
Estimand – specific cycles Latent process/measurement error framework:
yt = μt + ut where
μt = latent process (true employment in construction) ut = measurement error (survey sampling)
Estimand: turning point in latent process
P(…, μt–1, μt, μt+1,… ) = (τ, πτ) = (date, 1/-1 peak/trough indicator) • P is definitional – P(…, μt–1, μt, μt+1,… ) is definitional • Here we adopt P to be the Bry-Boschan algorithm (B&M as oracle) • Measurement error introduces sampling uncertainty • Recession events v. turning points
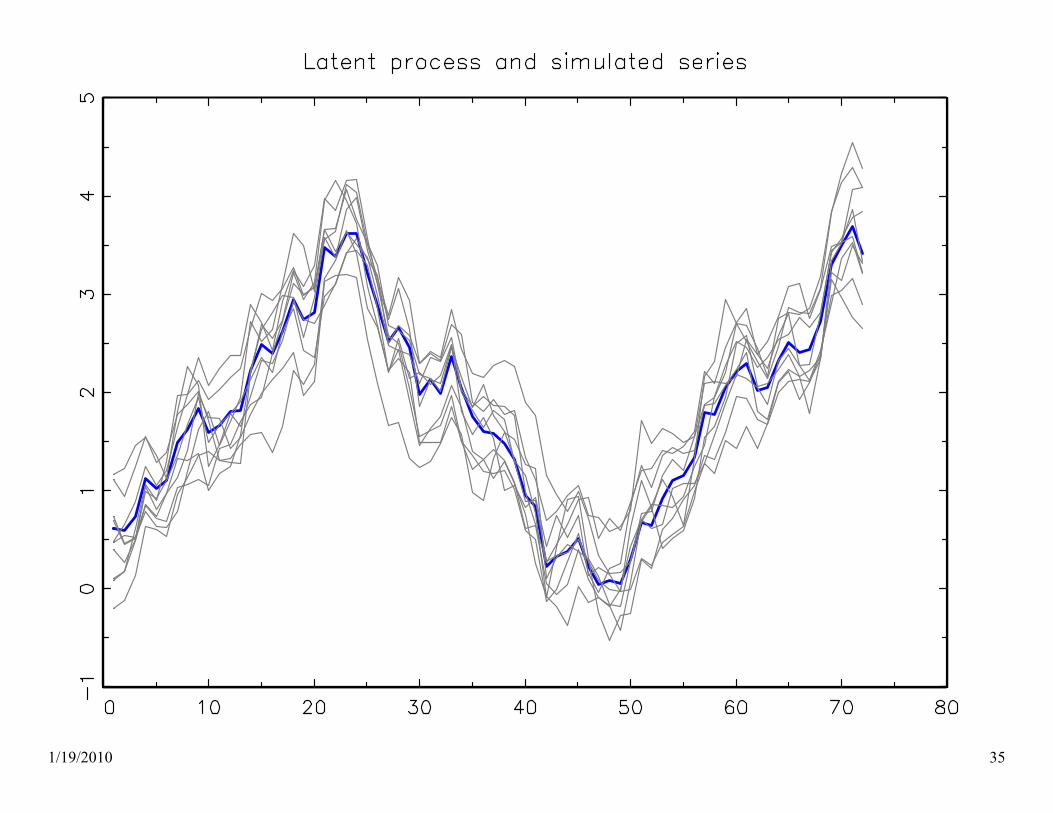
1/19/2010 35
1/19/2010 36
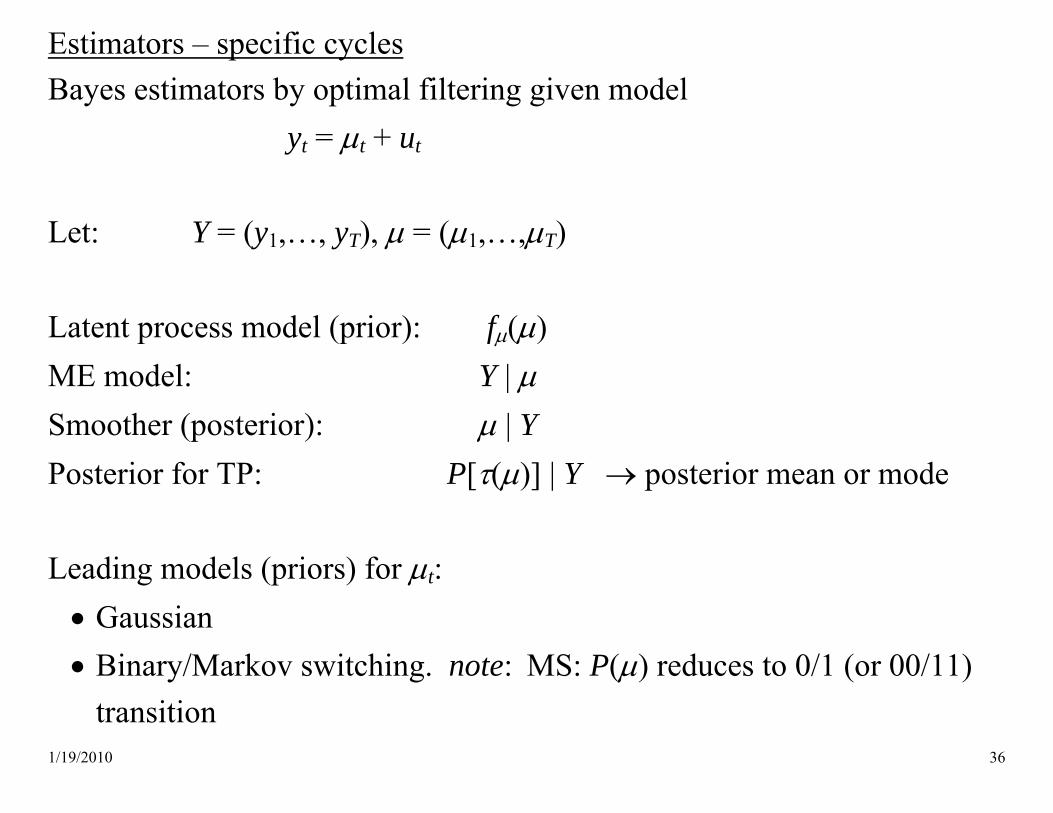
Estimators – specific cycles Bayes estimators by optimal filtering given model
yt = μt + ut Let: Y = (y1,…, yT), μ = (μ1,…,μT) Latent process model (prior): fμ(μ) ME model: Y | μ Smoother (posterior): μ | Y Posterior for TP: P[τ(μ)] | Y → posterior mean or mode Leading models (priors) for μt: • Gaussian • Binary/Markov switching. note: MS: P(μ) reduces to 0/1 (or 00/11)
transition

1/19/2010 37
Estimators – specific cycles, ctd.
yt = μt + ut Frequentist estimators: Treat (τ, πτ) as nonrandom parameters where τ = P(…, μt–1, μt, μt+1,… ) where {μt} are unknown. • Nonparametric (or ML): τ̂ = P(yt–p,…, yt+p)
• Properties of estimators:
( )ˆ { } , ( )k
t t kf f g uττ τμ +
= −=
Work underway
1/19/2010 38
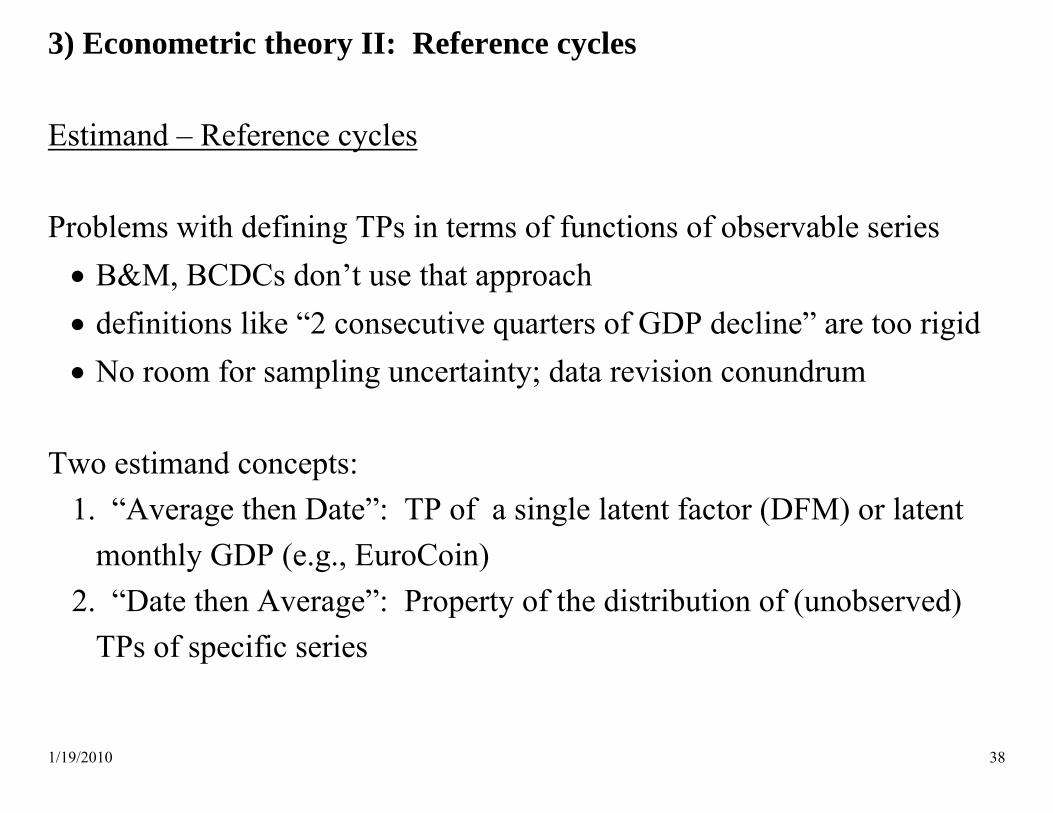
3) Econometric theory II: Reference cycles Estimand – Reference cycles Problems with defining TPs in terms of functions of observable series • B&M, BCDCs don’t use that approach • definitions like “2 consecutive quarters of GDP decline” are too rigid • No room for sampling uncertainty; data revision conundrum
Two estimand concepts:
1. “Average then Date”: TP of a single latent factor (DFM) or latent monthly GDP (e.g., EuroCoin)
2. “Date then Average”: Property of the distribution of (unobserved) TPs of specific series
1/19/2010 39
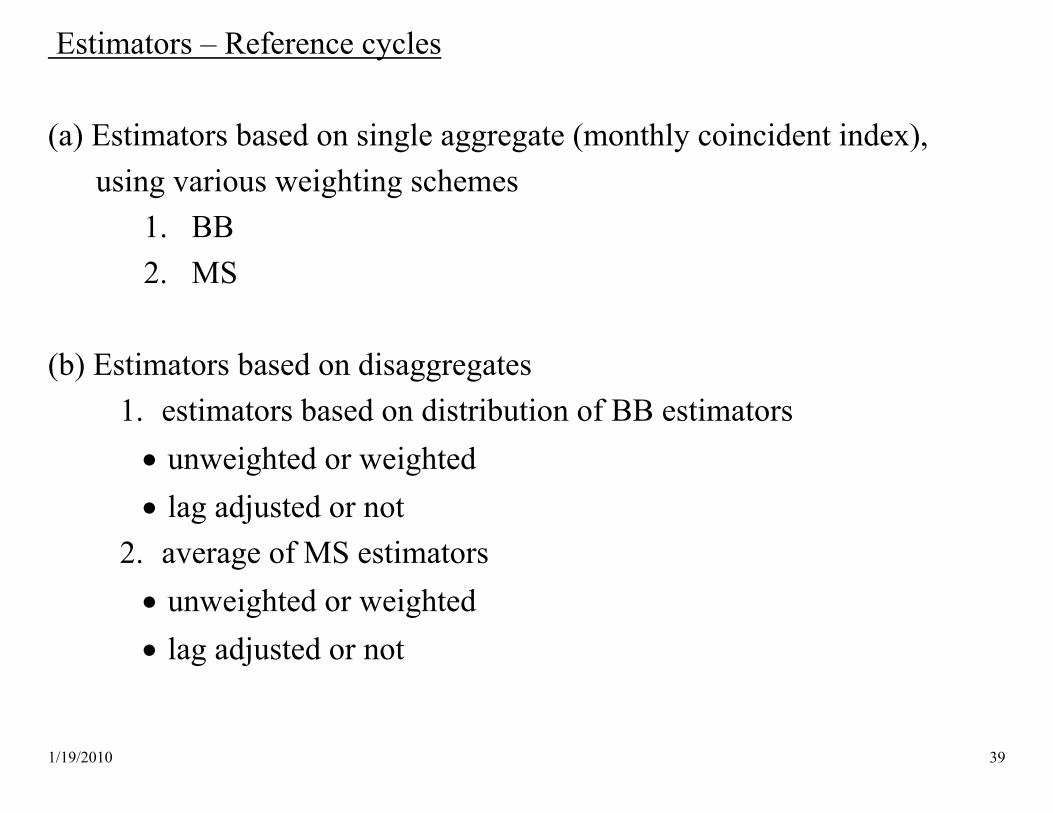
Estimators – Reference cycles (a) Estimators based on single aggregate (monthly coincident index),
using various weighting schemes 1. BB 2. MS
(b) Estimators based on disaggregates
1. estimators based on distribution of BB estimators • unweighted or weighted • lag adjusted or not
2. average of MS estimators • unweighted or weighted • lag adjusted or not

1/19/2010 40
4) Empirical results I: Aggregates Aggregate data • Monthly, U.S., 1959:1 – 2009:7
• Aggregates are coincident economic indexes –wtd averages of logs of:
1. Index of industrial production 2. Nonfarm employment 3. Real manufacturing and wholesale/retail trade sales 4. Real personal income less transfers

1/19/2010 41
Aggregation methods
• Simple and weighted averages (including The Conference Board)
• DFM : ΔXt = λΔCt + Ut, ΔCt ~ AR(2), Ut ~ AR(2)
(Factor normalized so that weight on ΔXt (with leads and lags) = 1)
Average Inverse Std Dev TCB DFM
Mean (×1200)
2.54 2.33 2.28 2.61
SD (×1200) 6.07 4.29 4.54 6.76 Weights
IP 0.25 0.14 0.14 0.62 EMP 0.25 0.49 0.57 0.09
MT 0.25 0.11 0.12 0.19 PI 0.25 0.26 0.17 0.11

1/19/2010 42
Estimators BB: Bry-Boschan algorithm
1/19/2010 43
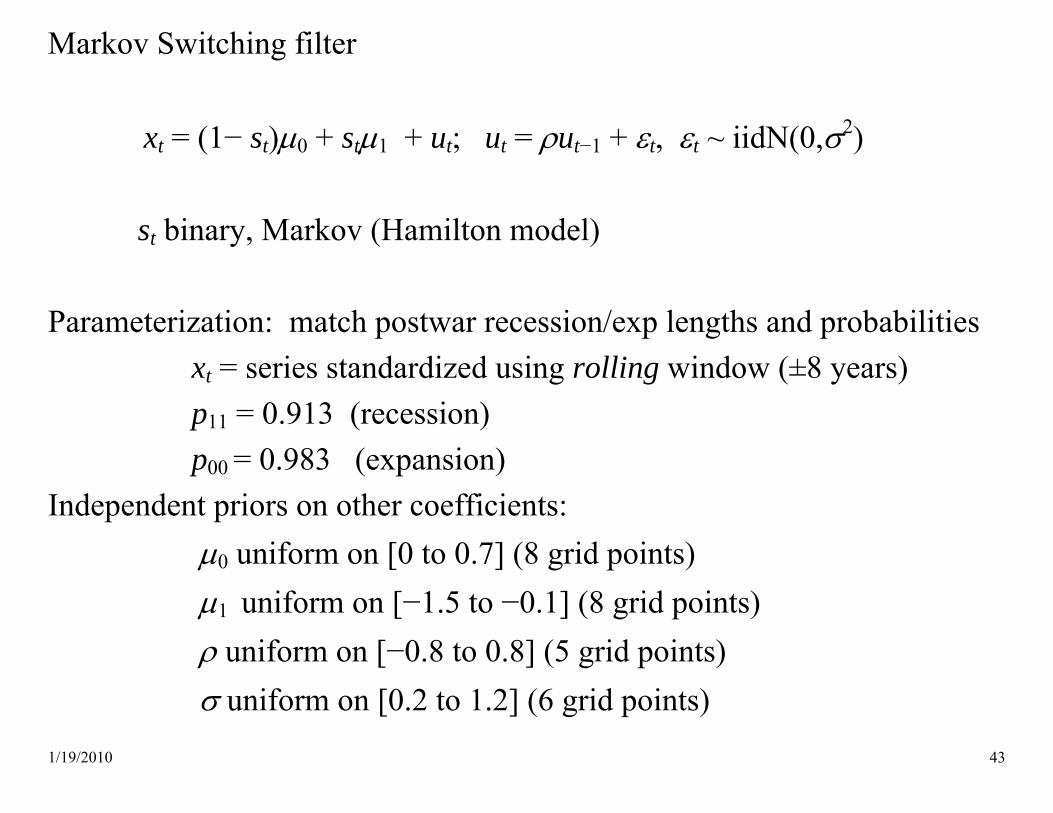
Markov Switching filter xt = (1− st)μ0 + stμ1 + ut; ut = ρut−1 + εt, εt ~ iidN(0,σ2)
st binary, Markov (Hamilton model)
Parameterization: match postwar recession/exp lengths and probabilities xt = series standardized using rolling window (±8 years) p11 = 0.913 (recession) p00 = 0.983 (expansion) Independent priors on other coefficients:
μ0 uniform on [0 to 0.7] (8 grid points) μ1 uniform on [−1.5 to −0.1] (8 grid points) ρ uniform on [−0.8 to 0.8] (5 grid points) σ uniform on [0.2 to 1.2] (6 grid points)
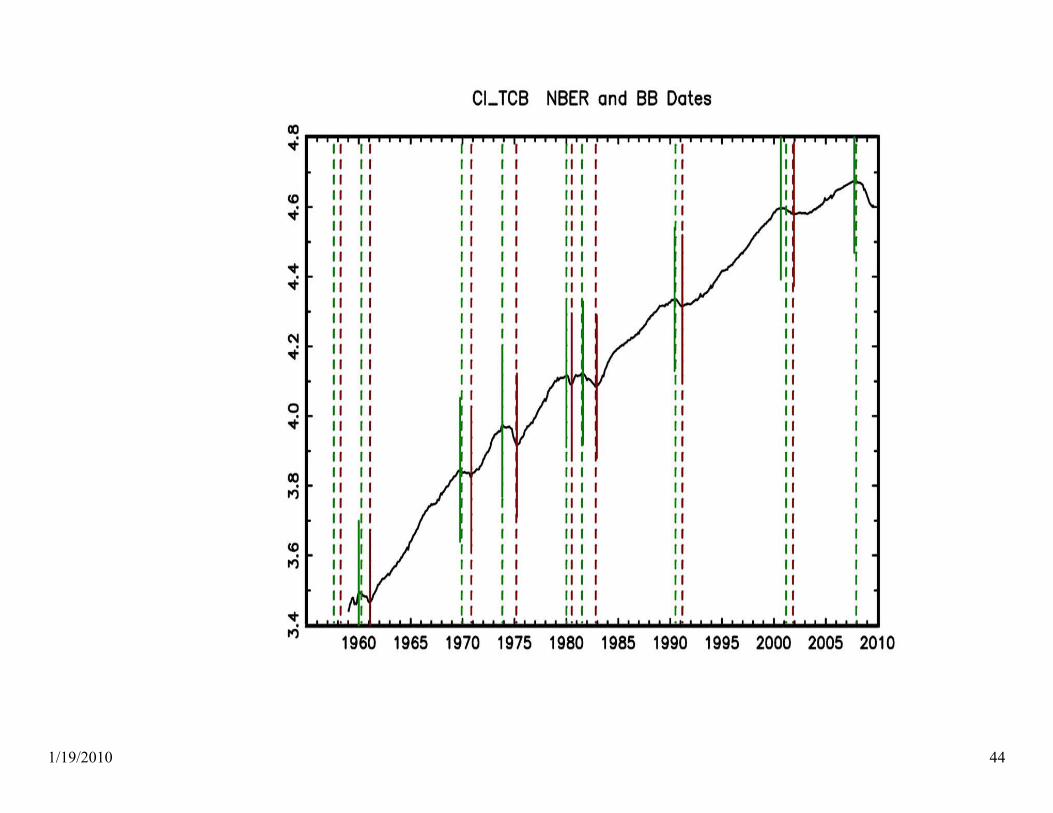
1/19/2010 44

1/19/2010 45

1/19/2010 46

1/19/2010 47
1/19/2010 48
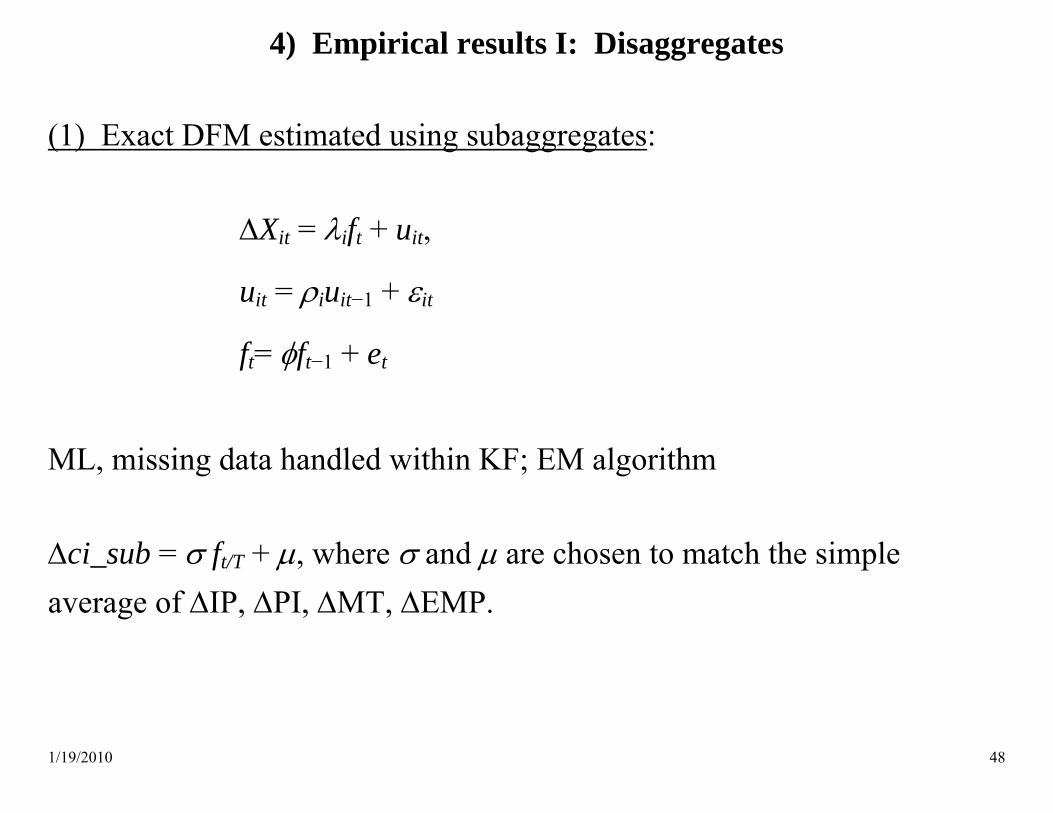
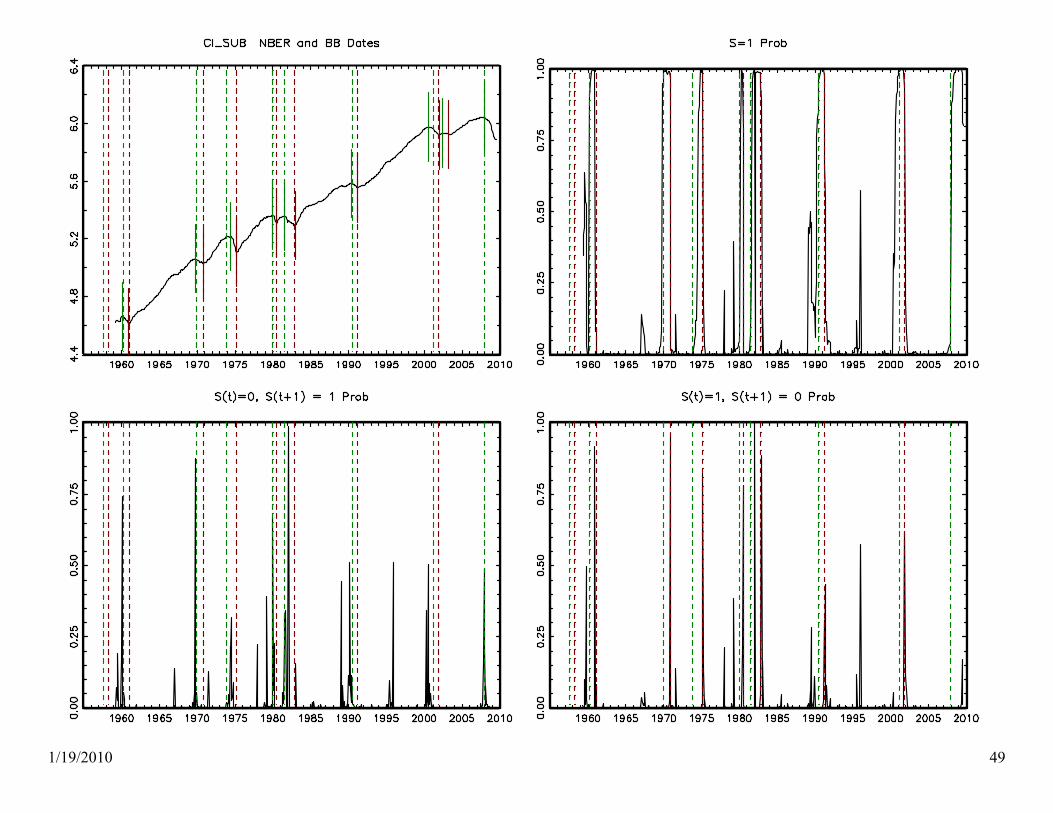
4) Empirical results I: Disaggregates (1) Exact DFM estimated using subaggregates:
ΔXit = λift + uit,
uit = ρiuit−1 + εit
ft= φft−1 + et
ML, missing data handled within KF; EM algorithm Δci_sub = σ ft/T + μ, where σ and μ are chosen to match the simple average of ΔIP, ΔPI, ΔMT, ΔEMP.
1/19/2010 49
1/19/2010 50
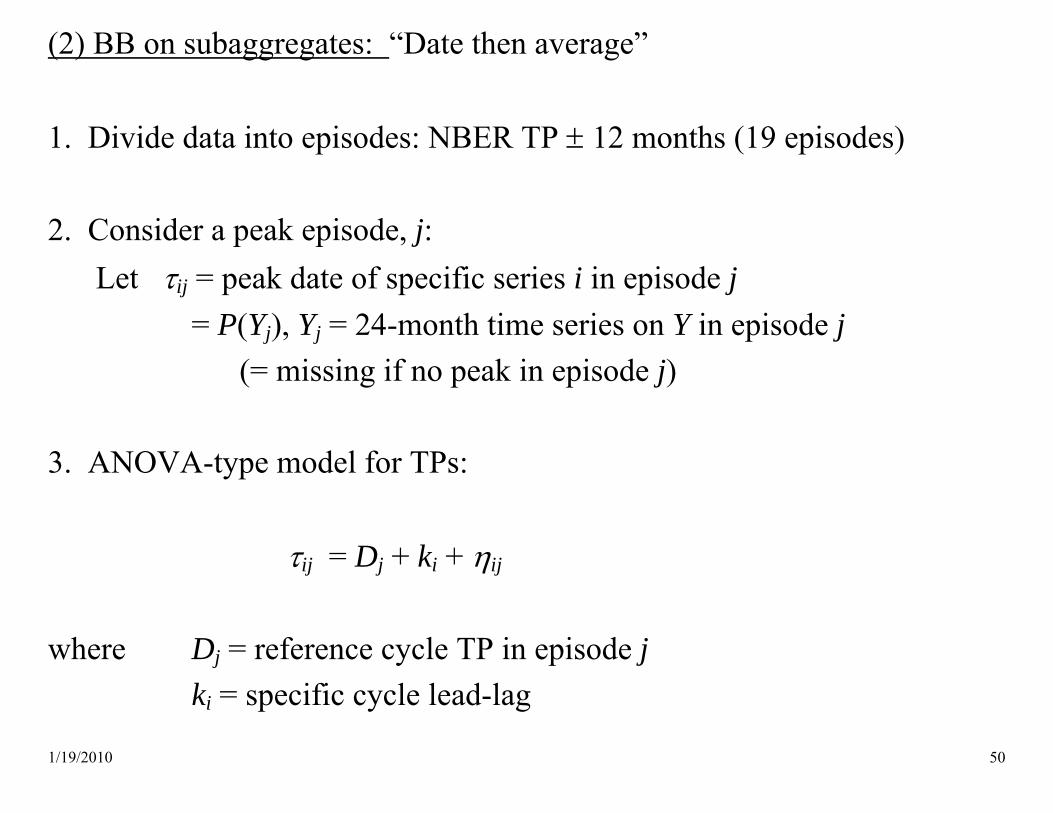
(2) BB on subaggregates: “Date then average” 1. Divide data into episodes: NBER TP ± 12 months (19 episodes) 2. Consider a peak episode, j:
Let τij = peak date of specific series i in episode j = P(Yj), Yj = 24-month time series on Y in episode j
(= missing if no peak in episode j) 3. ANOVA-type model for TPs:
τij = Dj + ki + ηij
where Dj = reference cycle TP in episode j ki = specific cycle lead-lag
1/19/2010 51
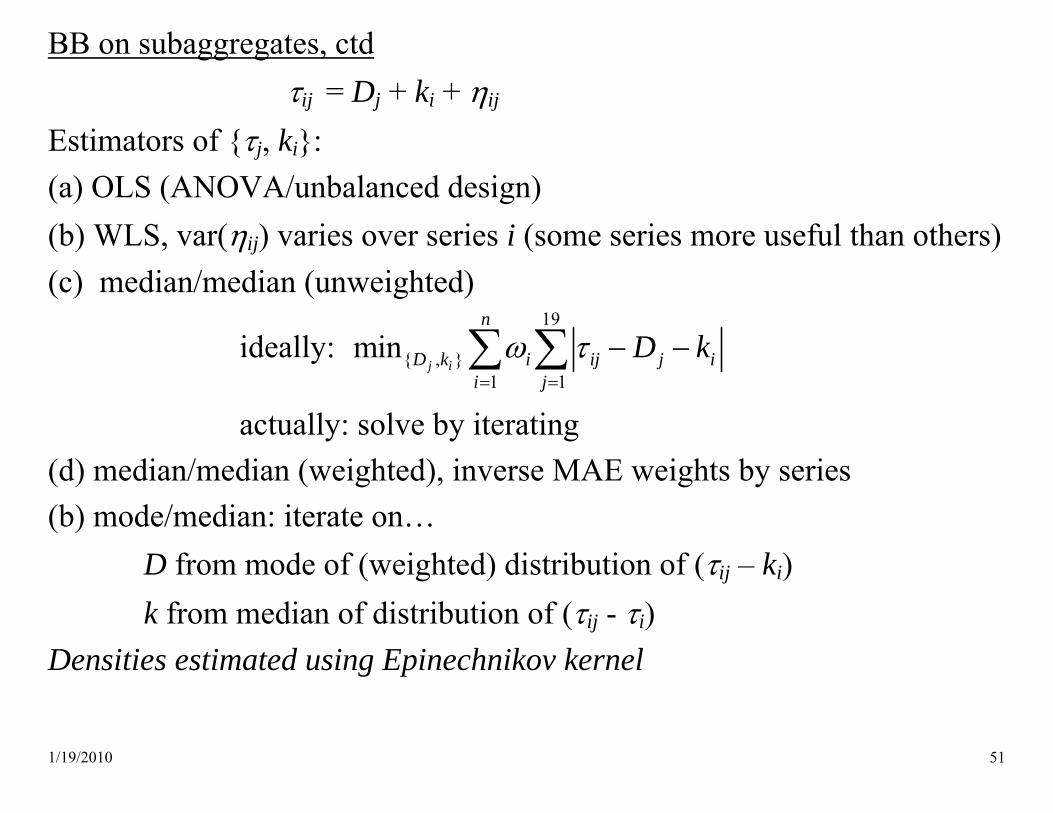
BB on subaggregates, ctd τij = Dj + ki + ηij
Estimators of {τj, ki}: (a) OLS (ANOVA/unbalanced design) (b) WLS, var(ηij) varies over series i (some series more useful than others) (c) median/median (unweighted)
ideally: 19
{ , }1 1
minj i
n
D k i ij j ii j
D kω τ= =
− −∑ ∑
actually: solve by iterating
(d) median/median (weighted), inverse MAE weights by series (b) mode/median: iterate on…
D from mode of (weighted) distribution of (τij – ki) k from median of distribution of (τij - τi)
Densities estimated using Epinechnikov kernel
1/19/2010 52

1/19/2010 53
1/19/2010 54
1/19/2010 55
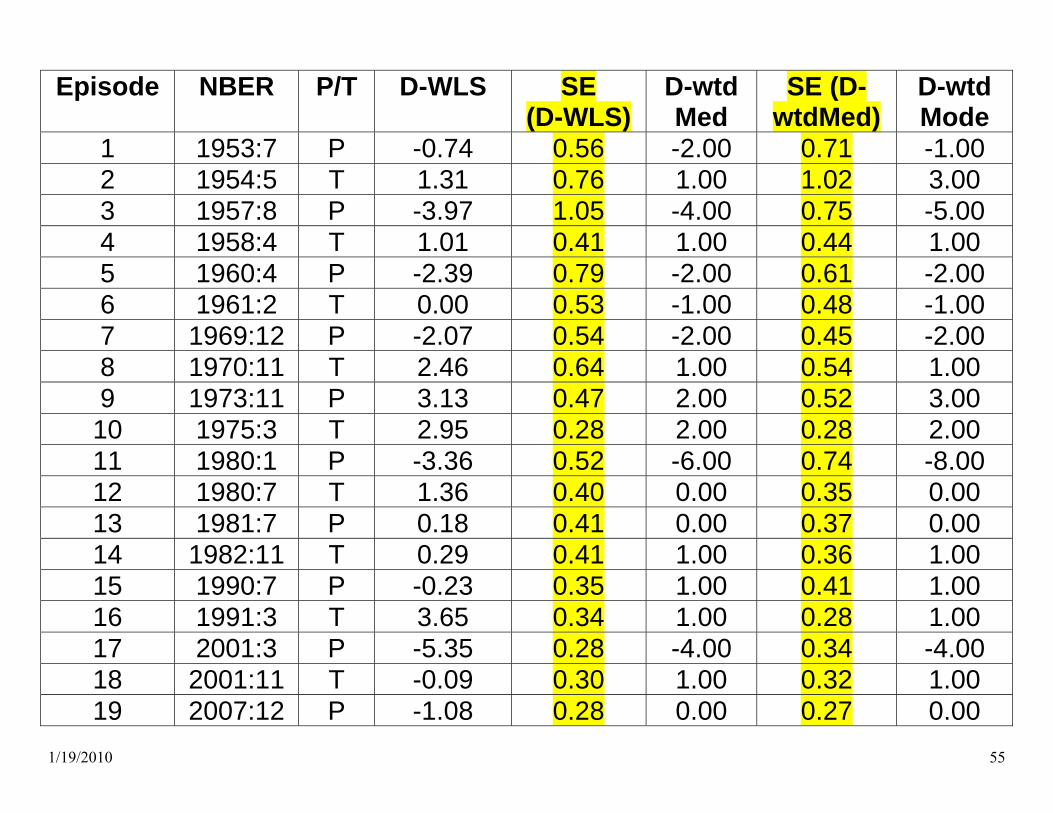
Episode NBER P/T D-WLS SE
(D-WLS) D-wtd Med
SE (D-wtdMed)
D-wtd Mode
1 1953:7 P -0.74 0.56 -2.00 0.71 -1.00 2 1954:5 T 1.31 0.76 1.00 1.02 3.00 3 1957:8 P -3.97 1.05 -4.00 0.75 -5.00 4 1958:4 T 1.01 0.41 1.00 0.44 1.00 5 1960:4 P -2.39 0.79 -2.00 0.61 -2.00 6 1961:2 T 0.00 0.53 -1.00 0.48 -1.00 7 1969:12 P -2.07 0.54 -2.00 0.45 -2.00 8 1970:11 T 2.46 0.64 1.00 0.54 1.00 9 1973:11 P 3.13 0.47 2.00 0.52 3.00
10 1975:3 T 2.95 0.28 2.00 0.28 2.00 11 1980:1 P -3.36 0.52 -6.00 0.74 -8.00 12 1980:7 T 1.36 0.40 0.00 0.35 0.00 13 1981:7 P 0.18 0.41 0.00 0.37 0.00 14 1982:11 T 0.29 0.41 1.00 0.36 1.00 15 1990:7 P -0.23 0.35 1.00 0.41 1.00 16 1991:3 T 3.65 0.34 1.00 0.28 1.00 17 2001:3 P -5.35 0.28 -4.00 0.34 -4.00 18 2001:11 T -0.09 0.30 1.00 0.32 1.00 19 2007:12 P -1.08 0.28 0.00 0.27 0.00

1/19/2010 56
1/19/2010 57
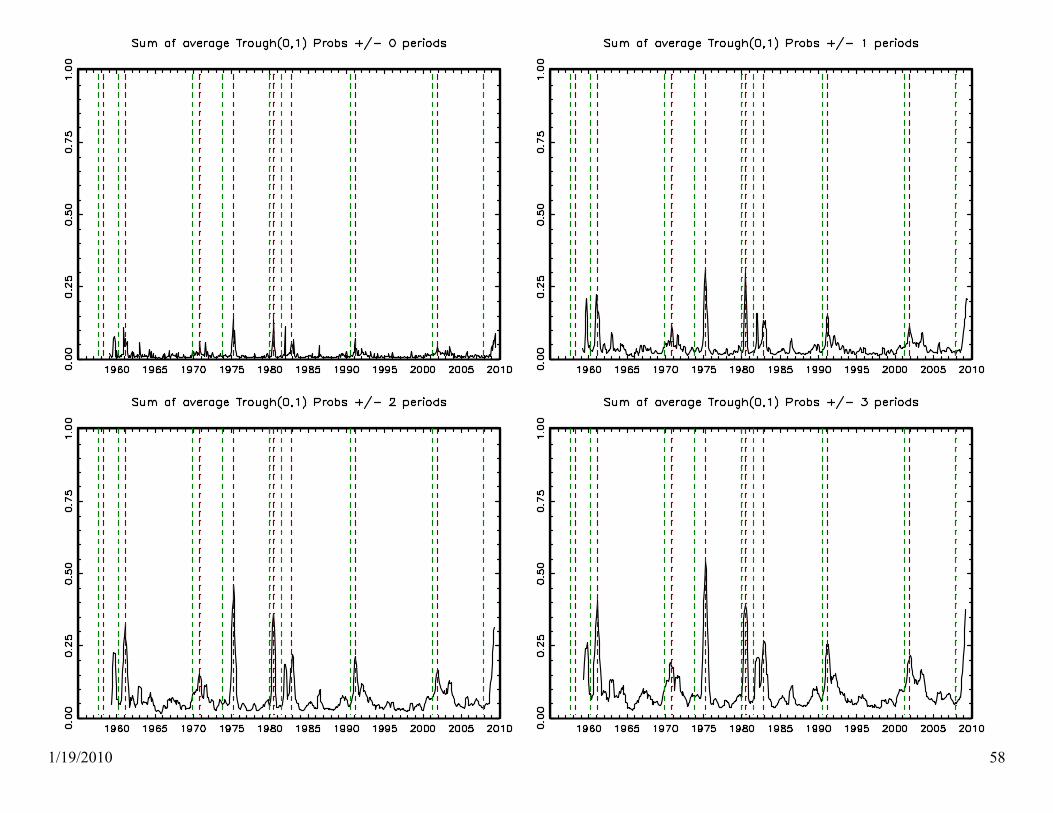
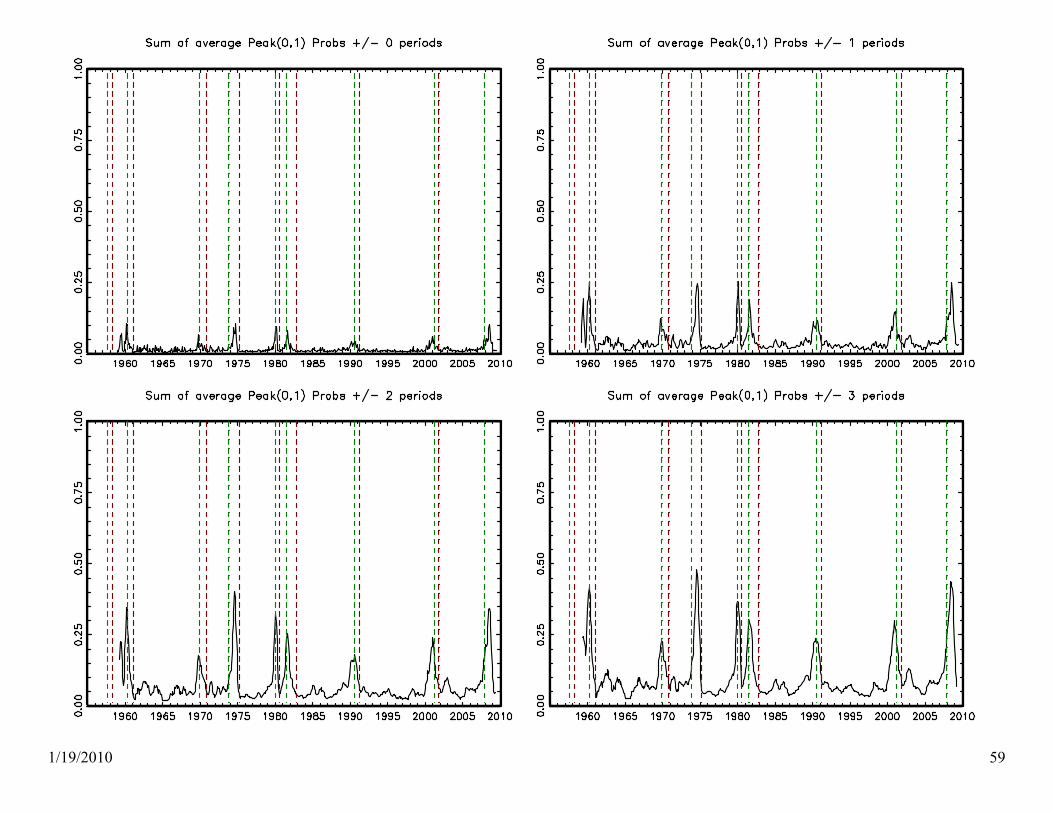
MS on subaggregates MS filter from above (uniform prior over parameters) Figures: • Trough probabilities, averaged over series, centered k-lag moving
average: k = 0, 1, 2, 3 • Peak probabilities (same)
1/19/2010 58
1/19/2010 59

1/19/2010 60
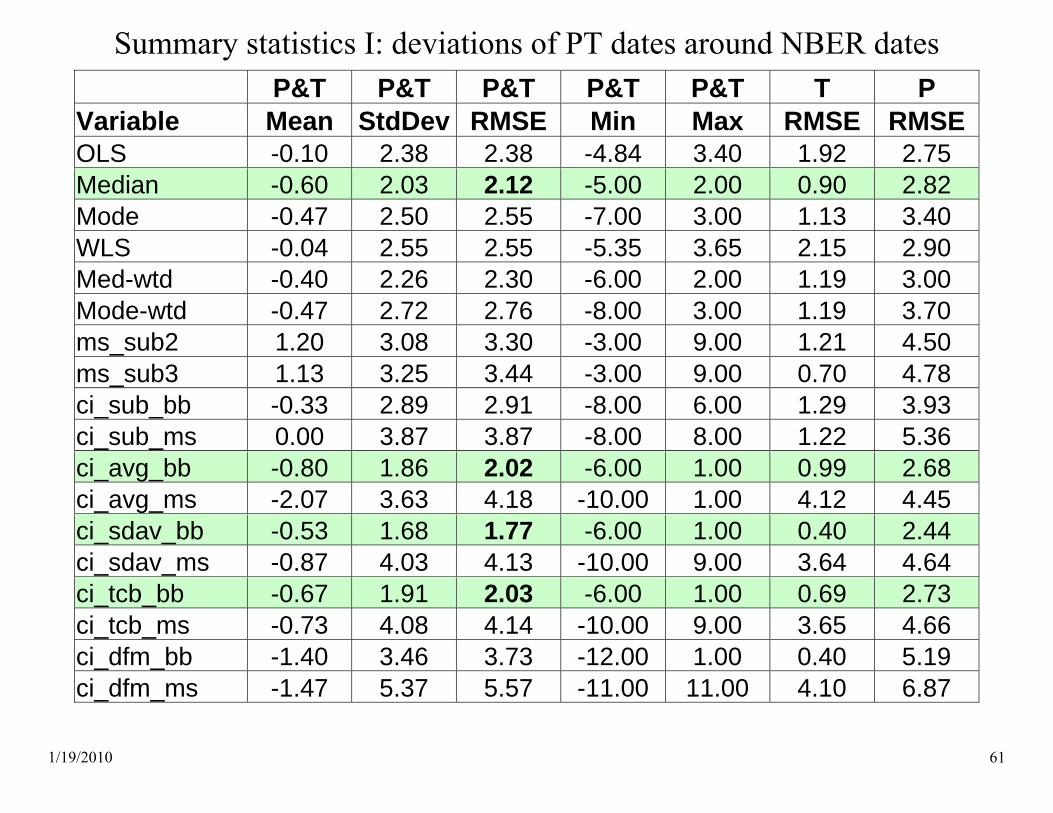
Summary statistics for chronologies Deviation of estimated chronology from NBER BCDC
1/19/2010 61
Summary statistics I: deviations of PT dates around NBER dates P&T P&T P&T P&T P&T T P Variable Mean StdDev RMSE Min Max RMSE RMSEOLS -0.10 2.38 2.38 -4.84 3.40 1.92 2.75 Median -0.60 2.03 2.12 -5.00 2.00 0.90 2.82 Mode -0.47 2.50 2.55 -7.00 3.00 1.13 3.40 WLS -0.04 2.55 2.55 -5.35 3.65 2.15 2.90 Med-wtd -0.40 2.26 2.30 -6.00 2.00 1.19 3.00 Mode-wtd -0.47 2.72 2.76 -8.00 3.00 1.19 3.70 ms_sub2 1.20 3.08 3.30 -3.00 9.00 1.21 4.50 ms_sub3 1.13 3.25 3.44 -3.00 9.00 0.70 4.78 ci_sub_bb -0.33 2.89 2.91 -8.00 6.00 1.29 3.93 ci_sub_ms 0.00 3.87 3.87 -8.00 8.00 1.22 5.36 ci_avg_bb -0.80 1.86 2.02 -6.00 1.00 0.99 2.68 ci_avg_ms -2.07 3.63 4.18 -10.00 1.00 4.12 4.45 ci_sdav_bb -0.53 1.68 1.77 -6.00 1.00 0.40 2.44 ci_sdav_ms -0.87 4.03 4.13 -10.00 9.00 3.64 4.64 ci_tcb_bb -0.67 1.91 2.03 -6.00 1.00 0.69 2.73 ci_tcb_ms -0.73 4.08 4.14 -10.00 9.00 3.65 4.66 ci_dfm_bb -1.40 3.46 3.73 -12.00 1.00 0.40 5.19 ci_dfm_ms -1.47 5.37 5.57 -11.00 11.00 4.10 6.87

1/19/2010 62
NBER P/T D-WLS DFM - Dissaggrates TCB CI 1960:4 P -3 (0.91) -12 -3 1961:2 T 0 (0.56) 0 0 1969:12 P -2 (0.65) -4 -2 1970:11 T 2 (0.60) 0 0 1973:11 P 3 (0.57) 0 0 1975:3 T 3 (0.39) 1 1 1980:1 P -3 (0.69) 0 0 1980:7 T 1 (0.62) 0 0 1981:7 P 1 (0.49) 0 1 1982:11 T 0 (0.52) 0 1 1990:7 P 0 (0.55) 0 -1 1991:3 T 3 (0.45) 0 0 2001:3 P -5 (0.45) -6 -6 2001:11 T 0 (0.56) 0 1 2007:12 P -1 (0.48) 0 -2

1/19/2010 63
Selected Mincer-Zarnowitz regressions: fitting NBER BCDC (a) Use only aggregate best CI (no DFM) v. use disaggregates
NBERjD = α + λ SDwtd BB
jD − + (1–λ) disaggjD
disaggjD λ t-stat
OLS 0.06 0.42 Med-unwtd 0.30 1.09 Mode-unwtd 0.19 1.12 ms_sub2 0.12 1.14

1/19/2010 64
(b) Alternative single aggregate index (DFM on dissagregates)
NBERjD = α + λ DFMall BB
jD − + (1–λ) disaggjD
disaggjD λ t-stat
OLS 0.94 2.97 Med-unwtd 0.93 3.65 Mode-unwtd 0.75 2.20 ms_sub2 0.55 1.67

1/19/2010 65
Summary: selected findings: 1. Dispersion is considerably smaller at troughs than peaks 2. “date then average” has lower dispersion than “average then date”
o OLS “ANOVA” model has low dispersion and is close to mean of all estimators
3. Applying BB to the SD-wtd coincident index comes close to replicating the NBER BCDC (RMSE = 1.77)
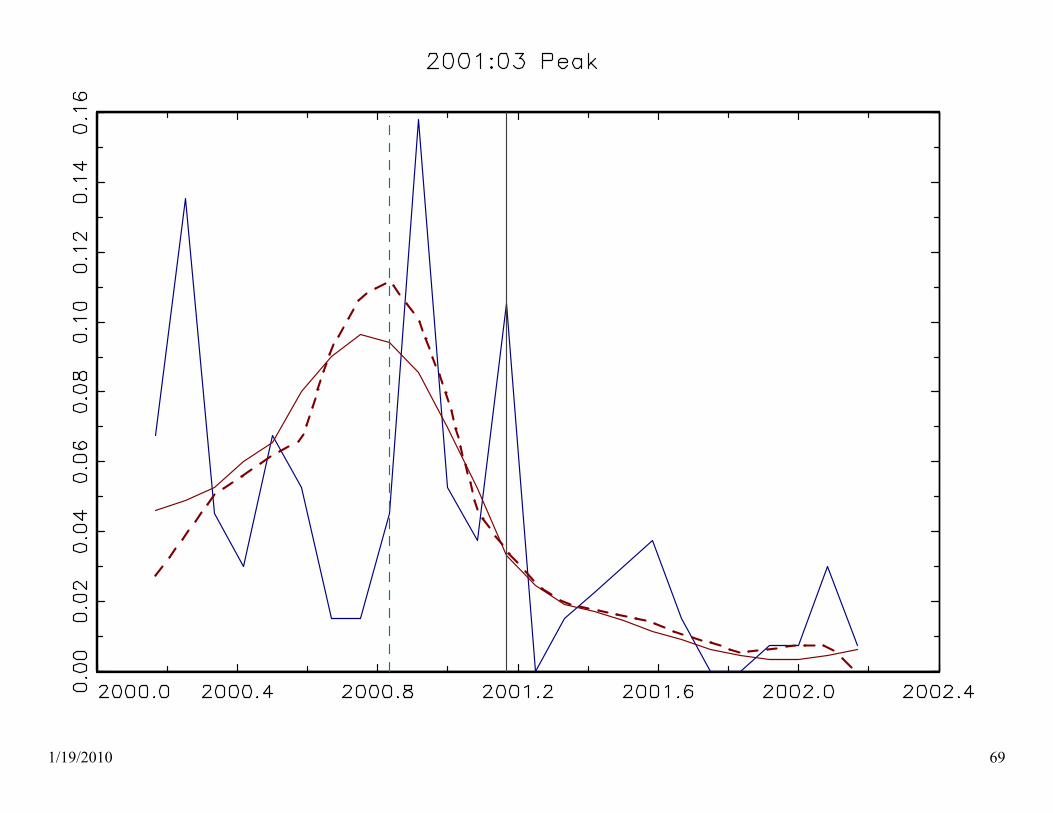
4. There are a few large discrepancies (residuals) between the estimated chronologies and the NBER chronology:
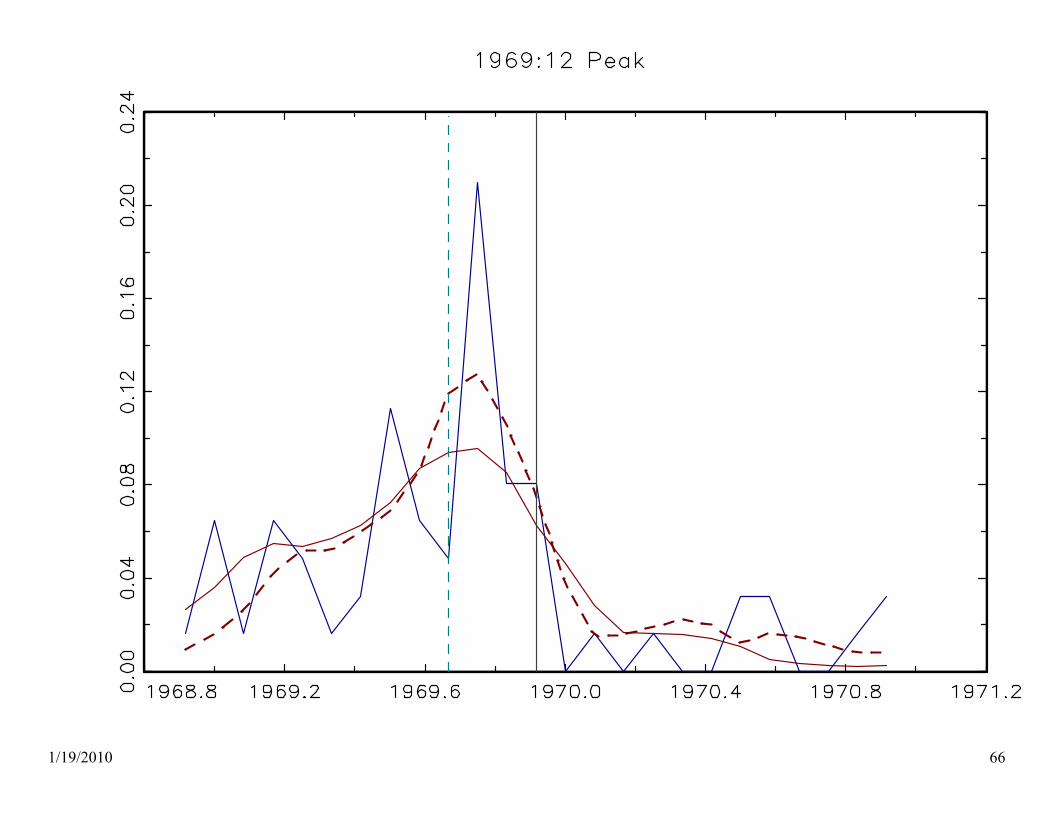
1/19/2010 66
1/19/2010 67
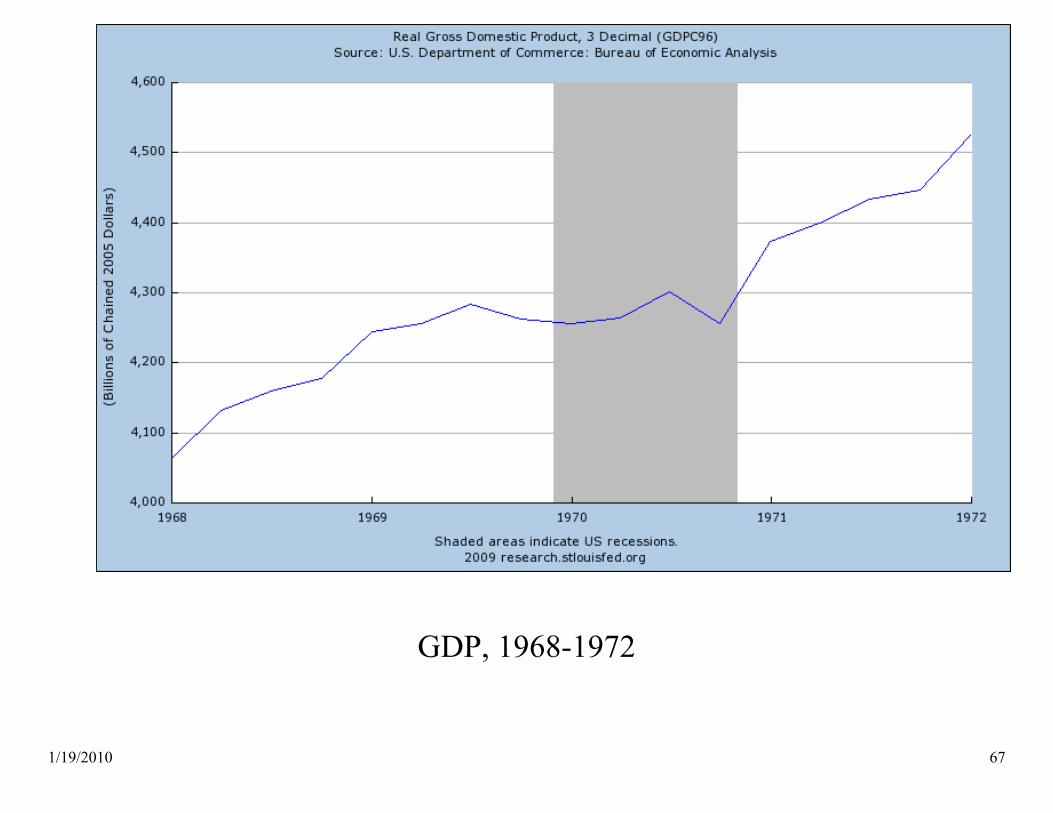
GDP, 1968-1972
1/19/2010 68
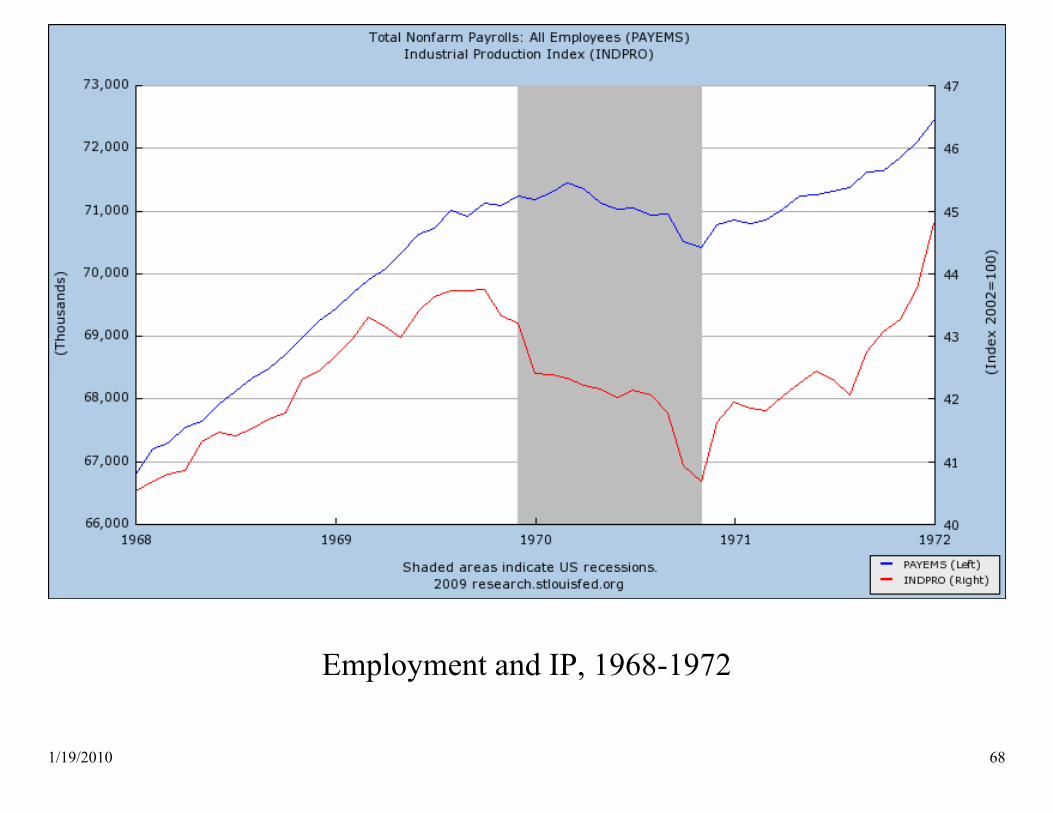
Employment and IP, 1968-1972
1/19/2010 69

1/19/2010 70
GDP, 2000-2003

1/19/2010 71
Employment and IP, 2000-2003
1/19/2010 72
6) Conclusions
1.Methodology: Specific cycle dating – remaining work: • quantifying estimation uncertainty from single episode data • theory of optimal estimation • robustness
2.Methodology: Reference cycle dating – remaining work: • Unresolved ambiguity about the estimand
• Fix on latent output? latent employment? • Or end of cluster episode of (unknown) specific cycle dates?
• Once estimand problem is solved, the estimation problem can be tackled – a variety of methods have been explored here
3.Empirical findings: It might be appropriate to revisit a few of the historical NBER dates