Embed Size (px)
Citation preview
Estimating the Impact ofHigh-Production-Volume Chemicalson Remote Ecosystems by ToxicPressure CalculationJ A S P E R V . H A R B E R S , †
M A R K A . J . H U I J B R E G T S , †
L E O P O S T H U M A , ‡ A N DD I K V A N D E M E E N T * , † , ‡
Department of Environmental Science, Institute for Wetlandand Water Research, Faculty of Science, Radboud UniversityNijmegen, P.O. Box 9010, 6500GL Nijmegen, The Netherlandsand National Institute of Public Health and the Environment,Laboratory for Ecological Risk Assessment, P.O. Box 1,3720 BA Bilthoven, The Netherlands
Although many chemicals are in use, the environmentalimpacts of only a few have been established, usually on per-chemical basis. Uncertainty remains about the overallimpact of chemicals. This paper estimates combined toxicpressure on coastal North Sea ecosystems from 343 high-production-volume chemicals used within the catchment ofrivers Rhine, Meuse, and Scheldt. Multimedia fatemodeling and species sensitivity distribution-based effectsestimation are applied. Calculations start from productionvolumes and emission rates and use physicochemicalsubstance properties and aquatic ecotoxicity data. Parameteruncertainty is addressed by Monte Carlo simulations.Results suggest that the procedure is technically feasible.Combined toxic pressure of all 343 chemicals in coastalNorth Seawater is 0.025 (2.5% of the species are exposedto concentration levels above EC50 values), with a wideconfidence interval of nearly 0-1. This uncertainty appearsto be largely due to uncertainties in interspecies variancesof aquatic toxicities and, to a lesser extent, to uncertaintiesin emissions and degradation rates. Due to these uncertainties,the results support gross ranking of chemicals incategories: negligible and possibly relevant contributionsonly. With 95% confidence, 283 of the 343 chemicals(83%) contribute negligibly (less than 0.1%) to overall toxicpressure, and only 60 (17%) need further consideration.
IntroductionLarge numbers of chemicals are used throughout the world.In the U.S.A., approximately 70 000 chemicals have beenproduced and used since 1976, with some 15 000 producedin significant amounts (1). The European inventory of existingcommercial chemical substances (EINECS; ref 2) lists 100 195substances. Of these, 2465 are the so-called high-production-volume chemicals (HPVCs), i.e., substances produced in theEU in volumes exceeding 1000 tonnes per year. Despite thegreat national and international efforts put into monitoringand risk assessment, impacts of only a few of these chemicals
have been established, usually on a per-chemical basis.Uncertainty and even ignorance remains about the overallimpact of chemicals on human health and ecosystems.
Since it is impossible to regulate mixtures on a regionalscale, decision support systems have been developed toevaluate potential impacts of chemical releases and forchemical regulation, among other systems involving rankingmethods. In the U.S., the chemical ranking and scoring modelmethod “Chemical Hazard Evaluation for ManagementStrategies” or CHEMS-1 has been designed to select prioritychemicals for the assessment of safer substitutes for majorproducts and process uses; chemicals were selected fromToxics Release Inventory data (1). In Europe, the EU RankingMethod (EURAM; refs 3, 4) was developed to prioritize HPVCsfor which data have been collected in the InternationalUniform Chemical Information Database (IUCLID; ref 5).EU risk assessment on the prioritized substances is in progress(6). This risk assessment follows the standard procedureslaid down in the Technical Guidance Documents (TGD; ref7). Commonly, the existing methods lead to the assessmentof so-called risk quotients per chemical; the ratios of predictedenvironmental concentrations (PEC) and predicted no-effectconcentrations (PNEC), with the absolute value serving asregulatory and ranking criterion. PECs and PNECs areobtained with a set of methods that vary between compoundsas a consequence of data availability and scientific knowledge.Although the PEC and PNEC methods are conceptually simpleand operationally needed in decisions processes, they donot sufficiently allow estimation of environmental impactsof mixtures in the ecosystem. Furthermore, although theparameters used in the quotients methods are known to beuncertain, the EU-TGD does not explicitly address uncer-tainty in PEC/PNEC, leaving an option to gain insight inrelative parameter relevance and interpretation limitationsaside.
The potentially affected fraction of species (PAF) has beenproposed as an operational endpoint for estimating probableeffects on species assemblages in ecological risk assessmentof toxic substances. PAF can be considered as a conceptualimprovement, since it takes the often-observed nonlinearityof species sensitivity distributions (SSDs), as well as SSD-slope differences in chemicals into account. PAF representsthe fraction of species that are exposed to toxicologicallysignificant concentration levels, like NOEC or EC50, andinterprets this as a measure for “ecological risk” (8, 9) or anindex for “toxic stress” (10). In this paper we preferred to use“toxic pressure” as the most appropriate term representingthe potentially affected fraction of species. PAF can representthe toxic pressure of a single substance (ssPAF), or of mixturesof chemicals (multi-substance PAF or msPAF) (10). This paperbuilds on these ideas and introduces the analysis of uncer-tainties in toxic pressure calculations. The combined toxicpressure of many chemicals is correlated to the occurrencesand abundances of species in the field (11, 12). Owing tothis, PAF has been found useful as an assessment endpointin life cycle impact assessment of products (13, 14).
In this paper, we use toxic pressure (ssPAF, msPAF)calculation to explore the possibilities of (i) estimating theoverall impacts of chemical mixtures on ecosystems, (ii)quantification and ranking the relative importance of indi-vidual chemicals and (iii) establishing parameter uncertainty.Our calculation method involves estimations of concentrationin the environment from known production volumes, impactassessments of chemicals on aquatic ecosystems, and rankingseries of chemicals on the basis of this outcome, andessentially follows EURAM. Unlike EURAM, which yields
* Corresponding author phone: 0031-24-3653284; e-mail:[email protected].
† Radboud University Nijmegen.‡ National Institute of Public Health and the Environment.
Environ. Sci. Technol. 2006, 40, 1573-1580
10.1021/es051633m CCC: $33.50 2006 American Chemical Society VOL. 40, NO. 5, 2006 / ENVIRONMENTAL SCIENCE & TECHNOLOGY 9 1573Published on Web 01/14/2006
semiquantitative “environmental scores”, our proceduremore closely follows the calculations of the EU-TGD, whichyields quantitative output. Our procedure differs from theEU-TGD in that it uses toxic pressure estimates (PAF) insteadof the risk quotients (PEC/PNEC). We applied our calculationsprocedure to a set of 343 EU high-production-volumechemicals. We assessed the combined toxic pressure of thesechemicals on the coastal seawater ecosystem of the SouthernBight of the North Sea, modeling the combined catchmentsof the rivers Rhine, Meuse, and Scheldt.
The overall toxic pressure on ecosystems and the relativecontributions of individual chemicals to this can only bemeaningfully evaluated on the basis of thorough evaluationof the uncertainties in the results obtained. Not only are theemission factors, from which the calculation starts, largelyunknown, the physical, chemical, and ecotoxicologicalsubstance properties on which the calculation sequence restsare not known with great accuracy either. We deal with theseuncertainties by treating the entire calculation probabilis-tically. We judge the end result in the light of the uncertaintyassociated with it.
MethodsToxic Pressure Calculation. Toxic pressure calculation wasdone according to descriptions given elsewhere (8, 9, 13, 14).In brief, this calculation uses chemical-specific speciessensitivity distributions (SSDs) to describe the variation insensitivities for a set of species under acute or chronicexposure to a certain compound. SSDs can be described byvarious distribution curves, i.e., logistic, normal and triangulardistributions. Several studies have demonstrated that thelogistic distribution for log-transformed toxicity data is valid(15, 16).
The ssPAF can be used as an approximation of theecological risk of a single substance to the ecosystem atmeasured or predicted ambient concentration (17, 18) andis calculated by
where C is the environmental concentration of the compoundunder consideration and R and â reflect the logistic distribu-tion of the SSD. Following De Zwart (15), the â or the slopeof the species sensitivity distributions was assumed to beequal for compounds with the same toxic mode of action(TMoA).
To aggregate ssPAF values to a single overall msPAF, anaggregation protocol was applied (8, 9, 12, 15). This protocolis based on the application of two toxicological models:concentration addition (CA) and response addition (RA). CAwas applied for compounds that have the same TMoA. Thecumulative and potentially affected fraction of species formixtures of chemicals with the same toxic mode of action(PAFTMoA) is read by toxic unit (TU) addition for a single TMoAand is calculated by
where∑TUTMoA is the sum of the toxic units for all chemicalswith the same mode of action and âTMoA is the mode of actionspecific â.
The modes of action specific PAF or PAFTMoA values werefinally aggregated to an overall msPAF by RA (see eq 3),assuming that the susceptibility of species for the (groupsof) chemicals is statistically independent (r ) 0).
Relative Importance Assessment. The relative contribu-tion of a single substance to the overall toxic pressure (R)was defined by
where msPAF represents the toxic pressure on ecosystemscaused by the full set of chemicals and msPAFn-1 is definedas the toxic pressure on ecosystems caused by the set ofchemicals without the contribution of the chemical underconsideration.
Case Study. A case study area was selected in order toinspect the technical feasibility and outcomes of the toxicpressure calculation. The study area, the Southern Bight ofthe North Sea, was chosen to investigate potentially typicaloutput patterns for a remote system influenced by an arrayof human activities downstream of highly populated rivercatchments of the rivers Rhine, Meuse, and Scheldt. Thispart of the North Sea is the terminal station of these rivers,and the refreshment-time of the North Sea is relatively long(approximately 30 d) compared to the streaming-time of thethree rivers from headwater to the North Sea (5-10 d).Relative to this unstable situation within rivers, we considerthe Southern Bight of the North Sea as a “remote” and ratherstable ecosystem.
Substances. Substances were selected from a list of nearly2700 chemicals that were studied for priority setting of existingchemicals with EURAM. From this list, 343 well-defined singleorganic substances with ecotoxicity data available for at leastthree major taxonomic groups (n ) >3) were selected.Substance data were taken from IUCLID (5) and fromEstimation Programs Interface for Windows (EPIWIN; ref19). Mainly log-normal distributions were used to quantifythe uncertainty in physicochemical parameters (20). Ad-ditional information on the uncertainty distributions andthe physicochemical properties of all 343 HPVCs are providedin the Supporting Information.
Emissions. Amounts produced and used in the Rhine-Meuse-Scheldt catchments were derived from EU-wideproduction volumes. Since the surface area of the Rhine-Meuse-Scheldt region is approximately 1/16 of the EU andthe population density is about three times above average,3/16 of the EU production volume was assigned to the regionmodeled. Emissions into the environment in the Rhine-Meuse-Scheldt catchments were estimated on the basis ofEU-TGD emission tables (A- and B-tables; ref 7). These tableswere simplified considerably to allow emission estimationon the basis of the industrial category only. The condensedemission tables used are provided in the Supporting Infor-mation, as well as additional information on the procedureto estimate the emission. The obtained emissions need to beviewed as rough estimates only. Further to this, it is knownthat TGD emission tables are useful only as estimates of upperlimits; TGD tables were found to overestimate real emissionsby up to 3-4 orders of magnitude (20). This leads to a verygreat, however unknown, uncertainty in the estimatedemissions. We have dealt with this by treating the emissionas a stochastic variable with a uniform distribution betweenthe estimated value and a factor 1000 lower than the estimatedvalue. Deterministic emission amounts to air, water, andsoil on the continental scale are given in the SupportingInformation.
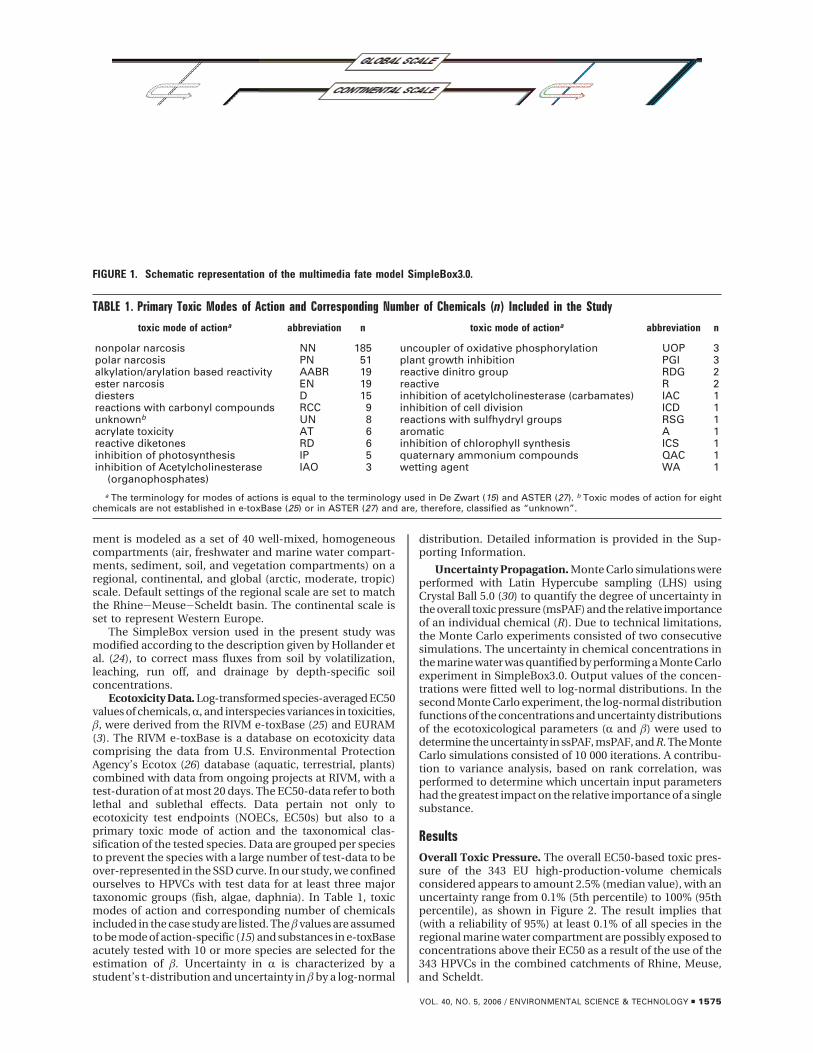
Concentrations. The multimedia fate model SimpleBox3.0(21) was used to predict steady-state chemical concentrationssee Figure 1). SimpleBox3.0 is a nested multimedia fate modelof the “Mackay type” (22, 23). It uses substance-specificparameters and emission profiles to air, water, and soil asinput to calculate steady-state concentrations of chemicalsin the various environmental compartments. The environ-
ssPAF ) 1
1 + e-(log(C)-R/â)(1)
PAFTMoA ) 1
1 + e-log(∑TUTMoA)/âTMoA(2)
msPAF ) 1 - ∏TMoA
(1 - PAFTMoA) (3)
R ) 1 -msPAFn-1
msPAF(4)
1574 9 ENVIRONMENTAL SCIENCE & TECHNOLOGY / VOL. 40, NO. 5, 2006
ment is modeled as a set of 40 well-mixed, homogeneouscompartments (air, freshwater and marine water compart-ments, sediment, soil, and vegetation compartments) on aregional, continental, and global (arctic, moderate, tropic)scale. Default settings of the regional scale are set to matchthe Rhine-Meuse-Scheldt basin. The continental scale isset to represent Western Europe.
The SimpleBox version used in the present study wasmodified according to the description given by Hollander etal. (24), to correct mass fluxes from soil by volatilization,leaching, run off, and drainage by depth-specific soilconcentrations.
Ecotoxicity Data. Log-transformed species-averaged EC50values of chemicals, R, and interspecies variances in toxicities,â, were derived from the RIVM e-toxBase (25) and EURAM(3). The RIVM e-toxBase is a database on ecotoxicity datacomprising the data from U.S. Environmental ProtectionAgency’s Ecotox (26) database (aquatic, terrestrial, plants)combined with data from ongoing projects at RIVM, with atest-duration of at most 20 days. The EC50-data refer to bothlethal and sublethal effects. Data pertain not only toecotoxicity test endpoints (NOECs, EC50s) but also to aprimary toxic mode of action and the taxonomical clas-sification of the tested species. Data are grouped per speciesto prevent the species with a large number of test-data to beover-represented in the SSD curve. In our study, we confinedourselves to HPVCs with test data for at least three majortaxonomic groups (fish, algae, daphnia). In Table 1, toxicmodes of action and corresponding number of chemicalsincluded in the case study are listed. The â values are assumedto be mode of action-specific (15) and substances in e-toxBaseacutely tested with 10 or more species are selected for theestimation of â. Uncertainty in R is characterized by astudent’s t-distribution and uncertainty in â by a log-normal
distribution. Detailed information is provided in the Sup-porting Information.
Uncertainty Propagation. Monte Carlo simulations wereperformed with Latin Hypercube sampling (LHS) usingCrystal Ball 5.0 (30) to quantify the degree of uncertainty inthe overall toxic pressure (msPAF) and the relative importanceof an individual chemical (R). Due to technical limitations,the Monte Carlo experiments consisted of two consecutivesimulations. The uncertainty in chemical concentrations inthe marine water was quantified by performing a Monte Carloexperiment in SimpleBox3.0. Output values of the concen-trations were fitted well to log-normal distributions. In thesecond Monte Carlo experiment, the log-normal distributionfunctions of the concentrations and uncertainty distributionsof the ecotoxicological parameters (R and â) were used todetermine the uncertainty in ssPAF, msPAF, and R. The MonteCarlo simulations consisted of 10 000 iterations. A contribu-tion to variance analysis, based on rank correlation, wasperformed to determine which uncertain input parametershad the greatest impact on the relative importance of a singlesubstance.
ResultsOverall Toxic Pressure. The overall EC50-based toxic pres-sure of the 343 EU high-production-volume chemicalsconsidered appears to amount 2.5% (median value), with anuncertainty range from 0.1% (5th percentile) to 100% (95thpercentile), as shown in Figure 2. The result implies that(with a reliability of 95%) at least 0.1% of all species in theregional marine water compartment are possibly exposed toconcentrations above their EC50 as a result of the use of the343 HPVCs in the combined catchments of Rhine, Meuse,and Scheldt.
FIGURE 1. Schematic representation of the multimedia fate model SimpleBox3.0.
TABLE 1. Primary Toxic Modes of Action and Corresponding Number of Chemicals (n) Included in the Study
toxic mode of actiona abbreviation n toxic mode of actiona abbreviation n
nonpolar narcosis NN 185 uncoupler of oxidative phosphorylation UOP 3polar narcosis PN 51 plant growth inhibition PGI 3alkylation/arylation based reactivity AABR 19 reactive dinitro group RDG 2ester narcosis EN 19 reactive R 2diesters D 15 inhibition of acetylcholinesterase (carbamates) IAC 1reactions with carbonyl compounds RCC 9 inhibition of cell division ICD 1unknownb UN 8 reactions with sulfhydryl groups RSG 1acrylate toxicity AT 6 aromatic A 1reactive diketones RD 6 inhibition of chlorophyll synthesis ICS 1inhibition of photosynthesis IP 5 quaternary ammonium compounds QAC 1inhibition of Acetylcholinesterase
(organophosphates)IAO 3 wetting agent WA 1
a The terminology for modes of actions is equal to the terminology used in De Zwart (15) and ASTER (27). b Toxic modes of action for eightchemicals are not established in e-toxBase (25) or in ASTER (27) and are, therefore, classified as “unknown”.
VOL. 40, NO. 5, 2006 / ENVIRONMENTAL SCIENCE & TECHNOLOGY 9 1575
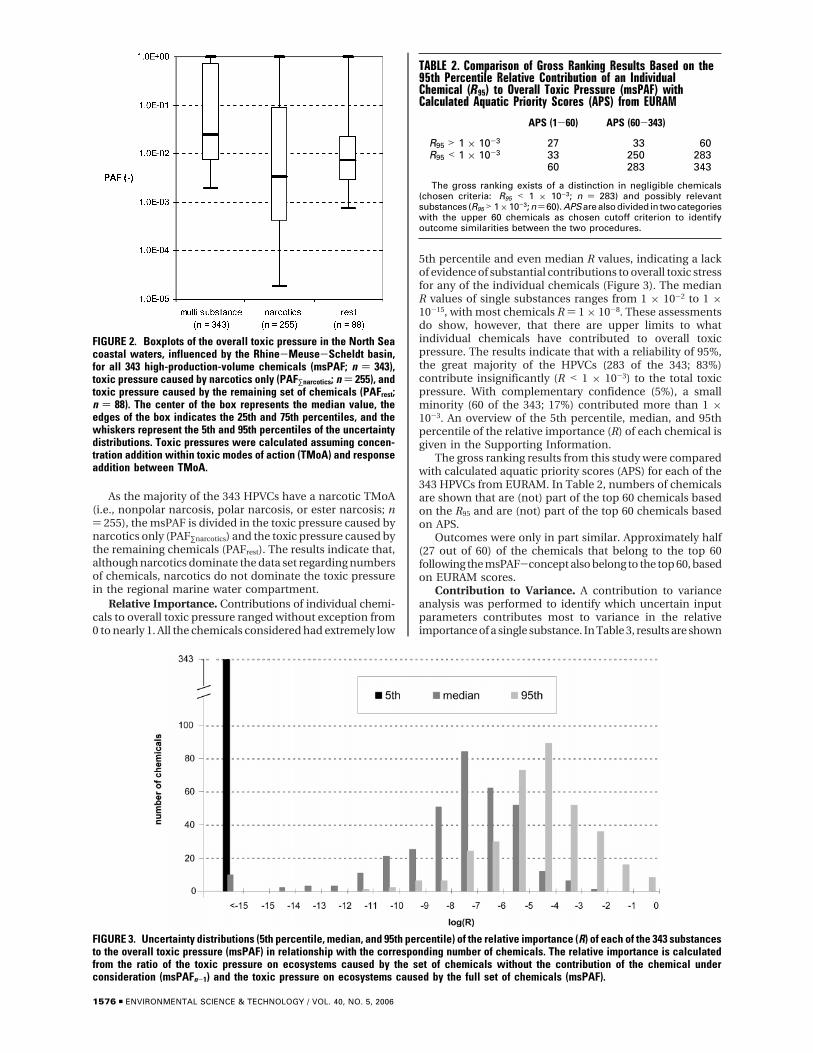
As the majority of the 343 HPVCs have a narcotic TMoA(i.e., nonpolar narcosis, polar narcosis, or ester narcosis; n) 255), the msPAF is divided in the toxic pressure caused bynarcotics only (PAF∑narcotics) and the toxic pressure caused bythe remaining chemicals (PAFrest). The results indicate that,although narcotics dominate the data set regarding numbersof chemicals, narcotics do not dominate the toxic pressurein the regional marine water compartment.
Relative Importance. Contributions of individual chemi-cals to overall toxic pressure ranged without exception from0 to nearly 1. All the chemicals considered had extremely low
5th percentile and even median R values, indicating a lackof evidence of substantial contributions to overall toxic stressfor any of the individual chemicals (Figure 3). The medianR values of single substances ranges from 1 × 10⁻² to 1 ×10-15, with most chemicals R ) 1 × 10⁻⁸. These assessmentsdo show, however, that there are upper limits to whatindividual chemicals have contributed to overall toxicpressure. The results indicate that with a reliability of 95%,the great majority of the HPVCs (283 of the 343; 83%)contribute insignificantly (R < 1 × 10⁻³) to the total toxicpressure. With complementary confidence (5%), a smallminority (60 of the 343; 17%) contributed more than 1 ×10⁻³. An overview of the 5th percentile, median, and 95thpercentile of the relative importance (R) of each chemical isgiven in the Supporting Information.
The gross ranking results from this study were comparedwith calculated aquatic priority scores (APS) for each of the343 HPVCs from EURAM. In Table 2, numbers of chemicalsare shown that are (not) part of the top 60 chemicals basedon the R95 and are (not) part of the top 60 chemicals basedon APS.
Outcomes were only in part similar. Approximately half(27 out of 60) of the chemicals that belong to the top 60following the msPAF-concept also belong to the top 60, basedon EURAM scores.
Contribution to Variance. A contribution to varianceanalysis was performed to identify which uncertain inputparameters contributes most to variance in the relativeimportance of a single substance. In Table 3, results are shown
FIGURE 2. Boxplots of the overall toxic pressure in the North Seacoastal waters, influenced by the Rhine-Meuse-Scheldt basin,for all 343 high-production-volume chemicals (msPAF; n ) 343),toxic pressure caused by narcotics only (PAF∑narcotics; n ) 255), andtoxic pressure caused by the remaining set of chemicals (PAFrest;n ) 88). The center of the box represents the median value, theedges of the box indicates the 25th and 75th percentiles, and thewhiskers represent the 5th and 95th percentiles of the uncertaintydistributions. Toxic pressures were calculated assuming concen-tration addition within toxic modes of action (TMoA) and responseaddition between TMoA.
FIGURE 3. Uncertainty distributions (5th percentile, median, and 95th percentile) of the relative importance (R) of each of the 343 substancesto the overall toxic pressure (msPAF) in relationship with the corresponding number of chemicals. The relative importance is calculatedfrom the ratio of the toxic pressure on ecosystems caused by the set of chemicals without the contribution of the chemical underconsideration (msPAFn-1) and the toxic pressure on ecosystems caused by the full set of chemicals (msPAF).
TABLE 2. Comparison of Gross Ranking Results Based on the95th Percentile Relative Contribution of an IndividualChemical (R95) to Overall Toxic Pressure (msPAF) withCalculated Aquatic Priority Scores (APS) from EURAM
APS (1-60) APS (60-343)
R95 > 1 × 10⁻³ 27 33 60R95 < 1 × 10⁻³ 33 250 283
60 283 343
The gross ranking exists of a distinction in negligible chemicals(chosen criteria: R95 < 1 × 10⁻³; n ) 283) and possibly relevantsubstances (R95 > 1×10⁻³; n ) 60). APS are also divided in two categorieswith the upper 60 chemicals as chosen cutoff criterion to identifyoutcome similarities between the two procedures.
1576 9 ENVIRONMENTAL SCIENCE & TECHNOLOGY / VOL. 40, NO. 5, 2006
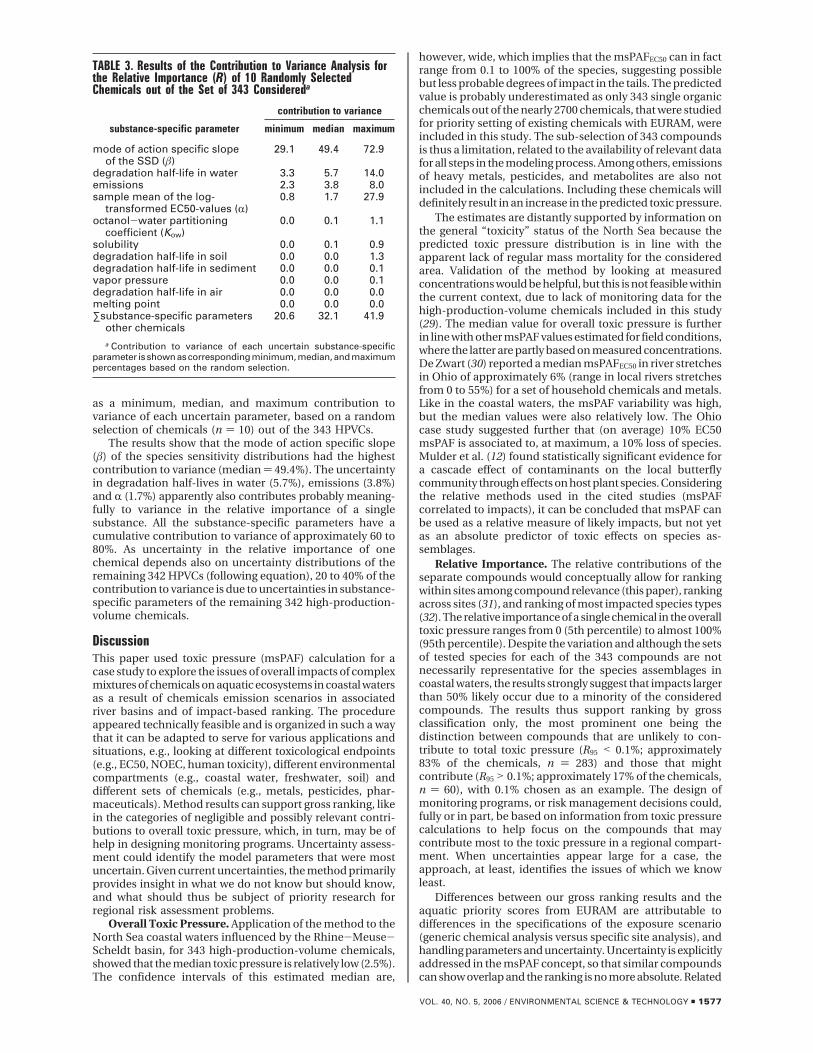
as a minimum, median, and maximum contribution tovariance of each uncertain parameter, based on a randomselection of chemicals (n ) 10) out of the 343 HPVCs.
The results show that the mode of action specific slope(â) of the species sensitivity distributions had the highestcontribution to variance (median ) 49.4%). The uncertaintyin degradation half-lives in water (5.7%), emissions (3.8%)and R (1.7%) apparently also contributes probably meaning-fully to variance in the relative importance of a singlesubstance. All the substance-specific parameters have acumulative contribution to variance of approximately 60 to80%. As uncertainty in the relative importance of onechemical depends also on uncertainty distributions of theremaining 342 HPVCs (following equation), 20 to 40% of thecontribution to variance is due to uncertainties in substance-specific parameters of the remaining 342 high-production-volume chemicals.
DiscussionThis paper used toxic pressure (msPAF) calculation for acase study to explore the issues of overall impacts of complexmixtures of chemicals on aquatic ecosystems in coastal watersas a result of chemicals emission scenarios in associatedriver basins and of impact-based ranking. The procedureappeared technically feasible and is organized in such a waythat it can be adapted to serve for various applications andsituations, e.g., looking at different toxicological endpoints(e.g., EC50, NOEC, human toxicity), different environmentalcompartments (e.g., coastal water, freshwater, soil) anddifferent sets of chemicals (e.g., metals, pesticides, phar-maceuticals). Method results can support gross ranking, likein the categories of negligible and possibly relevant contri-butions to overall toxic pressure, which, in turn, may be ofhelp in designing monitoring programs. Uncertainty assess-ment could identify the model parameters that were mostuncertain. Given current uncertainties, the method primarilyprovides insight in what we do not know but should know,and what should thus be subject of priority research forregional risk assessment problems.
Overall Toxic Pressure. Application of the method to theNorth Sea coastal waters influenced by the Rhine-Meuse-Scheldt basin, for 343 high-production-volume chemicals,showed that the median toxic pressure is relatively low (2.5%).The confidence intervals of this estimated median are,
however, wide, which implies that the msPAFEC50 can in factrange from 0.1 to 100% of the species, suggesting possiblebut less probable degrees of impact in the tails. The predictedvalue is probably underestimated as only 343 single organicchemicals out of the nearly 2700 chemicals, that were studiedfor priority setting of existing chemicals with EURAM, wereincluded in this study. The sub-selection of 343 compoundsis thus a limitation, related to the availability of relevant datafor all steps in the modeling process. Among others, emissionsof heavy metals, pesticides, and metabolites are also notincluded in the calculations. Including these chemicals willdefinitely result in an increase in the predicted toxic pressure.
The estimates are distantly supported by information onthe general “toxicity” status of the North Sea because thepredicted toxic pressure distribution is in line with theapparent lack of regular mass mortality for the consideredarea. Validation of the method by looking at measuredconcentrations would be helpful, but this is not feasible withinthe current context, due to lack of monitoring data for thehigh-production-volume chemicals included in this study(29). The median value for overall toxic pressure is furtherin line with other msPAF values estimated for field conditions,where the latter are partly based on measured concentrations.De Zwart (30) reported a median msPAFEC50 in river stretchesin Ohio of approximately 6% (range in local rivers stretchesfrom 0 to 55%) for a set of household chemicals and metals.Like in the coastal waters, the msPAF variability was high,but the median values were also relatively low. The Ohiocase study suggested further that (on average) 10% EC50msPAF is associated to, at maximum, a 10% loss of species.Mulder et al. (12) found statistically significant evidence fora cascade effect of contaminants on the local butterflycommunity through effects on host plant species. Consideringthe relative methods used in the cited studies (msPAFcorrelated to impacts), it can be concluded that msPAF canbe used as a relative measure of likely impacts, but not yetas an absolute predictor of toxic effects on species as-semblages.
Relative Importance. The relative contributions of theseparate compounds would conceptually allow for rankingwithin sites among compound relevance (this paper), rankingacross sites (31), and ranking of most impacted species types(32). The relative importance of a single chemical in the overalltoxic pressure ranges from 0 (5th percentile) to almost 100%(95th percentile). Despite the variation and although the setsof tested species for each of the 343 compounds are notnecessarily representative for the species assemblages incoastal waters, the results strongly suggest that impacts largerthan 50% likely occur due to a minority of the consideredcompounds. The results thus support ranking by grossclassification only, the most prominent one being thedistinction between compounds that are unlikely to con-tribute to total toxic pressure (R95 < 0.1%; approximately83% of the chemicals, n ) 283) and those that mightcontribute (R95 > 0.1%; approximately 17% of the chemicals,n ) 60), with 0.1% chosen as an example. The design ofmonitoring programs, or risk management decisions could,fully or in part, be based on information from toxic pressurecalculations to help focus on the compounds that maycontribute most to the toxic pressure in a regional compart-ment. When uncertainties appear large for a case, theapproach, at least, identifies the issues of which we knowleast.
Differences between our gross ranking results and theaquatic priority scores from EURAM are attributable todifferences in the specifications of the exposure scenario(generic chemical analysis versus specific site analysis), andhandling parameters and uncertainty. Uncertainty is explicitlyaddressed in the msPAF concept, so that similar compoundscan show overlap and the ranking is no more absolute. Related
TABLE 3. Results of the Contribution to Variance Analysis forthe Relative Importance (R) of 10 Randomly SelectedChemicals out of the Set of 343 Considereda
contribution to variance
substance-specific parameter minimum median maximum
mode of action specific slopeof the SSD (â)
29.1 49.4 72.9
degradation half-life in water 3.3 5.7 14.0emissions 2.3 3.8 8.0sample mean of the log-
transformed EC50-values (R)0.8 1.7 27.9
octanol-water partitioningcoefficient (Kow)
0.0 0.1 1.1
solubility 0.0 0.1 0.9degradation half-life in soil 0.0 0.0 1.3degradation half-life in sediment 0.0 0.0 0.1vapor pressure 0.0 0.0 0.1degradation half-life in air 0.0 0.0 0.0melting point 0.0 0.0 0.0∑substance-specific parameters
other chemicals20.6 32.1 41.9
a Contribution to variance of each uncertain substance-specificparameter is shown as corresponding minimum, median, and maximumpercentages based on the random selection.
VOL. 40, NO. 5, 2006 / ENVIRONMENTAL SCIENCE & TECHNOLOGY 9 1577
to this, the msPAF concept removes the “hidden assump-tions” of some PNECs, for example in the cases where thePNEC is determined by applying a safety factor on the lowesttoxicity data point. When safety factors would occur regularly,the outcomes of ratio-based rankings would be compromisedby this, as well as the ecological interpretation of the probableimpact. By taking into account the often-observed nonlin-earity of species sensitivity distributions, as well as SSD-slope differences in chemicals (15), the results provide aconceptually more realistic approach to estimate ecotoxi-cological effects. This is further supported by some initialvalidation studies (11, 12, 30). As our results support onlygross ranking of chemicals and comparison with aquaticpriority scores from EURAM showed partial similarities, ourstudy indicates that priority assessment of chemicals basedon their impact on ecosystems should be interpreted withcare as a result of various uncertainties. Variances should betaken into account to derive scientifically justified conclu-sions.
Model Uncertainty. Concentration addition (CA) andresponse addition (RA) are regarded as the two biologicallyplausible reference concepts suitable to calculate an expectedcombined effect (msPAF) based on effect information fromthe components of the mixture under consideration. Theappropriate selection of the reference concept to be appliedis believed to depend on the similarity of the TMoA, becausethe TMoA of a compound is codetermined by the receptor(9). A potentially better concept is to consider “mechanisms”of action instead of “modes” of action. Mechanism of actiondenotes the molecular sequence of events leading from theabsorption of an effective dose of a chemical to the productionof a specific biological response in the target organ, whereasmode of action is a more general description of chemicalaction (33). However, there is almost a full lack of operationalknowledge to use mechanisms of action. It was shown thatdatabases are available to assign primary TMoA to acompound (25-27). In contrast, to evaluate whether mixturetoxicity can be predicted by mechanism of action of itscomponent chemicals, a detailed characterization of phar-macodynamics, pharmacokinetics, and slope of dose re-sponse curves may be necessary. Although we thus neglectsecondary and higher order effects, there is reason to interpretthe outcomes with confidence. This relates to the numericalbehavior of the msPAF approach. With slope values of theSSDs as given here, the numerical outcomes of the alternativemodels is often indistinguishable. This was shown by examplecalculations from Traas et al. (8) and Deneer (34), whileDrescher and Boedeker (35) provides an in-depth modelbehavioral analysis to support the findings of the examplecalculations.
Besides these conceptual assumptions, a number of othersimplifications and assumptions have been included in ourstudy. The regional marine water in the Rhine-Meuse-Scheldt basin is modeled in SimpleBox 3.0 as a homogeneouscompartment, implying that the chemical stress and thechemical ranking are based on averaged regional environ-mental and meteorological parameters. Chemical behaviorand stress, however, can differ between various locationswithin a region, resulting in site-specific risks of chemicals(31). The species sensitivity distributions in the case studyare based on acute toxicity data (EC50) only. Application ofchronic toxicity data (NOECs) may change the results, as thechronic influences of specific chemicals on growth andreproduction may be different from those of acute exposure.The toxic pressure prediction and the calculation of therelative importance are based on 22 different toxic modes ofaction, mainly narcotics. Highly specific TMoA (like endocrinedisruption and imposex effects) are not represented in thedatabases for constructing SSDs, and are thus not representedin the predictions and rankings. Further, the representativity
of the test species for the assessed system needs bescrutinized, since test species are usually selected for theirmanageability under laboratory conditions, their sensitivityto toxicants and an assumed (general) ecological relevance.As typical test data sets mainly consist of fish, daphnia, andalgae, effect data of terrestrial organisms, top predators, ormicroorganisms may also affect the calculated relativeimportance of an individual chemical (3). Ecological interac-tions, habitat factors, or specific importance of keystonespecies and functional groups are also not accounted for inSSDs. The habitat (freshwater, seawater) of the speciesassemblages used to construct SSDs, however, does not havea significant influence on the assessment of a hazard (36).
Parameter Uncertainty. Two main assumptions havebeen made for the present study. First, uncertainty distribu-tions for each substance-specific parameter were assumedto be the same for all chemicals, with no distinction betweenchemicals with more or less experimental data available.Second, although correlation in uncertainty distributions ofsubstance-specific parameters within chemicals was takeninto account (e.g., solubility and Kow), no correlation isassumed between chemicals, whereas it is reasonable to thinkthat some parameters may be correlated (e.g., emissionestimates). Uncertainties in msPAF and R may be reducedby taking into account these issues in future applications.
Analysis of the contribution to variance showed that theSSD-parameters (R and â), the emissions, and degradationhalf-lives in water are the most important uncertainties indetermining the relative contribution of an individualchemical to the overall toxic pressure in the case study. Anumber of issues could help in the further development andrefinement of the uncertainty analysis in this study. First,focus could be put on the most uncertain parameter, hereâ. Uncertainty in â may be reduced by further refinementand assuming a mode of action specific uncertainty distri-bution. Second, chemical releases in the Rhine-Meuse-Scheldt basin were predicted by means of the productionvolumes and emission factors by assuming that the useintensity for all chemicals in this region is 3 times greaterthan the average of the entire EU, thus 3/16 of the EUproduction volume was assigned to the region modeled. Thisassumption is rather uncertain, however, as we assumedthat the emissions are overestimated by a factor 1000, a largeuncertainty is already addressed to the emission estimates.This method to estimate chemical releases is also applied inEUSES (37), as better procedures to estimate emissionsprofiles are lacking. Investigations toward a more detailedand accurate estimation of chemical emissions should berealized to improve the reliability of the results. Third, formost chemicals, experimental degradation rates in air areused and, if not, degradation half-lives in air were estimatedfrom structure reactivity relationships. Degradation rates inwater, soil, and sediment were estimated from primaryaerobic biodegradation half-lives. Investigations to improvethe quality of degradation half-lives and to reduce theuncertainty are required. Fourth, the uncertainty in thesample mean of the log-transformed toxicity data (R)influences the model outcomes. A dominant factor in theuncertainty distribution of R is the number of species tested(n) for each chemical. Our calculations indicated thatchemicals with n ) <4 have a relatively large uncertaintydistribution, resulting in a large probability distribution ofmsPAF and R. In future applications, quantitative structure-activity relationships may be used to derive extra ecotoxi-cological input for species sensitivity distributions (38-40).
Practical Applications. Conceptually, the toxic pressurecalculation method can serve for ranking purposes inenvironmental management, e.g., ranking across sites, rank-ing of compounds, and of affected species groups. Practically,uncertainties may prohibit absolute interpretation of all these
1578 9 ENVIRONMENTAL SCIENCE & TECHNOLOGY / VOL. 40, NO. 5, 2006
rankings. Given the current degree of uncertainties, the casestudy results suggest that the method may primarily serveto identify the most uncertain parameters, with as conse-quence of the focusing of further scientific research. Fordecision purposes, absolute outcomes are often needed incurrent practice, like decisions based on PEC/PNEC ratios.On the other hand, calculation of toxic pressure estimates(and their variance) can be relevant considering the upcominguse of weight-of-evidence approaches for site-specific as-sessments in which it is considered that no single methodprovides a complete view on the facts, and the applicationof various methods can help to make responsible decisions.Regulatory agencies commonly have the responsibility todesign and apply methods that provide sufficient protectionof humans and the environment. They have to solve theproblem that many compounds are produced at differentlocations in different amounts, and that mixture regulationon the regional scale is not possible. The toxic pressurecalculation method does not solve the problem that, inpractice, this task boils down to regulating on a per-compound basis.
AcknowledgmentsWe thank Arjen Wintersen for critical data selection from theRIVM e-toxBase and Ad Ragas and Dick de Zwart for valuablecomments. This work was part of a PhD project, funded bythe EU Sixth Framework Programme Priority 1.1.6.3 throughthe project: NOMIRACLE, Novel Methods for Integrated RiskAssessment of Cumulative Stressors (project no. 003956) andco-funded by the Director of RIVM and supported by theRIVM Scientific Advisory Committee within the frameworkof the strategic research project on “Quantitative RiskAssessment” S860703.
Supporting Information AvailableSpecies sensitivity distributions, emission estimates, sub-stance-specific parameters, and their emission uncertaintydistributions as well as a table with parameter settings andthe uncertainty distribution (5th percentile, median, 95thpercentile) of the relative importance of each chemical. Thismaterial is available free of charge via the Internet at http://pubs.acs.org.
Literature Cited(1) Swanson, M. B.; Davis, G. A.; Kincaid, L. E.; Schultz, T. W.;
Bartmess, J. E. A screening method for ranking and scoringchemicals by potential human health and environmentalimpacts. Environ. Toxicol. Chem. 1997, 16, 372-383.
(2) European Chemicals Bureau (ECB). European Inventory ofExisting Commercial Substances (EINECS); JRC-Ispra (VA), Italy,2003.
(3) Hansen, B. G.; Van Haelst, A. G.; Van Leeuwen, K.; Van DerZandt, P. Priority setting for existing chemicals: European UnionRisk Ranking Methodol. Environ. Toxicol. Chem. 1999, 18, 772-779.
(4) Van Haelst, A. G.; Hansen, B. G. Priority setting for existingchemicals: automated data selection routine. Environ. Toxicol.Chem. 2000, 19, 2372-2377.
(5) Heidorn, C. J. A.; Hansen, B. G.; Norager, O. 1996. IUCLID:Database on chemical substances information as a tool for theEU-risk-assessment program. J. Chem. Inf. Comput. Sci. 1996,36, 949-954.
(6) Bodar, C. W. M.; Berthault, F.; De Bruijn, J. H. M.; Van Leeuwen,C. J.; Pronk, M. E. J.; Vermeire, T. G. Evaluation of EU riskassessments existing chemicals (EC Regulation 793/93). Chemo-sphere 2003, 53, 1039-1047.
(7) European Chemicals Bureau (ECB). Technical guidance docu-ment in support of Commission Directive 93/67/EEC on riskassessment for new notified substance. Commission Regulation(EC) no 1488/94 on Risk Assessment for existing substances andDirective 98/8/EC of the European Parliament and of the Councilconcerning the placing of biocidal products on the market; JRC-Ispra (VA), Italy, April 2003.
(8) Traas, T. P.; Van De Meent, D.; Posthuma, L.; Hamers, T.; Kater,B. J.; De Zwart, D.; Aldenberg, T. The potentially affected fractionas a measure of ecological risk. In Species Sensitivity Distributionsin Ecotoxicology; Posthuma, L., Suter, G. W., II; Traas, T. P.,Eds.; Lewis Publishers: Boca Raton, Florida, 2002, pp 315-344.
(9) De Zwart, D.; Posthuma, L. Complex mixture toxicity for singleand multiple species: proposed methodologies. Environ. Toxi-col. Chem. 2005, 24, 59-70.
(10) Klepper, O.; Bakker, J.; Traas, T. P.; Van De Meent, D. Mappingthe potentially affected species as a basis for comparison ofecotoxicological risks between substances and regions. J. Hazard.Mater. 1998, 61, 337-344.
(11) De Zwart, D. Ecological effects of pesticide use in TheNetherlands: Modeled and observed effects in the field ditch.Integr. Environ. Assess. Manage. 2005, 1, 123-134.
(12) Mulder, C.; Aldenberg, T.; De Zwart, D.; Van Wijnen, H. J.; Breure,A. M. Evaluating the impact of pollution on plant-Lepidopterarelationships. Environmetrics 2005, 16, 357-373.
(13) Huijbregts, M. A. J.; Van De Meent, D.; Goedkoop, M.; Spriensma,R. Ecotoxicological impacts in life cycle assessment. In SpeciesSensitivity Distributions in Ecotoxicology; Posthuma, L., Suter,G. W., II; Traas, T. P., Eds.; Lewis Publishers: Boca Raton, Florida,2002, pp 421-433.
(14) Van De Meent, D.; Huijbregts, M. A. J. Calculating life-cycleassessment effect factors from potentially affected fraction-based ecotoxicological response functions. Environ. Toxicol.Chem. 2005, 24, 1573-1578.
(15) De Zwart, D. Observed regulatories in species sensitivitydistributions for aquatic species. In Species Sensitivity Distribu-tions in Ecotoxicology; Posthuma, L., Suter, G. W., II; Traas, T.P, Eds.; Lewis Publishers: Boca Raton, Florida, 2002, pp133-154.
(16) Aldenberg, T.; Slob, W. Confidence limits for hazardousconcentrations based on logistically distributed NOEC toxicitydata. Ecotoxicol. Environ. Saf. 1993, 25, 48-63.
(17) Posthuma, L.; Traas, T. P.; Suter, G. W., II General introductionto species sensitivity distributions. In Species Sensitivity Dis-tributions in Ecotoxicology; Posthuma, L., Suter, G. W., II; Traas,T. P, Eds.; Lewis Publishers: Boca Raton, Florida, 2002, pp 3-10.
(18) Aldenberg, T.; Jaworska, J. S. Uncertainty of the hazardousconcentration and fraction affected for normal species sensitivitydistributions. Ecotoxicol. Environ. Saf. 2000, 46, 1-18.
(19) U.S. Environmental Protection Agency. Estimation ProgramsInterface (EPI) Suite, version 3.12; 2000.
(20) Jager, T. Evaluation of EUSES: inventory of experiences andvalidation activities, RIVM 679102048; National Institute ofPublic Health and the Environment: Bilthoven, The Nether-lands, 1998.
(21) Den Hollander, H.; Van Eijkeren, J. C. H.; Van de Meent, D.SimpleBox3.0: Multimedia Mass Balance Model for Evaluatingthe Fate of Chemicals in the Environment, RIVM 601200003;National Institute of Public Health and the Environment:Bilthoven, The Netherlands, 2004.
(22) Mackay, D. Finding fugacity feasible. Environ. Sci. Technol. 1979,13, 1218-1223.
(23) Mackay, D.; Paterson, S.; Shiu, W. Y. Generic models forevaluating the regional fate of chemicals. Chemosphere 1992,24, 695-717.
(24) Hollander, A.; Hessels, L.; De Voogt, P.; Van De Meent, D.Implementation of depth-dependent soil concentrations inmultimedia mass balance models. SAR QSAR in Environ. Res.2004, 15, 457-468.
(25) RIVM e-toxBase. National Institute for Publich Health and theEnvironment, RIVM: Bilthoven, The Netherlands, 2004; Down-load d.d 19-5-2004.
(26) U.S. Environmental Protection Agency. ECOTOX User Guide:ECOTOXicology Database System. Version 3.0; 2002 http:/www.epa.gov/ecotox/.
(27) ASTER. Assessment Tools for the Evaluation of Risk; U.S.Environmental Protection Agency, National Health and Envi-ronment. Effects Research Laboratory, Mid-Continent EcologyDivision: Duluth, MN, 2004.
(28) Decisioneering Inc. Crystal Ball version 5.0, Forecasting andrisk analysis for spreadsheet users. Denver, Colorado, 2000.
(29) Bovelander, R. W.; Akhiat, A. National Evaluation Report of theJoint Assessment and Monitoring Programme of The Netherlands2001; Report RIKZ 2003.004, National Institute for Coastal andMarine Management (RIKZ).
(30) De Zwart, D.; Dyer, S. D.; Posthuma, L.; Hawkins, C. P. Use ofpredictive models to attribute potential effects of mixture toxicityand habitat alteration on the biological condition of fishassemblages. Ecol. App., provisionally accepted August 2005.
VOL. 40, NO. 5, 2006 / ENVIRONMENTAL SCIENCE & TECHNOLOGY 9 1579
(31) Verdonck, F. A. M.; Janssen, C. R.; Jaworska, J.; Vanrolleghem,P. A. Geo-referencing of probabilistic risk of new chemicals inrivers. Water Sci. Technol. 2003, 48, 39-46.
(32) Posthuma, L.; Traas, T. P.; De Zwart, D.; Suter, G. W., IIConceptual and technical outlook on species sensitivity dis-tributions. In Species Sensitivity Distributions in Ecotoxicology;Posthuma, L., Suter, G. W., II; Traas, T. P, Eds.; Lewis Publish-ers: Boca Raton, Florida, 2002, pp 475-508.
(33) Borgert, C. J.; Quill, T. F.; McCarty, L. S.; Mason, A. M. Can modeof action predict mixture toxicity for risk assessment? Toxicol.Appl. Pharmacol. 2004, 201, 85-96.
(34) Deneer, J. W. Toxicity of mixtures of pesticides in aquaticsystems. Pest Manage. Sci. 2000, 56, 516-520.
(35) Drescher, K.; Boedeker, W. Assessment of the combined effectsof substancessthe relationship between concentration additionand independent action. Biometrics 1995, 51, 716-730.
(36) Maltby, L.; Blake, N.; Brock, T. C.; Van Den Brink, P. J. Insecticidespecies sensitivity distributions: importance of test speciesselection and relevance to aquatic ecosystems. Environ. Toxicol.Chem. 2005, 24, 379-388.
(37) European Communities 2003. European Union System for theEvaluation of Substances. Version 2.0; European ChemicalsBureau: Ispra.
(38) Comber, M. H. I.; Walker, J. D.; Watts, C.; Hermens, J. Quantitativestructure-activity relationships for predicting potential ecologi-cal hazard of organic chemicals for use in regulatory riskassessments. Environ. Toxicol. Chem. 2003, 22, 1822-1828.
(39) Verhaar, H. J. M.; Van Leeuwen, C. J.; Bol, J.; Hermens, J. L. M.Application of QSARs in risk management of existing chemicals.SAR QSAR Environ. Res. 1994, 2, 39-58.
(40) Van Leeuwen, C. J.; Van der Zandt, T. J.; Aldenbert, T.; Verhaar,H. J. M.; Hermens, J. L. M. Applications of QSARs, extrapolationand equilibrium partitioning in aquatic effects assessment. 1.Narcotic industrial pollutants. Environ. Toxicol. Chem. 1992,11, 267-282.
Received for review August 18, 2005. Revised manuscriptreceived December 8, 2005. Accepted December 13, 192005.
ES051633M
1580 9 ENVIRONMENTAL SCIENCE & TECHNOLOGY / VOL. 40, NO. 5, 2006