Embed Size (px)
Citation preview
1
Estimating the Impact of Control Measures to Prevent Outbreaks of COVID-19
Associated with Air Travel into a COVID-19-free country: A Simulation
Modelling Study
Nick Wilson1 2, Michael G Baker2, Martin Eichner3 4
1 BODE3 Programme, University of Otago Wellington, New Zealand 2 HEIRU, University of Otago Wellington, New Zealand 3 Epimos GmbH, Germany 4 University of Tübingen, Germany
Abstract
Aims: We aimed to estimate the risk of COVID-19 outbreaks associated with air travel from a
country with a very low prevalence of COVID-19 infection (Australia) to a COVID-19-free country
(New Zealand; [NZ]), along with the likely impact of various control measures for passengers and
cabin crew.
Methods: A stochastic version of the SEIR model CovidSIM v1.1, designed specifically for COVID-
19 was utilized. It was populated with data for both countries and parameters for SARS-CoV-2
transmission and control measures. We assumed one Australia to NZ flight per day.
Results: When no interventions were in place, an outbreak of COVID-19 in NZ was estimated to
occur after an average time of 1.7 years (95% uncertainty interval [UI]: 0.04-6.09). However, the
combined use of exit and entry screening (symptom questionnaire and thermal camera), masks on
aircraft and two PCR tests (on days 3 and 12 in NZ), combined with self-reporting of symptoms and
contact tracing and mask use until the second PCR test, reduced this risk to one outbreak every 29.8
years (0.8 to 110). If no PCR testing was performed, but mask use was used by passengers up to day
15 in NZ, the risk was one outbreak every 14.1 years. However, 14 days quarantine (NZ practice in
May 2020), was the most effective strategy at one outbreak every 34.1 years (0.06 to 125); albeit
combined with exit screening and mask use on flights.
Conclusions: Policy-makers can require multi-layered interventions to markedly reduce the risk of
importing the pandemic virus into a COVID-19-free nation via air travel. There is potential to
replace 14-day quarantine with PCR testing or interventions involving mask use by passengers in
NZ. However, all approaches require continuous careful management and evaluation.
Introduction
The COVID-19 pandemic has had major international health impacts during 2020, with 6.3 million
cases and 380,000 deaths globally by 3 June (1). In many countries, border controls have been used
to limit pandemic spread and this (combined with fear of the pandemic) have markedly reduced
international travel. This reduction in travel has contributed to adverse economic and social impacts
for countries by reducing business interactions, tourism and movements of international students.
New Zealand is one of the few countries that has eliminated transmission of the SARS-CoV-2
pandemic virus within its borders in line with the goal it adopted to achieve this (2). Some Australian
states may also be approaching elimination status, but for Australia as a whole, elimination might not
be achievable and the country might persist with a suppression strategy until a vaccine is widely
available. Nevertheless, quarantine-free travel between the two countries is a goal envisaged by the
. CC-BY-NC-ND 4.0 International licenseIt is made available under a is the author/funder, who has granted medRxiv a license to display the preprint in perpetuity. (which was not certified by peer review)
The copyright holder for this preprintthis version posted June 14, 2020. ; https://doi.org/10.1101/2020.06.10.20127977doi: medRxiv preprint
NOTE: This preprint reports new research that has not been certified by peer review and should not be used to guide clinical practice.

2
Prime Ministers of Australia and New Zealand in terms of a trans-Tasman “bubble” (3). Such an
approach has been discussed by the leaders of Austria, Greece, Israel, Norway, Denmark, the Czech
Republic, Singapore, Australia, and New Zealand. These leaders “agreed that as each begins to ease
restrictions they could capitalise on low infection rates by creating tourism safe zones” (4).
Nevertheless, such travel arrangements may be even more likely between New Zealand and those
Pacific Island nations that have either successfully eliminated COVID-19 (e.g., as Fiji has declared)
or which have been able to keep it out entirely due to strict border controls (e.g., Samoa, Tonga and
Vanuatu).
Another development has been that many major airlines are also bringing in procedures to improve
safety on flights to reduce the risk of SARS-CoV-2 transmission. These include physical distancing
procedures and requirements for passengers and cabin crew to wear masks (5).
Given this background, we aimed to estimate the risk of COVID-19 outbreaks associated with
increased air travel from Australia to New Zealand, along with the likely impact of various control
measures that could be used to minimize the risk of such outbreaks.
Methods
Model design and parameters for SARS-CoV-2 and COVID-19: We used a stochastic SEIR type
model with key compartments for: susceptible [S], exposed [E], infected [I], and recovered/removed
[R]. The model is a stochastic version of CovidSIM which was developed specifically for COVID-19
(http://covidsim.eu; version 1.1). Work has been published from previous versions of this model (6)
(7), and two preprints detail the equations and their stochastic treatment (8, 9). The model was built
in Pascal and 100 million simulations were run for each set of parameter values. Such a large number
of simulations was necessary due to the high probability of zero infected individuals on a flight given
the low prevalence of infection in Australia (see below).
The parameters were based on available publications and best estimates used in the published
modelling work on COVID-19 (as known to us on 27 May 2020). A key one was that 65% of
infected COVID-19 cases develop clearly detectable symptoms (Table 1). Another was the effective
reproduction number (Re) in COVID-19-free New Zealand, which was assumed to be 2.0 (Table 1).
Prevalence of infection in Australia: To estimate the prevalence of SARS-CoV-2 infection in
Australia, we assumed that there was the same number of undetected cases as there were detected
cases. So we used 27 May 2020 data, when Australia reported 65 new detected cases for the
preceding seven days (10). Then assuming a 16-day long period (latent period plus infectious
period), this suggested a point prevalence of infected cases of 0.0006% ((65/7 x 16) / 25.46 million
people). For the simulations, passengers were randomly sampled from the Australian population. The
infection risk for the cabin crew was elevated due to in-flight transmission on serial flights that we
modelled (detailed further below). In most of our scenarios, passengers and cabin crew members
underwent entry screening before boarding (see Figure 1 and details below).
. CC-BY-NC-ND 4.0 International licenseIt is made available under a is the author/funder, who has granted medRxiv a license to display the preprint in perpetuity. (which was not certified by peer review)
The copyright holder for this preprintthis version posted June 14, 2020. ; https://doi.org/10.1101/2020.06.10.20127977doi: medRxiv preprint

3
Figure 1: Flow diagram of the assumed movements of passengers and cabin crew in the model including interventions (simplified and not showing the precise details for how the cabin crew move back and forward between countries and the details around passengers seeking medical attention when symptomatic in New Zealand, isolation of identified cases and contact tracing)
Selection of control measures: We identified plausible control measures from the published
literature and also an online review of strategies identified by an IATA Medical Advisory Group
(11). These controls are shown in Figure 1 and Table 2.
Air travel from Australia to New Zealand: We simulated one flight per day from Australia to New
Zealand, carrying 300 passengers and 6 cabin crew members. A wide range of aircraft were used on
this route in the pre-pandemic era with common ones being the Boeing 777-200 which takes 312
passengers and the Airbus A300-300 with 297 passengers. We used the minimum ratio of one cabin
crew member to 50 seats (as required by some regulators), on the assumption that there might be new
processes that reduce crew workloads (e.g., meals/drinks placed on seats in advance). This is a small
proportion of the level of travel in the pre-pandemic time (i.e., 7.1% of the of 1,542,467 visitor
arrivals from Australia to New Zealand in the year to January 2020 (12)).
In-flight transmission risk: There are several publications that suggest transmission of SARS-CoV-
2 on aircraft. One reported on 11 patients who “were diagnosed after having flown together in the
same flight with no passenger that could later be identified as the source of infection” (13). Another
reported a single case “most likely acquired during a flight” (14). But a flight with an index patient
who had a dry cough when onboard did not appear to spread infection to any of the approximately
350 passengers (15). An IATA document (11) has reported a number of flights with passengers with
SARS-CoV-2 infection who apparently infected no other passengers, but also one UK to Vietnam
flight with “up to 14 people” infected. Also, based on an IATA survey of four airlines, it was
reported that: “There was one possible secondary passenger case identified in the total, along with
just two crew cases, thought to be the result of possible in-flight transmission” (11).
. CC-BY-NC-ND 4.0 International licenseIt is made available under a is the author/funder, who has granted medRxiv a license to display the preprint in perpetuity. (which was not certified by peer review)
The copyright holder for this preprintthis version posted June 14, 2020. ; https://doi.org/10.1101/2020.06.10.20127977doi: medRxiv preprint
4
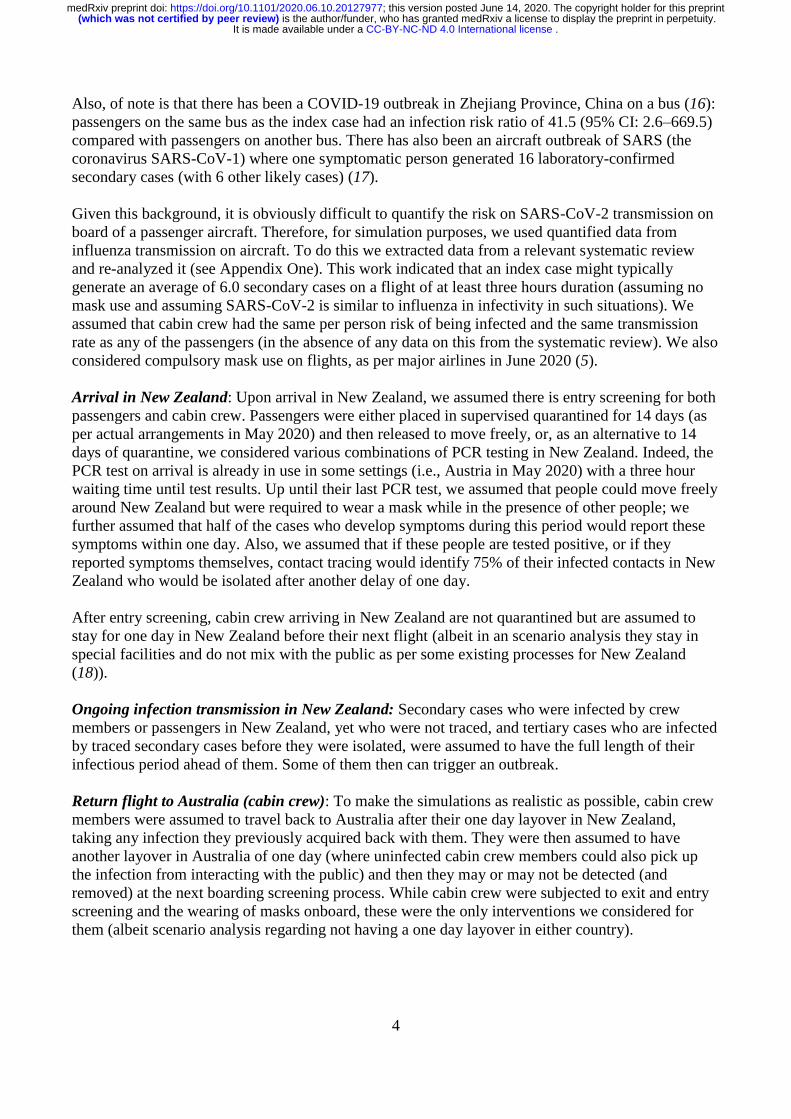
Also, of note is that there has been a COVID-19 outbreak in Zhejiang Province, China on a bus (16):
passengers on the same bus as the index case had an infection risk ratio of 41.5 (95% CI: 2.6–669.5)
compared with passengers on another bus. There has also been an aircraft outbreak of SARS (the
coronavirus SARS-CoV-1) where one symptomatic person generated 16 laboratory-confirmed
secondary cases (with 6 other likely cases) (17).
Given this background, it is obviously difficult to quantify the risk on SARS-CoV-2 transmission on
board of a passenger aircraft. Therefore, for simulation purposes, we used quantified data from
influenza transmission on aircraft. To do this we extracted data from a relevant systematic review
and re-analyzed it (see Appendix One). This work indicated that an index case might typically
generate an average of 6.0 secondary cases on a flight of at least three hours duration (assuming no
mask use and assuming SARS-CoV-2 is similar to influenza in infectivity in such situations). We
assumed that cabin crew had the same per person risk of being infected and the same transmission
rate as any of the passengers (in the absence of any data on this from the systematic review). We also
considered compulsory mask use on flights, as per major airlines in June 2020 (5).
Arrival in New Zealand: Upon arrival in New Zealand, we assumed there is entry screening for both
passengers and cabin crew. Passengers were either placed in supervised quarantined for 14 days (as
per actual arrangements in May 2020) and then released to move freely, or, as an alternative to 14
days of quarantine, we considered various combinations of PCR testing in New Zealand. Indeed, the
PCR test on arrival is already in use in some settings (i.e., Austria in May 2020) with a three hour
waiting time until test results. Up until their last PCR test, we assumed that people could move freely
around New Zealand but were required to wear a mask while in the presence of other people; we
further assumed that half of the cases who develop symptoms during this period would report these
symptoms within one day. Also, we assumed that if these people are tested positive, or if they
reported symptoms themselves, contact tracing would identify 75% of their infected contacts in New
Zealand who would be isolated after another delay of one day.
After entry screening, cabin crew arriving in New Zealand are not quarantined but are assumed to
stay for one day in New Zealand before their next flight (albeit in an scenario analysis they stay in
special facilities and do not mix with the public as per some existing processes for New Zealand
(18)).
Ongoing infection transmission in New Zealand: Secondary cases who were infected by crew
members or passengers in New Zealand, yet who were not traced, and tertiary cases who are infected
by traced secondary cases before they were isolated, were assumed to have the full length of their
infectious period ahead of them. Some of them then can trigger an outbreak.
Return flight to Australia (cabin crew): To make the simulations as realistic as possible, cabin crew
members were assumed to travel back to Australia after their one day layover in New Zealand,
taking any infection they previously acquired back with them. They were then assumed to have
another layover in Australia of one day (where uninfected cabin crew members could also pick up
the infection from interacting with the public) and then they may or may not be detected (and
removed) at the next boarding screening process. While cabin crew were subjected to exit and entry
screening and the wearing of masks onboard, these were the only interventions we considered for
them (albeit scenario analysis regarding not having a one day layover in either country).
. CC-BY-NC-ND 4.0 International licenseIt is made available under a is the author/funder, who has granted medRxiv a license to display the preprint in perpetuity. (which was not certified by peer review)
The copyright holder for this preprintthis version posted June 14, 2020. ; https://doi.org/10.1101/2020.06.10.20127977doi: medRxiv preprint
5
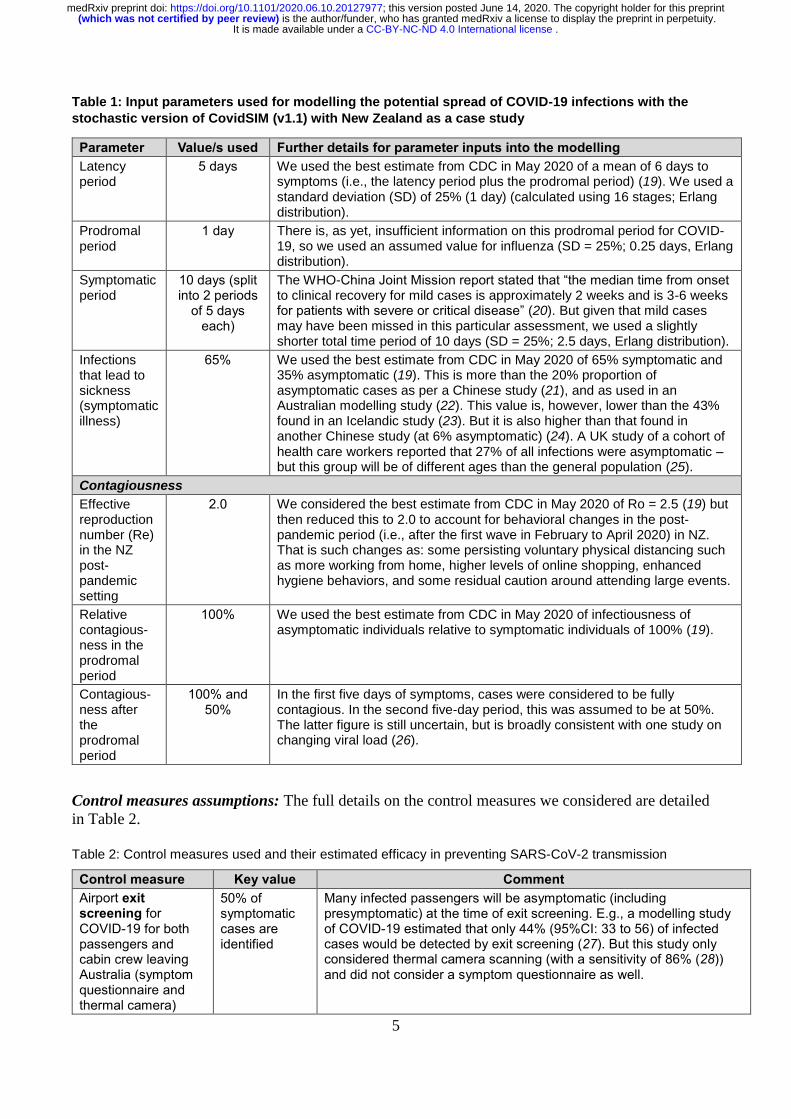
Table 1: Input parameters used for modelling the potential spread of COVID-19 infections with the
stochastic version of CovidSIM (v1.1) with New Zealand as a case study
Parameter Value/s used Further details for parameter inputs into the modelling
Latency period
5 days We used the best estimate from CDC in May 2020 of a mean of 6 days to symptoms (i.e., the latency period plus the prodromal period) (19). We used a standard deviation (SD) of 25% (1 day) (calculated using 16 stages; Erlang distribution).
Prodromal period
1 day There is, as yet, insufficient information on this prodromal period for COVID-19, so we used an assumed value for influenza (SD = 25%; 0.25 days, Erlang distribution).
Symptomatic period
10 days (split into 2 periods
of 5 days each)
The WHO-China Joint Mission report stated that “the median time from onset to clinical recovery for mild cases is approximately 2 weeks and is 3-6 weeks for patients with severe or critical disease” (20). But given that mild cases may have been missed in this particular assessment, we used a slightly shorter total time period of 10 days (SD = 25%; 2.5 days, Erlang distribution).
Infections that lead to sickness (symptomatic illness)
65%
We used the best estimate from CDC in May 2020 of 65% symptomatic and 35% asymptomatic (19). This is more than the 20% proportion of asymptomatic cases as per a Chinese study (21), and as used in an Australian modelling study (22). This value is, however, lower than the 43% found in an Icelandic study (23). But it is also higher than that found in another Chinese study (at 6% asymptomatic) (24). A UK study of a cohort of health care workers reported that 27% of all infections were asymptomatic – but this group will be of different ages than the general population (25).
Contagiousness
Effective reproduction number (Re) in the NZ post-pandemic setting
2.0 We considered the best estimate from CDC in May 2020 of Ro = 2.5 (19) but then reduced this to 2.0 to account for behavioral changes in the post-pandemic period (i.e., after the first wave in February to April 2020) in NZ. That is such changes as: some persisting voluntary physical distancing such as more working from home, higher levels of online shopping, enhanced hygiene behaviors, and some residual caution around attending large events.
Relative contagious-ness in the prodromal period
100% We used the best estimate from CDC in May 2020 of infectiousness of asymptomatic individuals relative to symptomatic individuals of 100% (19).
Contagious-ness after the prodromal period
100% and 50%
In the first five days of symptoms, cases were considered to be fully contagious. In the second five-day period, this was assumed to be at 50%. The latter figure is still uncertain, but is broadly consistent with one study on changing viral load (26).
Control measures assumptions: The full details on the control measures we considered are detailed
in Table 2.
Table 2: Control measures used and their estimated efficacy in preventing SARS-CoV-2 transmission
Control measure Key value Comment
Airport exit screening for COVID-19 for both passengers and cabin crew leaving Australia (symptom questionnaire and thermal camera)
50% of symptomatic cases are identified
Many infected passengers will be asymptomatic (including presymptomatic) at the time of exit screening. E.g., a modelling study of COVID-19 estimated that only 44% (95%CI: 33 to 56) of infected cases would be detected by exit screening (27). But this study only considered thermal camera scanning (with a sensitivity of 86% (28)) and did not consider a symptom questionnaire as well.
. CC-BY-NC-ND 4.0 International licenseIt is made available under a is the author/funder, who has granted medRxiv a license to display the preprint in perpetuity. (which was not certified by peer review)
The copyright holder for this preprintthis version posted June 14, 2020. ; https://doi.org/10.1101/2020.06.10.20127977doi: medRxiv preprint

6
Control measure Key value Comment
Required mask use on flights by passengers and cabin crew (except when drinking and eating)
90% efficacy for both groups
We considered the results of a systematic review and meta-analysis that reported that mask use could result in a large reduction in risk of infection (n=2647; adjusted odds ratio = 0·15, 95%CI: 0·07 to 0·34) (29). But we used a slightly higher estimate to better approximate supervised and enforced mask use on the aircraft flight.
Of note is that many major airlines are now requiring mask use by passengers (5), and the use of masks on planes by the general public is encouraged by the World Health Organization (30). Also of note is the experimental evidence for mask efficacy. E.g., one experimental study using Avian Influenza virus to simulate the pandemic coronavirus, showed that: “N95 masks, medical masks, and homemade masks made of four layer kitchen paper and one layer cloth could block 99.98%, 97.14%, and 95.15% of the virus in aerosols” respectively (31). Another experiment has shown how a damp cloth over a speakers mouth reduces emitted droplets detected by laser light scattering by over 99% (32). More specifically another study reported that a non-fitted surgical mask was 100% effective in blocking detection of seasonal coronavirus (albeit slightly less effective for when measuring viral load in the samples) (33).
Entry screening on arrival in NZ (both passengers and cabin crew)
50% of symptomatic cases identified
As per exit screening above (i.e., symptom questionnaire and thermal camera). Unless stated otherwise, we always applied entry screening for crew members; for passengers, we only used entry screening if they were not immediately to have a PCR test on arrival or are quarantined anyway.
Quarantine in NZ for passengers only (current practice as per May 2020 in NZ)
14 days We ran the simulations for the 14-day quarantine period to determine how many passengers were still infectious when quarantine ended. Of note is one estimate (34) that around 1% of people will still develop symptoms after 14 days (and will also be infectious at this time), but we do not use this estimate in our simulations, because the correct fraction depends on the infection stage of passengers at the beginning of their quarantine.
Testing instead of 14 days quarantine: PCR test for SARS-CoV-2 at various times
The time course of sensitivity values from Kucirka et al. was used
We used the results of a study (35) which fitted a Bayesian hierarchical logistic regression model for test sensitivity. This meant for example, at day 4 after infection, 67% of test results were false negatives (95%CI: 27% to 94%). This decreased to 20% (95%CI: 12% to 30%) on day 8 and then increased after this e.g., up to 66% (95%CI: 54% to 77%) on day 21. For cases who already recovered before their PCR test, we use the final value reported by Kucirka et al. (i.e., 34% sensitivity). In the days after arrival and before the next PCR test, we assume that people act normally and so can potentially spread infection to the NZ public (albeit with mask use when with other people). For more details, see Appendix Two.
In the absence of relevant data, we had to assume test result independence i.e., a false negative for a test was not correlated with a false negative for a later test. If both results were negative, we assumed no further follow-up.
We considered a wide range of different timing options for PCR tests after arrival in NZ.
Contact tracing if (i) a scheduled PCR test is positive or (ii) if people develop symptoms and seek medical attention (see below)
75% of infected contacts are traced and isolated
No detailed data on the efficacy of contact tracing has been published for NZ. Nevertheless, the success of contact tracing to identify the source of clusters as detailed on the NZ Ministry of Health website is 62% (10/16 clusters, 30 May data (36)). However, we assume here a slightly higher success rate given on-going learnings by the NZ health system.
Mandatory mask use by incoming
90% transmission
See above for details on the likely efficacy of mask use in reducing contagiousness (i.e., from an infected person spreading infection to
. CC-BY-NC-ND 4.0 International licenseIt is made available under a is the author/funder, who has granted medRxiv a license to display the preprint in perpetuity. (which was not certified by peer review)
The copyright holder for this preprintthis version posted June 14, 2020. ; https://doi.org/10.1101/2020.06.10.20127977doi: medRxiv preprint
7
Control measure Key value Comment
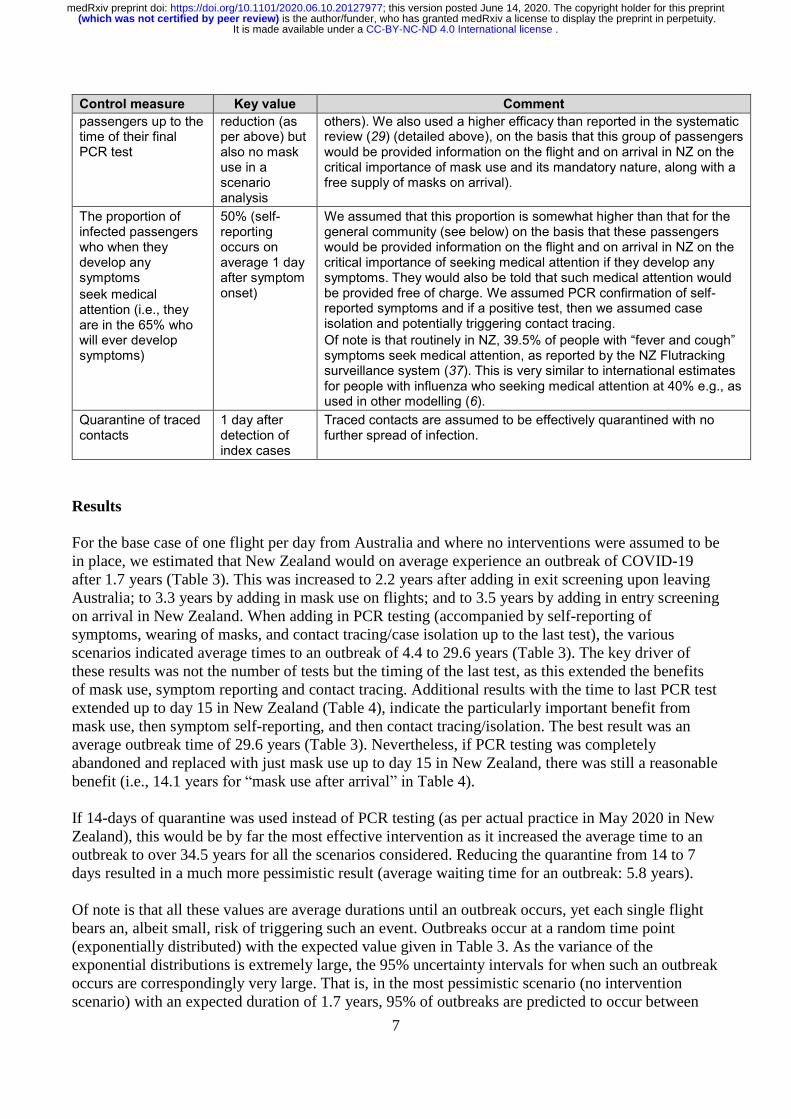
passengers up to the time of their final PCR test
reduction (as per above) but also no mask use in a scenario analysis
others). We also used a higher efficacy than reported in the systematic review (29) (detailed above), on the basis that this group of passengers would be provided information on the flight and on arrival in NZ on the critical importance of mask use and its mandatory nature, along with a free supply of masks on arrival).
The proportion of infected passengers who when they develop any symptoms
seek medical attention (i.e., they are in the 65% who will ever develop symptoms)
50% (self-reporting occurs on average 1 day after symptom onset)
We assumed that this proportion is somewhat higher than that for the general community (see below) on the basis that these passengers would be provided information on the flight and on arrival in NZ on the critical importance of seeking medical attention if they develop any symptoms. They would also be told that such medical attention would be provided free of charge. We assumed PCR confirmation of self-reported symptoms and if a positive test, then we assumed case isolation and potentially triggering contact tracing.
Of note is that routinely in NZ, 39.5% of people with “fever and cough” symptoms seek medical attention, as reported by the NZ Flutracking surveillance system (37). This is very similar to international estimates for people with influenza who seeking medical attention at 40% e.g., as used in other modelling (6).
Quarantine of traced contacts
1 day after detection of index cases
Traced contacts are assumed to be effectively quarantined with no further spread of infection.
Results
For the base case of one flight per day from Australia and where no interventions were assumed to be
in place, we estimated that New Zealand would on average experience an outbreak of COVID-19
after 1.7 years (Table 3). This was increased to 2.2 years after adding in exit screening upon leaving
Australia; to 3.3 years by adding in mask use on flights; and to 3.5 years by adding in entry screening
on arrival in New Zealand. When adding in PCR testing (accompanied by self-reporting of
symptoms, wearing of masks, and contact tracing/case isolation up to the last test), the various
scenarios indicated average times to an outbreak of 4.4 to 29.6 years (Table 3). The key driver of
these results was not the number of tests but the timing of the last test, as this extended the benefits
of mask use, symptom reporting and contact tracing. Additional results with the time to last PCR test
extended up to day 15 in New Zealand (Table 4), indicate the particularly important benefit from
mask use, then symptom self-reporting, and then contact tracing/isolation. The best result was an
average outbreak time of 29.6 years (Table 3). Nevertheless, if PCR testing was completely
abandoned and replaced with just mask use up to day 15 in New Zealand, there was still a reasonable
benefit (i.e., 14.1 years for “mask use after arrival” in Table 4).
If 14-days of quarantine was used instead of PCR testing (as per actual practice in May 2020 in New
Zealand), this would be by far the most effective intervention as it increased the average time to an
outbreak to over 34.5 years for all the scenarios considered. Reducing the quarantine from 14 to 7
days resulted in a much more pessimistic result (average waiting time for an outbreak: 5.8 years).
Of note is that all these values are average durations until an outbreak occurs, yet each single flight
bears an, albeit small, risk of triggering such an event. Outbreaks occur at a random time point
(exponentially distributed) with the expected value given in Table 3. As the variance of the
exponential distributions is extremely large, the 95% uncertainty intervals for when such an outbreak
occurs are correspondingly very large. That is, in the most pessimistic scenario (no intervention
scenario) with an expected duration of 1.7 years, 95% of outbreaks are predicted to occur between
. CC-BY-NC-ND 4.0 International licenseIt is made available under a is the author/funder, who has granted medRxiv a license to display the preprint in perpetuity. (which was not certified by peer review)
The copyright holder for this preprintthis version posted June 14, 2020. ; https://doi.org/10.1101/2020.06.10.20127977doi: medRxiv preprint

8
0.04 years (15 days) and about 6.09 years; in the most optimistic scenario (with quarantine) with an
expected duration of 34.1 years, 95% of outbreaks occur between 0.86 and 126 years.
Passengers as a group were the major driver of outbreak risk relative to cabin crew: they caused over
100 times as many outbreaks as cabin crew members (depending on the scenario). Passengers also
caused more outbreaks on a per capita basis than cabin crew, given the 50:1 ratio of these groups per
flight.
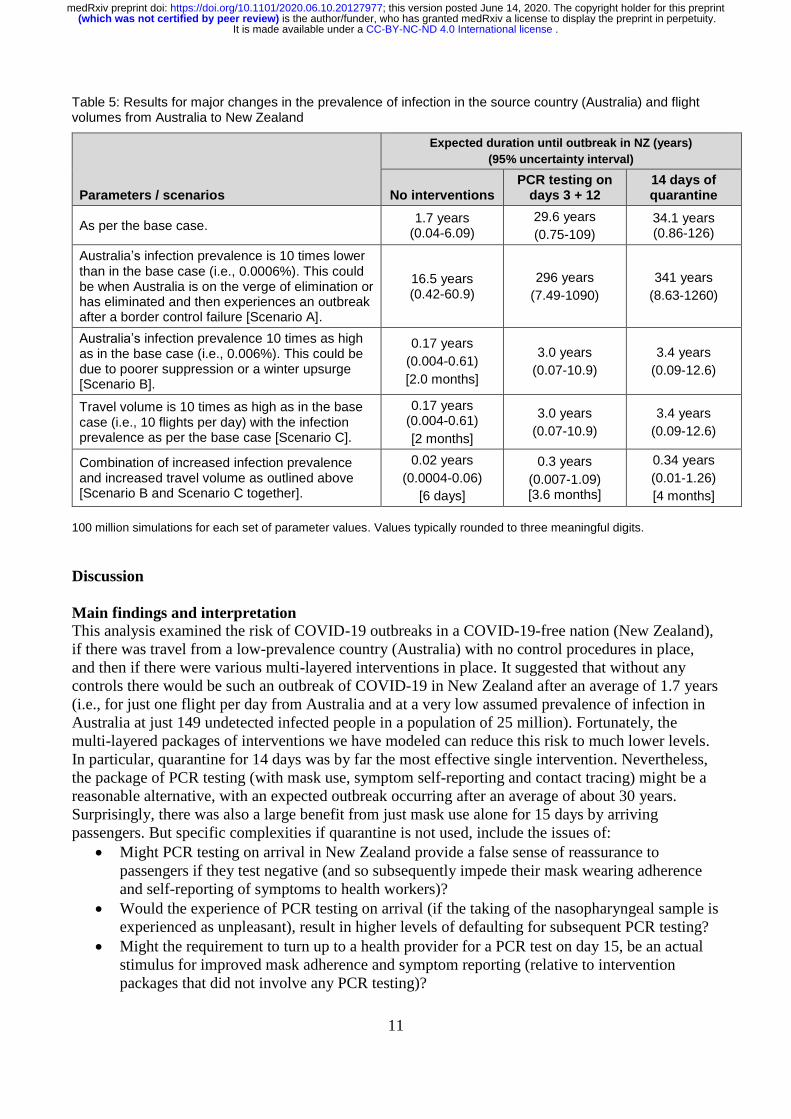
Table 5 indicates the extreme rarity of outbreaks in New Zealand if Australia’s infection prevalence
was 10 times lower than in the base case (i.e., approximating if Australia is on the verge of
elimination or has eliminated and then experiences a small undetected outbreak from a border control
failure). But when scaling up from the base case to ten-fold higher infection prevalence in Australia
or ten-fold increase in travel volumes from Australia to New Zealand, then the results scale up
accordingly. For each of these scenarios individually, there would typically be an outbreak every 3.0
years for using PCR testing or 3.4 years for the quarantine intervention (Table 5).
. CC-BY-NC-ND 4.0 International licenseIt is made available under a is the author/funder, who has granted medRxiv a license to display the preprint in perpetuity. (which was not certified by peer review)
The copyright holder for this preprintthis version posted June 14, 2020. ; https://doi.org/10.1101/2020.06.10.20127977doi: medRxiv preprint
9
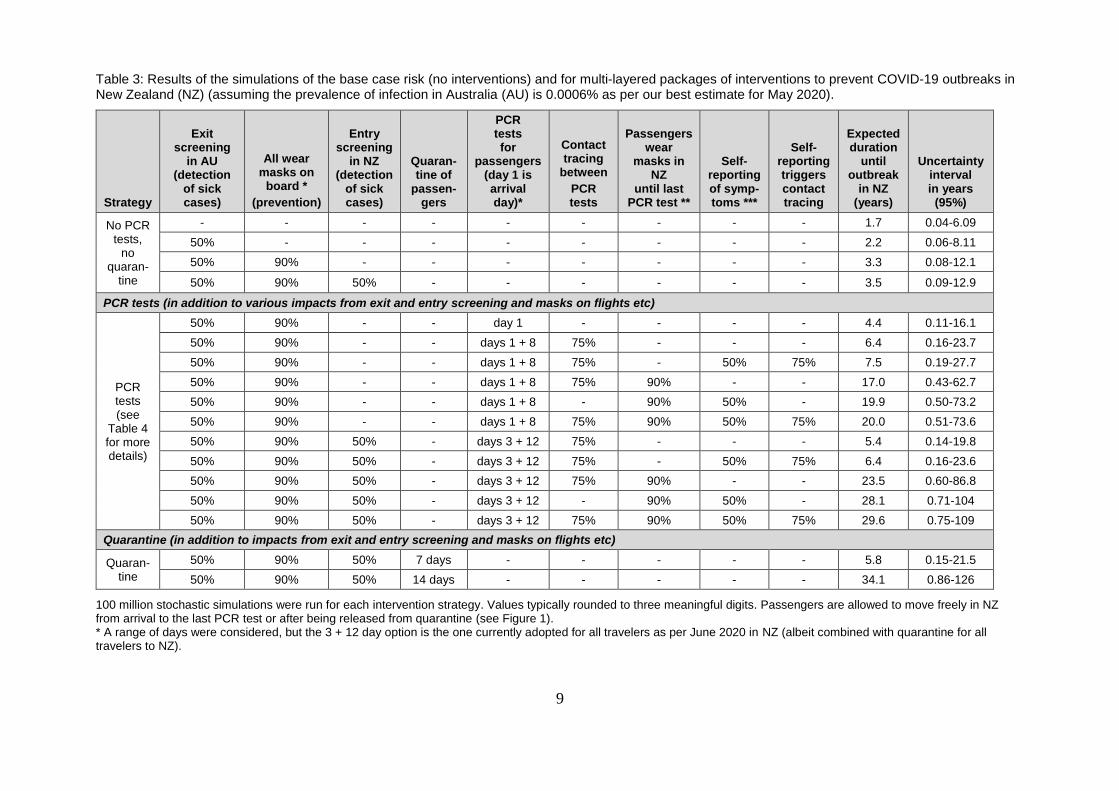
Table 3: Results of the simulations of the base case risk (no interventions) and for multi-layered packages of interventions to prevent COVID-19 outbreaks in New Zealand (NZ) (assuming the prevalence of infection in Australia (AU) is 0.0006% as per our best estimate for May 2020).
Strategy
Exit screening
in AU (detection
of sick cases)
All wear masks on
board *
(prevention)
Entry screening
in NZ (detection
of sick cases)
Quaran-tine of
passen-gers
PCR tests for
passengers (day 1 is arrival day)*
Contact tracing
between
PCR tests
Passengers wear
masks in NZ
until last PCR test **
Self-reporting of symp-toms ***
Self-reporting triggers contact tracing
Expected duration
until outbreak
in NZ (years)
Uncertainty interval in years
(95%)
No PCR tests,
no quaran-
tine
- - - - - - - - - 1.7 0.04-6.09
50% - - - - - - - - 2.2 0.06-8.11
50% 90% - - - - - - - 3.3 0.08-12.1
50% 90% 50% - - - - - - 3.5 0.09-12.9
PCR tests (in addition to various impacts from exit and entry screening and masks on flights etc)
PCR tests (see
Table 4 for more details)
50% 90% - - day 1 - - - - 4.4 0.11-16.1
50% 90% - - days 1 + 8 75% - - - 6.4 0.16-23.7
50% 90% - - days 1 + 8 75% - 50% 75% 7.5 0.19-27.7
50% 90% - - days 1 + 8 75% 90% - - 17.0 0.43-62.7
50% 90% - - days 1 + 8 - 90% 50% - 19.9 0.50-73.2
50% 90% - - days 1 + 8 75% 90% 50% 75% 20.0 0.51-73.6
50% 90% 50% - days 3 + 12 75% - - - 5.4 0.14-19.8
50% 90% 50% - days 3 + 12 75% - 50% 75% 6.4 0.16-23.6
50% 90% 50% - days 3 + 12 75% 90% - - 23.5 0.60-86.8
50% 90% 50% - days 3 + 12 - 90% 50% - 28.1 0.71-104
50% 90% 50% - days 3 + 12 75% 90% 50% 75% 29.6 0.75-109
Quarantine (in addition to impacts from exit and entry screening and masks on flights etc)
Quaran-tine
50% 90% 50% 7 days - - - - - 5.8 0.15-21.5
50% 90% 50% 14 days - - - - - 34.1 0.86-126
100 million stochastic simulations were run for each intervention strategy. Values typically rounded to three meaningful digits. Passengers are allowed to move freely in NZ from arrival to the last PCR test or after being released from quarantine (see Figure 1). * A range of days were considered, but the 3 + 12 day option is the one currently adopted for all travelers as per June 2020 in NZ (albeit combined with quarantine for all travelers to NZ).
. CC-BY-NC-ND 4.0 International licenseIt is made available under a is the author/funder, who has granted medRxiv a license to display the preprint in perpetuity. (which was not certified by peer review)
The copyright holder for this preprintthis version posted June 14, 2020. ; https://doi.org/10.1101/2020.06.10.20127977doi: medRxiv preprint
10
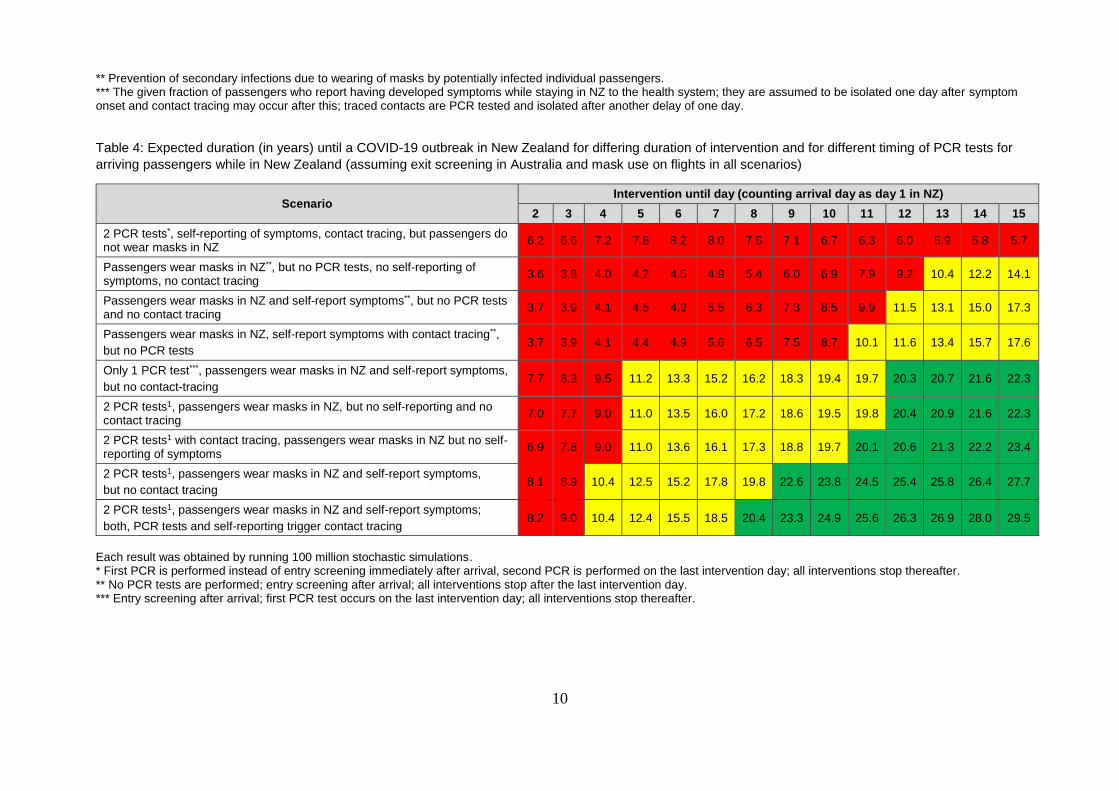
** Prevention of secondary infections due to wearing of masks by potentially infected individual passengers. *** The given fraction of passengers who report having developed symptoms while staying in NZ to the health system; they are assumed to be isolated one day after symptom onset and contact tracing may occur after this; traced contacts are PCR tested and isolated after another delay of one day.
Table 4: Expected duration (in years) until a COVID-19 outbreak in New Zealand for differing duration of intervention and for different timing of PCR tests for
arriving passengers while in New Zealand (assuming exit screening in Australia and mask use on flights in all scenarios)
Scenario Intervention until day (counting arrival day as day 1 in NZ)
2 3 4 5 6 7 8 9 10 11 12 13 14 15
2 PCR tests*, self-reporting of symptoms, contact tracing, but passengers do not wear masks in NZ
6.2 6.6 7.2 7.8 8.2 8.0 7.5 7.1 6.7 6.3 6.0 5.9 5.8 5.7
Passengers wear masks in NZ**, but no PCR tests, no self-reporting of symptoms, no contact tracing
3.6 3.8 4.0 4.2 4.5 4.9 5.4 6.0 6.9 7.9 9.2 10.4 12.2 14.1
Passengers wear masks in NZ and self-report symptoms**, but no PCR tests and no contact tracing
3.7 3.9 4.1 4.5 4.9 5.5 6.3 7.3 8.5 9.9 11.5 13.1 15.0 17.3
Passengers wear masks in NZ, self-report symptoms with contact tracing**,
but no PCR tests 3.7 3.9 4.1 4.4 4.9 5.6 6.5 7.5 8.7 10.1 11.6 13.4 15.7 17.6
Only 1 PCR test***, passengers wear masks in NZ and self-report symptoms,
but no contact-tracing 7.7 8.3 9.5 11.2 13.3 15.2 16.2 18.3 19.4 19.7 20.3 20.7 21.6 22.3
2 PCR tests1, passengers wear masks in NZ, but no self-reporting and no contact tracing
7.0 7.7 9.0 11.0 13.5 16.0 17.2 18.6 19.5 19.8 20.4 20.9 21.6 22.3
2 PCR tests1 with contact tracing, passengers wear masks in NZ but no self-reporting of symptoms
6.9 7.8 9.0 11.0 13.6 16.1 17.3 18.8 19.7 20.1 20.6 21.3 22.2 23.4
2 PCR tests1, passengers wear masks in NZ and self-report symptoms,
but no contact tracing 8.1 8.9 10.4 12.5 15.2 17.8 19.8 22.6 23.8 24.5 25.4 25.8 26.4 27.7
2 PCR tests1, passengers wear masks in NZ and self-report symptoms;
both, PCR tests and self-reporting trigger contact tracing 8.2 9.0 10.4 12.4 15.5 18.5 20.4 23.3 24.9 25.6 26.3 26.9 28.0 29.5
Each result was obtained by running 100 million stochastic simulations. * First PCR is performed instead of entry screening immediately after arrival, second PCR is performed on the last intervention day; all interventions stop thereafter. ** No PCR tests are performed; entry screening after arrival; all interventions stop after the last intervention day. *** Entry screening after arrival; first PCR test occurs on the last intervention day; all interventions stop thereafter.
. CC-BY-NC-ND 4.0 International licenseIt is made available under a is the author/funder, who has granted medRxiv a license to display the preprint in perpetuity. (which was not certified by peer review)
The copyright holder for this preprintthis version posted June 14, 2020. ; https://doi.org/10.1101/2020.06.10.20127977doi: medRxiv preprint
11
Table 5: Results for major changes in the prevalence of infection in the source country (Australia) and flight volumes from Australia to New Zealand
Parameters / scenarios
Expected duration until outbreak in NZ (years)
(95% uncertainty interval)
No interventions PCR testing on
days 3 + 12 14 days of quarantine
As per the base case. 1.7 years
(0.04-6.09)
29.6 years
(0.75-109)
34.1 years (0.86-126)
Australia’s infection prevalence is 10 times lower than in the base case (i.e., 0.0006%). This could be when Australia is on the verge of elimination or has eliminated and then experiences an outbreak after a border control failure [Scenario A].
16.5 years (0.42-60.9)
296 years
(7.49-1090)
341 years
(8.63-1260)
Australia’s infection prevalence 10 times as high as in the base case (i.e., 0.006%). This could be due to poorer suppression or a winter upsurge [Scenario B].
0.17 years
(0.004-0.61)
[2.0 months]
3.0 years
(0.07-10.9)
3.4 years
(0.09-12.6)
Travel volume is 10 times as high as in the base case (i.e., 10 flights per day) with the infection prevalence as per the base case [Scenario C].
0.17 years (0.004-0.61)
[2 months]
3.0 years
(0.07-10.9)
3.4 years
(0.09-12.6)
Combination of increased infection prevalence and increased travel volume as outlined above [Scenario B and Scenario C together].
0.02 years
(0.0004-0.06)
[6 days]
0.3 years
(0.007-1.09) [3.6 months]
0.34 years
(0.01-1.26)
[4 months]
100 million simulations for each set of parameter values. Values typically rounded to three meaningful digits.
Discussion
Main findings and interpretation
This analysis examined the risk of COVID-19 outbreaks in a COVID-19-free nation (New Zealand),
if there was travel from a low-prevalence country (Australia) with no control procedures in place,
and then if there were various multi-layered interventions in place. It suggested that without any
controls there would be such an outbreak of COVID-19 in New Zealand after an average of 1.7 years
(i.e., for just one flight per day from Australia and at a very low assumed prevalence of infection in
Australia at just 149 undetected infected people in a population of 25 million). Fortunately, the
multi-layered packages of interventions we have modeled can reduce this risk to much lower levels.
In particular, quarantine for 14 days was by far the most effective single intervention. Nevertheless,
the package of PCR testing (with mask use, symptom self-reporting and contact tracing) might be a
reasonable alternative, with an expected outbreak occurring after an average of about 30 years.
Surprisingly, there was also a large benefit from just mask use alone for 15 days by arriving
passengers. But specific complexities if quarantine is not used, include the issues of:
Might PCR testing on arrival in New Zealand provide a false sense of reassurance to
passengers if they test negative (and so subsequently impede their mask wearing adherence
and self-reporting of symptoms to health workers)?
Would the experience of PCR testing on arrival (if the taking of the nasopharyngeal sample is
experienced as unpleasant), result in higher levels of defaulting for subsequent PCR testing?
Might the requirement to turn up to a health provider for a PCR test on day 15, be an actual
stimulus for improved mask adherence and symptom reporting (relative to intervention
packages that did not involve any PCR testing)?
. CC-BY-NC-ND 4.0 International licenseIt is made available under a is the author/funder, who has granted medRxiv a license to display the preprint in perpetuity. (which was not certified by peer review)
The copyright holder for this preprintthis version posted June 14, 2020. ; https://doi.org/10.1101/2020.06.10.20127977doi: medRxiv preprint

12
Would adherence to mask use by passengers when in the New Zealand community be as high
as we assume (given the minimal use of masks in the first pandemic wave in New Zealand
and lack of Government mandates for mass masking at any of the four alert levels of COVID-
19 response)? Also, might the use of fines and threat of deportation improve adherence with
mask use amongst passengers once in New Zealand?
Might digital tools for tracking and even active monitoring of early signs of illness have a
role in minimizing risk amongst incoming passengers (especially in the first two to three
weeks after arrival?
All these issues could benefit from further investigation, potentially involving state-of-the art study
designs that remain possible under pandemic conditions (38).
Nevertheless, to select the best multi-layered package of interventions requires information on not
only their estimated effectiveness, but also their estimated real-world cost-effectiveness, feasibility,
acceptability and adherence with the traveling public, airlines and border control services. Obtaining
such information would include studying the cost of dealing with false positives of PCR testing and
the resources spent chasing up passengers who miss attending their scheduled PCR tests. There is
also the need to identify the cost of the New Zealand public health system maintaining a state-of-the
art contact tracing capacity (though this may be highly desirable for other reasons such as control of
measles outbreaks). The relevance of these costs to policy-makers might also be impacted by who is
paying. For example, all incoming passengers could be charged a COVID-19 levy and the whole
system could be made user-pays and cost-neutral to taxpayers.
Ultimately, there is also a need for cost-benefit analyses which considers the benefits of increased
travel to the New Zealand society and economy – along with the risks of outbreaks that need to be
rapidly controlled (and might even get completely out of control). With such information policy-
makers could then decide:
On continuing with the 14-day quarantine or shifting to PCR testing with mask use
interventions.
On the extent to which they open up traveler volumes for different types of traveler from
specified low-risk countries (e.g., including essential workers, students, business people, or
tourists).
On the extent to which they fund research on evaluating antibody tests to determine if some
previously exposed passengers can be exempted some of the quarantine or PCR testing
processes (though the quality of such antibody tests is still suboptimal and specificity might
be a problem owing to other circulating coronaviruses).
Study strengths and limitations
This is the first such modeling study (that we know of), to consider interventions to control SARS-
CoV-2 spread by air travel between two countries. We were also able to consider a wide range of
control interventions and to package these in multiple layers of defense and estimate uncertainty
intervals. Nevertheless, there is quite high uncertainty around some of the parameters we used. For
example, the prevalence of infection in Australia is highly variable by States/Territories, and this is
also likely to vary over time. Real-world effectiveness of masks on aircraft is still uncertain, along
with how well SARS-CoV-2 can spread on aircraft. For example, there is some evidence that this
pandemic virus is particularly involved in super-spreading events with one estimate being that 80%
of secondary transmissions may have been caused by a small fraction (e.g., ~10%) of infectious
individuals (39). Given all such issues and ongoing improvements in knowledge of the transmission
. CC-BY-NC-ND 4.0 International licenseIt is made available under a is the author/funder, who has granted medRxiv a license to display the preprint in perpetuity. (which was not certified by peer review)
The copyright holder for this preprintthis version posted June 14, 2020. ; https://doi.org/10.1101/2020.06.10.20127977doi: medRxiv preprint

13
dynamics of SARS-CoV-2, this type of modeling work should be regularly revised and be performed
using different types of models.
Conclusions
This analysis suggests that an outbreak of COVID-19 in New Zealand might occur after an average
of 1.7 years without any interventions and for just one flight per day from Australia. This risk is
greatly reduced by the currently used 14-day mandatory quarantine. Our analysis shows that there is
potential to replace this quarantine period with multi-layered interventions using PCR testing or
other controls, including mask use by passengers in New Zealand, that would also maintain a low
risk of importing the pandemic virus. However, all approaches require continuous careful
management and evaluation.
Competing interests: The authors have no competing interests.
Acknowledgements: Professor Wilson is supported by the New Zealand Health Research Council
(16/443) and Ministry of Business Innovation and Employment (MBIE) funding of the BODE3
Programme (UOOX1406). Professor Michael Baker is supported by a New Zealand Health Research
Council grant for research on COVID-19 (20/1066).
Appendix One: Estimating the risk of SARS-CoV-2 in-flight transmission
for one index case and with no mask use by cabin crew or passengers
Methods
We extracted data from the single available systematic review of in-flight outbreaks of influenza
(40), the majority (14/19) of which were related to the pandemic influenza of 2009. For one outbreak
with missing flight duration data, we estimated this using Google Maps and one study was removed
from the dataset as it appeared to be of the same flight as another included study (as noted by the
review authors). The results of our analysis are shown in Table A1.
Discussion
There is of course the limitation here that although pandemic influenza is a respiratory virus like
SARS-CoV-2, these two agents might still have different transmission dynamics in the aircraft cabin
setting. Another issue is that the in-flight influenza outbreaks in the systematic review did suffer
from incomplete contact tracing (mean of 73% traced, median of 86% traced), and so the true burden
of secondary cases is probably somewhat higher for these outbreaks. But countering this is the
possibility that there might have been publication bias involved, given that in this review there were
only 4/19 studies with zero secondary cases. This might suggest that large in-flight outbreaks of
influenza were more likely to be studied (and published on) than those with no or little secondary
spread. This may somewhat over-estimate the in-flight transmission of influenza, but it may be more
. CC-BY-NC-ND 4.0 International licenseIt is made available under a is the author/funder, who has granted medRxiv a license to display the preprint in perpetuity. (which was not certified by peer review)
The copyright holder for this preprintthis version posted June 14, 2020. ; https://doi.org/10.1101/2020.06.10.20127977doi: medRxiv preprint

14
appropriate for the transmission of SARS-CoV-2 which seems to have a higher reproduction number
than influenza.
Table A1: Our analysis of extracted data from a published systematic review (40) of influenza outbreaks on aircraft flights
Type of flight
Secondary cases per flight when just
considering a single index case
Secondary cases per flight when
considering both single and multiple
index cases
Adjusted secondary cases per flight when
scaling to the equivalent of a single
index case in each outbreak
All flights (n = 19 flights*) 8.0 8.3 5.2
Flight length ≤ 3 hours, ≤150 passengers (n = 8 flights)
7.6
7.8 5.3
Flight length ≤ 3 hours, >150 passengers (n = 0 flights)
– – –
Flight length > 3 hours, ≤150 passengers (n = 1 flights)*
Ignored: only 1 flight Ignored: only 1 flight Ignored: only 1 flight
Flight length > 3 hours, >150 passengers (n = 10 flights)*
6.0 (this is the value we used for
our Australia to NZ flight modeling for the no mask use
scenario)
7.6 3.7
* Some longer flights included transfers and stopovers (which were treated in the analysis as one flight but we only considering flying time in the calculation of hours, except for one particular stopover where passengers remained on the plane).
Appendix Two: Sensitivity of PCR tests during the course of infection
Kucirka et al (35) provide in their Figure 2 estimates on the time-course of the fraction of false-
negative PCR results. We have reproduced their curve and translated it into a time-course that gives
the test sensitivity for infected individuals, depending on the time since they were exposed to
infection. As our simulations are not individual-based, but stochastic representations of a
compartmental model, we cannot exactly know the time since exposure for an infected individual
who is in a given state of infection (which is represented by one of the 16 latent stages, the 16
prodromal stages, the 16 early and the 16 late infections stages). In order to match these 4x16
infection stages, we ran one million stochastic simulations with one infected individual each,
recorded the time when this individual entered or left any one of these stages and finally calculated
the individual’s middle time point (since infection) for each of the 4x16 infection stages. In the next
step, we recorded the sensitivity values that corresponded to the recorded 4x16 simulated time points
of the individual, leading to one million simulation-matched values for each of the 4x16 infection
stages. In a final step, we averaged over these one million values, obtaining 4x16 sensitivity values
for the infection stages that we used in the simulations.
References
1. World Health Organization. Coronavirus disease (COVID-19) Situation Report – 135.
2020;(3 June). https://www.who.int/emergencies/diseases/novel-coronavirus-2019/situation-
reports.
. CC-BY-NC-ND 4.0 International licenseIt is made available under a is the author/funder, who has granted medRxiv a license to display the preprint in perpetuity. (which was not certified by peer review)
The copyright holder for this preprintthis version posted June 14, 2020. ; https://doi.org/10.1101/2020.06.10.20127977doi: medRxiv preprint

15
2. Baker M, Kvalsvig A, Verrall A, Telfar-Barnard L, Wilson N. New Zealand’s elimination
strategy for the COVID-19 pandemic and what is required to make it work. N Z Med J.
2020;133(1512):10-4.
3. Radio New Zealand. Trans-Tasman bubble: Jacinda Ardern gives details of Australian
Cabinet meeting. Radio NZ 2020;(5 May).
https://www.rnz.co.nz/news/political/415869/trans-tasman-bubble-jacinda-ardern-gives-
details-of-australian-cabinet-meeting.
4. Graham-Harrison E, Smith H. What is the future for travel and migration in age of Covid-19?
Guardian 2020;(12 May). https://www.theguardian.com/world/2020/may/12/what-is-the-
future-for-travel-and-immigration-in-age-of-covid-19.
5. Asaf S. Airlines and face masks. Business Traveller (3 June 2020).
https://www.businesstraveller.com/features/which-airlines-are-requiring-face-masks-
onboard/.
6. Wilson N, Telfar Barnard L, Kvalsig A, Verrall A, Baker M, Schwehm M. Modelling the
potential health impact of the COVID-19 pandemic on a hypothetical European country.
medRxiv 2020;(23 March). https://medrxiv.org/cgi/content/short/2020.03.20.20039776v1.
7. Wilson N, Telfar Barnard L, Kvalsvig A, Baker M. Potential health impacts from the
COVID-19 pandemic for New Zealand if eradication fails: Report to the NZ Ministry of
Health. Wellington: University of Otago Wellington.
2020;https://www.health.govt.nz/system/files/documents/publications/report_for_moh_-
_covid-19_pandemic_nz_final.pdf.
8. Wilson N, Parry M, Verrall A, Baker M, Schwehm M, Eichner M. When can elimination of
SARS-CoV-2 infection be assumed? Simulation modelling in a case study island nation.
medRxiv 2020;(20 May). https://medrxiv.org/cgi/content/short/2020.05.16.20104240v1.
9. Wilson N, Schwehm M, Verrall A, Parry M, Baker M, Eichner M. Detecting the emergent or
re-emergent COVID-19 pandemic in a country: Modelling study of combined primary care
and hospital surveillance. medRxiv 2020;(19 May).
https://medrxiv.org/cgi/content/short/2020.05.13.20100743v1.
10. Ritchie H, Roser M, Ortiz-Ospina E, Hasel J. Australia: Coronavirus Pandemic (updated 27
May). 2020;https://ourworldindata.org/coronavirus/country/australia?country=AUS~.
11. IATA. Restarting aviation following COVID-19: Medical evidence for various strategies
being discussed as at 25 May 2020 IATA Medical Advisory Group.
https://www.iata.org/contentassets/f1163430bba94512a583eb6d6b24aa56/covid-medical-
evidence-for-strategies-200525.pdf.
12. Statistics New Zealand. International travel: January 2020 (16 March 2020).
https://www.stats.govt.nz/information-releases/international-travel-january-2020.
13. Qian GQ, Yang NB, Ding F, Ma AHY, Wang ZY, Shen YF, et al. Epidemiologic and
Clinical Characteristics of 91 Hospitalized Patients with COVID-19 in Zhejiang, China: A
retrospective, multi-centre case series. QJM. 2020 Mar 17;(E-publication 18 March).
14. Eldin C, Lagier JC, Mailhe M, Gautret P. Probable aircraft transmission of Covid-19 in-flight
from the Central African Republic to France. Travel Med Infect Dis. 2020 Apr 1;(E-
publication 5 April):101643.
15. Schwartz KL, Murti M, Finkelstein M, Leis JA, Fitzgerald-Husek A, Bourns L, et al. Lack of
COVID-19 transmission on an international flight. CMAJ. 2020 Apr 14;192(15):E410.
16. Shen Y, Li C, Dong H, Wang Z, et al. Airborne transmission of COVID-19: epidemiologic
evidence from two outbreak investigations. Pre-Print 2020;(April)
https://www.researchgate.net/publication/340418430_Airborne_transmission_of_COVID-
19_epidemiologic_evidence_from_two_outbreak_investigations.
17. Olsen SJ, Chang HL, Cheung TY, Tang AF, Fisk TL, Ooi SP, et al. Transmission of the
severe acute respiratory syndrome on aircraft. N Engl J Med. 2003 Dec 18;349(25):2416-22.
. CC-BY-NC-ND 4.0 International licenseIt is made available under a is the author/funder, who has granted medRxiv a license to display the preprint in perpetuity. (which was not certified by peer review)
The copyright holder for this preprintthis version posted June 14, 2020. ; https://doi.org/10.1101/2020.06.10.20127977doi: medRxiv preprint
16
18. Ministry of Health. Advice to Airline Crew on Precautions to Reduce Risk of COVID-19
Infection (Revised 8 May 2020).
https://www.health.govt.nz/system/files/documents/pages/covid-19-advice-to-airline-crew-
on-precautions-to-reduce-risk-of-covid-19-infection8-may2020.pdf.
19. Centers for Disease Control and Prevention. COVID-19 pandemic planning scenarios.
2020;(20 May). https://www.cdc.gov/coronavirus/2019-ncov/hcp/planning-scenarios.html.
20. WHO-China Joint Mission. Report of the WHO-China Joint Mission on Coronavirus Disease
2019 (COVID-19). 2020;(16-24 February). https://www.who.int/docs/default-
source/coronaviruse/who-china-joint-mission-on-covid-19-final-report.pdf.
21. Bi Q, Wu Y, Mei S, Ye C, Zou X, Zhang Z, et al. Epidemiology and transmission of COVID-
19 in 391 cases and 1286 of their close contacts in Shenzhen, China: a retrospective cohort
study. Lancet Infect Dis. 2020 Apr 27;(E-publication 1 May).
22. Lokuge K, Banks E, Davies S, Roberts L, Street T, O’Donovan D, et al. Exit strategies:
optimising feasible surveillance for detection, elimination and ongoing prevention of
COVID-19 community transmission. medRxiv 2020;(23 April). doi:
https://doi.org/10.1101/2020.04.19.20071217.
23. Gudbjartsson DF, Helgason A, Jonsson H, Magnusson OT, Melsted P, Norddahl GL, et al.
Spread of SARS-CoV-2 in the Icelandic Population. N Engl J Med. 2020 Apr 14;(E-
publication 15 April).
24. Luo L, Dan L, Xin-long L, Xian-bo W, Qin-long J, Jia-zhen Z, et al. Modes of contact and
risk of transmission in COVID-19 among close contacts. medRxiv 2020;(24 March).
https://www.medrxiv.org/content/10.1101/2020.03.24.20042606v1.
25. Treibel T, Manisty C, Burton M, McKnight A, Lambourne J, Augusto J, et al. COVID-19:
PCR screening of asymptomatic healthcare workers at London hospital. Lancet.
2020;395:1608-10.
26. Woelfel R, Corman V, Guggemos W, Seilmaier M, Zange S, Mueller M, et al. Clinical
presentation and virological assessment of hospitalized cases of coronavirus disease 2019 in a
travel-associated transmission cluster. medRxiv. 2020;(8 March).
https://www.medrxiv.org/content/10.1101/2020.03.05.20030502v1.
27. Quilty BJ, Clifford S, Flasche S, Eggo RM, Cmmid nCoV working group. Effectiveness of
airport screening at detecting travellers infected with novel coronavirus (2019-nCoV). Euro
Surveill. 2020 Feb;25(5).
28. Priest PC, Duncan AR, Jennings LC, Baker MG. Thermal image scanning for influenza
border screening: results of an airport screening study. PLoS One. 2011;6(1):e14490.
29. Chu D, Akl E, Duda S, Solo K, Yaacoub S, Schünemann H, et al. Physical distancing, face
masks, and eye protection to prevent person-to-person transmission of SARS-CoV-2 and
COVID-19: a systematic review and meta-analysis. Lancet. 2020;(E-publication 1 June).
30. World Health Organization. Advice on the use of masks in the context of COVID-19 (Interim
guiance, 5 June 2020). Geneva: World Health Organization.
31. Ma QX, Shan H, Zhang HL, Li GM, Yang RM, Chen JM. Potential utilities of mask-wearing
and instant hand hygiene for fighting SARS-CoV-2. J Med Virol. 2020 Mar 31;(E-
publication 2 April).
32. Anfinrud P, Stadnytskyi V, Bax CE, Bax A. Visualizing Speech-Generated Oral Fluid
Droplets with Laser Light Scattering. N Engl J Med. 2020 Apr 15;(E-publication 16 April).
33. Leung NHL, Chu DKW, Shiu EYC, Chan KH, McDevitt JJ, Hau BJP, et al. Respiratory virus
shedding in exhaled breath and efficacy of face masks. Nat Med. 2020 Apr 3;(E-publication 7
May).
34. Lauer SA, Grantz KH, Bi Q, Jones FK, Zheng Q, Meredith HR, et al. The incubation period
of coronavirus disease 2019 (COVID-19) from publicly reported confirmed cases: Estimation
and application. Ann Intern Med. 2020 Mar 10;(E-publication 10 March).
. CC-BY-NC-ND 4.0 International licenseIt is made available under a is the author/funder, who has granted medRxiv a license to display the preprint in perpetuity. (which was not certified by peer review)
The copyright holder for this preprintthis version posted June 14, 2020. ; https://doi.org/10.1101/2020.06.10.20127977doi: medRxiv preprint

17
35. Kucirka LM, Lauer SA, Laeyendecker O, Boon D, Lessler J. Variation in false-negative rate
of reverse transcriptase polymerase chain reaction-based SARS-CoV-2 tests by time since
exposure. Ann Intern Med. 2020 May 13;(E-publication 19 April).
36. New Zealand Ministry of Health. COVID-19 - Significant clusters (updated 30 May 2020).
Ministry of Health. https://www.health.govt.nz/our-work/diseases-and-conditions/covid-19-
novel-coronavirus/covid-19-current-situation/covid-19-current-cases/covid-19-significant-
clusters.
37. Flutracking. NZ participant annual report 2018. https://info.flutracking.net/wp-
content/uploads/2020/02/NZ-participant-annual-report-2018.pdf
38. Haushofer J, Metcalf CJE. Which interventions work best in a pandemic? Science. 2020 Jun
5;368(6495):1063-5.
39. Endo A, Centre for the Mathematical Modelling of Infectious Diseases COVID-19 Working
Group, Abbott S, Et al. Estimating the overdispersion in COVID-19 transmission using
outbreak sizes outside China. Wellcome Open Res 2020, 5:67
(https://doi.org/10.12688/wellcomeopenres.15842.1).
40. Leitmeyer K, Adlhoch C. Review Article: Influenza Transmission on Aircraft: A Systematic
Literature Review. Epidemiology. 2016 Sep;27(5):743-51.
. CC-BY-NC-ND 4.0 International licenseIt is made available under a is the author/funder, who has granted medRxiv a license to display the preprint in perpetuity. (which was not certified by peer review)
The copyright holder for this preprintthis version posted June 14, 2020. ; https://doi.org/10.1101/2020.06.10.20127977doi: medRxiv preprint