Embed Size (px)
Citation preview
IUGJEBS Vol 24, No1, 2016, pp 142-156
ISSN 2410-5198
1*2
02220202
0222020220610
0616
Estimating the Hidden Economy Using Currency Demand Approach
A Case Study of Palestine
Abstract The study aims to estimate the Hidden Economy (HE) by using the currency demand approach in Palestine (2000-2010), through
studying the relationship between a group of variables that affect the percentage of cash money held by the public (CC) to the broad
money supply (M2). The model used Fully Modified Ordinary Least Squares (FMOLS). Results showed that the hidden economy in
Palestine is varying over time, the annual average during 2000-2010 reached about 816.2 Million dollar, which is about 16.6% from
the GDP, this ratio reflects a positive reality, especially when compared with the ratio of the H.E in neighboring and regional
countries.
Keywords: Hidden Economy, Financial System, Money Demand, Money Supply, Palestine.
341
0790
0200
0792
07070799
0799
Schneider & Enste,
2000
0910
Schneider &
Buehn, 2011
0222
00412
02220202
2222
2121
0202
344
0222
0229
.
0200
07920227
Tanzi
0609
0229
07660222
MIMIC
0766
00199412
0222
0202
0222
Schneider & Buehn, 2011)
MIMIC060
07770229
0910
0777022902192417
0012041007100714
02100212
94120222
02292417Schneider &
Buehn, 2011
341
(Gulzar et al, 2010)
07200202Tanzi
2022
Schneider, 2008
00
02200224
(Tanzi
4010
Anno, 2006
07990224
MIMIC
0716
079209160224
07220722
419610
Tanzi,
1980
Informal
SectorIrregular Economy
Black Economy
Marginal EconomyShadow
EconomyUnderground Economy
Subterranean Parallel
EconomySecond Economy
Unofficial Economy
Secret EconomyIllegal
EconomyUnregistered
Economy020097
Gutmann,1977, p:9
Tanzi, 1980, p:441
341
Mirus, Roger, & Smith, 1994
0220
".0200
:0.
mimic
GDP
Filipec, 2011, p20
Filipec,
2011, p21
341
MIMIC
Structural
Equation Model SEM
Multiple Indicators and Multiple Causes
Model (MIMIC)
MIMIC
Latent Variable
MIMIC
020024
ζγnXn….γ4X4 γ3X3 γ2X2γ1X1αη
η
x
γ
ζ
Yiη
Yi = δi + λiη + εi
η
Yi
δiλi
εi
Cagan0792
07070799Gutmann
0799
07290796
Schneider & Enste, 2000
Tanzi, 1980
GutmannCagan
Tanzi
07070722
(Tanzi,
1999:339
341
0
0
2
4 M2
M1
Tanzi
M2
Tanzi
Tanzi
0
Tanzi, 1980, p435
ln(C/M2)t = β0 + β1 ln(TW)t + β2 ln(Ws/Y)t + β3 lnRt
+ β4 ln(Y/N)t + εt (1)
ln
0
(C/M2)t
0
(TW)t
(Ws/Y)t
Rt
(Y/N)t
0222
0792022404
0200
091020770
0222Gulzar, 2010
07200202
2022
Kanao & Hamori, 2010
0790022909
0
0
2
341
0
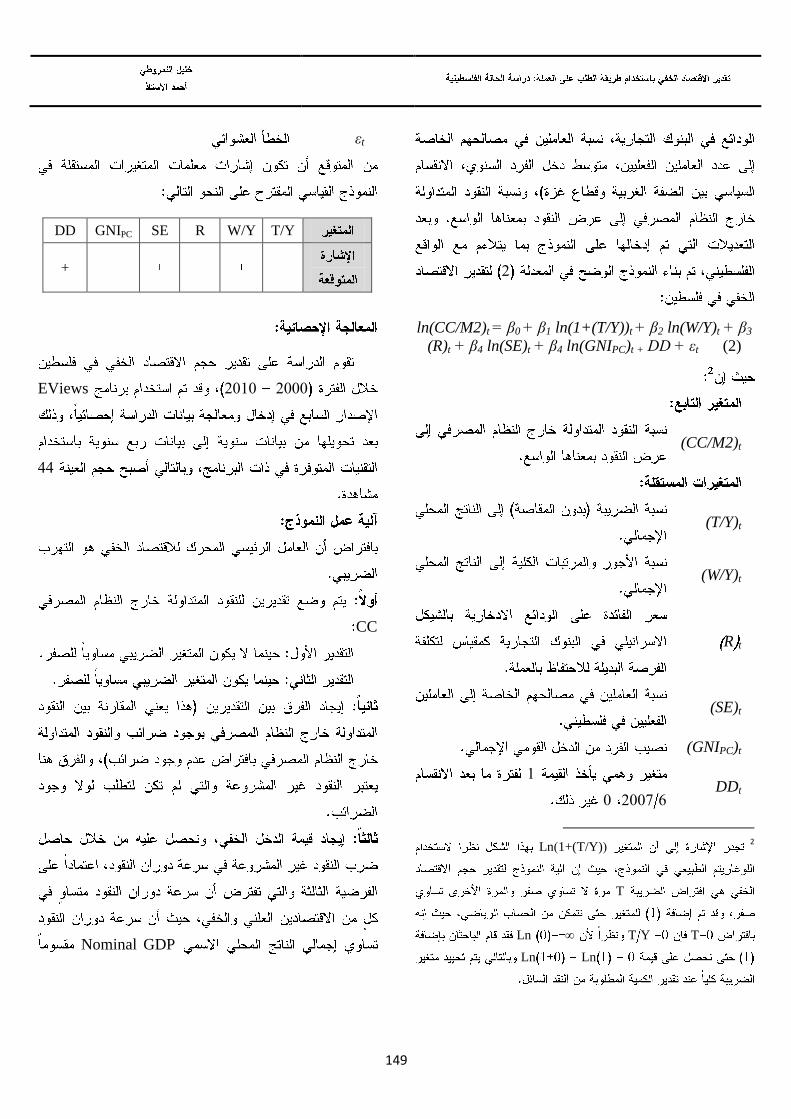
ln(CC/M2)t = β0 + β1 ln(1+(T/Y))t + β2 ln(W/Y)t + β3
(R)t + β4 ln(SE)t + β4 ln(GNIPC)t + DD + εt (2)
(CC/M2)t
(T/Y)t
(W/Y)t
tR
(SE)t
(GNIPC)t
DDt 0
602292
2
(1+(T/Y))Ln
T
TT YLn ∞
Ln Ln
εt
T/Y W/Y R SE GNIPC DD
+
02220202EViews
44
CC
Nominal GDP
311
M2
020218
GDP
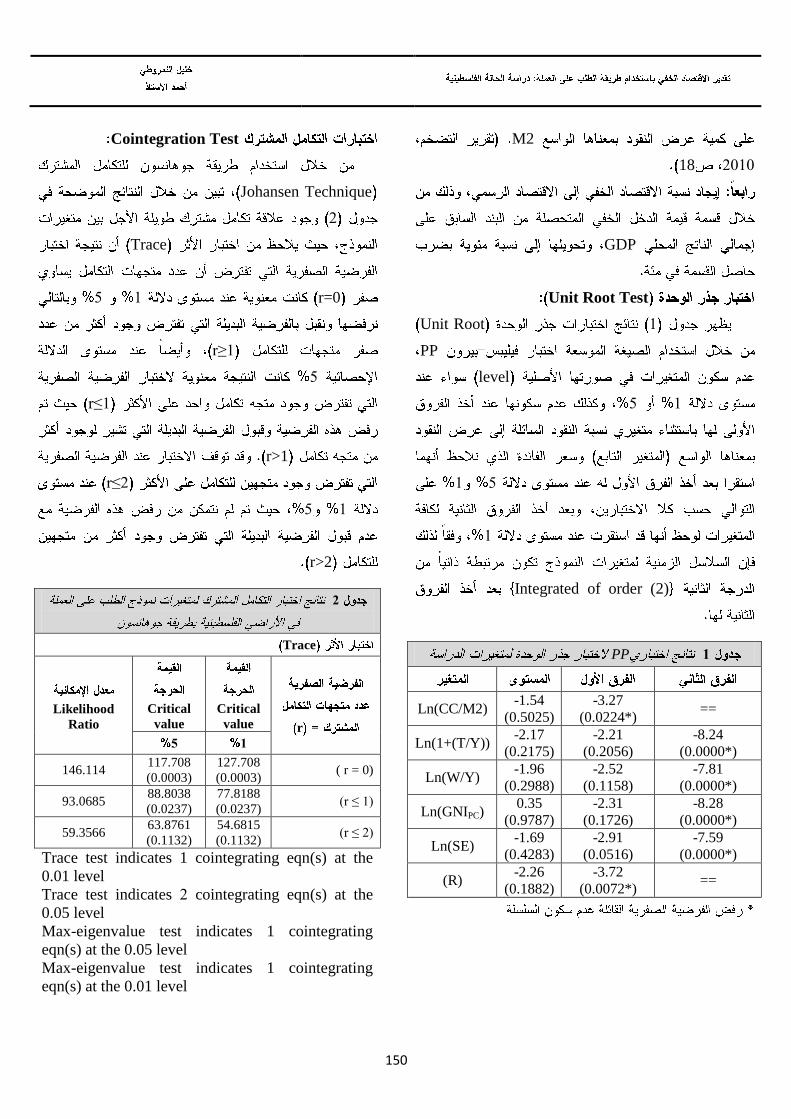
Unit Root Test
0Unit Root
PP
level
09
90
0
Integrated of order (2)
1PP
== -3.27
(0.0224*)
-1.54
(0.5025) Ln(CC/M2)
-8.24
(0.0000*)
-2.21
(0.2056)
-2.17
(0.2175) Ln(1+(T/Y))
-7.81
(0.0000*)
-2.52
(0.1158)
-1.96
(0.2988) Ln(W/Y)
-8.28
(0.0000*)
-2.31
(0.1726)
0.35
(0.9787) Ln(GNIPC)
-7.59
(0.0000*)
-2.91
(0.0516)
-1.69
(0.4283) Ln(SE)
== -3.72
(0.0072*)
-2.26
(0.1882) (R)
Cointegration Test
Johansen Technique
0
Trace
r=009
r≥1
9
r≤1
r>1
r≤2
09
r>2
2
Trace
r
Critical
value
Critical
value
Likelihood
Ratio
1 5
( r = 0) 127.708
(0.0003)
117.708
(0.0003) 146.114
(r ≤ 1) 77.8188
(0.0237)
88.8038
(0.0237) 93.0685
(r ≤ 2) 54.6815
(0.1132)
63.8761
(0.1132) 59.3566
Trace test indicates 1 cointegrating eqn(s) at the
0.01 level
Trace test indicates 0 cointegrating eqn(s) at the
0.05 level
Max-eigenvalue test indicates 1 cointegrating
eqn(s) at the 0.05 level
Max-eigenvalue test indicates 1 cointegrating
eqn(s) at the 0.01 level
313
p-valuesMacKinnon-
Haug-Michelis (1999)
:
Modified Ordinary Least Squares FullyFMOLS
OLS
FMOLS
FMOLS
09
(3)EViews0
3
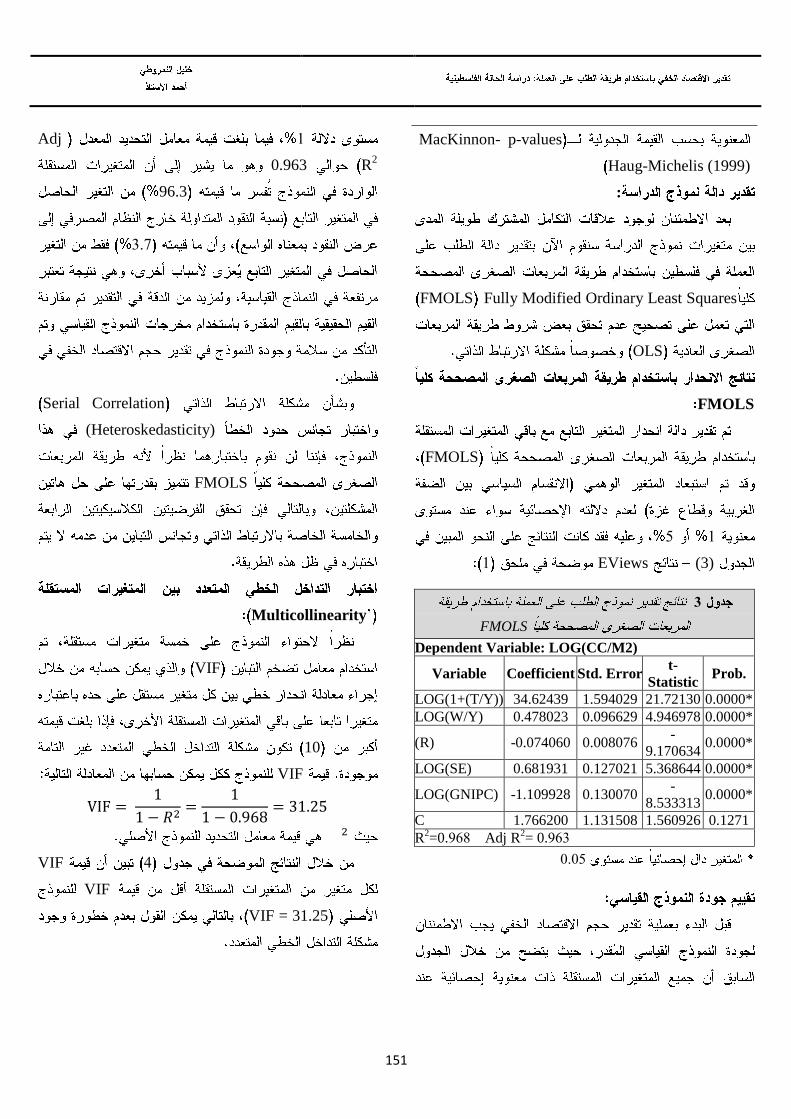
FMOLS
Dependent Variable: LOG(CC/M2)
Variable Coefficient Std. Error t-
Statistic Prob.
LOG(1+(T/Y)) 34.62439 1.594029 21.72130 0.0000*
LOG(W/Y) 0.478023 0.096629 4.946978 0.0000*
(R) -0.074060 0.008076 -
9.170634 0.0000*
LOG(SE) 0.681931 0.127021 5.368644 0.0000*
LOG(GNIPC) -1.109928 0.130070 -
8.533313 0.0000*
C 1.766200 1.131508 1.560926 0.1271
R2=0.762 Adj R
2= 0.762
2129
0Adj
R2
0.963
96.3
219
Serial Correlation
(Heteroskedasticity)
FMOLS
Multicollinearity
VIF
10
VIF
4VIF
VIF
VIF = 31.25
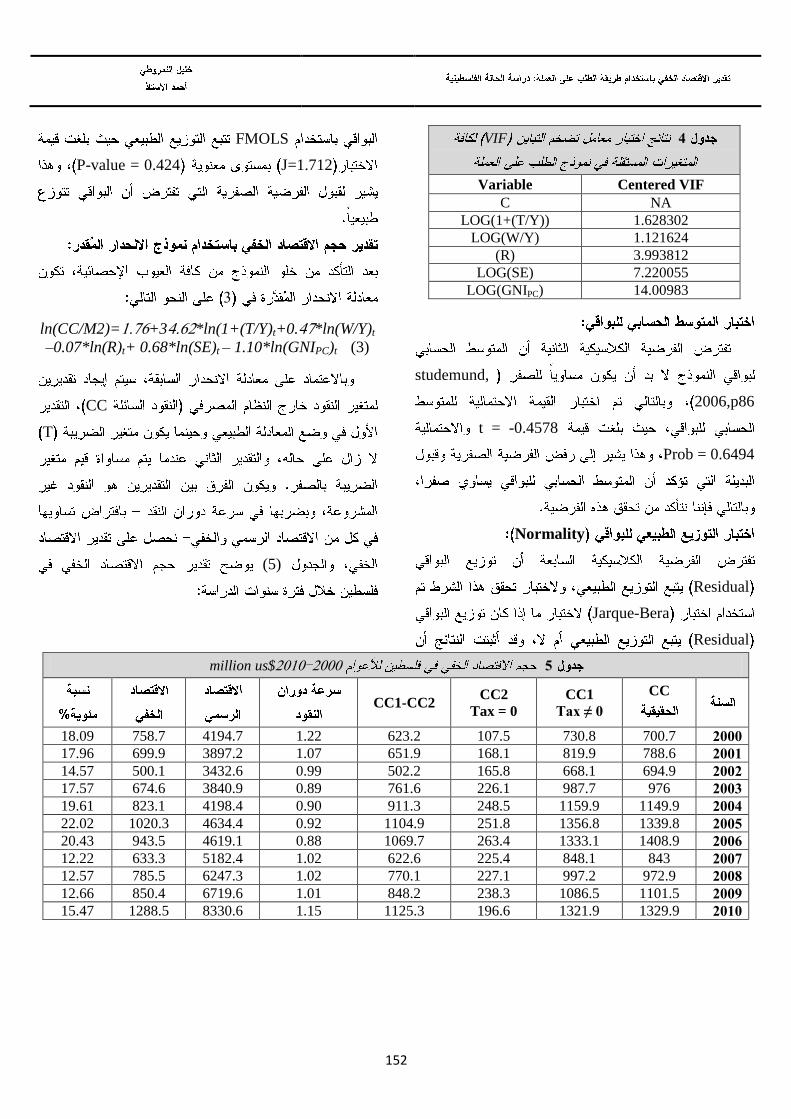
311
4VIF
Variable Centered VIF
C NA
LOG(1+(T/Y)) 1.628302
LOG(W/Y) 1.121624
(R) 3.993812
LOG(SE) 7.220055
LOG(GNIPC) 14.00983
studemund,
2006,p86
t = -0.4578
Prob = 0.6494
Normality
Residual
Jarque-Bera
Residual
FMOLS
J=1.712P-value = 0.424
2
ln(CC/M2)=0196+34160*ln(1+(T/Y)t+0.49*ln(W/Y)t
–0.07*ln(R)t+ 0.68*ln(SE)t – 1.10*ln(GNIPC)t (3)
CC
T
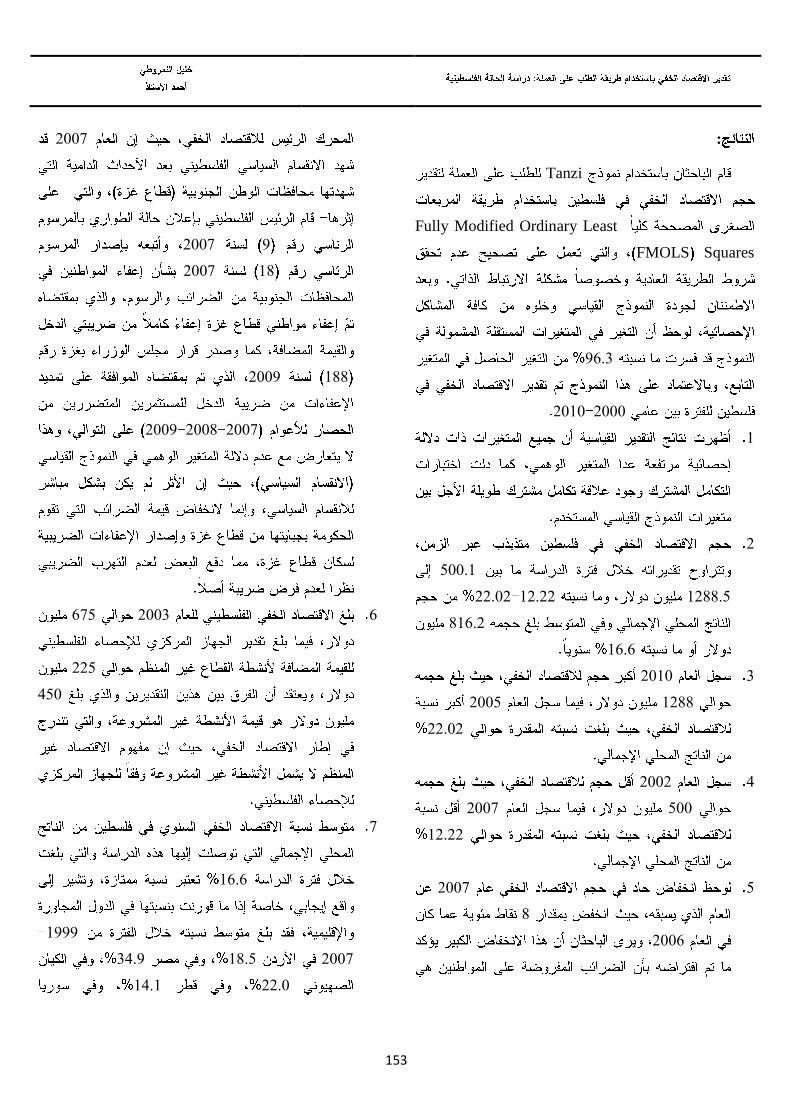
(5)
502220202million us$
CC
CC1
Tax ≠ 0
CC2
Tax = 0 CC1-CC2
2222 700.7 730.8 107.5 623.2 1.22 4194.7 758.7 18.09
2221 788.6 819.9 168.1 651.9 1.07 3897.2 699.9 17.96
2222 694.9 668.1 165.8 502.2 0.99 3432.6 500.1 14.57
2223 976 987.7 226.1 761.6 0.89 3840.9 674.6 17.57
2224 1149.9 1159.9 248.5 911.3 0.90 4198.4 823.1 19.61
2225 1339.8 1356.8 251.8 1104.9 0.92 4634.4 1020.3 22.02
2226 1408.9 1333.1 263.4 1069.7 0.88 4619.1 943.5 20.43
2227 843 848.1 225.4 622.6 1.02 5182.4 633.3 12.22
2228 972.9 997.2 227.1 770.1 1.02 6247.3 785.5 12.57
2229 1101.5 1086.5 238.3 848.2 1.01 6719.6 850.4 12.66
2212 1329.9 1321.9 196.6 1125.3 1.15 8330.6 1288.5 15.47
311
:
Tanzi
Modified Ordinary Least Fully
SquaresFMOLS
7612
02220202
0
0
92210
0022190010000120
20610
0616
2 0202
00220229
00120
4 0220
9220229
00100
9 0229
2
0226
0229
70229
020229
0220227
022902220227
6 0222699
009
492
9
0616
0777
022902192417
00120410
314
07100714
02100212(Schneider &
Buehn,2011, p30
2
:
0
0
2
4
9
6
9
2
7
0202
22222211
0200
222222120200
22120200
0772
311
19662222
09000229
0229
19922228
0200
0222
002002299
202279
06
420220
0222
19722229
0200
Anno, R. The Shadow Economy in Portugal: an
Analysis with the MIMIC Approach. Journal of
Applied Economics, X(2), (2006) 253-277.
Engel, R., and Granger C.W.J. Co-Integration and
Error Correction: Representation, Estimation,
and Testing. Econometrica, 55(2), (1987) 251-
276.
Gutman, P. The Subterranean Economy. Fin
Analysts Journal, 34(1), (1977) 26-27
Gulzar, A., and Junaid, N., and Haider, A. What is
Hidden, in the Hidden Economy of Pakistan?
Size, Causes, Issues and Implications. MPRA,
(2010), Paper No. 28571, Posted 03. Feb 2011,
Online at: http://mpra.ub.uni-
muenchen.de/28571/
Kanao, K., and Hamori, Sh. The Size of the
Underground Economy in Japan. MPRA
(2010), Paper No. 21562, Posted 23. March
2010, Online at: http://mpra.ub.uni-
muenchen.de/21562/
Mirus, R., and Smith, R. Underground Economy.
Journal of Canadian business review, 21(2),
(1994) 26.
Schneider, F., and Buehn, A. Shadow economies
around the world: novel insights, accepted
knowledge, and new estimates. Journal of
International Tax and Public Finance, 19(1),
(2011) 139-171.
Schneider, F. The Shadow Economies in Central and
South America with a Specific Focus on Brazil
and Columbia: What do we knew?. Invited Paper
for the workshop “Shadow Economy”, organized
by Instituto Brasileiro de Etica Concorrencial
(ETCO), Rio de Janeiro, Brazil (2008).
Schneider, F., and Enste, D. H. Shadow Economies:
Size, Causes, and Consequences. Journal of
Economic Literature, Vol. XXXVIII, (2000) 77-
114.
311
Sjo, B. Testing for Unit Roots and Cointegration,
(2008). Online at:
http://www.iei.liu.se/nek/ekonometrisk-teori-7-
5-hp-730a07/labbar/1.233753/dfdistab7b.pdf
Studenmund, A. H. Using Econometrics: A
Practical Guide. Ed: 5th
, Addison Wesley
Longman (2006).
Tanzi, V. Uses and Abuses of Estimates of the
Underground Economy. The Economic Journal,
109(456), (1999) F338-47.
Tanzi, V. The Underground Economy in the United
States: Estimates and Implications. Banca
Nazionale del Lavoro, 135(4), (1980) 427-453.
Webster, L., and Fidler, P. The Informal Sector and
Microfinance Institutions in West Africa,
Regional and Sectoral Studies. World Bank
(1996), ISBN Number: 0-8213-3597-9.
http://www.pcbs.gov.ps
http://muqtafi.birzeit.edu
http://www.pma.ps
http://www.pmof.ps
http://www.mof.gov.ps


![Currency Portfolio Risk Measurement with Generalized ... · Ahmed Ghorbel and Trabelsi (2014) [14] proposed a method for estimating the energy portfolio VaR based on the combinations](https://img.pdfslide.us/doc/110x75/5f67862c9db39139316ca3b0/currency-portfolio-risk-measurement-with-generalized-ahmed-ghorbel-and-trabelsi.jpg)