Embed Size (px)
Citation preview
Estimating the Cost of Overweight Vehicle Travel on Arizona Highways Final Report 528 Prepared by: Sandy H. Straus ESRA Consulting Corporation™ 1650 South Dixie Highway, 3rd Floor Boca Raton, Florida 33432 [email protected]
John Semmens Arizona Department of Transportation 206 S. 17th Avenue Phoenix, Arizona 85007
JANUARY 2006 Prepared for: Arizona Department of Transportation 206 South 17th Avenue Phoenix, Arizona 85007 in cooperation with U.S. Department of Transportation Federal Highway Administration
The contents of the report reflect the views of the authors who are responsible for the facts and the accuracy of the data presented herein. The authors assume no liability for the use or misuse of any information, opinions, or conclusions contained in this report. The contents do not necessarily reflect the official views or policies of the Arizona Department of Transportation or the Federal Highway Administration. This report does not constitute a standard, specification, or regulation. Trade or manufacturers’ names which may appear herein are cited only because they are considered essential to the objectives of the report. The U.S. Government and The State of Arizona do not endorse products or manufacturers.
Technical Report Documentation Page 1. Report No. FHWA-AZ-06-528
2. Government Accession No.
3. Recipient's Catalog No.
4. Title and Subtitle
5. Report Date January 2006
Estimating the Cost of Overweight Vehicle Travel on Arizona Highways
6. Performing Organization Code
7. Authors Sandy H. Straus and John Semmens
8. Performing Organization Report No.
9. Performing Organization Name and Address Sandy H. Straus ESRA Consulting Corporation 1650 South Dixie Highway, Third Floor Boca Raton, Florida 33432 (561) 361-0004 http://www.esracorp.com
10. Work Unit No.
11. Contract or Grant No. SPR-PL-1-(59) 528
12. Sponsoring Agency Name and Address ARIZONA DEPARTMENT OF TRANSPORTATION 206 S. 17TH AVENUE
13.Type of Report & Period Covered
PHOENIX, ARIZONA 85007 Project Manager: John Semmens
14. Sponsoring Agency Code
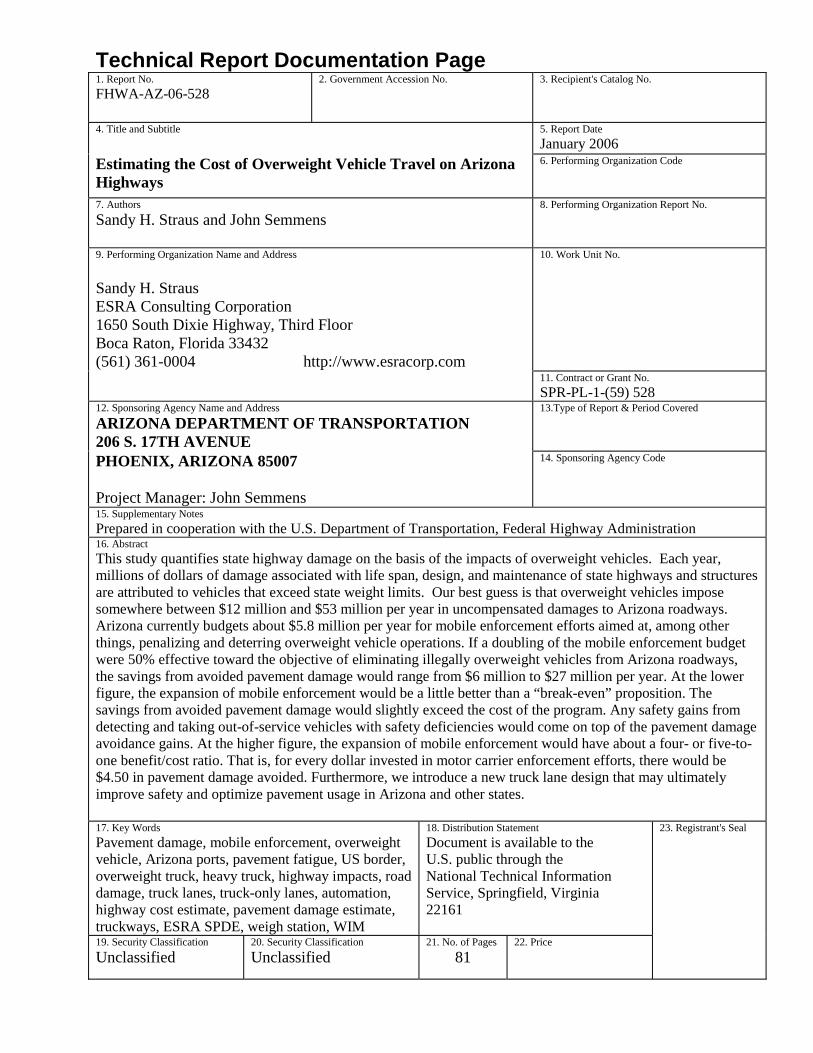
15. Supplementary Notes Prepared in cooperation with the U.S. Department of Transportation, Federal Highway Administration 16. Abstract This study quantifies state highway damage on the basis of the impacts of overweight vehicles. Each year, millions of dollars of damage associated with life span, design, and maintenance of state highways and structures are attributed to vehicles that exceed state weight limits. Our best guess is that overweight vehicles impose somewhere between $12 million and $53 million per year in uncompensated damages to Arizona roadways. Arizona currently budgets about $5.8 million per year for mobile enforcement efforts aimed at, among other things, penalizing and deterring overweight vehicle operations. If a doubling of the mobile enforcement budget were 50% effective toward the objective of eliminating illegally overweight vehicles from Arizona roadways, the savings from avoided pavement damage would range from $6 million to $27 million per year. At the lower figure, the expansion of mobile enforcement would be a little better than a “break-even” proposition. The savings from avoided pavement damage would slightly exceed the cost of the program. Any safety gains from detecting and taking out-of-service vehicles with safety deficiencies would come on top of the pavement damage avoidance gains. At the higher figure, the expansion of mobile enforcement would have about a four- or five-to-one benefit/cost ratio. That is, for every dollar invested in motor carrier enforcement efforts, there would be $4.50 in pavement damage avoided. Furthermore, we introduce a new truck lane design that may ultimately improve safety and optimize pavement usage in Arizona and other states. 17. Key Words Pavement damage, mobile enforcement, overweight vehicle, Arizona ports, pavement fatigue, US border, overweight truck, heavy truck, highway impacts, road damage, truck lanes, truck-only lanes, automation, highway cost estimate, pavement damage estimate, truckways, ESRA SPDE, weigh station, WIM
18. Distribution Statement Document is available to the U.S. public through the National Technical Information Service, Springfield, Virginia 22161
23. Registrant's Seal
19. Security Classification Unclassified
20. Security Classification Unclassified
21. No. of Pages 81
22. Price
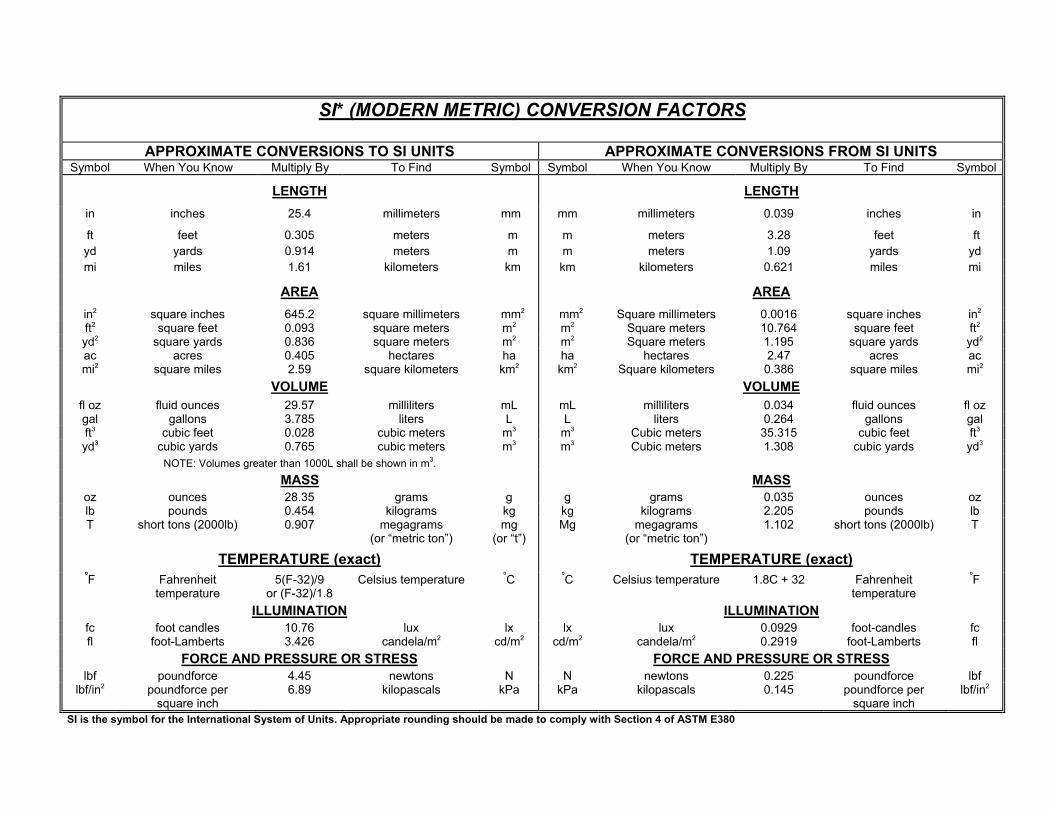
SI* (MODERN METRIC) CONVERSION FACTORS
APPROXIMATE CONVERSIONS TO SI UNITS APPROXIMATE CONVERSIONS FROM SI UNITS Symbol When You Know Multiply By To Find Symbol Symbol When You Know Multiply By To Find Symbol
LENGTH LENGTH
in inches 25.4 millimeters mm mm millimeters 0.039 inches in
ft feet 0.305 meters m m meters 3.28 feet ft yd yards 0.914 meters m m meters 1.09 yards yd mi miles 1.61 kilometers km km kilometers 0.621 miles mi AREA AREA
in2 square inches 645.2 square millimeters mm2 mm2 Square millimeters 0.0016 square inches in2
ft2 square feet 0.093 square meters m2 m2 Square meters 10.764 square feet ft2
yd2 square yards 0.836 square meters m2 m2 Square meters 1.195 square yards yd2 ac acres 0.405 hectares ha ha hectares 2.47 acres ac mi2 square miles 2.59 square kilometers km2 km2 Square kilometers 0.386 square miles mi2
VOLUME VOLUME fl oz fluid ounces 29.57 milliliters mL mL milliliters 0.034 fluid ounces fl oz gal gallons 3.785 liters L L liters 0.264 gallons gal ft3 cubic feet 0.028 cubic meters m3 m3 Cubic meters 35.315 cubic feet ft3
yd3 cubic yards 0.765 cubic meters m3 m3 Cubic meters 1.308 cubic yards yd3
NOTE: Volumes greater than 1000L shall be shown in m3. MASS MASS
oz ounces 28.35 grams g g grams 0.035 ounces oz lb pounds 0.454 kilograms kg kg kilograms 2.205 pounds lb T short tons (2000lb) 0.907 megagrams
(or “metric ton”) mg
(or “t”) Mg megagrams
(or “metric ton”) 1.102 short tons (2000lb) T
TEMPERATURE (exact) TEMPERATURE (exact) ºF Fahrenheit
temperature 5(F-32)/9
or (F-32)/1.8 Celsius temperature ºC ºC Celsius temperature 1.8C + 32 Fahrenheit
temperature ºF
ILLUMINATION ILLUMINATION fc foot candles 10.76 lux lx lx lux 0.0929 foot-candles fc fl foot-Lamberts 3.426 candela/m2 cd/m2 cd/m2 candela/m2 0.2919 foot-Lamberts fl FORCE AND PRESSURE OR STRESS FORCE AND PRESSURE OR STRESS
lbf poundforce 4.45 newtons N N newtons 0.225 poundforce lbf lbf/in2 poundforce per
square inch 6.89 kilopascals kPa kPa kilopascals 0.145 poundforce per
square inch lbf/in2
SI is the symbol for the International System of Units. Appropriate rounding should be made to comply with Section 4 of ASTM E380

ESRA CONSULTING CORPORATION DISCLAIMER Neither ESRA Consulting Corporation (ESRA), its affiliates, its associates, nor any agency thereof, nor any of their employees, makes any warranty, express or implied, or assumes any legal liability or responsibility for the accuracy, completeness, or usefulness of any information, apparatus, product or process disclosed, or represents that its use would not infringe privately owned rights. References herein to any specific commercial product, process, or service by trade name, trademark, manufacturer, or otherwise, does not necessarily constitute or imply its endorsement, recommendation, or favoring by ESRA or any agency thereof. The views and opinions of authors expressed herein do not necessarily state or reflect those of ESRA or any agency thereof. This report is for informational purposes only. Readers are encouraged to confirm the information contained herein with other sources. Reliance on any information in this report is solely at your own risk. ESRA Consulting Corporation is not responsible or liable for any direct, indirect, consequential, special, exemplary, or other damages arising from any use of any product, information, idea, or instruction contained in this report and all publications and presentations and/ or implementations therefrom. Notice is hereby provided that a patent application has been filed on one or more of the systems and methods described herein. Notice is hereby provided that ESRA may be involved in development and/ or marketing of products in the systems and/ or methods described herein. In the event that consideration is given to any component in the system described herein in which ESRA may have a marketing arrangement or other involvement, at the time of such consideration, full disclosure will be made.
I dedicate this report to the memory of my grandfather, Bernard, whose fascinations with the realms of transportation and automation were an inspiration to me. I always miss him. -SHS
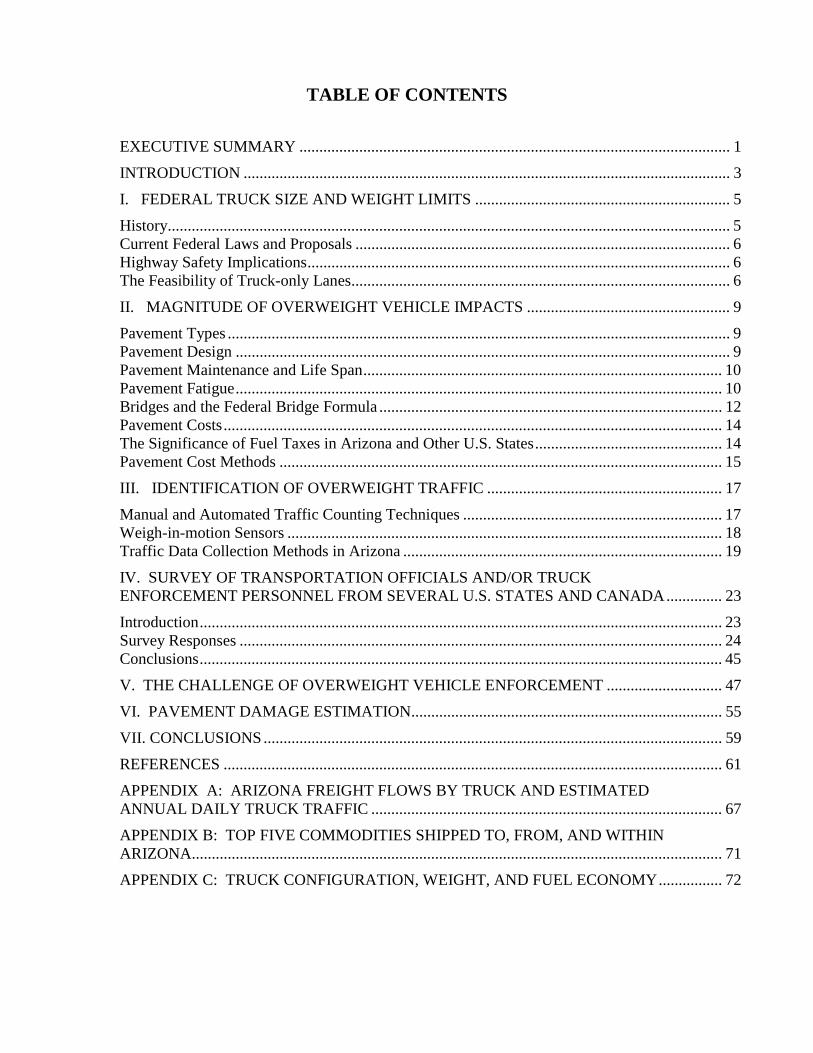
TABLE OF CONTENTS EXECUTIVE SUMMARY ............................................................................................................ 1
INTRODUCTION .......................................................................................................................... 3
I. FEDERAL TRUCK SIZE AND WEIGHT LIMITS ................................................................ 5
History............................................................................................................................................. 5 Current Federal Laws and Proposals .............................................................................................. 6 Highway Safety Implications.......................................................................................................... 6 The Feasibility of Truck-only Lanes............................................................................................... 6
II. MAGNITUDE OF OVERWEIGHT VEHICLE IMPACTS ................................................... 9
Pavement Types .............................................................................................................................. 9 Pavement Design ............................................................................................................................ 9 Pavement Maintenance and Life Span.......................................................................................... 10 Pavement Fatigue.......................................................................................................................... 10 Bridges and the Federal Bridge Formula ...................................................................................... 12 Pavement Costs............................................................................................................................. 14 The Significance of Fuel Taxes in Arizona and Other U.S. States............................................... 14 Pavement Cost Methods ............................................................................................................... 15
III. IDENTIFICATION OF OVERWEIGHT TRAFFIC ........................................................... 17
Manual and Automated Traffic Counting Techniques ................................................................. 17 Weigh-in-motion Sensors ............................................................................................................. 18 Traffic Data Collection Methods in Arizona ................................................................................ 19
IV. SURVEY OF TRANSPORTATION OFFICIALS AND/OR TRUCK ENFORCEMENT PERSONNEL FROM SEVERAL U.S. STATES AND CANADA.............. 23
Introduction................................................................................................................................... 23 Survey Responses ......................................................................................................................... 24 Conclusions................................................................................................................................... 45
V. THE CHALLENGE OF OVERWEIGHT VEHICLE ENFORCEMENT ............................. 47
VI. PAVEMENT DAMAGE ESTIMATION.............................................................................. 55
VII. CONCLUSIONS................................................................................................................... 59
REFERENCES ............................................................................................................................. 61
APPENDIX A: ARIZONA FREIGHT FLOWS BY TRUCK AND ESTIMATED ANNUAL DAILY TRUCK TRAFFIC ........................................................................................ 67
APPENDIX B: TOP FIVE COMMODITIES SHIPPED TO, FROM, AND WITHIN ARIZONA..................................................................................................................................... 71
APPENDIX C: TRUCK CONFIGURATION, WEIGHT, AND FUEL ECONOMY................ 72
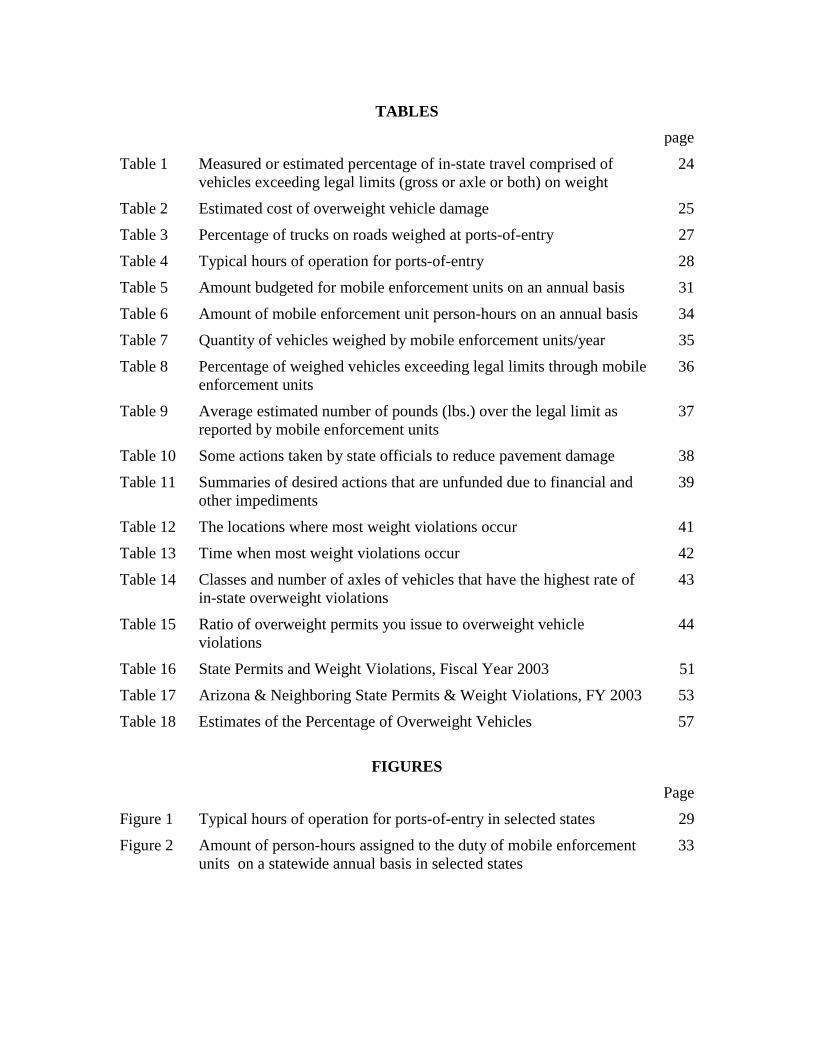
TABLES
page
Table 1 Measured or estimated percentage of in-state travel comprised of vehicles exceeding legal limits (gross or axle or both) on weight
24
Table 2 Estimated cost of overweight vehicle damage 25
Table 3 Percentage of trucks on roads weighed at ports-of-entry 27
Table 4 Typical hours of operation for ports-of-entry 28
Table 5 Amount budgeted for mobile enforcement units on an annual basis 31
Table 6 Amount of mobile enforcement unit person-hours on an annual basis 34
Table 7 Quantity of vehicles weighed by mobile enforcement units/year 35
Table 8 Percentage of weighed vehicles exceeding legal limits through mobile enforcement units
36
Table 9 Average estimated number of pounds (lbs.) over the legal limit as reported by mobile enforcement units
37
Table 10 Some actions taken by state officials to reduce pavement damage 38
Table 11 Summaries of desired actions that are unfunded due to financial and other impediments
39
Table 12 The locations where most weight violations occur 41
Table 13 Time when most weight violations occur 42
Table 14 Classes and number of axles of vehicles that have the highest rate of in-state overweight violations
43
Table 15 Ratio of overweight permits you issue to overweight vehicle violations
44
Table 16 State Permits and Weight Violations, Fiscal Year 2003 51
Table 17 Arizona & Neighboring State Permits & Weight Violations, FY 2003 53
Table 18 Estimates of the Percentage of Overweight Vehicles 57
FIGURES Page
Figure 1 Typical hours of operation for ports-of-entry in selected states 29
Figure 2 Amount of person-hours assigned to the duty of mobile enforcement units on a statewide annual basis in selected states
33
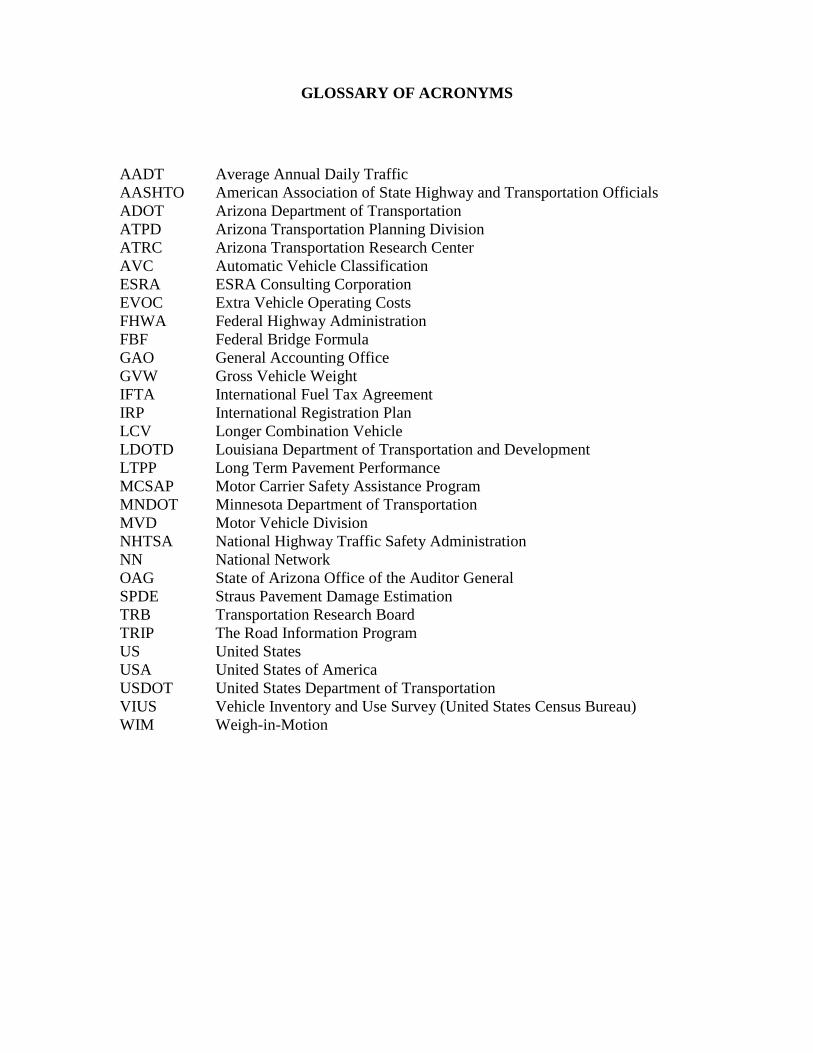
GLOSSARY OF ACRONYMS AADT Average Annual Daily Traffic AASHTO American Association of State Highway and Transportation Officials ADOT Arizona Department of Transportation ATPD Arizona Transportation Planning Division ATRC Arizona Transportation Research Center AVC Automatic Vehicle Classification ESRA ESRA Consulting Corporation EVOC Extra Vehicle Operating Costs FHWA Federal Highway Administration FBF Federal Bridge Formula GAO General Accounting Office GVW Gross Vehicle Weight IFTA International Fuel Tax Agreement IRP International Registration Plan LCV Longer Combination Vehicle LDOTD Louisiana Department of Transportation and Development LTPP Long Term Pavement Performance MCSAP Motor Carrier Safety Assistance Program MNDOT Minnesota Department of Transportation MVD Motor Vehicle Division NHTSA National Highway Traffic Safety Administration NN National Network OAG State of Arizona Office of the Auditor General SPDE Straus Pavement Damage Estimation TRB Transportation Research Board TRIP The Road Information Program US United States USA United States of America USDOT United States Department of Transportation VIUS Vehicle Inventory and Use Survey (United States Census Bureau) WIM Weigh-in-Motion

1
EXECUTIVE SUMMARY In order to quantify state highway damage, we seek to identify and evaluate the impacts of overweight vehicles on pavement. Since ancient times, pavements have played a vital role in trade and transportation throughout the world. Today, in the State of Arizona, the Arizona Department of Transportation (ADOT) and the ADOT Motor Vehicle Division (MVD) undertake the burden of law enforcement policies and activities associated with size and weight of vehicles on Arizona highways. Each year, overweight vehicles account for millions of dollars of damage connected with the life span, design, and maintenance of state highways and structures. Improvements are now needed on the roads and at all of the 22 Arizona ports in order to maintain the state’s role as an economic powerhouse for freight activity in the years to come. Consequently, the results of this study may not only benefit the State of Arizona, but also other states and countries that face escalating costs associated with pavement fatigue and overweight vehicle enforcement challenges. Through survey techniques and a canvass of the literature, we identify the methods and expenditures that other states use for overweight vehicle issues and mobile enforcement units. We also introduce a unique truck lane design to aid mobile enforcement agents and minimize pavement damage. Arizona currently budgets about $5.8 million per year for mobile enforcement efforts aimed at, among other things, penalizing and deterring overweight vehicle operations in nearly 113,642 square miles of Arizona land area. The ADOT Simplified Highway Cost Allocation Model allows us to estimate that illegally overweight vehicles impose somewhere between $12 million and $53 million per year in uncompensated damages to Arizona roadways. The ADOT Simplified Highway Cost Allocation Model estimates that savings from avoided pavement damage would range from $6 million to $27 million per year if a doubling of the mobile enforcement budget were 50% effective toward the objective of eliminating illegally overweight vehicles from Arizona roadways. At the lower figure, the expansion of mobile enforcement would be a small improvement over a “break-even” proposition. The savings from avoided pavement damage would slightly exceed the cost of the program. Any safety gains from detecting and taking out-of-service vehicles with safety deficiencies would come on top of the pavement damage avoidance gains. At the higher figure, the expansion of mobile enforcement would have about a four- or five-to-one benefit/cost ratio. That is, for every dollar invested in motor carrier enforcement efforts, there would be $4.50 in pavement damage avoided.

2
3
INTRODUCTION Pavement fatigue is proportional to repetitive loadings. These loadings, attributed to traffic growth, generate pavement damage at earlier, faster, and costlier rates. The volume of truck traffic increases rapidly as the Interstate Highway System becomes available and popular. The overloaded truck, whether legal or illegal, contributes to premature pavement fatigue. These challenges lead to the need to develop new methods of pavement damage estimation and fatigue reduction techniques. The estimation of damage to state highway systems by overweight vehicles involves several variables. These may include the following, when available:
• Traffic counts for various segments, categorized by vehicle configuration. • Weigh-in-motion (WIM), bridge and static scale measures for vehicles of
various configurations. • Highway spending related to overweight vehicle traffic. • Commercial vehicle permits and/or registrations by weight class and
configuration. • Weight distance tax collections for years prior to the repeal of this tax. • Weight citations recorded by state enforcement personnel. • Diesel fuel consumption data1.
Overweight vehicle enforcement remains a problem in most U.S. states. As our survey demonstrates, the port and mobile enforcement crews are understaffed and/or under funded. Some lack qualifications or skills necessary to adequately detect and monitor overweight trucks. There are few ports equipped with cutting edge technology to adequately identify overweight truck violations. Ernzen reports that some ports are closed more hours than they are open.2 These circumstances lead to an inadequate enforcement of penalties for illegal overloads. Operators of illegally overloaded vehicles may also escape fines due to the failure of the judicial or administrative procedures dealing with detected violators. Billions of dollars are spent each year to replace and repair U.S. highways. Fines for illegal overloading are, therefore, not often correlated with the actual cost of pavement damage. Effectively monitoring and controlling truck weights are paramount to road preservation and minimization of pavement costs. Ultimately, the regulations that U.S. states uphold are intended to balance the economic benefits of commercial vehicle operations, particularly through large trucks. Nearly everything we own, eat, use, grow, or manufacture is carried by truck at least part of its
1 Straus, S. H. 2005. pending publication. 2 Ernzen, J. M. 2005, Port Runners – Impacts and Solutions. FHWA-AZ-05- 563. Phoenix, Arizona: Arizona Department of Transportation.
4
journey. Trucks transport nearly three-fourths of the value and nearly two-thirds of the tonnage of all manufactured goods and raw materials shipped across the USA.3 Trucks are vital to the economy; illegal overweight trucks are not.
3 General Accounting Office . 2005. Large Truck Safety: Federal Enforcement Efforts Have Been Stronger Since 2000, but Oversight of State Grants Needs Improvement. GAO-06-156. Washington, D.C.
5
I. FEDERAL TRUCK SIZE AND WEIGHT LIMITS
History Federal Law regulates truck size and weight limits on interstate highways, national forests, national parks, and other federal lands. Some exceptions include those standards by “grandfather” right and provision for special permits.4 The Surface Transportation Assistance Act (STAA) of 1982 requires U.S. states to allow larger trucks on the National Network, which is comprised of the Interstate system plus the non-Interstate Federal-aid Primary System. All Federal and state laws, directly or indirectly, affect the quality and performance of pavement on our nation’s highways.
In 1941, Congress directed the Interstate Commerce Commission (ICC) to consider federal regulation of the sizes and weights of freight-carrying motor vehicles that were involved in interstate or international commerce. In 1956, the Federal Government initiated a program to regulate truck size and weight limits in order to improve federal investments in the Interstate Highway System. According to the DOT (2000):
“A maximum gross weight limit of 73,280 pounds was established along with maximum weights of 18,000 pounds on single axles and 32,000 pounds on tandem axles. Maximum vehicle width was set at 96 inches…. States having greater weight or width limits… were allowed to retain those limits under a grandfather clause.” 5
In 1975, a spike in fuel costs led the Congress to increase the allowable gross weight and axle weight limits. The U.S., through the STAA of 1982 (P.L. 97-424), adopted federal weight limits on Interstate Highways. Large trucks, such as 48-foot long semi-trailers, among others with prescribed minimum dimensions, were to be allowed on a National Network. A freeze on the expansion of operations on long combination vehicles followed in the Intermodal Surface Transportation Efficiency Act of 1991 (ISTEA) (P.L. 102-240).
The Comprehensive Truck Size and Weight Study6 thoroughly examines issues associated with potential modifications of the current Federal truck size and weight (TS&W) limits. These include a foundation for cost and benefit analyses. In U.S. states, overweight permits are typically issued to routine overweight trucks. Fees are charged for these permits. These are intended to correspond to the additional infrastructure costs associated with the overweight vehicle. Sometimes these fees may cover only administrative costs of permit issuance. When moves often require special equipment and routing, permits may be issued for transports that involve heavier loads.
4 Comprehensive Truck Size and Weight Study, Final Report. Batelle Team, Federal Highway Administration, US Department of Transportation, August 2000. 5 Ibid. 6 Ibid.
6
Current Federal Laws and Proposals Federal law currently includes the following limits:
• 20,000 pounds for single axles on the Interstate System. • 34,000 pounds for tandem axles on the Interstate System. • Application of the Federal Bridge Formula for other axle groups up to the
maximum of 80,000 pounds gross vehicle weight on the Interstate System. Tandem axles are generally defined as two or more consecutive axles that are more than 40 inches but not more than 96 inches apart.7 From time to time, there have been proposals to increase the federal truck size and weight limits. Such proposals are controversial. Additional infrastructure costs, disruption of traffic flow, financial impacts on competing railroads, and potential adverse impacts on safety are all possible byproducts of increasing federal truck size and weight limits. As distance increases, rail appears as the preferred method of transportation. It is impossible to predict the extent to which U.S. states would allow larger and heavier vehicles to operate if no uniform nationwide criteria were in place. Yet, pavement quality and performance characteristics are ultimately shaped by truck size and weight policies. Trucks exert loads and vehicle forces on pavement. Therefore, pavement design must account for load distribution. Traffic volume, tire loads, axle configuration, vehicle speed, tire configuration, and load repetition, among others, all affect pavement.
Highway Safety Implications Truck volume is a function of Federal truck size and weight restrictions. An increase in truck volume, especially among the very large and overweight motor carriers, compromises the safety of other motorists. Trucks contribute to congestion, traffic delays, and pavement fatigue. These increase the likelihood of a collision, injury, or fatality on the nation’s highways. Overweight vehicles not only create infrastructure damage issues, but safety risks as well.8
The Feasibility of Truck-only Lanes Over the last 20 years, the volume of combination vehicles has doubled. By 2020, commercial truck travel may increase significantly and surpass all other vehicle travel in the U.S. Truck-only lanes are being proposed on some U.S. highways to accommodate the demand for large truck and commercial travel. These lanes, typically separate from high-speed traffic and other mixed-flow traffic, are allowed for the exclusive use of trucks. Few truck-only lanes exist in the USA. While trucks are restricted to certain
7 Arizona State Legislature. 2005. The Arizona Revised Statutes , 28-1100. Vehicles and loads; gross weight restrictions; exception. 46th Legislature, 2nd regular session. 8 Weight Tolerance Permits, Research Report 1323-2F, Texas Transportation Institute, Texas A&M University System and Texas Department of Transportation, 1994.
7
lanes in most states, all vehicles are permitted use of the same lanes. According to a recent feasibility study conducted for the California Department of Transportation (CALTRANS), “….exclusive truck lanes were the most plausible for congested highways where three factors exist: (1) truck volumes exceed 30% of the vehicle mix, (2) peak hour volumes exceed 1,800 vehicles per lane-hour, and (3) off-peak volumes exceed 1,200 vehicles per lane-hour.”9 The construction of truck-only lanes may ultimately improve safety and reduce traffic congestion. According to The Road Information Program (TRIP),10 National Highway Traffic Safety Administration (NHTSA) data from U.S. highways from 1998 to 2002 seem to support truck-only lane proposals. One-lane traffic fatalities involving large trucks account for about 0.5% of traffic fatality collisions in all lanes. Large truck traffic fatalities are highest in two lanes (75.5%) and four lanes (12.2%). Fatalities involving large trucks are greatest where the posted speed limit is 55 mph (37.8%) and 60 mph or higher (35%). The lower the posted speed limit, the fewer the number of large truck fatalities. In Arizona, an average of 100 people are killed in large-truck collisions each year. Samuel et al.11 present an interesting concept of “self-financing inter-city toll truckways,” where heavy truck lanes are fitted with continuous concrete safety barrier(s) and “dedicated ingress and egress ramps and staging areas.” A truckway is envisaged to exist “….either in its own right of way separate from any other roadway or located within the right of way of a limited-access highway, but which is completely separated from the mixed traffic lanes… and… fully grade separated and access controlled and may be one or two lanes in each direction.” However, these custom-built and designed truck “freeways within-the-freeway” would involve considerable time and expense to construct. In-depth safety and economic analyses would be needed to prove such feasibility for the following reasons, among others:
• Jersey barriers or concrete traffic dividers are typically designed to minimize damage and reduce the likelihood of a car crossing into oncoming lanes in the event of a collision.12
• Collisions that could occur in such truck “freeways within-the-freeway” could not only cost lives but additional collisions since heavy truck drivers would not have
9 California Department of Transportation (CALTRANS). 2004. “Truck-Only Lanes.” CALTRANS: Traffic Operations Program, Office of Truck Services. May 24, 2004. < http://www.dot.ca.gov/hq/traffops/trucks/trucksize/fs-trucklanes.htm> 10 The Road Information Program. 2004. America’s Rolling Warehouses: The impact of increased trucking on economic development, congestion, and traffic safety. http://www.tripnet.org/TruckingReport020904.PDF 11 Samuel, P., R. W. Poole, Jr., and J. Holguin-Veras. 2002. Toll Truckways: A New Path Toward Safer and More Efficient Freight Transportation. Policy Study 294. Los Angles, California: Reason Public Policy Institute. 12 McDevitt, C. 2000. “Basics of Concrete Barriers.” In Public Roads. March/ April 2000. Volume 63. Number 5. Available from: <http://www.tfhrc.gov/pubrds/marapr00/concrete.htm>

8
the option to easily switch to one or more traffic lanes in the event of an emergency or to avoid a bottleneck.
• Concrete barriers of various dimensions, specifically heights and thicknesses, as well as different mechanisms of reinforcement and shapes, may be required for safety purposes.
Of all the states, Arizona demonstrates the highest percentage increase (78%) in large truck travel over the 1998 to 2002 period. Large trucks pose a significant economic cost due to accelerated fatigue on the pavement. The pavement fatigue also increases vehicle wear that may impact vehicular performance and maintenance costs. Consequently, truck-only lanes might reduce the high costs associated with pavement maintenance and replacement. The accelerated pavement fatigue might then be limited to the truck-only lanes rather than all of the other lanes shared with all other motorists. The truck-only lanes would also aid roving enforcement agents in identification and tracking of suspect overweight vehicles. Truck-only lanes may not only prove to be a safe choice, but an economically feasible one as well. We, therefore, introduce truck-only lane designs13 that may be equipped with special sensors to allow mobile enforcement crews to remotely detect the presence of overweight trucks. These designs, as developed by ESRA Consulting Corporation ™, offer a significant and cost-effective improvement over others. Such lanes may be created within new or existing lanes to reduce costs. All trucks may drive on these lanes and therefore limit excess pavement damage to these lanes. Tolls may be an option based on the penalties assessed to illegally overweight truck drivers. Some states, however, may eventually add tolls to truck only lanes. Since these lanes are not fitted with any special sensors as we prescribe, all heavy truckers would be levied a toll. Therefore, our truck-only lane designs may ultimately improve safety, optimize pavement design, and strike a balance between the trucking industry, our government, and stakeholders. Since the safety implications of any new or existing lane construction requires consideration, further studies are now needed to aid in the development of truck-only lanes in Arizona and other states. However, their study, development, and implementation will not be possible without policy reforms by the state and federal government.
13 For more information about these truck-only lane designs, please contact Sandy H. Straus, ESRA Consulting Corporation, 1650 South Dixie Highway, Third Floor, Boca Raton, Florida 33432, Telephone: 561-361-0004, e-mail: [email protected].

9
II. MAGNITUDE OF OVERWEIGHT VEHICLE IMPACTS
Pavement Types Flexible and rigid pavements are the two primary types of hard surfaced pavements. Flexible pavements are the most common. These cover 93% of all U.S. roads. Bituminous (asphalt) materials comprise flexible pavements. These are “flexible” because the traffic loads cause the total pavement structure to “bend” or “deflect.” Flexible pavement design allows surface load stress to wane with depth. A layered system with progressively weaker materials generally provides adequate strength to resist the load stress. Pavements comprised of Portland cement concrete (PCC) have high stiffness and are therefore referred to as “rigid.”14 The distribution of load over a subgrade, “the suspension system” of the pavement varies according to pavement type.15 However, pavement structure, mix design, and subgrade all influence the life and performance of the pavement.
Pavement Design The design and analysis of pavement structures are primarily dependent upon traffic data. The American Association of State Highway and Transportation Officials (AASHTO) pavement damage equivalency equations and Highway Performance Monitoring System (HPMS) pavement functions govern the use and application of such data. Various procedures are used and identified in the 1993 AASHTO Guide for Design of Pavement Structures.16 For example, it is possible to convert a mixed traffic stream of different axle loads and axle configurations into a design traffic number. This can be achieved by converting each expected axle load into an equivalent number of 18 kip-single-axle loads, known as equivalent single-axle loads (ESALs). The AASHTO damage concept, however, has some limitations. According to the Texas Transportation Institute, the AASHTO damage concept is based on a serviceability index.17 Some significant forms of damage such as bleeding or flushing of asphalt pavements are not directly integrated. Heavy loads on asphalt surfaces that have been designed for lighter loads may create this type of damage. A loss of skid resistance may result. This may be the byproduct of too much or too soft asphalt utilized for pavements supporting the heavy loads. A seal coat may be applied with an adequate quantity of asphalt to reduce heavy truck damage.
14 Hawaii Asphalt Pavement Industry. 2003. Available from: http://www.hawaiiasphalt.com/HAPI/modules/04_pavement_types/04_pavement_types.htm 15 United States Department of Transportation. 1998. Videotapes Explain the How and Why of Laboratory Test for Resilient Modulus. Focus, July/ August. 16 Guide for Design of Pavement Structures, Document Number: AASHTO GDPS-4, American Association of State and Highway Transportation Officials (Jan-1993). 17 Weight Tolerance Permits, Research Report 1323-2F, Texas Transportation Institute, Texas A&M University System and Texas Department of Transportation, 1994.
10
Pavement Maintenance and Life Span Highway maintenance and condition are dependent on several variables, including but not limited to: climate, pavement layer thickness, pavement material quality, maintenance, roadbed soil properties, temperature, quantity and weights of axle loads and truck configurations on the pavement.18 Pavements are typically designed for an economic life of 20 years.19 Georgia’s highways, for example, are engineered to sustain average traffic over a 20-year period.20 Bridges, however, are typically designed with an economic life of 75 years.21 These life spans pose a challenge for transportation infrastructure facilities to support a specified design load or number of load repetitions. The load characteristics of the anticipated traffic over the targeted useful design life of the structure are needed and not always available. Ideally, quality pavement is designed to last 30 years. However, fatigue may accelerate deterioration and result in earlier replacement. Since traffic volume is heaviest on the highways, and truck traffic continues to increase each year, pavement replacement may often be needed in less than ten years. Pavement fatigue remains the greatest threat to the quality and performance of every road. Pavement Fatigue Historically, highway infrastructure protection has been the primary consideration in determining truck size and weight limits.22 Weights and dimensions of trucks tend to influence the costs that highway agencies must bear to construct and maintain a highway system to serve present traffic and that anticipated in the future. Pavement deterioration accelerates with axle weight, the number of axle loadings, and the spacing within axle groups. The axle loads and spacing on trucks also affect the design and fatigue life of bridges. Truck dimensions influence roadway design -- truck width affects lane widths, trailer or load height affects bridge and other overhead clearances, and length affects intersection and curve design. Truck designs are determined by existing pavement and bridge strength and roadway geometry. Pavement failure is dependent on numerous variables, including but not limited to climate, environmental factors, materials, design, traffic, and usage. Since pavement damage increases with time, it is virtually impossible
18 Comprehensive Truck Size and Weight Study, Final Report. Batelle Team, Federal Highway Administration, US Department of Transportation, August 2000. 19 Leidy, J. P., Clyde E. Lee and Robert Harrison. 1995. Measurement and Analysis of Traffic Loads Across the Texas-Mexico Border. Center for Transportation Research, University of Texas at Austin. For Texas Department of Transportation. 20 Performance Audit: Georgia Department of Transportation Permits and Enforcement Program, Performance Audits Operations, Department of Audits, State of Georgia, March 2000. 21 Jooste, F.J., E.G. Fernando, Victoria. Superheavy Load Move: Report on Route Assessment and Pavement Modeling, Cooperative Research Program Research Report 1335-1, Texas Transportation Institute, Texas A&M University System, October 1994. 22 Comprehensive Truck Size and Weight Study, Final Report. Batelle Team, Federal Highway Administration, US Department of Transportation, August 2000.

11
to pinpoint any specific illegally overweight truck to quantify its independent contributions to such damages. New construction costs, risks to public safety, and additional design requirements for the infrastructure are all byproducts of pavement fatigue.23 Cracking and/or joint-related problems create rigid pavement failure. This occurs when the tensile stress (from loading, temperature, etc.) exceeds the modulus of rupture.24 In theory, the concrete is expected to have an infinite life if the stress ratio is below 50%. In practice, this may be a challenge. When the stress ratio exceeds 50%, the number of load cycles to failure decreases rapidly. Axle groups, such as tandems or tridems, influence pavement load distribution. According to the Comprehensive Truck Size and Weight Study, these groups allow greater weights to be carried and result in the same or less pavement distress than that occasioned by a single axle at a lower weight.25 Pavement life and performance is also affected by the spread between two consecutive axles. The greater the spacing, the more each axle in a group acts as a single axle. Additionally, the steering axle of a truck can cause significant damage to pavement.26 Some observations show more total deflection under the steering axle than under the trailer axle. This may be due to horizontal offsets of steering tires versus dual trailer tires, tractor suspension system dynamics, and/or consistent static weight (tractor) loading on the steering axle, regardless of vehicle payload. According to the American Concrete Pavement Association, ESALs are defined as the “summation of equivalent 18,000-pound single axle loads used to combine mixed traffic to design traffic for the design period.”27 ESALs are sometimes used to compare relative pavement impacts of various truck configurations with different numbers and types of axles.28 Increases in axle load correspond to increases in pavement fatigue. Traffic loadings greatly impact thinner pavements. Traffic loadings, coupled with environmental conditions, especially in places of variable climate, also accelerate the rate of pavement fatigue. Axles are the fixed bar or beam with bearings at its ends on which truck wheels revolve. The DOT reports that the net effect in axle spacing changes on
23 Preserving Highway Infrastructure Using Weigh-In-Motion (WIM). Dr. A.T. Bergan, Norm Lindgren, Dr. Curtis Berthelot , Bob Woytowich, University of Saskatchewan & International Road Dynamics Inc., November 1998. 24 Kilareski, W.P., “Heavy Vehicle Evaluation for Overload Permits,” Rigid and Flexible Pavement Design and Analysis, Unbound Granular Materials, Tire Pressures, Backcalculation, and Design Methods, Transportation Research Record 1227, 1989. 25 Comprehensive Truck Size and Weight Study, Final Report. Batelle Team, Federal Highway Administration, US Department of Transportation, August 2000. 26 Weight Tolerance Permits, Research Report 1323-2F, Texas Transportation Institute, Texas A&M University System and Texas Department of Transportation, 1994. 27 American Concrete Pavement Association. 2005. http://www.pavement.com/ 28 Comprehensive Truck Size and Weight Study, Final Report. Batelle Team, Federal Highway Administration, US Department of Transportation, August 2000.

12
pavement deterioration is complex and highly dependent on pavement structure.29 Tire characteristics vary according to materials, design, and manufacturer, among other variables. Consequently, the accelerated rutting of pavement is sometimes associated with tire characteristics. Wide-base single tires lack strong rut resistance and tend to cause 1.5 times more rutting than dual tires on the flexible pavements. In a laboratory, pavement impacts are observed by applying distresses and strains to different pavement samples. These pavement distresses are standardized to an 8,000-pound axle equivalent through use of Load Equivalency Factors (LEF), which can differentiate between distresses, rather than an ESAL. Pavement distresses may include alligator (fatigue) cracking, bleeding, block cracking, corrugation and shoving, depression, joint reflection cracking, longitudinal cracking, patching, polished aggregate, potholes, raveling, rutting, slippage cracking, stripping, transverse (thermal) cracking, and water bleeding and pumping. The reader is referred to the website of Hawaii’s Asphalt Pavement Industry in order to view photographs and information concerning each of these forms of pavement distress. 30 Aged asphalt pavements are susceptible to stiffness and brittleness due to an increase in viscosity. This leads to fatigue cracking. Therefore, rheological properties are very important to pavement design and performance. Rutting and bleeding may result from pavements that greatly deform and flow. In Georgia, for example, visible forms of pavement damage caused by overweight vehicles include, but are not limited to, rutting and load cracking.31 Load cracking happens when small pieces of pavement are dislodged from the surface of the road. Rutting occurs through permanent depressions in the pavement along the wheel path of traffic. Pothole development and shoulder damage are hazardous to passenger cars and school buses. Rut development contributes to severe hydroplaning, or wet pavement skidding. This poses a serious risk to drivers because traction is lost when water lifts a tire away from the road.
Bridges and the Federal Bridge Formula Bridges were a different story. As urban and rural diverged and the population exploded, numerous bridges were built throughout the U.S. in the 1800s and 1900s. A bridge formula was needed to effectively reduce pavement and structural fatigue on bridges. In the 1940s, AASHTO recommended a bridge formula concept. It was not fully developed until 1962. The Federal-Aid Highway Amendments of 1974 required vehicles to comply with the Federal Bridge Formula (FBF).
29 Comprehensive Truck Size and Weight Study, Final Report. Batelle Team, Federal Highway Administration, US Department of Transportation, August 2000. 30 Hawaii Asphalt Pavement Industry. 2003. Available from: http://www.hawaiiasphalt.com/HAPI/modules/04_pavement_types/04_pavement_types.htm 31 Performance Audit: Georgia Department of Transportation Permits and Enforcement Program, Performance Audits Operations, Department of Audits, State of Georgia, March 2000.
13
The FBF is now used to preserve our nation’s bridges and control vehicle weights. It is a function of the number of axles and axle spacing on a truck. It effectively calculates the maximum allowable weight on any group of axles. Some states, such as Arizona, use the FBF to determine the axle weights for overweight vehicles.32 The Federal Bridge Formula B33 is defined as:
W = [LN/N-1 + 12N + 36]
where: W = the maximum weight in pounds that can be carried by a group of two or more axles to the nearest 500 pounds L = the distance between the outer axles of the group N = the number of axles in the considered group
The FBF is an approximation of the 5% and 30% overstress criteria.34 The National Bridge Inventory is used as a tool for the estimation of different scenario vehicles on a sample of bridges. While criteria vary from agency to agency, deficient bridges require replacement. Cracks develop in materials at points of high stress concentration. Steel bridges and pre-stressed concrete spans, if overloaded, are susceptible to fatigue. A doubling of stress creates an eight-fold increase in steel component damage. The repetitive applications of high stresses, particularly those produced by different motor vehicles, accelerate bridge fatigue. Therefore, the design stresses are far below stresses at which bridge failure occurs. The HS-20 and the H-15 are the most common bridge designs. These designs are based on one of two standard loadings. Heavy truck traffic on interstates and other highways call for the HS-20 bridge design. HS-20 designs typically replace H-15 designs. Lower functional class facilities, where older bridges are concerned, use the H-15 designs. Some states shore up bridges rather than replace them. Others opt for postings to prohibit use by the vehicles that would create the most damage. The cost of strengthening a bridge is a significant portion of the cost to replace the entire structure. Vehicle gross weight, the weight on various groups of axles, the distance between axles, and the type and length of bridge all influence the impact of truck and weight policies on bridges. Such policies significantly affect bridge impacts. Truck length, specifically
32 Arizona Department of Transportation, Motor Vehicle Division. 2005. Commercial Vehicle Enforcement. Available from: http://www.azdot.gov/mvd/faqs/scripts/faqs.asp?section=cp#4 33 United States Department of Transportation. 2004. Western Uniformity Scenario Analysis: A Regional Truck Size and Weight Scenario Requested by the Western Governors' Association. Washington, DC: United States Department of Transportation. 34 Comprehensive Truck Size and Weight Study, Final Report. Batelle Team, Federal Highway Administration, US Department of Transportation, August 2000.
14
wheelbase, greatly impacts bridge stress for long-span bridges.35 Further studies are now needed on the impacts of heavy trucks on fatigue and bridge deck deterioration.
Pavement Costs Pavement costs vary from place to place and from time to time. Pavement costs are dependent on materials, thickness, quantity, and, of course, quality. Geographic and environmental conditions are also considered. The design life of pavements is dependent on these and other variables, including the volume of traffic, frequency of traffic, and the weight of the vehicles. These all take their toll on the life of pavements. Loads create compression and bending of pavements. These lead to rutting and cracking. Heavy axles cause greater and faster pavement fatigue than light axles. For example, a 24,000-pound truck axle consumes over 2,000 times as much pavement life as a 2,000-pound automobile axle.36
The Significance of Fuel Taxes in Arizona and Other U.S. States In order to defray the costs of pavement maintenance and replacement, state and federal taxes on fuels are assessed to drivers. Crude oil costs account for the largest cost of gasoline. Federal and state taxes are the second largest cost of gasoline. The tax on a gallon of diesel fuel is only slightly higher than the tax on gasoline used by most motor vehicles. Fuel taxes appear to shift the tax burden from heavier commercial vehicles to smaller passenger vehicles. Yet, heavy trucks create far greater pavement damage than these other motor vehicles. In fact, some engineers neglect car and light trucks with respect to pavement strength design.37 The fines, fees, and penalties that illegally overweight vehicle drivers face do not appear to be proportional to the pavement fatigue costs they cause. Fuel savings that may result from reduced vehicle travel that results from consolidating cargo into one overloaded trip are offset by highway deterioration and damaged pavement.38 In 1997, approximately $200 million of the revenues generated for the Arizona Highway User Revenue Fund derived from commercial motor carrier taxes. These taxes were based on vehicle miles traveled in Arizona and were monitored through these ports-of-entry.39
35 Comprehensive Truck Size and Weight Study, Final Report. Batelle Team, Federal Highway Administration, US Department of Transportation, August 2000. 36 South Dakota Department of Transportation. 2002. SDOT Briefing: Truck Weights and Highways. 37 Corley-Lay, J. 2005. In “Troopers ticketing more heavy trucks,” by Pat Stith. The News & Observer. August 17, 2005. <http://newsobserver.com/news/story/2728787p-9166402c.html> 38 Terrell, R.L., C.A. Bell, Effects of Permit and Illegal Overloads on Pavements, NCHRP Synthesis 131, Transportation Research Board, 1987. 39 Norton, D. R, 1997. Performance Audit: Department of Transportation Motor Vehicle Division’s Revenue Functions, Report to the Arizona Legislature, Report No. 97-4. Phoenix: State of Arizona Office of the Auditor General. http://www.auditorgen.state.az.us/Reports/State_Agencies/Agencies/Transportation,%20Department%20of/Performance/97-04/97-4.pdf
15
In November 2004, the American Petroleum Institute reported that state and federal taxes on diesel fuel amounted to 52.4 cents per gallon plus 1 cent per gallon Underground Storage Tank tax in Arizona.40 This was only slightly higher than the U.S. average of 50.1 cents per gallon. An additional 9 cents per gallon on diesel fuel was also assessed to Arizona vehicles with a gross weight of 26,000 pounds or over. In September 2005, regular grade gasoline was offered at the same price as diesel fuel in some cities in Arizona and across the USA. This was primarily due to a disruption in fuel supplies attributed to Hurricane Katrina.41 This led many to speculate that any major natural or unnatural disaster could spark significant fuel shortages and price inflations. Between 1950 and 2002, the amount of gasoline and diesel usage increased dramatically in Arizona. Consumption increases were 1287% for gasoline and 6550% for diesel. In Arizona, large truck travel was projected to increase by 78% between 2003 and 2010. This is one of the highest rates of increase in the country, following Utah (82%) and Nevada (85%).42 The rise in diesel fuel usage corresponds to a jump in truck traffic and, therefore, higher costs than ever for pavement maintenance and replacement.43 Further spikes in diesel fuel costs may also contribute to an increase in illegally overweight motor carriers as truckers seek to economize and haul heavier cargo. The Congress may be pressured to increase the allowable gross weight and axle weight limits, as it was in 1975 due to the jump in fuel costs. Such legislation would contribute to accelerated pavement fatigue and expenses.
Pavement Cost Methods Marginal cost and incremental cost are two economic cost methods used for highway damage cost analysis. Tolliver defines the long run cycle of a highway as the entire time of existence from initial construction to abandonment.44 The addition of one more ESAL to a highway section leads to marginal cost impact analysis. This corresponds to the additional consumption of highway capacity. Incremental costs account for relatively large traffic increases as opposed to a single ESAL analysis.45 Yet, as discussed, highway
40 American Petroleum Institute. 2004. Policy Analysis and Statistics. “Nationwide and State-by-State Motor Fuel Taxes,” November 2004. Available from: http://api-ec.api.org/filelibrary/Gas%20tax%20November%202004%20Final.pdf 41 ESRA Consulting Corporation. 2005. Internal report. 42 The Road Information Program. 2004. America’s Rolling Warehouses: The impact of increased trucking on economic development, congestion, and traffic safety. http://www.tripnet.org/TruckingReport020904.PDF 43 Arizona Transportation Planning Division. 2003. 2002 Arizona Transportation Factbook: Transportation Relevant Statistical Information. Phoenix: Arizona Department of Transportation. http://tpd.az.gov/reports/pdf/2002factbook.pdf 44 Tolliver, Denver. Highway Impact Assessment. Westport, Connecticut: Quorum Books, 1994. 45 Eriksen, Ken, Kenneth L. Casavant, Impact of Increased International Trade (NAFTA) on Washington Highways, Part II: Highway Impact by Corridor, EWITS Research Report Number 25, Washington State University and US Department of Agriculture, November 1998.
16
damage costs fluctuate so these models may not offer the practicality that pavement damage analyses require. In actuality, it is very difficult to assess highway damage costs due to data requirements that most ports and mobile enforcement units lack. Pavement damage is dependent upon many variables and complexities. No equation or model we know of accounts for each of these variables. The few estimates that are available are either outdated or specific to one locality.
17
III. IDENTIFICATION OF OVERWEIGHT TRAFFIC
Manual and Automated Traffic Counting Techniques Traffic volume is estimated by counting the number of vehicles that pass a point along a highway or street during a specified time period. Traffic detectors automate the counting of passing vehicles. The most common traffic measuring equipment is a pneumatic road tube. Tubes are placed across the road perpendicular to the traffic stream. A counting device is triggered through changes in tube pressure as axles pass over the tube. However, these devices only record axle passage. The data must be converted to vehicles and vehicle classes according to preset axle-spacing parameters. Therefore, some degree of error is anticipated. 46 In contrast, induction loop detectors, which are embedded in the pavement, record the passage of actual vehicles rather than axles. Other sensing equipment includes sonar and radar detectors. However, these devices are generally used for real-time traffic flow monitoring. They are not typically calibrated for traffic counting and classification. According to the ADOT HPMS Data Team, 2002, “raw” traffic counts are conducted with rubber tubes stretched across the road. These must be adjusted to compensate for over-counting by multi-axle vehicles. Traffic classification allows for the development of axle correction factors, which are applied to any raw, tube-based counts. Traffic counts obtained by magnetic induction loops that are permanently imbedded beneath a roadway surface eliminate the need for axle factoring. The presence of a vehicle via a magnetic field is detected by electronic traffic counters connected to “loops.” Similarly, wires that are installed in the street at signalized intersections activate signal changes. Such techniques reduce the likelihood of an over-count of vehicles with a lot of axles, such as multi-trailer (“18-wheeler”) trucks.47 Tubes or loops are generally used to obtain raw traffic counts. These require seasonal adjustments to compensate for monthly and daily fluctuations of vehicular traffic. Such adjustments are done prior to the quote or publication of any traffic volume information. This adjusting procedure provides a traffic volume that best approximates the use of a given highway section for a typical 24-hour day of the year. Automatic traffic recorders (ATR), a network of continuous traffic recorder stations, produce seasonal adjustment factors. The ADOT Data Section operates 69 ATR stations statewide, which monitor vehicular traffic twenty-four hours each day of the year. These ATR stations are “polled” daily via telemetry and computer software to report the previous day's travel activity. Traffic data polled from ATRs are stored and processed in both monthly and annual
46 GIS/Trans. Ltd., Lima and Associates, and Transportation Research and Analysis, Inc. 2001. Enhancing Arizona Department of Transportation’s Traffic Data Resource. Final Report 492. Phoenix: Arizona Department of Transportation. 47 Average Annual Daily Traffic, Arizona Department of Transportation, Transportation Planning Division, Data Team. http://tpd.azdot.gov/datateam/aadtinfo.php
18
cycles, which are subsequently applied to raw counts taken on all highway segments that are assigned to a particular set of ATR stations. Once the field crews obtain and report the raw traffic counts, the data are downloaded and stored in a computer. These are later processed and converted to average annual daily traffic volumes (AADT). While it is important to gauge the volume of truck traffic, it is equally imperative to know the weights of the trucks for enforcement and safety purposes. Traditionally, the static scales are in widespread use. However, with the advent of WIM sensors, this technology is gradually supplementing, if not replacing, a lot of scales at ports across the USA. In Arizona, the use of WIM stems from a feasibility study that installed and assessed slow speed Weigh-In-Motion (SWIM) equipment for enforcement applications.48
Weigh-in-motion Sensors WIM devices are commonly used as an alternative to static weigh stations. WIM allows for the effective monitoring of gross vehicle and axle weight monitoring as trucks drive over a sensor. The WIM captures and records the data without requiring the trucks to stop. It provides real-time and accurate counts and gauges compliance with state and federal laws. The WIM scale takes an instantaneous reading of a fluctuating or oscillating force. Since WIM recorders convert signals from the sensors into load values, there is a potential for WIM measurement errors. Dynamic loading errors appear to be dependent on a number of factors including acceleration, braking, road conditions, vehicle speed, and vehicle type. 49 Therefore, the recorders must be recalibrated frequently.50 WIM Systems are classified according to Type I, II, III, or IV according to application through American Society for Testing and Materials (ASTM) Designation E 1318-94.51 These vary according to user requirements and performance. Different data gathering capabilities, speed ranges, and uses define the four different WIM systems.52 There are three types of sensors commonly used in WIM Systems. These include the bending-plate sensors, piezoelectric sensors, and single load cell scale. The bending-
48 Castle Rock Consultants. 1989. Port of Entry Weigh-In-Motion Feasibility Study. FHWA-AZ89-702. Phoenix, Arizona: Arizona Department of Transportation. 49 Oregon Department of Transportation Research Unit, Policy and Research Section, Transportation Development Branch, Oregon Department of Transportation. 1998. Port-of-Entry Advanced Sorting System (PASS) Operational Test. FHWA-OR-RD-99-15. 50 GIS/Trans. Ltd., Lima and Associates, and Transportation Research and Analysis, Inc. 2001. Enhancing Arizona Department of Transportation’s Traffic Data Resource. Final Report 492. Phoenix: Arizona Department of Transportation. 51 American Society for Testing and Materials. 1994. Standard Specification for Highway Weigh-in-Motion (WIM) Systems with User Requirements and Test Method. ASTM Committee E-17 on Vehicle-Pavement Systems. ASTM Designation E 1318-94. 52 McCall, B. and W. C. Vodrazka. 1997. State’s Successful Practices Weigh-In-Motion Handbook. Washington, DC: Department of Transportation Federal Highway Administration.
19
plate sensors consist of steel plates embedded in concrete pavement. The plate deflects in an amount proportional to the load when a vehicle passes over the plate. The amount of deflection is transmitted to a data recorder. The load is computed. Bending plate sensors are believed to be more durable and accurate than piezoelectric sensors. Piezoelectric sensors, contrastingly, consist of a casing containing a piezoelectric material. This generates an electrical charge when subjected to mechanical stress. The vehicle load creates a charge that is proportional to the stress it produces. Piezoelectric sensors are an economical alternative to bending-plate sensors and can be moved from location to location. The Single Load Cell Scale constitutes a single hydraulic load cell installed at the center of each platform to measure the force applied to the scale. When properly installed and calibrated, Single Load Cell WIM systems are expected to provide gross vehicle weights that are within 6% of the actual vehicle weight for 95% of the trucks measured.53 Road conditions, road geometry, and vehicle condition impact WIM system performance. Vehicle dynamics also affect the accuracy level of the WIM systems. Accuracy is therefore lower than that for a static scale used for enforcement weighing. No absolute accuracy for a WIM scale exists. Therefore, any WIM accuracy is always quoted as a percentage accuracy with a confidence level. The confidence level is generally set at either 68% or 95%. ASTM accuracy uses the 95% level, which means that we can be 95% confident that the actual weight is within the measured WIM stated range.54 At weigh stations, Automatic Vehicle Identification devices may check registration and safety data. Since axle or truck weights are not identifiable by this technology, Strathman and Theisen also suggest the use of WIM.55 Automatic Vehicle Identification devices, used in combination with WIM technology, may offer cost-effective enforcement options.
Traffic Data Collection Methods in Arizona A recent study conducted by the ADOT documents discrepancies in data collection and equipment.56 ADOT collects and maintains traffic volumes for all highways at specific collection sites. Some sites record traffic volumes continuously throughout the year, but most sites are only counted for 48 hours once a year. The results of the collection effort are used to compile or compute AADT values for every section of the state highway system.
53 Weigh In Motion Technology - Economics and Performance. Rob Bushman, Andrew J. Pratt. Presented at NATMEC ’98, Charlotte, North Carolina, 1998. 54 Ibid. 55 Strathman, J. G. and G. Theisen. 2002. Weight Enforcement and Evasion: Oregon Case Study. FHWA-OR-DF-02-12. Salem, Oregon: Oregon Department of Transportation. 56 GIS/Trans. Ltd., Lima and Associates, and Transportation Research and Analysis, Inc. 2001. Enhancing Arizona Department of Transportation’s Traffic Data Resource. Final Report 492. Phoenix: Arizona Department of Transportation.
20
AADT is the average 24-hour traffic volume at a given location over a full 365-day year. Therefore, the AADT at a given site is calculated by dividing the total number of vehicles passing a site in a year by 365. About 70 collection sites are equipped with ATRs, which record traffic continuously throughout the year. For sites at which a 48-hour count is used, the site AADT is estimated by factoring the 48-hour count by seasonal, monthly, and day-of-week adjustments.57 ADOT uses several types of technology for automated traffic counting. Automatic traffic recorders (usually inductive loop detectors) are primarily used at the continuous monitoring sites, and pneumatic tube detectors for short-term counts. The ATR data are used to determine seasonal adjustments to short-term counts. Some of the ATR sites also record vehicle classification and weight. Specific sites are established for the collection of vehicle classification data. These sections are assumed to represent all highway sections within a specified area. Data collection at these sites is shared between the Long Term Pavement Performance (LTPP) program at the Arizona Transportation Research Center, and the Transportation Planning Data Team.58 ADOT performs manual vehicle classification counts at a few sites. Manual counts are performed over 6-hour intervals. In other locations, traffic counting devices are used to conduct 48-hour counts. These devices convert axle observations and measurements to vehicle classes, based on assumptions programmed into the recording devices. Finally, several sites are equipped with continuous automatic vehicle classification (AVC) devices that function in the same manner as the ATR equipment. All AVC sites use axle sensors and induction loops for vehicle detection and classification.59 The MVD, the ADOT Materials Group, and the Arizona Transportation Research Center (ATRC) all collect vehicle weight data for Arizona highways. MVD collects truck weights for enforcement purposes, while the Materials Group and the ATRC collect vehicle weight measurements for pavement management and research. The MVD uses static scales at port-of-entry (POE) locations statewide to measure gross vehicle weight and axle loads. While these scales have the benefit of a high degree of accuracy, static scales are insufficient for the measurement of a large volume of traffic. POE stations do not have the technical resources for truck weight data collection and storage, as the enforcement operations only require weight data for an inspection in progress. Weight records are recorded only at stations with WIM sensors, and these data are only maintained on the WIM recorder for a 24-hour period. 60 ADOT is currently in the midst of implementing the Data Collection Project. The Data Collection Project entails collecting vehicle counts and weights at selected MVD sites on a 24 hours-a-day, 7-days-a-week basis. ADOT is also striving to include all data
57 GIS/Trans. Ltd., Lima and Associates, and Transportation Research and Analysis, Inc. 2001. Enhancing Arizona Department of Transportation’s Traffic Data Resource. Final Report 492. Phoenix: Arizona Department of Transportation. 58 Ibid. 59 Ibid. 60 Ibid.

21
collection devices into a combined database in order to provide a better picture of where and when the heavy trucks are running. These data and information will be used to deploy our mobile operations at those locations identified as routes that overweight vehicles most frequently use. This should also help reduce circumvention of fixed POE sites. The Data Team and ATRC use WIM sensors to record weight measurements for vehicles traveling at highway speeds. ADOT uses two types of WIM sensors for these applications: bending plates and piezoelectric cables. However, these sensors are not always operational. ADOT Transportation Technology Group staff report that approximately 50% of the Freeway Monitoring System traffic sensors function at a given time. According to the Data Team, about 90% of the ATRs used to collect data for the HPMS fail at least once per year. A recent study shows that, on a given day, only 74% of the ATRs (55 out of 74) transmitted any data.61 Not every port in Arizona uses WIM technology. WIM sensors may only be present in one of two lanes of traffic. The lack of WIM sensors means that many overweight vehicles will not be detected. This will result in uncompensated costs due to pavement damage induced by overweight vehicles that are not weighed, monitored, or cited for infractions.62 On the other hand, according to interviews with ADOT staff, the WIM sensors are not particularly effective for capturing vehicle weight data. Certain bending-plate installations are only operational for a 3-month period before being rendered unusable due to excessive traffic loading. Hence there is a dire need for not only improved technologies, but also a calculation that will account for the data collection discrepancies that exist within agencies, highways, and elsewhere.
61 GIS/Trans. Ltd., Lima and Associates, and Transportation Research and Analysis, Inc. 2001. Enhancing Arizona Department of Transportation’s Traffic Data Resource. Final Report 492. Phoenix: Arizona Department of Transportation. 62 Ernzen, J. M. 2005, J. M. 2005. Port Runners – Impacts and Solutions. FHWA-AZ-05- 563. Phoenix, Arizona: Arizona Department of Transportation.

22
23
IV. SURVEY OF TRANSPORTATION OFFICIALS AND/OR TRUCK ENFORCEMENT PERSONNEL FROM SEVERAL U.S. STATES AND CANADA Introduction ESRA developed a survey to ascertain the state-of-the-practice of current mobile enforcement activities across the nation. Questionnaires were faxed, e-mailed, and/or queried by telephone to the directors and public safety officials of all 50 U.S. states and the ten provinces and three territories of Canada from January to April 2005. Some officials were telephoned for follow-up interviews. Responses were received from 25 states:
Alabama, Indiana, Oregon, Alaska, Louisiana, Tennessee, Arizona, Maryland, Texas, Arkansas, Missouri, Utah, California, Montana, Vermont, Colorado, Nebraska, Washington, and Delaware, North Dakota, Wisconsin. Georgia, Ohio, Illinois, Oklahoma,
Two responses were obtained from Canada: The Province of Nova Scotia and The Territory of Nunavut. Not all respondents from the U.S. and Canada answered all the questions on the survey. The majority of data requested was either undetermined or unavailable due to funding or staffing issues. Many respondents indicated that tasks were divided among different agencies. The information for South Dakota was acquired from “SDOT Briefing: Truck Weights and Highways.” Additional information on Arizona Ports of Entry was obtained through “Arizona Ports of Entry: Arizona Department of Transportation JLBC/OSPB Joint SPAR Report,” 2000 Strategic Program Area Review. It was then reported that there were “….13 ports, 9 mobile stations, 142 officers, and a Phoenix Central Permits office which only issues permits” under the auspices of ADOT-MVD.63 By 2005, Ernzen reported that there were 21 fixed ports of entry in the State, six of which were located on the Arizona-Mexico border.64 Our aim was to review and learn about the policies and practices of other agencies and bureaus in order to quantify and, ultimately, reduce pavement damage associated with overweight vehicles. Clearly, there is a dire need for improved mobile enforcement units, equipment, and data collection “across the board,” in all U.S. states. Arizona is a state that merits further
63 Arizona Department of Transportation. 1999. Arizona Ports of Entry: Arizona Department of Transportation JLBC/OSPB Joint SPAR Report, 2000 Strategic Program Area Review (available from: http://www.azleg.state.az.us/jlbc/ports.pdf) 64 Ernzen, J. M. 2005, J. M. 2005. Port Runners – Impacts and Solutions. FHWA-AZ-05- 563. Phoenix, Arizona: Arizona Department of Transportation.
24
attention due to its border with Mexico. As our survey demonstrates, geography, economy, industry, and climate appear to influence the number of violations by overweight vehicles in most U.S. states. For example, in Georgia, there are numerous overweight vehicles associated with the wood industry. In Indiana, these overweight vehicles may be linked to quarries and construction activities. Overweight vehicles create costly damage to roads and structures. Some violators know the schedule of the mobile enforcement units and strategically violate the weight limits after hours of operation. Other violations occur during operating hours in daylight. Survey Responses Question #1
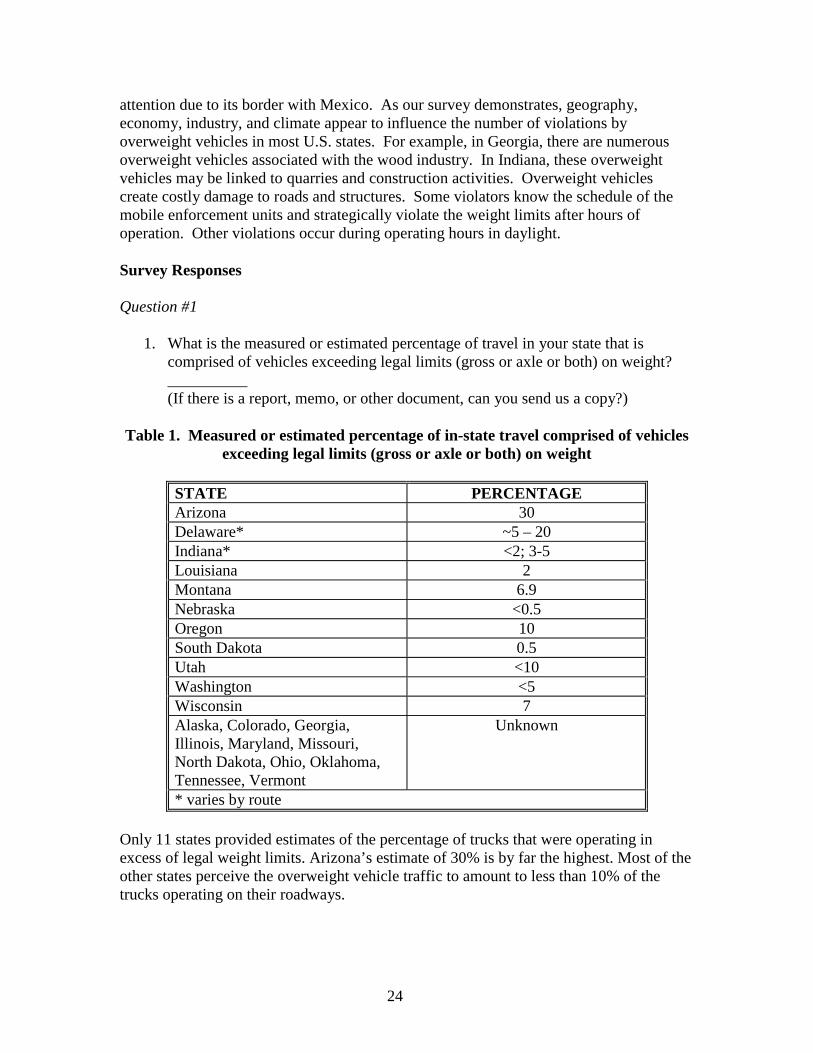
1. What is the measured or estimated percentage of travel in your state that is comprised of vehicles exceeding legal limits (gross or axle or both) on weight? __________ (If there is a report, memo, or other document, can you send us a copy?)
Table 1. Measured or estimated percentage of in-state travel comprised of vehicles
exceeding legal limits (gross or axle or both) on weight
STATE PERCENTAGE Arizona 30 Delaware* ~5 – 20 Indiana* <2; 3-5 Louisiana 2 Montana 6.9 Nebraska <0.5 Oregon 10 South Dakota 0.5 Utah <10 Washington <5 Wisconsin 7 Alaska, Colorado, Georgia, Illinois, Maryland, Missouri, North Dakota, Ohio, Oklahoma, Tennessee, Vermont
Unknown
* varies by route Only 11 states provided estimates of the percentage of trucks that were operating in excess of legal weight limits. Arizona’s estimate of 30% is by far the highest. Most of the other states perceive the overweight vehicle traffic to amount to less than 10% of the trucks operating on their roadways.
25
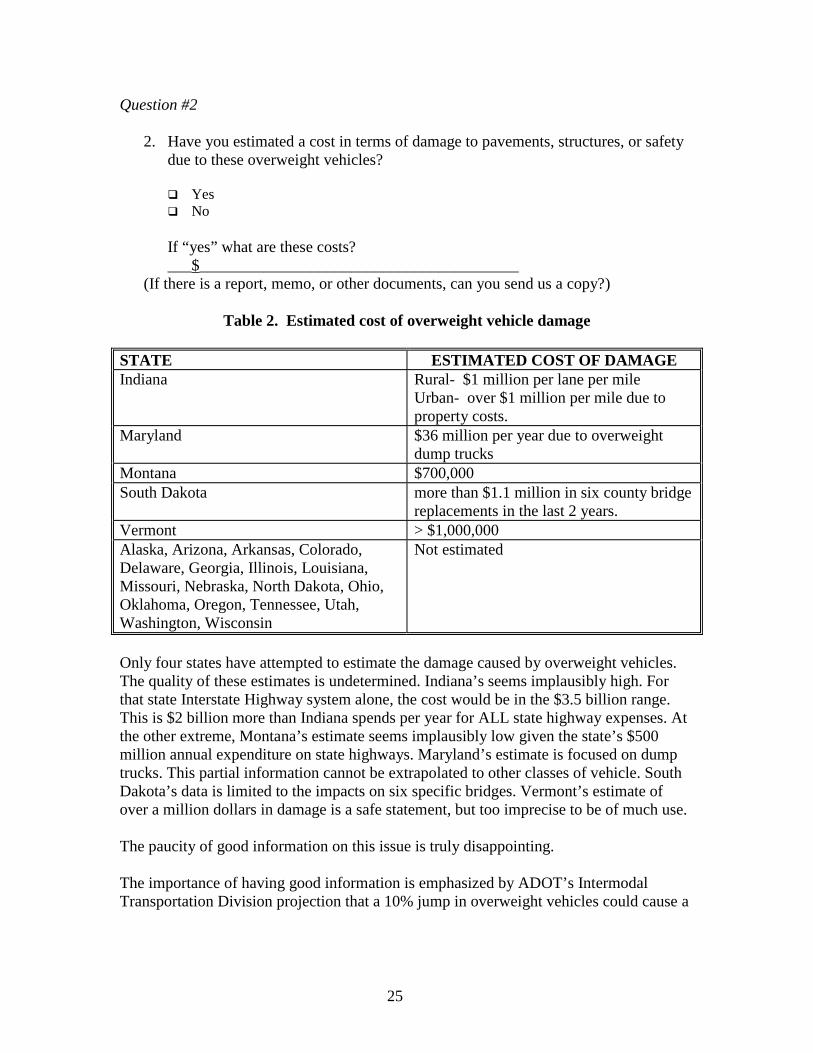
Question #2
2. Have you estimated a cost in terms of damage to pavements, structures, or safety due to these overweight vehicles?
Yes No
If “yes” what are these costs?
___$________________________________________ (If there is a report, memo, or other documents, can you send us a copy?)
Table 2. Estimated cost of overweight vehicle damage
STATE ESTIMATED COST OF DAMAGE Indiana Rural- $1 million per lane per mile
Urban- over $1 million per mile due to property costs.
Maryland $36 million per year due to overweight dump trucks
Montana $700,000 South Dakota more than $1.1 million in six county bridge
replacements in the last 2 years. Vermont > $1,000,000 Alaska, Arizona, Arkansas, Colorado, Delaware, Georgia, Illinois, Louisiana, Missouri, Nebraska, North Dakota, Ohio, Oklahoma, Oregon, Tennessee, Utah, Washington, Wisconsin
Not estimated
Only four states have attempted to estimate the damage caused by overweight vehicles. The quality of these estimates is undetermined. Indiana’s seems implausibly high. For that state Interstate Highway system alone, the cost would be in the $3.5 billion range. This is $2 billion more than Indiana spends per year for ALL state highway expenses. At the other extreme, Montana’s estimate seems implausibly low given the state’s $500 million annual expenditure on state highways. Maryland’s estimate is focused on dump trucks. This partial information cannot be extrapolated to other classes of vehicle. South Dakota’s data is limited to the impacts on six specific bridges. Vermont’s estimate of over a million dollars in damage is a safe statement, but too imprecise to be of much use. The paucity of good information on this issue is truly disappointing. The importance of having good information is emphasized by ADOT’s Intermodal Transportation Division projection that a 10% jump in overweight vehicles could cause a
26
$20 million annual increase in costs associated with road repair and maintenance.65 Roads designed for life spans of 20 years may fall short of that without adequate weight enforcement. Question #3
3. Have you done any studies of overweight vehicles in response to proposals to change the weight limits? If so, can you summarize the outcome of that/those studies? (If there is a report, memo, or other document, can you send us a copy?)
Only eight states professed to have conducted studies of overweight vehicles: Colorado, Georgia, Indiana, Louisiana, Missouri, Montana, North Dakota, and Washington. None of these studies specifically linked weight to pavement damage in any scientifically quantified way. Some technical reports are either unpublished or based on studies performed by other U.S. states. For example, Colorado, like Minnesota, considers increasing weight limits during the winter months. However, the various frost depths in Colorado reveal that increasing weight loads during frozen periods is not possible. In order to increase weights on state roads in Georgia, bills are introduced each year when legislature is in session. In Missouri, studies exist on the impacts of increased legal weights on bridges, as proposed by legislation. In Washington, requests are routinely received “...to increase axle loads for ‘specialty’ vehicles (i.e., cement trucks, refuse haulers, emergency response equipment, etc.).” The Washington Department of Transportation uses their layered elastic program (Everstress) to analyze such pavements and to estimate the damages caused by axle load increases through increases in required asphalt thicknesses. These studies, performed by the HQ Materials Pavement Division and the Commercial Vehicle Services branch of the Washington Department of Transportation indicate that the state is successful in its enforcement of axle weight and weight per inch of tire requirements. Indiana intends to enforce existing weight limit laws and utilize virtual weigh stations rather than modify weight limits. In South Dakota, illegal haulers who violate weight limits are pursued through enforcement and prosecution methods. Other states, such as Texas, do not currently have initiatives to change the weight limits, reported at Gross: 80,000 lbs.; Tandem Axle: 34,000 lbs.; Single Axle: 20,000 lbs.
65 Arizona Ports of Entry: Arizona Department of Transportation JLBC/OSPB Joint SPAR Report, 2000 Strategic Program Area Review (available from: http://www.azleg.state.az.us/jlbc/ports.pdf

27
Question #4
4. What percentage of the total of trucks on your roads is weighed at your ports-of-entry? ___________________________________________________
Table 3. Percentage of trucks on roads weighed at ports-of-entry
STATE PERCENTAGE Alaska 5.2% Arizona 98% Georgia 70% Illinois 40% Indiana 100% weighed on WIM Louisiana 15% Montana 17.86% Ohio 3% Oklahoma 5 to 10% Oregon 35%-55% Utah 35-40% Wisconsin 68.7% Arkansas, California, Colorado, Missouri, Tennessee, Vermont
unknown
Delaware, Maryland, North Dakota, Texas
Not applicable (No state port-of-entry)
Given that ports-of-entry deal with interstate traffic and are not always open, the lower percentages reported here seem more plausible. The higher percentage estimates may represent the ratio of vehicles stopped at the POEs that actually are weighed. Some may not be weighed for efficiency reasons. For example, a flatbed truck without a load is obviously not overweight and may not need to be weighed. Some may not be weighed due to the queue length. If the queue stretches beyond the ramp’s storage capacity it would constitute a safety hazard. Trucks arriving when there is no space on the ramp may be waived through the POE without stopping. Some states, such as Oregon, report the use of PrePass. PrePass is an automatic vehicle identification (AVI) system that allows participating transponder equipped commercial vehicles to bypass designated weigh stations, port-of-entry facilities, and agricultural interdiction facilities. Cleared vehicles may proceed at highway speed, eliminating the need to stop.66 While seemingly useful, this system seems to have some limitations. PrePass may check the safety credentials of the driver yet not weigh the vehicle. Vermont performs weight enforcement activities through use of Platform, portable wheel
66 http://www.prepass.com/aboutprepass.htm

28
weigh loaders, Semi-portable scales, and WIMs. In Missouri, fixed sites, HSWIMS-PrePass, portable scales, and RampWIMs are used to weigh millions of vehicles per year. At the Texas-Mexico border, there are eight ports-of-entry. All trucks entering Texas from Mexico pass over weigh-in-motion scales at these ports-of-entry. Vehicles that fail the weigh-in-motion are weighed on a static scale. Question #5 5. Please indicate typical hours of operation for your ports-of-entry: ________hours
Table 4. Typical hours of operation for ports-of-entry
STATE HOURS Alaska 24-hour shifts Arizona “Depends on POE (Port of Entry). A large
Interstate POE is supposed to operate 7 days a week, 24 hours a day. A smaller secondary POE might be 16 hours 5 to 7 days a week according to traffic and/or staffing. Some are 8 hours five days a week. International POEs hours of operation are determined by Customs agency.”
Arkansas 24-hour shifts California 24-hour shifts Delaware 24-hour shifts Georgia 2- 8 hour shifts Illinois 16-hour shifts Indiana 8-hour shifts Louisiana 24-hour shifts Maryland Not Applicable Missouri 18- 24 hours Montana 8-24 hours North Dakota Not Applicable Ohio 8-hour shifts Oklahoma 8-hour shifts Oregon 18- 24 hours Tennessee 24-hour shifts Texas 18-hour shifts Utah 20- 24 hours Vermont 12-hour shifts Wisconsin 16-hour shifts
While several states maintain round-the-clock operation of their POEs, most do not. Drivers of overweight vehicles aware of the closing times of POEs not operating 24 hours a day may time their trips to ensure bypassing a closed POE.

29
For example, the eight ports-of-entry in Texas “…operate at varying hours from 6AM to Midnight on weekdays.” These ports are managed on the same schedule as the U.S. Customs & Border Protection ports-of-entry. In Oklahoma, “Hours of operation are selectively expanded in response to a need for increased enforcement…from keeping weigh stations open longer hours, varying the hours at specific weigh stations, or double shifts for all stations in January to check registration. The Corporation Commission is facing the same budgetary constraints as ODOT. All of the agencies involved in weight enforcement are working together to maximize available resources.”
Not applicable10%
24-hour shifts28%
18- 24 shifts10%
18-hour shifts5%
16-hour shifts10%
12-hour shifts5%
8-hour shifts14%
2- 8 hour shifts5%
Varies according to Port-of-entry
13%
Figure 1. Typical hours of operation for ports-of-entry in selected states
30
According to Vermont, “Sixty percent of DMV enforcement activity is spent on state initiatives i.e. size, weight, IFTA (International Fuel Tax Agreement), IRP (International Registration Plan), dyed fuel etc. and the other forty percent is MCSAP (Motor Carrier Safety Assistance Program) enforcement activities in which weight enforcement can be part of a MCSAP inspection. Most officers, based on national statistical violation trends, work Monday – Friday between the hours of 0600-1800 hours. Inspectors may work outside of that time frame but the bulk of our activity is during the listed days and time.” In Arizona, the hours of operation vary from port-of-entry to port-of-entry. “A large Interstate POE is supposed to operate 7 days a week, 24 hours a day. A smaller secondary POE might be 16 hours 5 to 7 days a week according to traffic and/or staffing. Some are 8 hours five days a week. International POES hours of operation are determined by the Customs agency.” Unsurprisingly, the respondents with limited hours of ports-of-entry operation expressed interest in extending hours of operation. However, budget and staffing issues prevented such activities. Nowhere was this more evident than in Arizona, where, since 1998, truck traffic increased significantly while the hours of operation at Arizona ports were cut by 39%.67
67 Ernzen, J. M. 2005, J. M. 2005. Port Runners – Impacts and Solutions. FHWA-AZ-05- 563. Phoenix, Arizona: Arizona Department of Transportation.
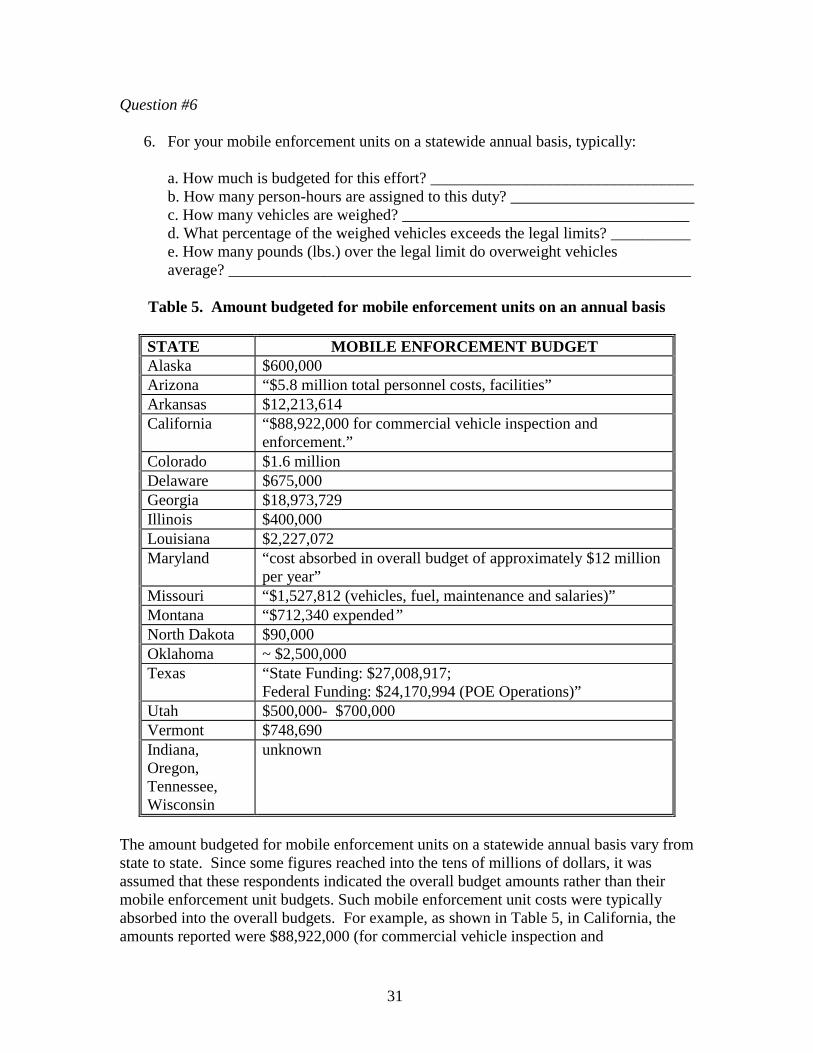
31
Question #6
6. For your mobile enforcement units on a statewide annual basis, typically: a. How much is budgeted for this effort? _________________________________ b. How many person-hours are assigned to this duty? _______________________ c. How many vehicles are weighed? ____________________________________ d. What percentage of the weighed vehicles exceeds the legal limits? __________ e. How many pounds (lbs.) over the legal limit do overweight vehicles average? __________________________________________________________
Table 5. Amount budgeted for mobile enforcement units on an annual basis
STATE MOBILE ENFORCEMENT BUDGET Alaska $600,000 Arizona “$5.8 million total personnel costs, facilities” Arkansas $12,213,614 California “$88,922,000 for commercial vehicle inspection and
enforcement.” Colorado $1.6 million Delaware $675,000 Georgia $18,973,729 Illinois $400,000 Louisiana $2,227,072 Maryland “cost absorbed in overall budget of approximately $12 million
per year” Missouri “$1,527,812 (vehicles, fuel, maintenance and salaries)” Montana “$712,340 expended” North Dakota $90,000 Oklahoma ~ $2,500,000 Texas “State Funding: $27,008,917;
Federal Funding: $24,170,994 (POE Operations)” Utah $500,000- $700,000 Vermont $748,690 Indiana, Oregon, Tennessee, Wisconsin
unknown
The amount budgeted for mobile enforcement units on a statewide annual basis vary from state to state. Since some figures reached into the tens of millions of dollars, it was assumed that these respondents indicated the overall budget amounts rather than their mobile enforcement unit budgets. Such mobile enforcement unit costs were typically absorbed into the overall budgets. For example, as shown in Table 5, in California, the amounts reported were $88,922,000 (for commercial vehicle inspection and
32
enforcement); and in Texas, $51,179,911 (for state and federal funding). Of this Texas budget, $24,170,994 was earmarked for ports-of-entries. This study determined that, among all respondents who reported specifically their mobile enforcement unit budgets, the average amount budgeted for mobile enforcement units in these states was approximately $3.7 million. In Arizona, the mobile enforcement budget was estimated at $5.8 million for total personnel costs and facilities. The budget in North Dakota was lowest at $90,000. In Tennessee, a merger between the Commercial Vehicles Enforcement unit and the Highway Patrol recently occurred through the Department of Safety. It was reported that troopers were assigned to either road patrol or fixed inspection stations. The troopers were not assigned to a set number of hours per day of mobile weight enforcement. A lack of calibrated and certified portable wheel weighers resulted in very few trucks being weighed. Therefore, no budgets or statistics we requested were available at the time this questionnaire was issued. Approximately $600,000 is budgeted yearly in Nova Scotia for mobile enforcement units. This is about the same amount budgeted in Alaska and slightly less than the amount budgeted in Delaware. In Figure 2, the amount of person-hours assigned to the duty of mobile enforcement units on a statewide annual basis in responding states is presented. This amount is dependent on location, need, funding, and staffing operations. Approximately 23% of the U.S. respondents report 2,000- 9,999 hours annually. There are 21,500 person-hours assigned to mobile enforcement unit duties in Nova Scotia.
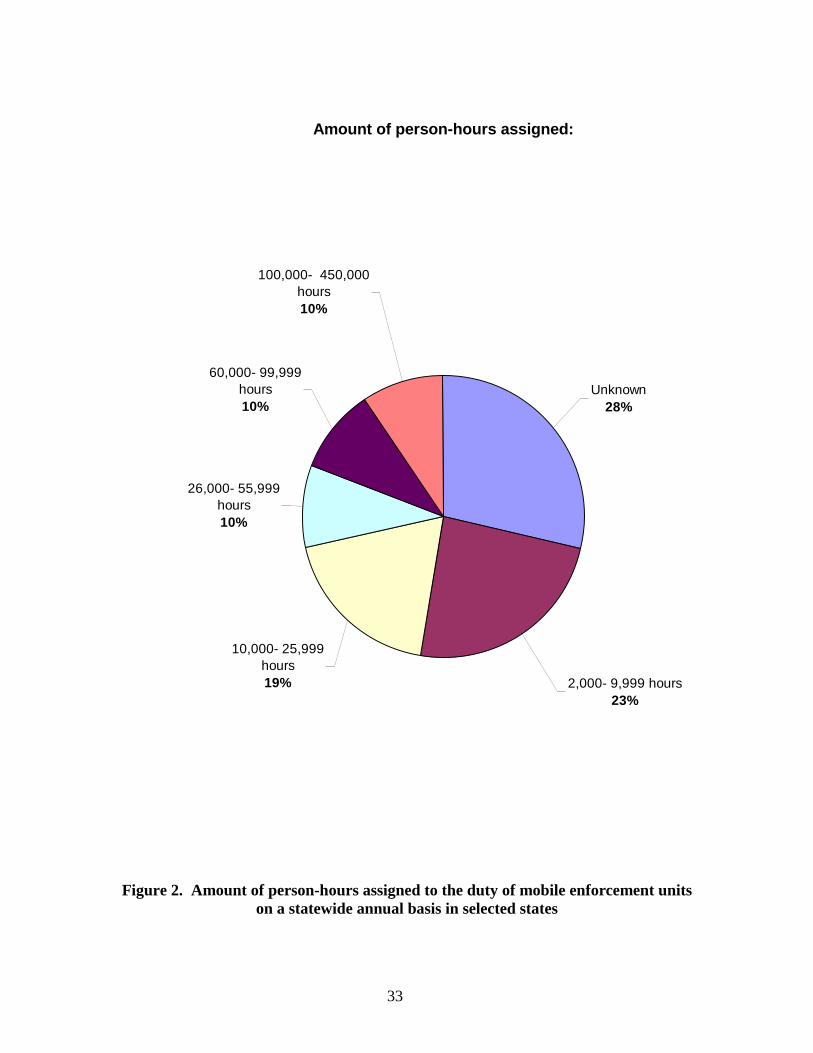
33
Amount of person-hours assigned:
Unknown28%
2,000- 9,999 hours23%
10,000- 25,999 hours19%
26,000- 55,999 hours10%
60,000- 99,999 hours10%
100,000- 450,000 hours10%
Figure 2. Amount of person-hours assigned to the duty of mobile enforcement units on a statewide annual basis in selected states

34
Table 6. Amount of mobile enforcement unit person-hours on an annual basis
STATE MOBILE ENFORCEMENT
PERSON-HOURS* Alaska 21,450 Arkansas 3,224 California 413,504 Colorado 54,000 Delaware 8,320 Illinois 249,600 Louisiana 62,400 Maryland 40,000 Missouri 139,776 Montana 25,000 North Dakota 5,000 Oklahoma 79,000 Oregon 2,000 Texas 2,080 Utah 18,720 Vermont 16,000 Arizona, Georgia, Ohio, Tennessee, Wisconsin
Unknown
*lower numbers of person-hours may be per person rather than total numbers of mobile enforcement unit person-hours.
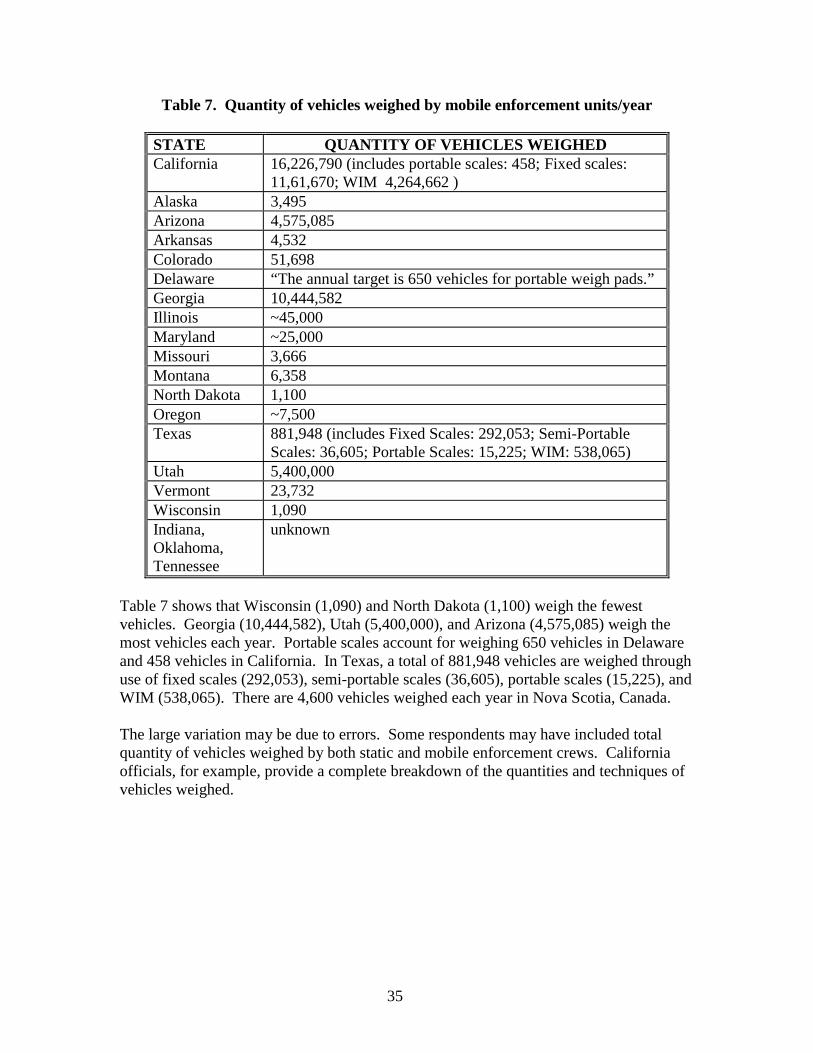
35
Table 7. Quantity of vehicles weighed by mobile enforcement units/year
STATE QUANTITY OF VEHICLES WEIGHED California 16,226,790 (includes portable scales: 458; Fixed scales:
11,61,670; WIM 4,264,662 ) Alaska 3,495 Arizona 4,575,085 Arkansas 4,532 Colorado 51,698 Delaware “The annual target is 650 vehicles for portable weigh pads.” Georgia 10,444,582 Illinois ~45,000 Maryland ~25,000 Missouri 3,666 Montana 6,358 North Dakota 1,100 Oregon ~7,500 Texas 881,948 (includes Fixed Scales: 292,053; Semi-Portable
Scales: 36,605; Portable Scales: 15,225; WIM: 538,065) Utah 5,400,000 Vermont 23,732 Wisconsin 1,090 Indiana, Oklahoma, Tennessee
unknown
Table 7 shows that Wisconsin (1,090) and North Dakota (1,100) weigh the fewest vehicles. Georgia (10,444,582), Utah (5,400,000), and Arizona (4,575,085) weigh the most vehicles each year. Portable scales account for weighing 650 vehicles in Delaware and 458 vehicles in California. In Texas, a total of 881,948 vehicles are weighed through use of fixed scales (292,053), semi-portable scales (36,605), portable scales (15,225), and WIM (538,065). There are 4,600 vehicles weighed each year in Nova Scotia, Canada. The large variation may be due to errors. Some respondents may have included total quantity of vehicles weighed by both static and mobile enforcement crews. California officials, for example, provide a complete breakdown of the quantities and techniques of vehicles weighed.
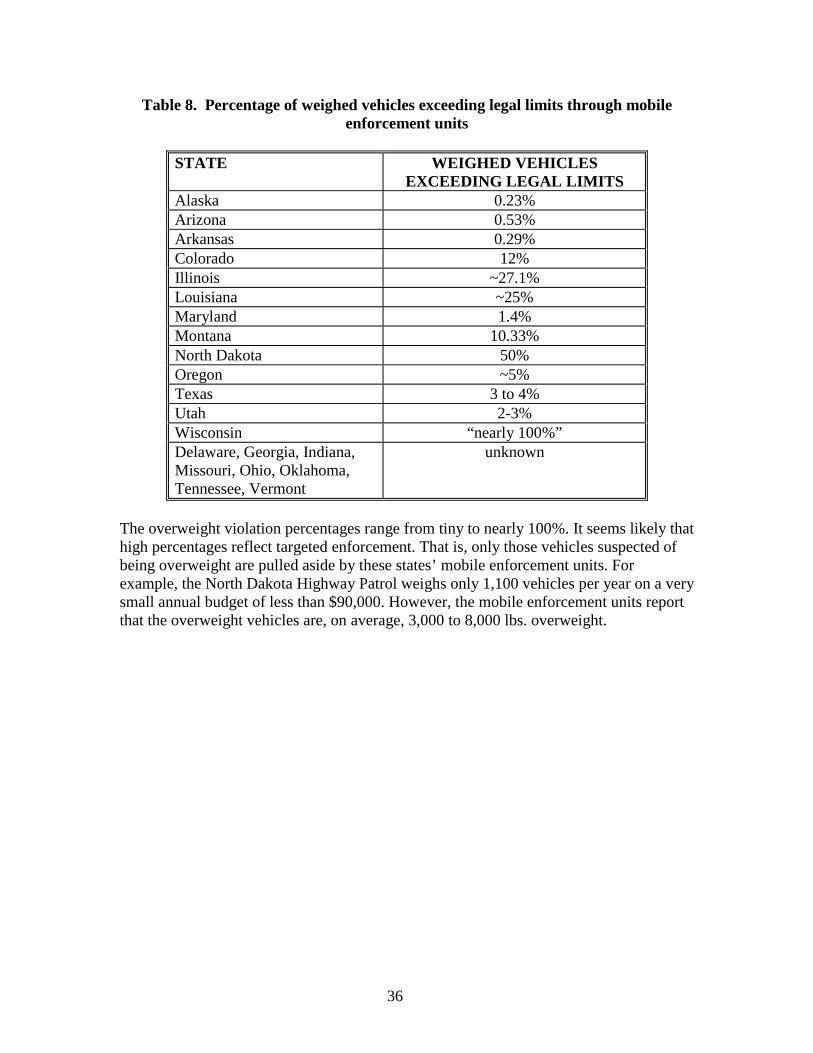
36
Table 8. Percentage of weighed vehicles exceeding legal limits through mobile enforcement units
STATE WEIGHED VEHICLES
EXCEEDING LEGAL LIMITS Alaska 0.23% Arizona 0.53% Arkansas 0.29% Colorado 12% Illinois ~27.1% Louisiana ~25% Maryland 1.4% Montana 10.33% North Dakota 50% Oregon ~5% Texas 3 to 4% Utah 2-3% Wisconsin “nearly 100%” Delaware, Georgia, Indiana, Missouri, Ohio, Oklahoma, Tennessee, Vermont
unknown
The overweight violation percentages range from tiny to nearly 100%. It seems likely that high percentages reflect targeted enforcement. That is, only those vehicles suspected of being overweight are pulled aside by these states’ mobile enforcement units. For example, the North Dakota Highway Patrol weighs only 1,100 vehicles per year on a very small annual budget of less than $90,000. However, the mobile enforcement units report that the overweight vehicles are, on average, 3,000 to 8,000 lbs. overweight.

37
Table 9. Average estimated number of pounds (lbs.) over the legal limit as reported by mobile enforcement units
STATE AVERAGE NUMBER OF POUNDS (LBS.)
THAT WEIGHED VEHICLES EXCEED LEGAL LIMITS
Utah 10,000 Wisconsin 6,500 Illinois “6,000 over” Montana 4,500 Alaska 4,000 North Dakota 3,000-8,000 Oregon “For calendar year 2004 the overall average
violation was 2,278 pounds.” Texas “Data is not available; but usually exceeds the
weight allowance by a minimum of 1,000 lbs. before enforcement action is initiated.”
Arizona, Arkansas. Colorado, Delaware, Indiana, Maryland, Missouri, Ohio, Tennessee, Vermont
unknown
While most respondents were unable to provide us with this data, such data as are available may be useful to know in order to improve mobile enforcement activities and reduce pavement damage from overweight vehicles. The Iqaluit office of Nunavut, Canada is equipped with a portable weigh-scale that was used to monitor a situation, several years ago, where overloaded rock-trucks were in frequent operation. Now, the Government of Nunavut reports, the scale is rarely needed and used. In Nova Scotia, Canada, mobile weighers are increased in order to reduce the damage caused by overweight vehicles. Question #7
7. What other actions (if any) does your state take to try to reduce the damage caused by overweight vehicles? (If there is a report, memo, or other documents, can you send us a copy?) ____________________________________________
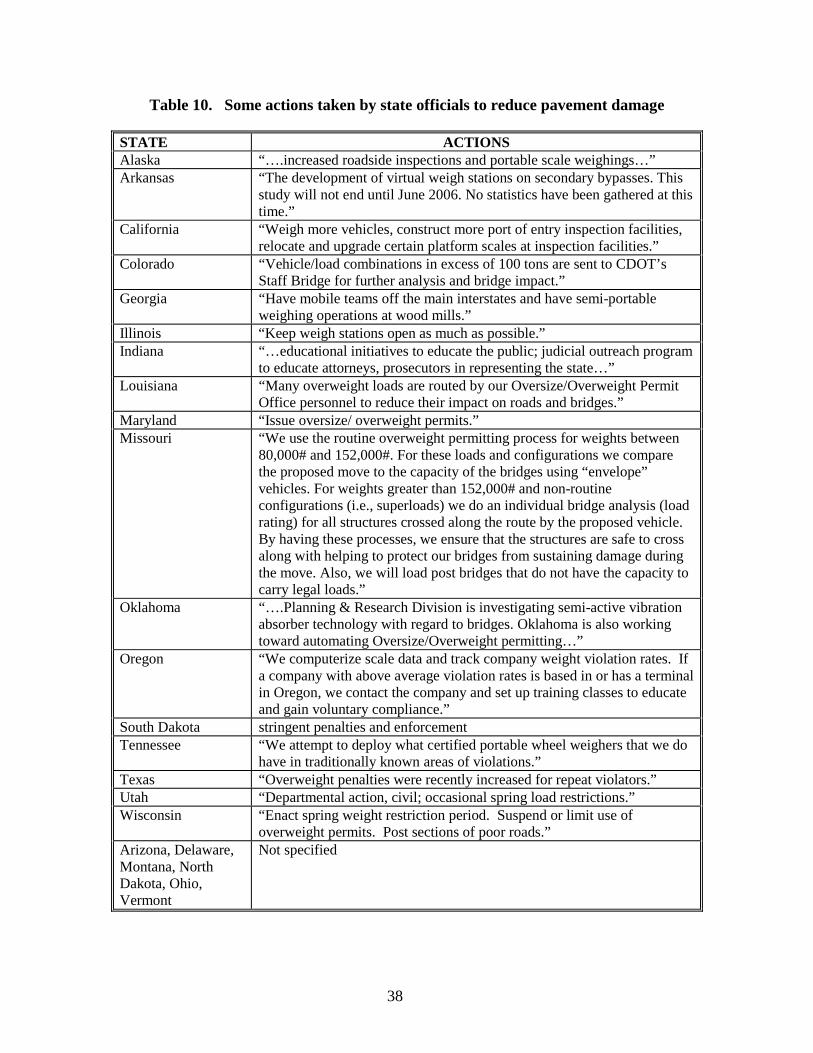
38
Table 10. Some actions taken by state officials to reduce pavement damage STATE ACTIONS Alaska “….increased roadside inspections and portable scale weighings…” Arkansas “The development of virtual weigh stations on secondary bypasses. This
study will not end until June 2006. No statistics have been gathered at this time.”
California “Weigh more vehicles, construct more port of entry inspection facilities, relocate and upgrade certain platform scales at inspection facilities.”
Colorado “Vehicle/load combinations in excess of 100 tons are sent to CDOT’s Staff Bridge for further analysis and bridge impact.”
Georgia “Have mobile teams off the main interstates and have semi-portable weighing operations at wood mills.”
Illinois “Keep weigh stations open as much as possible.” Indiana “…educational initiatives to educate the public; judicial outreach program
to educate attorneys, prosecutors in representing the state…” Louisiana “Many overweight loads are routed by our Oversize/Overweight Permit
Office personnel to reduce their impact on roads and bridges.” Maryland “Issue oversize/ overweight permits.” Missouri “We use the routine overweight permitting process for weights between
80,000# and 152,000#. For these loads and configurations we compare the proposed move to the capacity of the bridges using “envelope” vehicles. For weights greater than 152,000# and non-routine configurations (i.e., superloads) we do an individual bridge analysis (load rating) for all structures crossed along the route by the proposed vehicle. By having these processes, we ensure that the structures are safe to cross along with helping to protect our bridges from sustaining damage during the move. Also, we will load post bridges that do not have the capacity to carry legal loads.”
Oklahoma “….Planning & Research Division is investigating semi-active vibration absorber technology with regard to bridges. Oklahoma is also working toward automating Oversize/Overweight permitting…”
Oregon “We computerize scale data and track company weight violation rates. If a company with above average violation rates is based in or has a terminal in Oregon, we contact the company and set up training classes to educate and gain voluntary compliance.”
South Dakota stringent penalties and enforcement Tennessee “We attempt to deploy what certified portable wheel weighers that we do
have in traditionally known areas of violations.” Texas “Overweight penalties were recently increased for repeat violators.” Utah “Departmental action, civil; occasional spring load restrictions.” Wisconsin “Enact spring weight restriction period. Suspend or limit use of
overweight permits. Post sections of poor roads.” Arizona, Delaware, Montana, North Dakota, Ohio, Vermont
Not specified

39
The actions taken to reduce overweight vehicle damage are presented in Table 10. Georgia maintains mobile teams off the main interstates and has semi-portable weighing operations at wood mills. Indiana offers a judicial outreach program to educate attorneys in representing the state. Tennessee targets traditionally known areas of violations with the deployment of certified portable wheel weighers. South Dakota issues stringent penalties and enforcement. Louisiana routes overweight loads through its Oversize/overweight Permit Office personnel to reduce their impact on roads and bridges. Texas increases overweight penalties for repeat violators. Oklahoma investigates semi-active vibration absorber technology with respect to bridges. Oklahoma also plans to automate OS/OW permitting. Colorado sends vehicle/load combinations in excess of 100 tons “…to CDOT’s Staff Bridge for further analysis and bridge impact.” Oregon computerizes scale data to track company weight violation rates. In an effort to gain compliance, companies within Oregon that demonstrate “above average violation rates” are educated through training classes. Question #8
8. What are the actions you would like to take, but are prevented from taking due to financial or other impediments? ________________________________________
Table 11. Summaries of desired actions that are unfunded due to financial and
other impediments DESIRED ACTIONS* STATES Additional personnel and equipment Indiana, Louisiana,
Maryland, Utah Attract and retain qualified enforcement employees through an improved pay plan.
Montana
Charge more for overweight permits; equivalent to damage done to pavement.
Wisconsin
Extend hours of weigh station operations. Illinois, North Dakota Extend spring weight restriction period. Wisconsin Increase fines/ civil penalties/ weight operations. Colorado, Georgia,
Wisconsin Increase statewide activities Alaska, Georgia Installation of virtual weigh stations. Arkansas Installation of Weigh in Motion and/ or portable weigh stations at additional statewide locations.
Arkansas, Montana, Tennessee
lengthen scale decks and repave more scale ramps Oregon re-certify and deploy our portable wheel weighers Tennessee Transmit WIM data through wireless technology Vermont Unspecified Arizona, Delaware,
Ohio * Some states provided more than one response.
40
In Table 11, the respondents reveal a wish-list of unfunded yet desirable actions. For example, Vermont currently uses WIM stations for screening. However, inspectors “….must physically open the box and boot up the work station monitor in order to observe real time vehicle weights.” Therefore, an update of the VDOT WIM stations is necessary for inspectors to monitor roadside traffic from laptops that use wireless technology. According to an official in Oregon:
“All of the 91 Oregon DOT scales use 16’ decks. We are seeing more and more trailers today with 4 and greater axle groups with air suspension and 18 – 20 foot spreads. …. when we attempt to weigh the axle groups by splitting them and weighing in two groups, the air suspensions move air and change the weights. We are lengthening scale decks at seven of our interstate scales that frequently weigh these vehicles. By being able to weigh the entire group at once, the weight will be absolutely accurate. As the infrastructure ages, the costs to repave or maintain scale ramps are high. While, in the ideal, I wish had more money to repave more scale ramps, but we are holding our own.”
Some states, such as Louisiana, note the need for improved technologies at weigh station bypass routes and the construction of new weigh stations at key locations. Some logistical obstacles seem to exist with mobile weight enforcement operations now under the auspices of the State Police rather than the Department of Transportation. In Nova Scotia, Canada, like most U.S. states, there exists a need for additional vehicles and personnel.
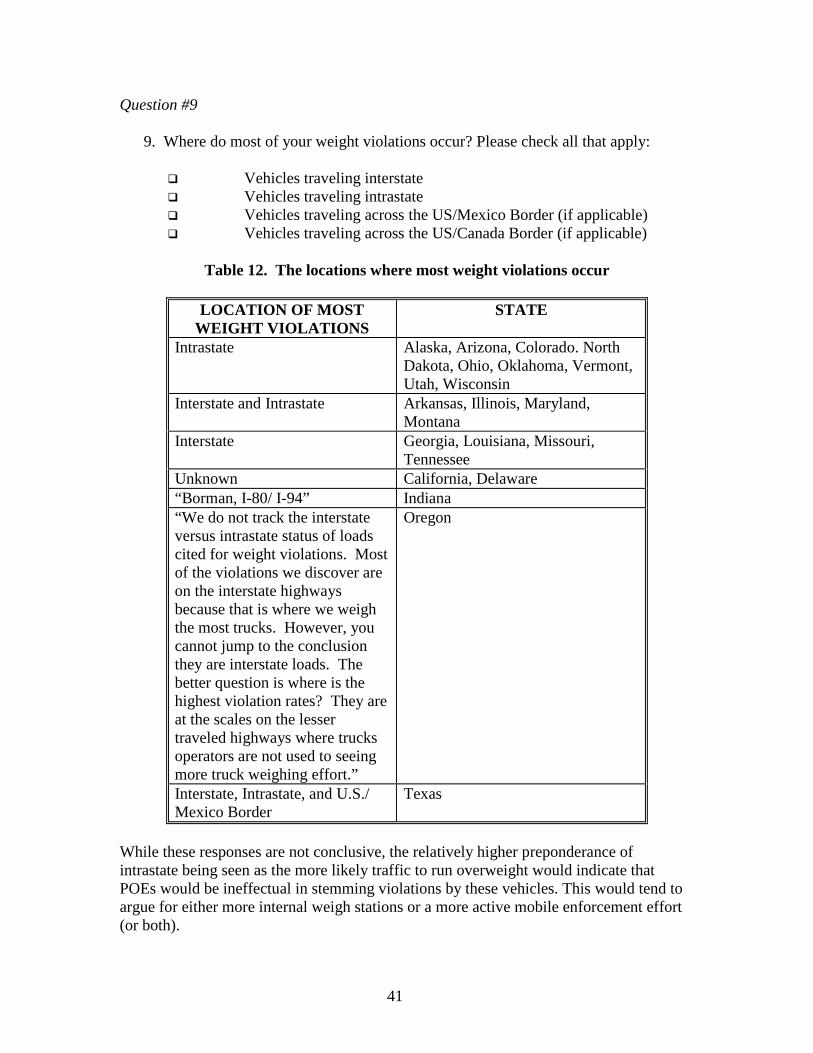
41
Question #9
9. Where do most of your weight violations occur? Please check all that apply: Vehicles traveling interstate Vehicles traveling intrastate Vehicles traveling across the US/Mexico Border (if applicable) Vehicles traveling across the US/Canada Border (if applicable)
Table 12. The locations where most weight violations occur
LOCATION OF MOST
WEIGHT VIOLATIONS STATE
Intrastate Alaska, Arizona, Colorado. North Dakota, Ohio, Oklahoma, Vermont, Utah, Wisconsin
Interstate and Intrastate Arkansas, Illinois, Maryland, Montana
Interstate Georgia, Louisiana, Missouri, Tennessee
Unknown California, Delaware “Borman, I-80/ I-94” Indiana “We do not track the interstate versus intrastate status of loads cited for weight violations. Most of the violations we discover are on the interstate highways because that is where we weigh the most trucks. However, you cannot jump to the conclusion they are interstate loads. The better question is where is the highest violation rates? They are at the scales on the lesser traveled highways where trucks operators are not used to seeing more truck weighing effort.”
Oregon
Interstate, Intrastate, and U.S./ Mexico Border
Texas
While these responses are not conclusive, the relatively higher preponderance of intrastate being seen as the more likely traffic to run overweight would indicate that POEs would be ineffectual in stemming violations by these vehicles. This would tend to argue for either more internal weigh stations or a more active mobile enforcement effort (or both).
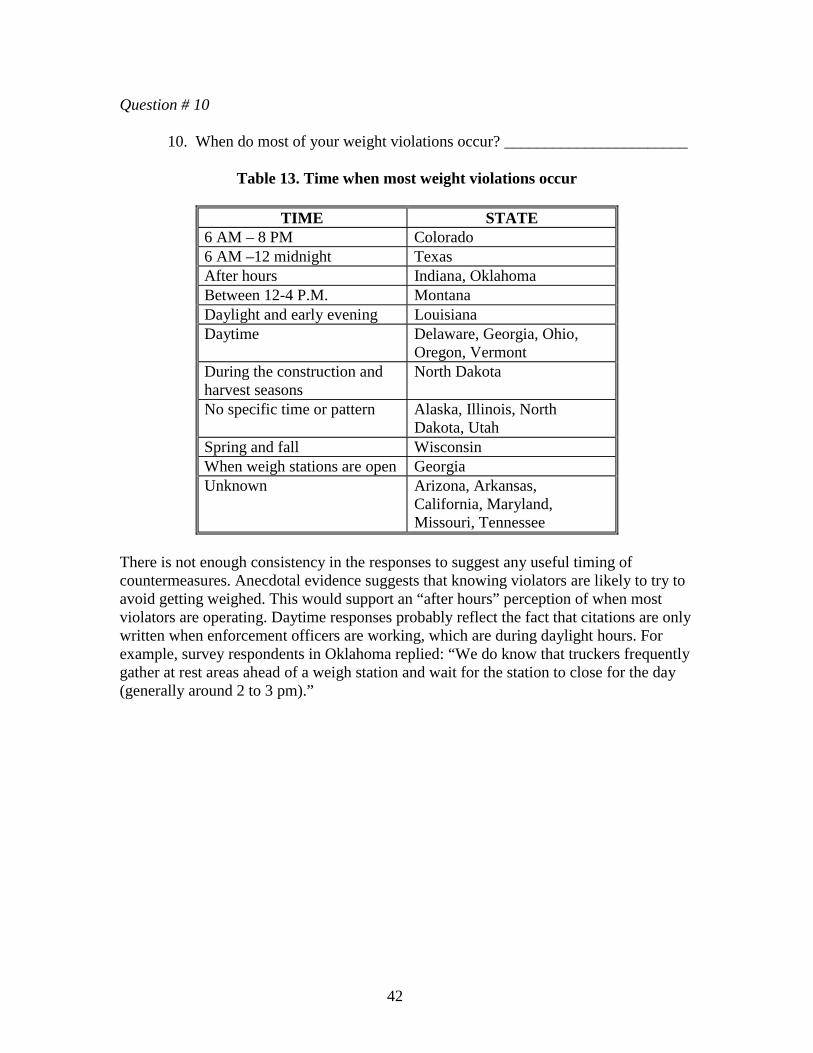
42
Question # 10 10. When do most of your weight violations occur? _______________________
Table 13. Time when most weight violations occur
TIME STATE 6 AM – 8 PM Colorado 6 AM –12 midnight Texas After hours Indiana, Oklahoma Between 12-4 P.M. Montana Daylight and early evening Louisiana Daytime Delaware, Georgia, Ohio,
Oregon, Vermont During the construction and harvest seasons
North Dakota
No specific time or pattern Alaska, Illinois, North Dakota, Utah
Spring and fall Wisconsin When weigh stations are open Georgia Unknown Arizona, Arkansas,
California, Maryland, Missouri, Tennessee
There is not enough consistency in the responses to suggest any useful timing of countermeasures. Anecdotal evidence suggests that knowing violators are likely to try to avoid getting weighed. This would support an “after hours” perception of when most violators are operating. Daytime responses probably reflect the fact that citations are only written when enforcement officers are working, which are during daylight hours. For example, survey respondents in Oklahoma replied: “We do know that truckers frequently gather at rest areas ahead of a weigh station and wait for the station to close for the day (generally around 2 to 3 pm).”
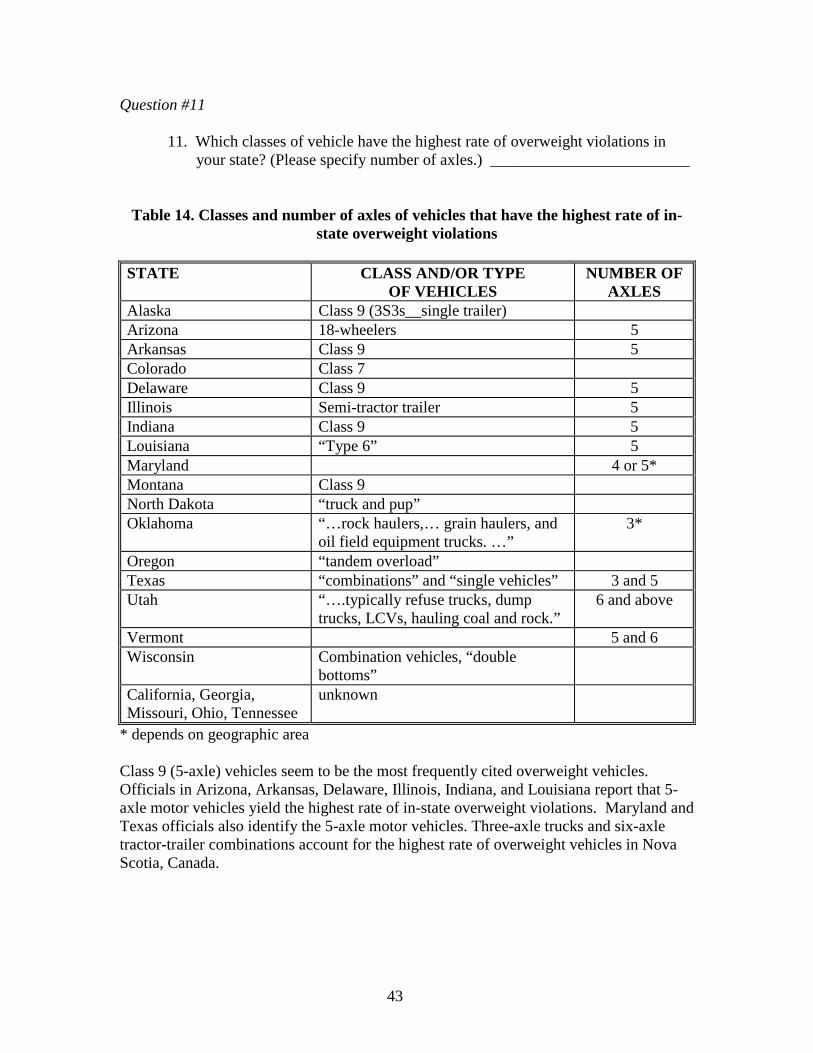
43
Question #11
11. Which classes of vehicle have the highest rate of overweight violations in your state? (Please specify number of axles.) _________________________
Table 14. Classes and number of axles of vehicles that have the highest rate of in-
state overweight violations STATE CLASS AND/OR TYPE
OF VEHICLES NUMBER OF
AXLES Alaska Class 9 (3S3s__single trailer) Arizona 18-wheelers 5 Arkansas Class 9 5 Colorado Class 7 Delaware Class 9 5 Illinois Semi-tractor trailer 5 Indiana Class 9 5 Louisiana “Type 6” 5 Maryland 4 or 5* Montana Class 9 North Dakota “truck and pup” Oklahoma “…rock haulers,… grain haulers, and
oil field equipment trucks. …” 3*
Oregon “tandem overload” Texas “combinations” and “single vehicles” 3 and 5 Utah “….typically refuse trucks, dump
trucks, LCVs, hauling coal and rock.” 6 and above
Vermont 5 and 6 Wisconsin Combination vehicles, “double
bottoms”
California, Georgia, Missouri, Ohio, Tennessee
unknown
* depends on geographic area Class 9 (5-axle) vehicles seem to be the most frequently cited overweight vehicles. Officials in Arizona, Arkansas, Delaware, Illinois, Indiana, and Louisiana report that 5-axle motor vehicles yield the highest rate of in-state overweight violations. Maryland and Texas officials also identify the 5-axle motor vehicles. Three-axle trucks and six-axle tractor-trailer combinations account for the highest rate of overweight vehicles in Nova Scotia, Canada.

44
Question #12
12. What is the ratio of overweight permits you issue to overweight vehicle violations?___________________________________________________
Table 15. Ratio of overweight permits you issue to overweight vehicle violations
STATE RATIO Alaska
2.18:1
Arizona unspecified Arkansas 11.78% (40,987 overweight permits: 3,478
violations notices being issued.) California 3.95% Colorado 1.36%; Overweight permits issued – 15,764,
Overweight violations – 11,561 Delaware unknown Georgia 60% Illinois 2.5% Indiana 2% Louisiana Overweight Permits – 84,862; Overweight Fines –
54,116; Approx. 1.6 to 1 Maryland unknown Missouri “3.22. It is unknown how many violations were
written on vehicles not permitted.” Montana 5.94% North Dakota unknown Ohio unknown Oklahoma Approximately 0.65 Oregon “For calendar year 2004, we documented 24,728
overweight violations. During the same period we issued approximately 154,000 annual and single trip permits. The ratio of violations to permits is 1:6.2.”
Tennessee unknown Utah 77.8%;
43,820 permits: 5,663 overweight citations Vermont 42.8%; 26,600 to 622 Wisconsin unknown
It is difficult to interpret these responses. For many the math is clearly incorrect. Most respondents compare permits to citations written. Of course, it seems likely that the number of violations vastly exceeds the number of citations written. In reality “unknown” is probably the only accurate answer in this list of responses.

45
Conclusions If anything is clear from these survey results, it is the fact that hard data on overweight vehicles is sorely lacking. The range of estimates for the percentage of vehicles that are overweight ranges from less than 1/2% to a high of 30%. Some perceive a serious problem. Others see no significant problem. No state was able to produce a credible estimate of the amount of damage that might be attributed to overweight vehicles. There is no coherent vision of weight enforcement that permeates the thinking of practitioners. Some enforcement personnel imagine they are weighing nearly every truck. The reality is that only a minority of trucks is likely weighed. Ports-of-entry are not consistently manned and operated. When POEs are closed in the evenings or on weekends the highways are open for overweight violators. Mobile enforcement would appear a potentially useful measure in detecting and deterring overweight vehicles. Yet, the commitment to this strategy varies greatly. Some states’ mobile units weigh millions of vehicles yearly. Others weigh just a few thousand. The damage done by overweight vehicles is insidious rather than immediately overt. Roads are long-lived assets. The increment of damage from one overweight vehicle goes unseen. Consequently, it is difficult to stimulate an effective response to counter the damage. Nonetheless, greater attention to the issue is warranted. At the very least, we need better data.

46
47
V. THE CHALLENGE OF OVERWEIGHT VEHICLE ENFORCEMENT While U.S. federal guidelines remain in place, the definition, measurement procedures, assessment, and damage quantification of overweight vehicles vary from state to state. A review of the literature supplements the ESRA survey and demonstrates that the challenges of overweight vehicle enforcement and identification are historic, complex, widespread, and costly. In 1979, the General Accounting Office (GAO) suggested that approximately 15% of all loaded trucks were overweight with respect to allowable axle loads or GVW. The GAO also cited a lack of uniformity among the U.S. states with respect to enforcement, penalties, and permit administration.68 The Federal Highway Administration (FHWA) identified various ways through which truck weight violations were adjudicated.69 The FHWA found that the judicial system did not adequately address the severe social costs associated with overweight vehicle violations. There appeared to be a lack of understanding associated with the implications of such violations. Illegally overloaded trucks were then estimated to cost taxpayers $160 to $670 million per year for pavement costs at the national level. Meanwhile, the illegally operating carriers reaped the benefits of overloading the taxpayer’s highways by gaining an unfair advantage over their honest competition through greater profit margins. They also avoided the responsibility of covering the pavement damages they created. Nevertheless, law-abiding carriers and the associations representing truckers supported the stringent enforcement of truck weight laws to eliminate the unfair advantage of illegally operating carriers. By 1987, a published questionnaire distributed to state enforcement agencies revealed that between 10% and 25% of all trucks were overloaded.70 The Transportation Research Board later recommended increased truck weight enforcement, among other things.71 Terrell and Bell reported that majority of state officials that they surveyed perceived truck overloading to be a moderate problem.72 At that that time, it was estimated that 10 - 25% of the trucks were overloaded and that 20%of the vehicles operating on federal-aid highways had axle or gross loads in excess of statutory limits. There were annual estimates of $1 billion impacts on the cost of overloaded vehicles to the federal-aid
68 General Accounting Office. 1979. Excessive Truck Weight: An Expensive Burden We Can No Longer Support. Washington, D.C.: General Accounting Office. 69 United States Federal Highway Administration. 1995. Comprehensive truck size and weight study: Summary Report for Phase I--Synthesis of Truck Size and Weight (TS&W) Studies and Issues. Available from: http://ntl.bts.gov/DOCS/cts.html 70 Terrell, R.L., C.A. Bell, Effects of Permit and Illegal Overloads on Pavements, NCHRP Synthesis 131, Transportation Research Board, 1987. 71 Transportation Research Board. 1990. Truck Weight Limits: Issues and Options. Special Report 225. 72 Terrell, R.L., C.A. Bell, Effects of Permit and Illegal Overloads on Pavements, NCHRP Synthesis 131, Transportation Research Board, 1987.
48
highway system.73 Since 1987, however, the numbers of roads, the volume of overweight truck traffic, and the costs associated with pavement damage have likely increased. Cottrell suggested that, in Virginia, the limited capacity of weigh stations plays a role in the number of trucks running the weigh stations. Avoidance rates at two weigh stations were examined. Eleven to fourteen percent of trucks were found to avoid weigh stations by using bypass routes or waiting until the weigh station closed. In addition, a portable WIM was used to measure the weight of trucks running weigh stations. Of the “run-by” trucks measured, 38% were classified as overweight.74 In 1994, it was found that approximately 25% of the motor vehicles that passed through weigh stations in Connecticut were illegally overweight and fined. Of these overweight vehicles, nearly 10% were identified as commercial solid waste haulers. Enforcement efforts were stepped up by equipping highway patrol units with portable scales.75 South Dakota enacted laws to prevent pavement damage from illegal overweight vehicles. In 1996, the Legislature restricted the maximum weight allowed on axles by ensuring that the weight on the axles fitted with single tires would not surpass the load capacity of the pavement. In 1999, the Legislature upped the graduated penalty schedule as a means to reduce both intentional and unintentional overweight violations.76 Cunagin, Mickler, and Wright examined Florida corridor and bypass enforcement activities through weight station avoidance. They found that the violation rate was significantly reduced through intense enforcement and that weekends were ripe for violations, when POEs were typically closed.77 In 1997, the State of Arizona Office of the Auditor General (OAG) recommended the “increase use of mobile enforcement crews along Arizona’s highways.” The OAG reported that MVD placed “little emphasis on intrastate enforcement.” Motor carrier tax evasion was estimated to account for between $24 million to $45 million in lost potential revenue.78
73 Terrell, R.L., C.A. Bell, Effects of Permit and Illegal Overloads on Pavements, NCHRP Synthesis 131, Transportation Research Board, 1987. 74 Cottrell, B.H., The Avoidance of Weigh Stations in Virginia by Overweight Trucks, Virginia Transportation Research Council, Charlottesville, VA, 1992. 75 Shanoff, B. 1994. Overweight Trucks Face Hefty Fines. WasteAge. Available from: http://www.wasteage.com/mag/waste_overweight_trucks_face/ 76 South Dakota Department of Transportation. 2002. SDOT Briefing: Truck Weights and Highways. 77 Cunagin, W., W. Mickler, and C. Wright. 1997. “Evasion of weight-enforcement stations by trucks.” Transportation Research Record 1570, 181- 190. 78 Norton, D. R, 1997. Performance Audit: Department of Transportation Motor Vehicle Division’s Revenue Functions, Report to the Arizona Legislature, Report No. 97-4. Phoenix: State of Arizona Office of the Auditor General. http://www.auditorgen.state.az.us/Reports/State_Agencies/Agencies/Transportation,%20Department%20of/Performance/97-04/97-4.pdf

49
The challenges of weight inspections and enforcement faced each day by MVDs and Public Safety officials were best documented in a 1999 edition of the Texas Transportation Researcher. It was reported that approximately 320 Texas Department of Public Safety troopers conducted about 85,000 weight inspections each year on more than 200,000 miles of Texas highways. Dan Middleton, manager of Texas Transportation Institute System Monitoring Program, noted that “This equates to one trooper for every 45 million vehicle-miles traveled by truck in the state — a number far too small to catch every violator…. We need a system to screen trucks in the traffic stream and identify those that have a high likelihood of being overweight… and need to be weighed statically.”79 A steady increase in truck traffic, attributed to the North American Free Trade Agreement (NAFTA), results in more than $60 billion of freight — about 70% of the total dollar value of trucking freight in the U.S. — crossing the Texas-Mexico border.80 Although truck weights and standards comprise a part of the NAFTA plan, they do not include any provisions to raise U.S. federal or state truck size and weight limits. NAFTA does, however, lay the groundwork for Canada, Mexico, and the USA to devise compatible standards. Canada and Mexico may have longer sizes and heavier limits on their trucks. Rusfolo, et al. conducted an analysis of the weight-mile tax in Oregon to determine whether the tax influenced changes in vehicle weight or configuration that would result in decreased pavement damage. A review of the Oregon Highway User Database showed that a significant portion of mileage for the heaviest vehicles (GVW over 80,000 pounds) was reported incorrectly and was not reliable. The data were not considered conclusive and no changes could be attributed to the weight-mile tax.81 A recent sweep of waste trucks in Pennsylvania yielded 40 citations for overweight vehicles. These constituted about 10% of the waste trucks that were identified by Pennsylvania State Police.82 The Maryland State Highway Administration reports that in Maryland, there are 12 fixed Truck Weigh and Inspection Stations and seven pull-off locations. Mobile enforcement crews serve these pull-off locations. There are 22 roving enforcement teams that patrol Maryland highways. These crews enforce Federal Motor Carrier Safety Regulations and canvass the highways for those who avoid the scales.83 Two new WIM systems increased the number of vehicles weighed in Maryland by 57% in 2003. This amounted to a slight increase in the $8.5 million in fees collected through 79 Middleton, D. 1999. Keeping overweight trucks from getting a-weigh, Texas Transportation Researcher, 35:(3), 1-2. 80 Ibid. 81 Rufolo, Anthony, Lois Bronfman, Eric Kuhner, Effect of Weight-Mile Tax on Road Damage in Oregon, Oregon Department of Transportation Research Group, September 1999. 82 Pennsylvania Department of Environmental Protection. 2002. State Solid Waste Plan. Available from: http://www.dep.state.pa.us/dep/subject/advcoun/solidwst/2003/Draft_Chapter3_Municipal%20Waste.pdf 83 Maryland State Highway Administration, Office of Traffic and Safety, Motor Carrier Division. 2003. 2003 Annual Report: Maryland Motor Carrier Program.

50
oversize/overweight permits each year. A review of the data of weight enforcement activities from 1998 to 2003 shows that more vehicles are weighed on fixed scales than on WIMs. However, with the addition of two new WIMs in strategic locations, not only is there a dramatic increase in the number of vehicles weighed on WIMs, but also a difference of nearly 10,000 vehicles weighed between the static and the WIM scales. Additionally, an Automated Hauling Permit System is used for permit issuance. This not only involves a smaller staff to operate, but it also provides a faster turnaround time for permit applications.84 In Maryland, trucks deliver nearly 81% of all manufactured freight. They are vital to the economy because they can “access 92% of the state’s communities without special accommodation.”85 In North Carolina, in 2005, “…. more than 100 vacancies in the ranks of weight enforcement officers and the patrol's lack of emphasis on catching overweight trucks”86 halved the overweight truck citations in the span of 5 years. Legislators responded by earmarking monies to the North Carolina Highway Patrol to increase the number of weight enforcement officers and improve its activities. Another challenge for law enforcement officers is the presence of large trucks on roads other than highways. Large trucks are already a hot button in some residential communities. In Tucson, Arizona, for example, an increase in pollution, noise, and pavement damage led Rincon Valley residents to petition to limit the size of trucks on the streets to those with a 3/4-ton rear-axle load capacity. While Pima County officials review the policy of imposing a strict weight limit on residential streets, they are unable to enforce it because there are no scales and roving weight enforcement officers on the beat in residential communities in Tucson.87 Other cities across Arizona and the U.S. face similar obstacles as the volume of traffic escalates over the next 50 years and spills from the highways and unto the residential roads. ESRA obtained data on ratios of total overweight permits issued and overweight vehicle violations to heavy truck traffic (see Tables 16 and 17). All data, for the year 2003, were obtained through the DOT/FHWA websites. The permits include the total “number of overweight permits issued by States for non-divisible and divisible single trip load movements, non-divisible and divisible annual (or multiple use) load movements, and for divisible over-width load movements.”88 According to the DOT/FHWA, the state weight violations include the total “number of trucks cited or issued civil assessments by the
84 Maryland State Highway Administration, Office of Traffic and Safety, Motor Carrier Division. 2003. 2003 Annual Report: Maryland Motor Carrier Program. 85 Ibid. 86 Stith, P. 2005. “Troopers ticketing more heavy trucks.” The News and Observer. Published 17 August 2005. Available from: < http://newsobserver.com/news/story/2728787p-9166402c.html> 87 Ellis, T. 2004. “Big trucks an issue on residential streets.” Arizona Daily Star. Published 5 June 2004. Available from: <http://www.azstarnet.com/dailystar/relatedarticles/24949.php> 88 United States Department of Transportation, Federal Highway Administration. 2005. Freight Management and Operations: Permit Facts and Figures FY 2003. Available from: http://ops.fhwa.dot.gov/freight/sw/permit_report.htm
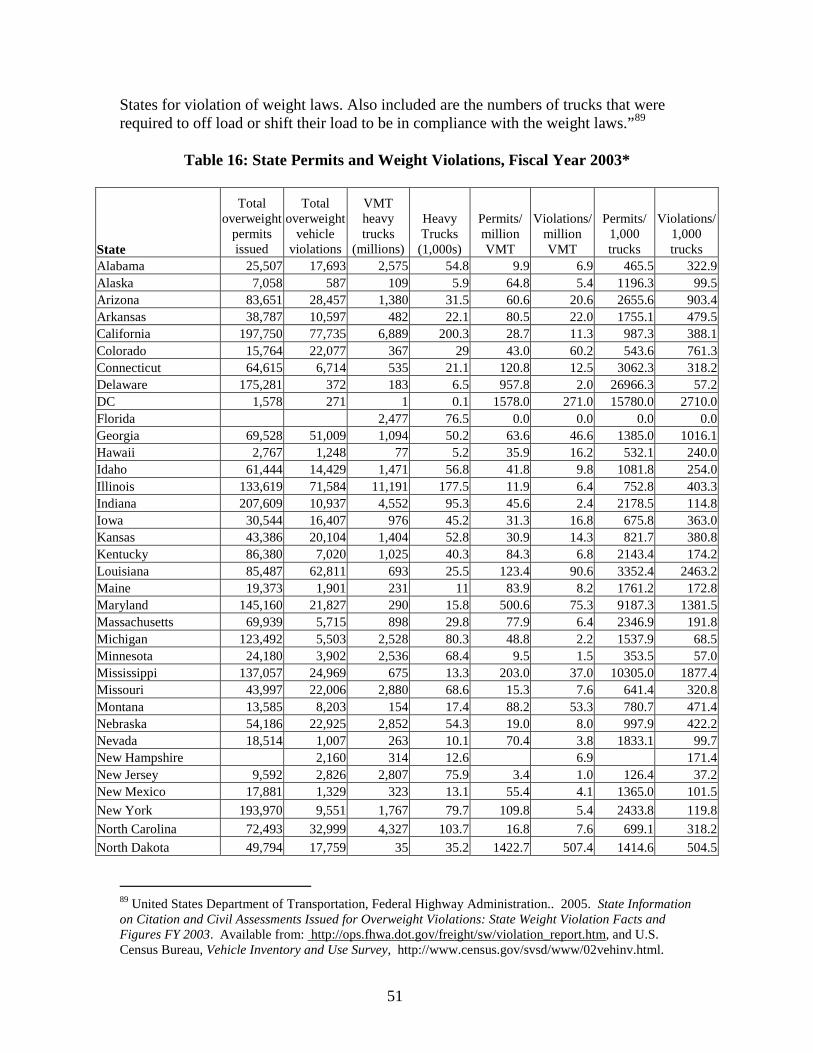
51
States for violation of weight laws. Also included are the numbers of trucks that were required to off load or shift their load to be in compliance with the weight laws.”89
Table 16: State Permits and Weight Violations, Fiscal Year 2003*
State
Total overweight
permits issued
Total overweight
vehicle violations
VMT heavy trucks
(millions)
Heavy Trucks
(1,000s)
Permits/ million VMT
Violations/ million VMT
Permits/ 1,000 trucks
Violations/ 1,000 trucks
Alabama 25,507 17,693 2,575 54.8 9.9 6.9 465.5 322.9Alaska 7,058 587 109 5.9 64.8 5.4 1196.3 99.5Arizona 83,651 28,457 1,380 31.5 60.6 20.6 2655.6 903.4Arkansas 38,787 10,597 482 22.1 80.5 22.0 1755.1 479.5California 197,750 77,735 6,889 200.3 28.7 11.3 987.3 388.1Colorado 15,764 22,077 367 29 43.0 60.2 543.6 761.3Connecticut 64,615 6,714 535 21.1 120.8 12.5 3062.3 318.2Delaware 175,281 372 183 6.5 957.8 2.0 26966.3 57.2DC 1,578 271 1 0.1 1578.0 271.0 15780.0 2710.0Florida 2,477 76.5 0.0 0.0 0.0 0.0Georgia 69,528 51,009 1,094 50.2 63.6 46.6 1385.0 1016.1Hawaii 2,767 1,248 77 5.2 35.9 16.2 532.1 240.0Idaho 61,444 14,429 1,471 56.8 41.8 9.8 1081.8 254.0Illinois 133,619 71,584 11,191 177.5 11.9 6.4 752.8 403.3Indiana 207,609 10,937 4,552 95.3 45.6 2.4 2178.5 114.8Iowa 30,544 16,407 976 45.2 31.3 16.8 675.8 363.0Kansas 43,386 20,104 1,404 52.8 30.9 14.3 821.7 380.8Kentucky 86,380 7,020 1,025 40.3 84.3 6.8 2143.4 174.2Louisiana 85,487 62,811 693 25.5 123.4 90.6 3352.4 2463.2Maine 19,373 1,901 231 11 83.9 8.2 1761.2 172.8Maryland 145,160 21,827 290 15.8 500.6 75.3 9187.3 1381.5Massachusetts 69,939 5,715 898 29.8 77.9 6.4 2346.9 191.8Michigan 123,492 5,503 2,528 80.3 48.8 2.2 1537.9 68.5Minnesota 24,180 3,902 2,536 68.4 9.5 1.5 353.5 57.0Mississippi 137,057 24,969 675 13.3 203.0 37.0 10305.0 1877.4Missouri 43,997 22,006 2,880 68.6 15.3 7.6 641.4 320.8Montana 13,585 8,203 154 17.4 88.2 53.3 780.7 471.4Nebraska 54,186 22,925 2,852 54.3 19.0 8.0 997.9 422.2Nevada 18,514 1,007 263 10.1 70.4 3.8 1833.1 99.7New Hampshire 2,160 314 12.6 6.9 171.4New Jersey 9,592 2,826 2,807 75.9 3.4 1.0 126.4 37.2New Mexico 17,881 1,329 323 13.1 55.4 4.1 1365.0 101.5New York 193,970 9,551 1,767 79.7 109.8 5.4 2433.8 119.8North Carolina 72,493 32,999 4,327 103.7 16.8 7.6 699.1 318.2North Dakota 49,794 17,759 35 35.2 1422.7 507.4 1414.6 504.5
89 United States Department of Transportation, Federal Highway Administration.. 2005. State Information on Citation and Civil Assessments Issued for Overweight Violations: State Weight Violation Facts and Figures FY 2003. Available from: http://ops.fhwa.dot.gov/freight/sw/violation_report.htm, and U.S. Census Bureau, Vehicle Inventory and Use Survey, http://www.census.gov/svsd/www/02vehinv.html.
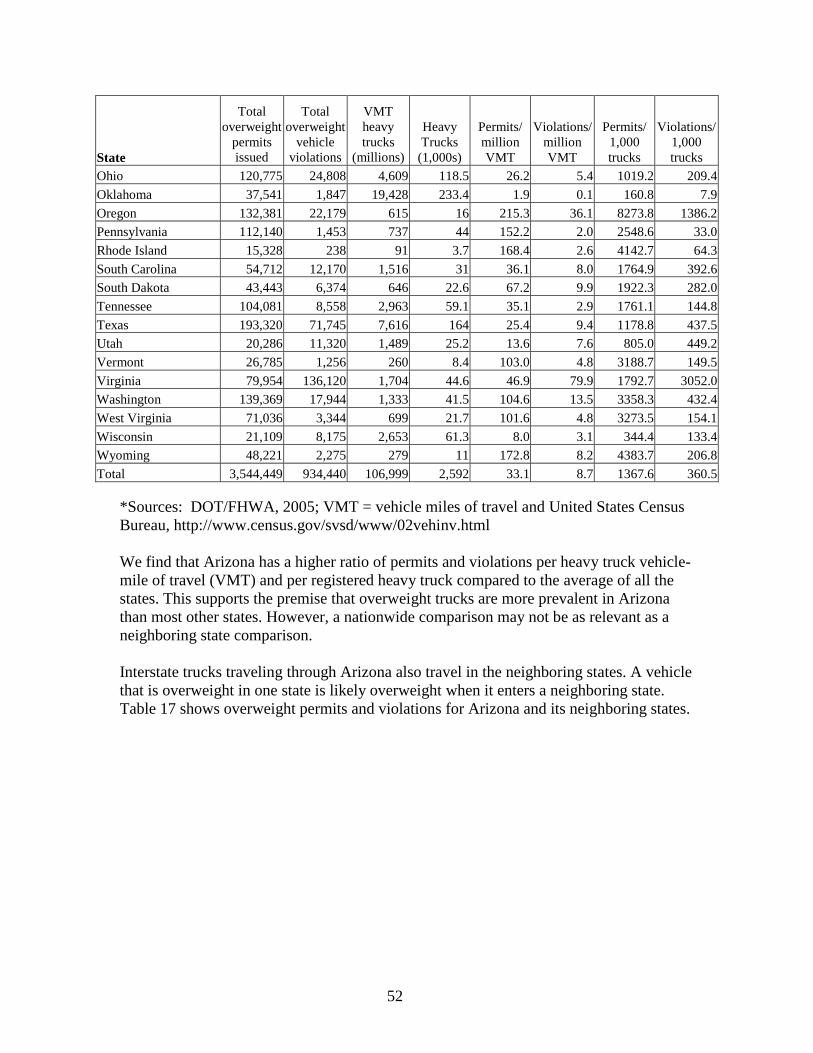
52
State
Total overweight
permits issued
Total overweight
vehicle violations
VMT heavy trucks
(millions)
Heavy Trucks
(1,000s)
Permits/ million VMT
Violations/ million VMT
Permits/ 1,000 trucks
Violations/ 1,000 trucks
Ohio 120,775 24,808 4,609 118.5 26.2 5.4 1019.2 209.4Oklahoma 37,541 1,847 19,428 233.4 1.9 0.1 160.8 7.9Oregon 132,381 22,179 615 16 215.3 36.1 8273.8 1386.2Pennsylvania 112,140 1,453 737 44 152.2 2.0 2548.6 33.0Rhode Island 15,328 238 91 3.7 168.4 2.6 4142.7 64.3South Carolina 54,712 12,170 1,516 31 36.1 8.0 1764.9 392.6South Dakota 43,443 6,374 646 22.6 67.2 9.9 1922.3 282.0Tennessee 104,081 8,558 2,963 59.1 35.1 2.9 1761.1 144.8Texas 193,320 71,745 7,616 164 25.4 9.4 1178.8 437.5Utah 20,286 11,320 1,489 25.2 13.6 7.6 805.0 449.2Vermont 26,785 1,256 260 8.4 103.0 4.8 3188.7 149.5Virginia 79,954 136,120 1,704 44.6 46.9 79.9 1792.7 3052.0Washington 139,369 17,944 1,333 41.5 104.6 13.5 3358.3 432.4West Virginia 71,036 3,344 699 21.7 101.6 4.8 3273.5 154.1Wisconsin 21,109 8,175 2,653 61.3 8.0 3.1 344.4 133.4Wyoming 48,221 2,275 279 11 172.8 8.2 4383.7 206.8Total 3,544,449 934,440 106,999 2,592 33.1 8.7 1367.6 360.5
*Sources: DOT/FHWA, 2005; VMT = vehicle miles of travel and United States Census Bureau, http://www.census.gov/svsd/www/02vehinv.html We find that Arizona has a higher ratio of permits and violations per heavy truck vehicle-mile of travel (VMT) and per registered heavy truck compared to the average of all the states. This supports the premise that overweight trucks are more prevalent in Arizona than most other states. However, a nationwide comparison may not be as relevant as a neighboring state comparison. Interstate trucks traveling through Arizona also travel in the neighboring states. A vehicle that is overweight in one state is likely overweight when it enters a neighboring state. Table 17 shows overweight permits and violations for Arizona and its neighboring states.
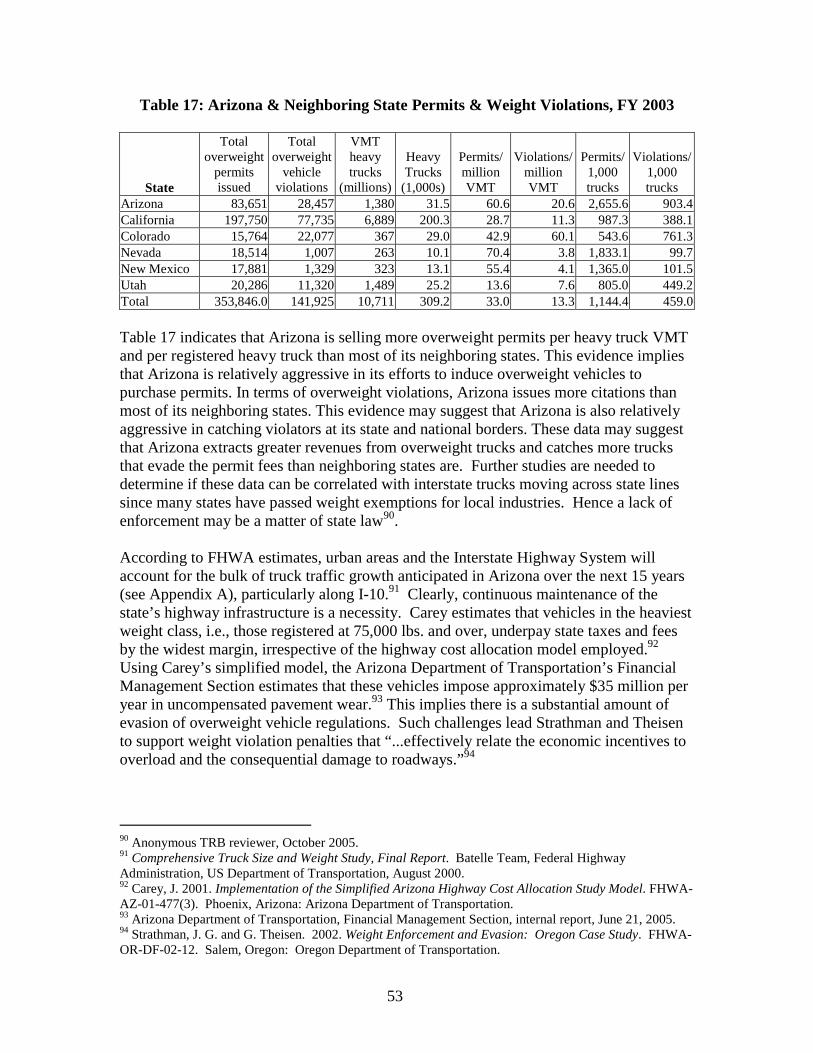
53
Table 17: Arizona & Neighboring State Permits & Weight Violations, FY 2003
State
Total overweight
permits issued
Total overweight
vehicle violations
VMT heavy trucks
(millions)
Heavy Trucks
(1,000s)
Permits/ million VMT
Violations/ million VMT
Permits/ 1,000 trucks
Violations/ 1,000 trucks
Arizona 83,651 28,457 1,380 31.5 60.6 20.6 2,655.6 903.4California 197,750 77,735 6,889 200.3 28.7 11.3 987.3 388.1Colorado 15,764 22,077 367 29.0 42.9 60.1 543.6 761.3Nevada 18,514 1,007 263 10.1 70.4 3.8 1,833.1 99.7New Mexico 17,881 1,329 323 13.1 55.4 4.1 1,365.0 101.5Utah 20,286 11,320 1,489 25.2 13.6 7.6 805.0 449.2Total 353,846.0 141,925 10,711 309.2 33.0 13.3 1,144.4 459.0 Table 17 indicates that Arizona is selling more overweight permits per heavy truck VMT and per registered heavy truck than most of its neighboring states. This evidence implies that Arizona is relatively aggressive in its efforts to induce overweight vehicles to purchase permits. In terms of overweight violations, Arizona issues more citations than most of its neighboring states. This evidence may suggest that Arizona is also relatively aggressive in catching violators at its state and national borders. These data may suggest that Arizona extracts greater revenues from overweight trucks and catches more trucks that evade the permit fees than neighboring states are. Further studies are needed to determine if these data can be correlated with interstate trucks moving across state lines since many states have passed weight exemptions for local industries. Hence a lack of enforcement may be a matter of state law90. According to FHWA estimates, urban areas and the Interstate Highway System will account for the bulk of truck traffic growth anticipated in Arizona over the next 15 years (see Appendix A), particularly along I-10.91 Clearly, continuous maintenance of the state’s highway infrastructure is a necessity. Carey estimates that vehicles in the heaviest weight class, i.e., those registered at 75,000 lbs. and over, underpay state taxes and fees by the widest margin, irrespective of the highway cost allocation model employed.92 Using Carey’s simplified model, the Arizona Department of Transportation’s Financial Management Section estimates that these vehicles impose approximately $35 million per year in uncompensated pavement wear.93 This implies there is a substantial amount of evasion of overweight vehicle regulations. Such challenges lead Strathman and Theisen to support weight violation penalties that “...effectively relate the economic incentives to overload and the consequential damage to roadways.”94
90 Anonymous TRB reviewer, October 2005. 91 Comprehensive Truck Size and Weight Study, Final Report. Batelle Team, Federal Highway Administration, US Department of Transportation, August 2000. 92 Carey, J. 2001. Implementation of the Simplified Arizona Highway Cost Allocation Study Model. FHWA-AZ-01-477(3). Phoenix, Arizona: Arizona Department of Transportation. 93 Arizona Department of Transportation, Financial Management Section, internal report, June 21, 2005. 94 Strathman, J. G. and G. Theisen. 2002. Weight Enforcement and Evasion: Oregon Case Study. FHWA-OR-DF-02-12. Salem, Oregon: Oregon Department of Transportation.

54
55
VI. PAVEMENT DAMAGE ESTIMATION Initially, ESRA pored over WIM data collected over several years across different Arizona ports. This data was to be used to try to quantify the pavement damages associated with overweight vehicles. However, it quickly became clear that this data would be inadequate as a basis for making a pavement damage estimate. Despite numerous years of sampling, the data available was sparse and inconsistent. Only six sites had data for even a 5-year span. In most cases, descriptive information was unavailable--not only in Arizona, but elsewhere, as well, including those states equipped with even more staff and sophisticated technologies. A literature review revealed that a lack of automated and accurate traffic data precludes modifications of policies, analyses, and procedures. The TRB reported that they and others encountered difficulties when seeking to obtain information about the costs and benefits of truck transportation and the impacts of the size and weight regulations. Such shortcomings, the TRB noted, “hindered its effort to provide useful policy advice.”95 Therefore, it was necessary for us to develop other means for making an estimate of the cost of damage due to overweight vehicles. As a start, we obtained estimates of the total cost of heavy vehicle use of the highways. One of these estimates came from the ADOT Highway Cost Allocation Model employed by the ADOT Financial Management Services Section. This model, which estimates vehicle cost responsibility, indicated that, at present, heavy vehicles account for about $170 million per year in planned state highway expenditures.96 State highway expenditures, though, represented only one-fourth of total outlays for roads in Arizona. Local government expenditures accounted for the other three-fourths of total outlays.97 The share of expenses due to heavy vehicles for roadways under the jurisdiction of local governments is far smaller than it is for state highways. Most of the heavy vehicle miles of travel are on state highways. Relatively few of the miles are on other roads and streets. Consequently, the estimated amount of local government roadway expenditures attributable to heavy vehicles is probably about one-fourth as large as it is for state highways. This would amount to around $40 million per year. So, in terms of what is actually spent on roadways, heavy vehicles accounted for around $210 million per year. Some would contend that planned expenditures might understate the real cost of serving heavy vehicles. Pavement damage is insidious and incremental. Preservation efforts may be deferred or deemed inadequate to keep pace with actual wear. The USDOT estimates that nationwide, between 2001 and 2020, the cost to maintain pavements at the current level of service will amount to around $600 billion (exclusive of bridge-related
95 Transportation Research Board. 2002. Regulation of Weights, Lengths, and Widths of Commercial Motor Vehicles -- Special Report 267. Washington, DC: The National Academies Press. 96 Arizona Department of Transportation, Financial Management Section, internal report, June 21, 2005. 97 Highway Statistics. 2003 (Federal Highway Administration), Table LGF-2.

56
expenditures).98 Annualized, this comes to $30 billion per year. Based on traffic, Arizona’s share of this anticipated cost would be around 1.4%99 or about $420 million per year. The annual costs of $210 million to $420 million estimated above are for all commercial vehicles. The share of roadway costs attributable to the heaviest vehicles (those 75,000 lbs. or more) is about 75% of the total.100 This would bring the range of costs incurred from the heaviest vehicles to between $155 million and $315 million per year. Costs are partially offset by revenues from these heaviest vehicles amounting to around $90 million per year.101 This means there is a shortfall of revenues compared to the expenses incurred to provide roadways for these vehicles. Based on the estimates made here, the shortfall would range between $65 million and $225 million per year. This shortfall applies to all commercial vehicles over 75,000 lbs. The shortfall that is attributable to overweight vehicles is a share of this total. To estimate the share of the revenue shortfall that is allocated to overweight vehicles, we must estimate the percentage of commercial vehicles that are overweight and the added impact on pavement consumption caused by the excess weight. Since operating overweight vehicles without a permit is illegal, information on its extent is hard to come by. Violators work diligently to conceal their activities. Only a tiny fraction of violations are detected and punished. Consequently, estimates of the extent of illegal activities are prone to wide ranges of error. Published estimates of the percentage of commercial vehicles that might exceed weight limits vary widely. A brief recapitulation of these estimates reported in this study is shown in Table 18.
98 United State Department of Transportation. 2002. 2002 Status of the Nation's Highways, Bridges, and Transit: Conditions & Performance Report to Congress. Washington, DC: United State Department of Transportation, Federal Highway Administration. 99 Highway Statistics. 2003 (Federal Highway Administration), Table HM-81. 100 Arizona Department of Transportation, Financial Management Section, internal report, June 21, 2005. 101 Ibid.
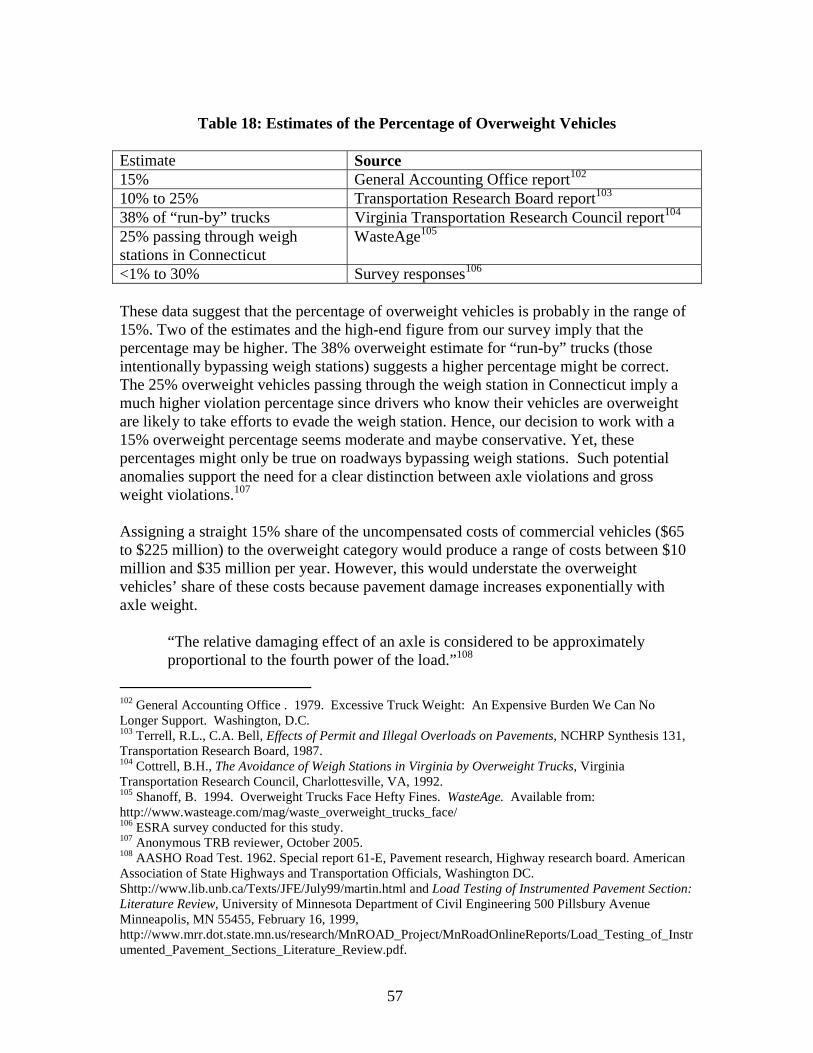
57
Table 18: Estimates of the Percentage of Overweight Vehicles
Estimate Source 15% General Accounting Office report102 10% to 25% Transportation Research Board report103 38% of “run-by” trucks Virginia Transportation Research Council report104 25% passing through weigh stations in Connecticut
WasteAge105
<1% to 30% Survey responses106 These data suggest that the percentage of overweight vehicles is probably in the range of 15%. Two of the estimates and the high-end figure from our survey imply that the percentage may be higher. The 38% overweight estimate for “run-by” trucks (those intentionally bypassing weigh stations) suggests a higher percentage might be correct. The 25% overweight vehicles passing through the weigh station in Connecticut imply a much higher violation percentage since drivers who know their vehicles are overweight are likely to take efforts to evade the weigh station. Hence, our decision to work with a 15% overweight percentage seems moderate and maybe conservative. Yet, these percentages might only be true on roadways bypassing weigh stations. Such potential anomalies support the need for a clear distinction between axle violations and gross weight violations.107 Assigning a straight 15% share of the uncompensated costs of commercial vehicles ($65 to $225 million) to the overweight category would produce a range of costs between $10 million and $35 million per year. However, this would understate the overweight vehicles’ share of these costs because pavement damage increases exponentially with axle weight.
“The relative damaging effect of an axle is considered to be approximately proportional to the fourth power of the load.”108
102 General Accounting Office . 1979. Excessive Truck Weight: An Expensive Burden We Can No Longer Support. Washington, D.C. 103 Terrell, R.L., C.A. Bell, Effects of Permit and Illegal Overloads on Pavements, NCHRP Synthesis 131, Transportation Research Board, 1987. 104 Cottrell, B.H., The Avoidance of Weigh Stations in Virginia by Overweight Trucks, Virginia Transportation Research Council, Charlottesville, VA, 1992. 105 Shanoff, B. 1994. Overweight Trucks Face Hefty Fines. WasteAge. Available from: http://www.wasteage.com/mag/waste_overweight_trucks_face/ 106 ESRA survey conducted for this study. 107 Anonymous TRB reviewer, October 2005. 108 AASHO Road Test. 1962. Special report 61-E, Pavement research, Highway research board. American Association of State Highways and Transportation Officials, Washington DC. Shttp://www.lib.unb.ca/Texts/JFE/July99/martin.html and Load Testing of Instrumented Pavement Section: Literature Review, University of Minnesota Department of Civil Engineering 500 Pillsbury Avenue Minneapolis, MN 55455, February 16, 1999, http://www.mrr.dot.state.mn.us/research/MnROAD_Project/MnRoadOnlineReports/Load_Testing_of_Instrumented_Pavement_Sections_Literature_Review.pdf.
58
“Damage done by a given vehicle increases roughly with the fourth power of its weight. Put another way, if you double the weight of a vehicle, then the damage it does gets doubled four times. This means that double the weight causes 16 times the damage.”109
The North Dakota Highway Patrol weighs 1,000 trucks per year and reports that 50% of these trucks are overweight and that the range of excess weight falls between 3,000 and 8,000 lbs.110 Since the tractor unit normally accounts for about 18,000 lbs., this range implies that, on a total weight basis, overweight trucks are 5% to 13% over the legal load limit. However, for pavement damage purposes it is the axle weight that is most critical. The 3,000 to 8,000 lbs. needs to be distributed over the load-bearing axles of the trailer. The range of over-weight would be about 4.5% to 12% per axle if the over-weight is distributed between two tandem axles (two side-by-side axles, each with four wheels). Using the 4.5% figure and the fourth-power exponential (1.0454) would give us an overweight vehicle share of between $12 million and $40 million per year. Each overweight vehicle would exert about 19% more damage than a truck operating at the 80,000 lb. legal limit. Thus, the overweight vehicle share of the costs should be 19% higher than it would be if the vehicle were operating at the legal limit. Using the 12% figure and the fourth-power exponential (1.124) would give us an overweight vehicle share of between $15 million and $53 million per year. Each overweight vehicle would exert about 57% more damage than a truck operating at the 80,000 lb. legal limit. Thus, the overweight vehicle share of the costs should be 57% higher than it would be if the vehicle were operating at the legal limit. Thus, our best guess is that overweight vehicles impose somewhere between $12 million and $53 million per year in uncompensated damages to Arizona roadways.111 Arizona currently budgets about $5.8 million per year for mobile enforcement efforts aimed at, among other things, penalizing and deterring overweight vehicle operations. If a doubling of the mobile enforcement budget were 50% effective toward the objective of eliminating overweight vehicles from Arizona roadways, the savings from avoided pavement damage would range from $6 million to $27 million per year. At the lower figure, the expansion of mobile enforcement would be a little better than a “break-even” proposition. The savings from avoided pavement damage would slightly exceed the cost of the program. Any safety gains from detecting and taking out-of-service vehicles with safety deficiencies would come on top of the pavement damage avoidance gains. At the higher figure, the expansion of mobile enforcement would have between a four- or five-to-one benefit/cost ratio. That is, for every $1 invested in motor carrier enforcement there would be $4.50 in pavement damage avoided. 109 Ask A Scientist, Engineering Archive, http://www.newton.dep.anl.gov/newton/askasci/1995/eng/ENG35.HTM 110 ESRA survey conducted for this study. 111 The ESRA SPDETM, a model independently developed and tested by ESRA Consulting Corporation, estimated pavement damage for overweight vehicles in Arizona at approximately $27,500,000. For more information about this model contact Sandy H. Straus, ESRA Consulting Corporation, 1650 South Dixie Highway, Third Floor, Boca Raton, Florida 33432, Telephone: 561-361-0004, e-mail: [email protected].
59
VII. CONCLUSIONS As we look to the future, it may be necessary to consider the increase of penalties associated with overweight vehicles or to modify the federal standards governing the definition of overweight vehicles. Overweight trucks, whether legal or illegal, all contribute to highway pavement fatigue. Our findings are, generally, in agreement with those reported by the State of Arizona Office of the Auditor General in 1997.112 Our survey reveals that the challenges of overweight vehicle identification and enforcement are prevalent not only in the State of Arizona, but also in many other U.S. States. Approximately nine roving enforcement agents now patrol nearly 113,642 square miles of Arizona land area. Arizona ranks as the sixth largest U.S. state.113 As of August 2005, Governor Napolitano of Arizona and Governor Bill Richardson of New Mexico declared their borders with Mexico as a state of emergency due to the lawlessness that exists at these borders.114 In an effort to improve security, increased funding for the MVD mobile enforcement unit would appear a potentially worthwhile investment. We recommend a uniform system of weighing, recording, and reporting data in an automated, national, and international database. Ideally, such a system could also be linked through driver’s licenses as recommended by Straus.115 Remote methods of data collection are also encouraged. These techniques would not only be an asset in intrastate travel, but also in interstate travel. In light of the recent terrorist attacks on U.S. soil and security concerns across the U.S. borders, such systems may not only equate to more effective monitoring tools of overweight vehicles, but serve the dual purpose of providing some added safety and security benefits. An automated system would also allow the MVD and other interstate, intrastate, and international government agencies to track overweight vehicles, monitor suspicious activity, and recover funds associated with violators. Such recommendations support and expand upon earlier direction by GIS/Trans et al.116and the Arizona Legislature’s SPAR Report.117
112 Norton, D. R, 1997. Performance Audit: Department of Transportation Motor Vehicle Division’s Revenue Functions, Report to the Arizona Legislature, Report No. 97-4. Phoenix: State of Arizona Office of the Auditor General. http://www.auditorgen.state.az.us/Reports/State_Agencies/Agencies/Transportation,%20Department%20of/Performance/97-04/97-4.pdf 113 NETSTATE.COM. Arizona: The Geography of Arizona. <Available from: http://www.netstate.com/states/geography/az_geography.htm> Accessed 12 August 2005. 114 Carroll, S. and D. González. 2005. “Napolitano taps disaster funds for border counties.” In The Arizona Republic, Online Print Edition, August 16, 2005 12:00 AM. Available from < http://www.azcentral.com/arizonarepublic/news/articles/0816borderemergency16.html> 115Straus, S. H. 2005. New, Improved, Comprehensive, and Automated Driver’s License Test and Vision Screening System. FHWA-AZ-04-559(1). Phoenix, Arizona: Arizona Department of Transportation. 116 GIS/Trans. Ltd., Lima and Associates, and Transportation Research and Analysis, Inc. 2001. Enhancing Arizona Department of Transportation’s Traffic Data Resource. Final Report 492. Phoenix: Arizona Department of Transportation.
60
Since Arizona now demonstrates the highest percentage increase (78%) in truck travel in America,118 the construction of designated truck lanes on Arizona highways should be considered. These truck-only lanes may also be fitted with special sensors to remotely detect the presence of overweight vehicles. Such lanes would also aid mobile enforcement officials who are now understaffed and under equipped to manage such increases in truck transport. However, policy reforms by the state and federal government are needed to launch studies, development, and implementation of these unique truck lanes. In the meantime, since it may take a very long time for these recommendations to reach the implementation stage, it may be beneficial to designate some exiting lanes as special truck lanes in areas where the traffic is heaviest. Such lanes may be equipped with the special sensors prescribed above. On a pilot basis, these may aid in the development of additional truck lanes and the distribution of these sensors in areas most susceptible to pavement damage. We also recommend a study on which types of vehicles (e.g., car carriers, garbage dump trucks, rock haulers, etc.) are subject to the most overweight violations. This way, mobile enforcement crews can target or clamp down on vehicles more likely to be in violation of weight limits. Through quantification of damage to the Arizona highways, we may now plan operational and maintenance strategies for potential investment assessments. Arizona highways serve as a vital mode of freight shipments. Highway freight hauling contributes over $250 billion to the economy each year.119 More funds need to be appropriated toward mobile enforcement staff and technology to meet the demands of a state facing rapid growth120 and highway transportation. Overweight vehicle enforcement merits improvement for effective monitoring and ticketing strategies to increase pavement design maintenance and life.
117 Arizona Department of Transportation. 1999. Arizona Ports of Entry: Arizona Department of Transportation JLBC/OSPB Joint SPAR Report, 2000 Strategic Program Area Review (available from: http://www.azleg.state.az.us/jlbc/ports.pdf) 118 The Road Information Program. 2004. America’s Rolling Warehouses: The impact of increased trucking on economic development, congestion, and traffic safety. http://www.tripnet.org/TruckingReport020904.PDF 119 National Transportation Statistics 2004. Bureau of Transportation Statistics. http://www.bts.gov/publications/national_transportation_statistics/2004/index.html 120 Straus, S. H. 2005. New, Improved, Comprehensive, and Automated Driver’s License Test and Vision Screening System. FHWA-AZ-04-559(1). Phoenix, Arizona: Arizona Department of Transportation.

61
REFERENCES AASHO Road Test. 1962. Special report 61-E, Pavement research, Highway research board. American Association of State Highways and Transportation Officials, Washington DC. Shttp://www.lib.unb.ca/Texts/JFE/July99/martin.html
American Concrete Pavement Association. 2005. http://www.pavement.com/
American Petroleum Institute. 2004. Policy Analysis and Statistics. “Nationwide and State-by-State Motor Fuel Taxes,” November 2004. Available from: http://api-ec.api.org/filelibrary/Gas%20tax%20November%202004%20Final.pdf
American Society for Testing and Materials. 1994. Standard Specification for Highway Weigh-in-Motion (WIM) Systems with User Requirements and Test Method. ASTM Committee E-17 on Vehicle-Pavement Systems. ASTM Designation E 1318-94.
Arizona Department of Transportation, Financial Management Section, internal report, June 21, 2005.
Arizona Department of Transportation, Motor Vehicle Division. 2005. Commercial Vehicle Enforcement. Available from: http://www.azdot.gov/mvd/faqs/scripts/faqs.asp?section=cp#4
Arizona Department of Transportation. 1999. Arizona Ports of Entry: Arizona Department of Transportation JLBC/OSPB Joint SPAR Report, 2000 Strategic Program Area Review (available from: http://www.azleg.state.az.us/jlbc/ports.pdf)
Arizona Ports of Entry: Arizona Department of Transportation JLBC/OSPB Joint SPAR Report, 2000 Strategic Program Area Review (available from: http://www.azleg.state.az.us/jlbc/ports.pdf
Arizona State Legislature. 2005. The Arizona Revised Statutes , 28-1100. Vehicles and loads; gross weight restrictions; exception. 46th Legislature, 2nd regular session.
Arizona Transportation Planning Division. 2003. 2002 Arizona Transportation Factbook: Transportation Relevant Statistical Information. Phoenix: Arizona Department of Transportation. http://tpd.az.gov/reports/pdf/2002factbook.pdf
Ask A Scientist, Engineering Archive, http://www.newton.dep.anl.gov/newton/askasci/1995/eng/ENG35.HTM
Average Annual Daily Traffic, Arizona Department of Transportation, Transportation Planning Division, Data Team. http://tpd.azdot.gov/datateam/aadtinfo.php
California Department of Transportation (CALTRANS). 2004. “Truck-Only Lanes.” CALTRANS: Traffic Operations Program, Office of Truck Services. May 24, 2004. < http://www.dot.ca.gov/hq/traffops/trucks/trucksize/fs-trucklanes.htm>
62
Carey, J. 2001. Implementation of the Simplified Arizona Highway Cost Allocation Study Model. FHWA-AZ-01-477(3). Phoenix, Arizona: Arizona Department of Transportation.
Carroll, S. and D. González. 2005. “Napolitano taps disaster funds for border counties.” In The Arizona Republic, Online Print Edition, August 16, 2005 12:00 AM. Available from <http://www.azcentral.com/arizonarepublic/news/articles/0816borderemergency16.html>
Castle Rock Consultants. 1989. Port of Entry Weigh-In-Motion Feasibility Study. FHWA-AZ89-702. Phoenix, Arizona: Arizona Department of Transportation.
Comprehensive Truck Size and Weight Study, Final Report. Batelle Team, Federal Highway Administration, US Department of Transportation, August 2000.
Corley-Lay, J. 2005. In “Troopers ticketing more heavy trucks,” by Pat Stith. The News & Observer. August 17, 2005. http://newsobserver.com/news/story/2728787p-9166402c.html
Cottrell, B.H., The Avoidance of Weigh Stations in Virginia by Overweight Trucks, Virginia Transportation Research Council, Charlottesville, VA, 1992.
Cunagin, W., W. Mickler, and C. Wright. 1997. “Evasion of weight-enforcement stations by trucks.” Transportation Research Record 1570, 181- 190.
Ellis, T. 2004. “Big trucks an issue on residential streets.” Arizona Daily Star. Published 5 June 2004. Available from: <http://www.azstarnet.com/dailystar/relatedarticles/24949.php>
Eriksen, Ken, Kenneth L. Casavant, Impact of Increased International Trade (NAFTA) on Washington Highways, Part II: Highway Impact by Corridor, EWITS Research Report Number 25, Washington State University and US Department of Agriculture, November 1998.
Ernzen, J. M. 2005, J. M. 2005. Port Runners – Impacts and Solutions. FHWA-AZ-05- 563. Phoenix, Arizona: Arizona Department of Transportation.
ESRA Consulting Corporation. 2005. Internal report.
General Accounting Office . 1979. Excessive Truck Weight: An Expensive Burden We Can No Longer Support. Washington, D.C.
GIS/Trans. Ltd., Lima and Associates, and Transportation Research and Analysis, Inc. 2001. Enhancing Arizona Department of Transportation’s Traffic Data Resource. Final Report 492. Phoenix: Arizona Department of Transportation.
Guide for Design of Pavement Structures, Document Number: AASHTO GDPS-4, American Association of State and Highway Transportation Officials (Jan-1993).
63
Hawaii Asphalt Pavement Industry. 2003. Available from: http://www.hawaiiasphalt.com/HAPI/modules/04_pavement_types/04_pavement_types.htm
Highway Statistics. 2003 (Federal Highway Administration), Table HM-81.
http://www.prepass.com/aboutprepass.htm
Jooste, F.J., E.G. Fernando, Victoria. Superheavy Load Move: Report on Route Assessment and Pavement Modeling, Cooperative Research Program Research Report 1335-1, Texas Transportation Institute, Texas A&M University System, October 1994.
Kilareski, W.P., “Heavy Vehicle Evaluation for Overload Permits,” Rigid and Flexible Pavement Design and Analysis, Unbound Granular Materials, Tire Pressures, Backcalculation, and Design Methods, Transportation Research Record 1227, 1989.
Leidy, J. P., Clyde E. Lee and Robert Harrison. 1995. Measurement and Analysis of Traffic Loads Across the Texas-Mexico Border. Center for Transportation Research, University of Texas at Austin. For Texas Department of Transportation.
Louisiana Department of Transportation and Development. 2005. Louisiana: Regulations for Trucks, Vehicles, and Loads. Baton Rouge, Louisiana: Louisiana Department of Transportation ad Development.
Maryland State Highway Administration, Office of Traffic and Safety, Motor Carrier Division. 2003. 2003 Annual Report: Maryland Motor Carrier Program.
McCall, B. and W. C. Vodrazka. 1997. State’s Successful Practices Weigh-In-Motion Handbook. Washington, DC: Department of Transportation Federal Highway Administration.
Middleton, D. 1999. Keeping overweight trucks from getting a-weigh, Texas Transportation Researcher, 35:(3), 1-2.
Minnesota Department of Transportation. 2002. Moving Minnesota from 2002 to 2020, Chapter 2: Major Trends and Implications. Available from: http://www.oim.dot.state.mn.us/pdpa/StatePlan2000/Chapt2.pdf
National Transportation Statistics 2004. Bureau of Transportation Statistics. http://www.bts.gov/publications/national_transportation_statistics/2004/index.html
Norton, D. R, 1997. Performance Audit: Department of Transportation Motor Vehicle Division’s Revenue Functions, Report to the Arizona Legislature, Report No. 97-4. Phoenix: State of Arizona Office of the Auditor General. http://www.auditorgen.state.az.us/Reports/State_Agencies/Agencies/Transportation,%20Department%20of/Performance/97-04/97-4.pdf
64
Oregon Department of Transportation Research Unit, Policy and Research Section, Transportation Development Branch, Oregon Department of Transportation. 1998. Port-of-Entry Advanced Sorting System (PASS) Operational Test. FHWA-OR-RD-99-15.
Pennsylvania Department of Environmental Protection. 2002. State Solid Waste Plan. Available from: http://www.dep.state.pa.us/dep/subject/advcoun/solidwst/2003/Draft_Chapter3_Municipal%20Waste.pdf
Performance Audit: Georgia Department of Transportation Permits and Enforcement Program, Performance Audits Operations, Department of Audits, State of Georgia, March 2000.
Preserving Highway Infrastructure Using Weigh-In-Motion (WIM). Dr. A.T. Bergan, Norm Lindgren, Dr. Curtis Berthelot , Bob Woytowich, University of Saskatchewan & International Road Dynamics Inc., November 1998.
Rufolo, Anthony, Lois Bronfman, Eric Kuhner, Effect of Weight-Mile Tax on Road Damage in Oregon, Oregon Department of Transportation Research Group, September 1999.
Samuel, P., R. W. Poole, Jr., and J. Holguin-Veras. 2002. Toll Truckways: A New Path Toward Safer and More Efficient Freight Transportation. Policy Study 294. Los Angles, California: Reason Public Policy Institute.
Shanoff, B. 1994. Overweight Trucks Face Hefty Fines. WasteAge. Available from: http://www.wasteage.com/mag/waste_overweight_trucks_face/
South Dakota Department of Transportation. 2002. SDOT Briefing: Truck Weights and Highways.
Stith, P. 2005. “Troopers ticketing more heavy trucks.” The News and Observer. Published 17 August 2005. Available from: < http://newsobserver.com/news/story/2728787p-9166402c.html>
Strathman, J. G. and G. Theisen. 2002. Weight Enforcement and Evasion: Oregon Case Study. FHWA-OR-DF-02-12. Salem, Oregon: Oregon Department of Transportation.
Straus, S. H. 2005. New, Improved, Comprehensive, and Automated Driver’s License Test and Vision Screening System. FHWA-AZ-04-559(1). Phoenix, Arizona: Arizona Department of Transportation.
Straus, S. H. 2005. New, Improved, Comprehensive, and Automated Driver’s License Test and Vision Screening System: Arizona Transportation Research Center (ATRC) Research Note. FHWA-AZ-04-559(1). Phoenix, Arizona: Arizona Department of Transportation.
Straus, S. H. 2005. pending publication.
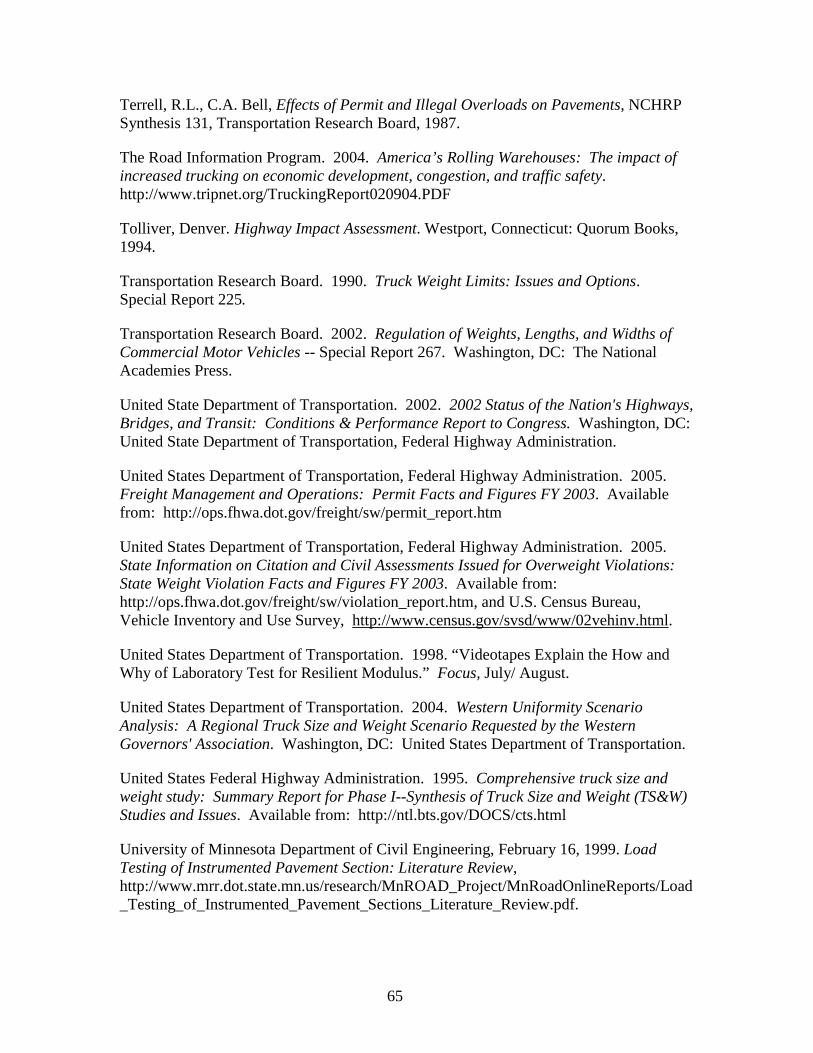
65
Terrell, R.L., C.A. Bell, Effects of Permit and Illegal Overloads on Pavements, NCHRP Synthesis 131, Transportation Research Board, 1987.
The Road Information Program. 2004. America’s Rolling Warehouses: The impact of increased trucking on economic development, congestion, and traffic safety. http://www.tripnet.org/TruckingReport020904.PDF
Tolliver, Denver. Highway Impact Assessment. Westport, Connecticut: Quorum Books, 1994.
Transportation Research Board. 1990. Truck Weight Limits: Issues and Options. Special Report 225.
Transportation Research Board. 2002. Regulation of Weights, Lengths, and Widths of Commercial Motor Vehicles -- Special Report 267. Washington, DC: The National Academies Press.
United State Department of Transportation. 2002. 2002 Status of the Nation's Highways, Bridges, and Transit: Conditions & Performance Report to Congress. Washington, DC: United State Department of Transportation, Federal Highway Administration.
United States Department of Transportation, Federal Highway Administration. 2005. Freight Management and Operations: Permit Facts and Figures FY 2003. Available from: http://ops.fhwa.dot.gov/freight/sw/permit_report.htm
United States Department of Transportation, Federal Highway Administration. 2005. State Information on Citation and Civil Assessments Issued for Overweight Violations: State Weight Violation Facts and Figures FY 2003. Available from: http://ops.fhwa.dot.gov/freight/sw/violation_report.htm, and U.S. Census Bureau, Vehicle Inventory and Use Survey, http://www.census.gov/svsd/www/02vehinv.html.
United States Department of Transportation. 1998. “Videotapes Explain the How and Why of Laboratory Test for Resilient Modulus.” Focus, July/ August.
United States Department of Transportation. 2004. Western Uniformity Scenario Analysis: A Regional Truck Size and Weight Scenario Requested by the Western Governors' Association. Washington, DC: United States Department of Transportation.
United States Federal Highway Administration. 1995. Comprehensive truck size and weight study: Summary Report for Phase I--Synthesis of Truck Size and Weight (TS&W) Studies and Issues. Available from: http://ntl.bts.gov/DOCS/cts.html
University of Minnesota Department of Civil Engineering, February 16, 1999. Load Testing of Instrumented Pavement Section: Literature Review, http://www.mrr.dot.state.mn.us/research/MnROAD_Project/MnRoadOnlineReports/Load_Testing_of_Instrumented_Pavement_Sections_Literature_Review.pdf.

66
Weigh In Motion Technology - Economics and Performance. Rob Bushman, Andrew J. Pratt. Presented at NATMEC ’98, Charlotte, North Carolina, 1998.
Weight Tolerance Permits, Research Report 1323-2F, Texas Transportation Institute, Texas A&M University System and Texas Department of Transportation, 1994.
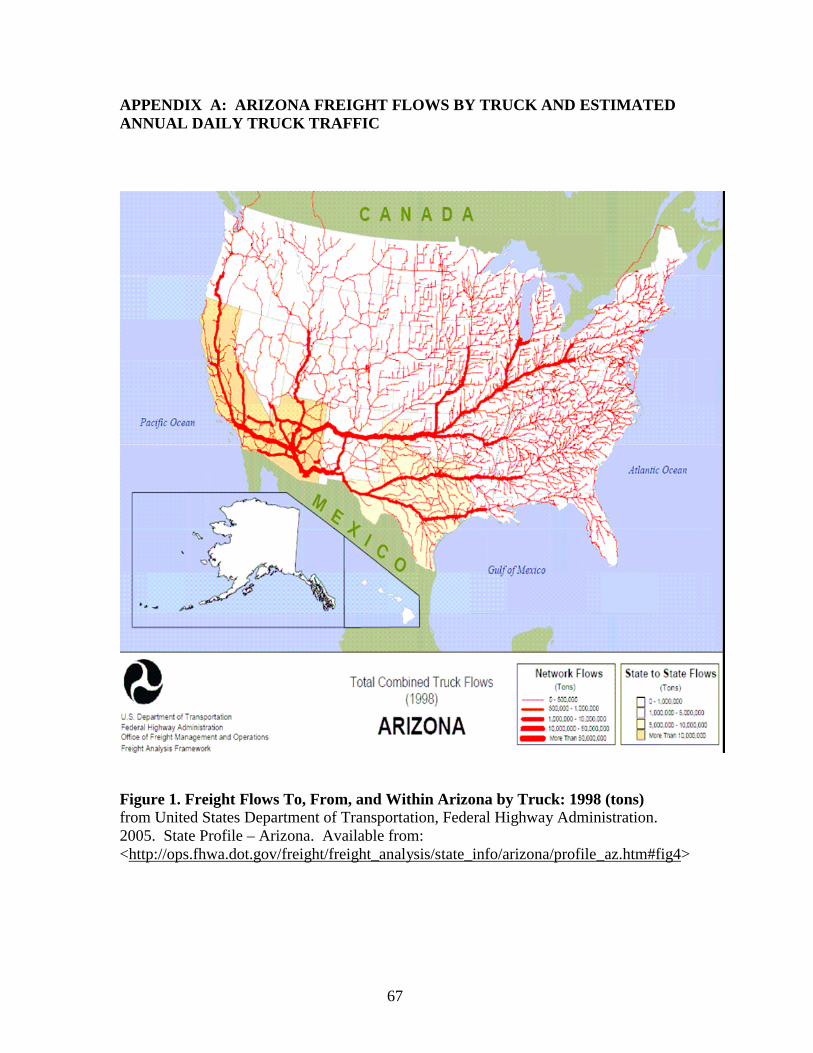
67
APPENDIX A: ARIZONA FREIGHT FLOWS BY TRUCK AND ESTIMATED ANNUAL DAILY TRUCK TRAFFIC
Figure 1. Freight Flows To, From, and Within Arizona by Truck: 1998 (tons) from United States Department of Transportation, Federal Highway Administration. 2005. State Profile – Arizona. Available from: <http://ops.fhwa.dot.gov/freight/freight_analysis/state_info/arizona/profile_az.htm#fig4>
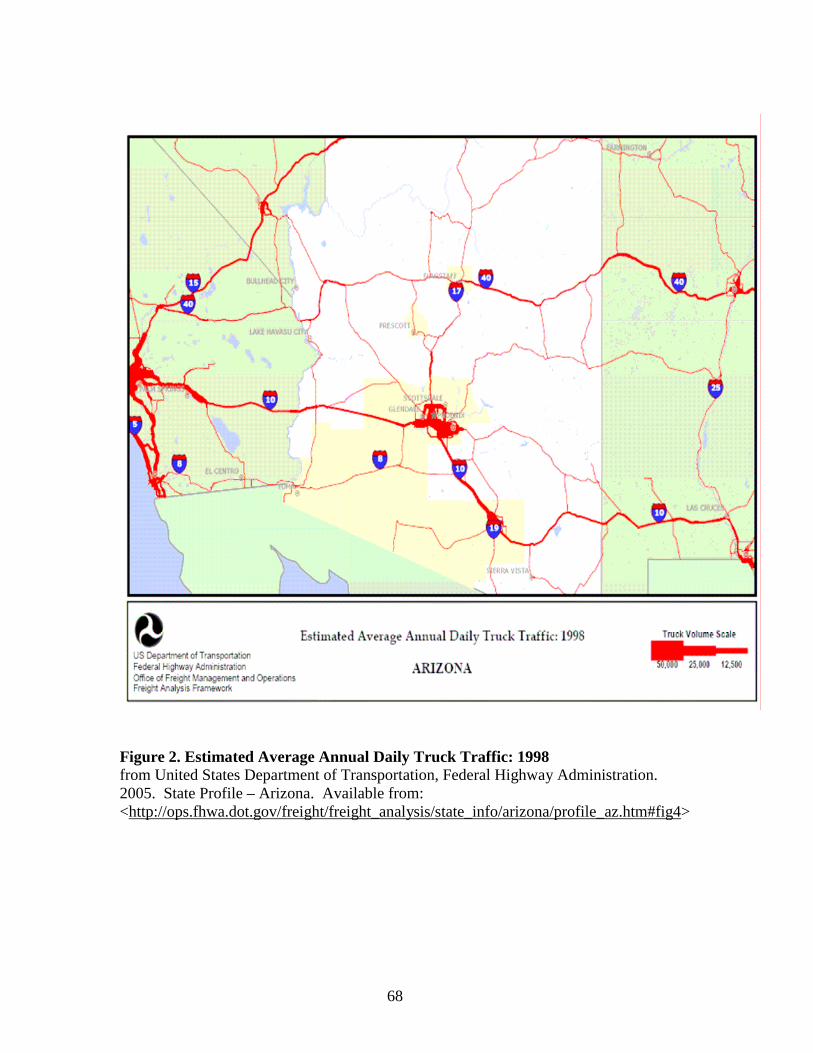
68
Figure 2. Estimated Average Annual Daily Truck Traffic: 1998 from United States Department of Transportation, Federal Highway Administration. 2005. State Profile – Arizona. Available from: <http://ops.fhwa.dot.gov/freight/freight_analysis/state_info/arizona/profile_az.htm#fig4>
69
Figure 3. Estimated Average Annual Daily Truck Traffic: 2020 from United States Department of Transportation, Federal Highway Administration. 2005. State Profile – Arizona. Available from: <http://ops.fhwa.dot.gov/freight/freight_analysis/state_info/arizona/profile_az.htm#fig4>
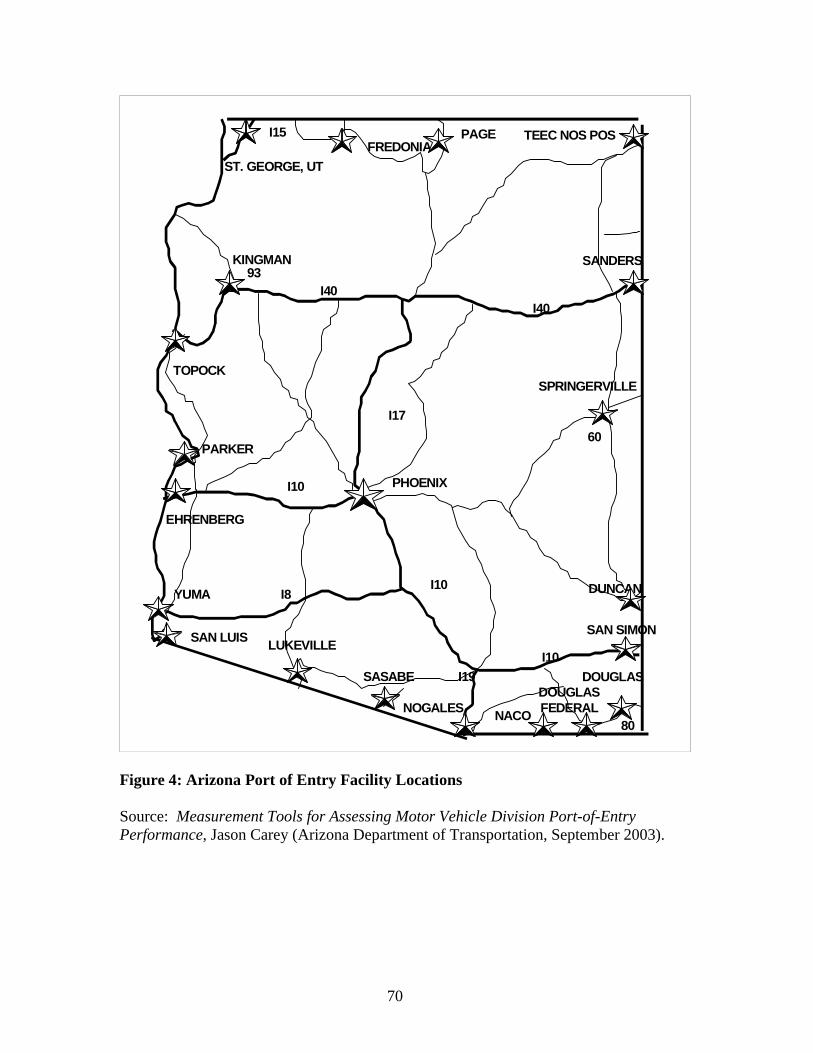
70
DOUGLASFEDERAL
SANDERS
TEEC NOS POS PAGEFREDONIA
ST. GEORGE, UT
KINGMAN
TOPOCK
PARKER
EHRENBERG
YUMA
SAN LUIS
NOGALES
SAN SIMON
DUNCAN
SPRINGERVILLE
PHOENIX
I15
I40I40
I17
I10
I10
I10 I8
I19
60
80NACO
LUKEVILLE
SASABE DOUGLAS
93
Figure 4: Arizona Port of Entry Facility Locations Source: Measurement Tools for Assessing Motor Vehicle Division Port-of-Entry Performance, Jason Carey (Arizona Department of Transportation, September 2003).
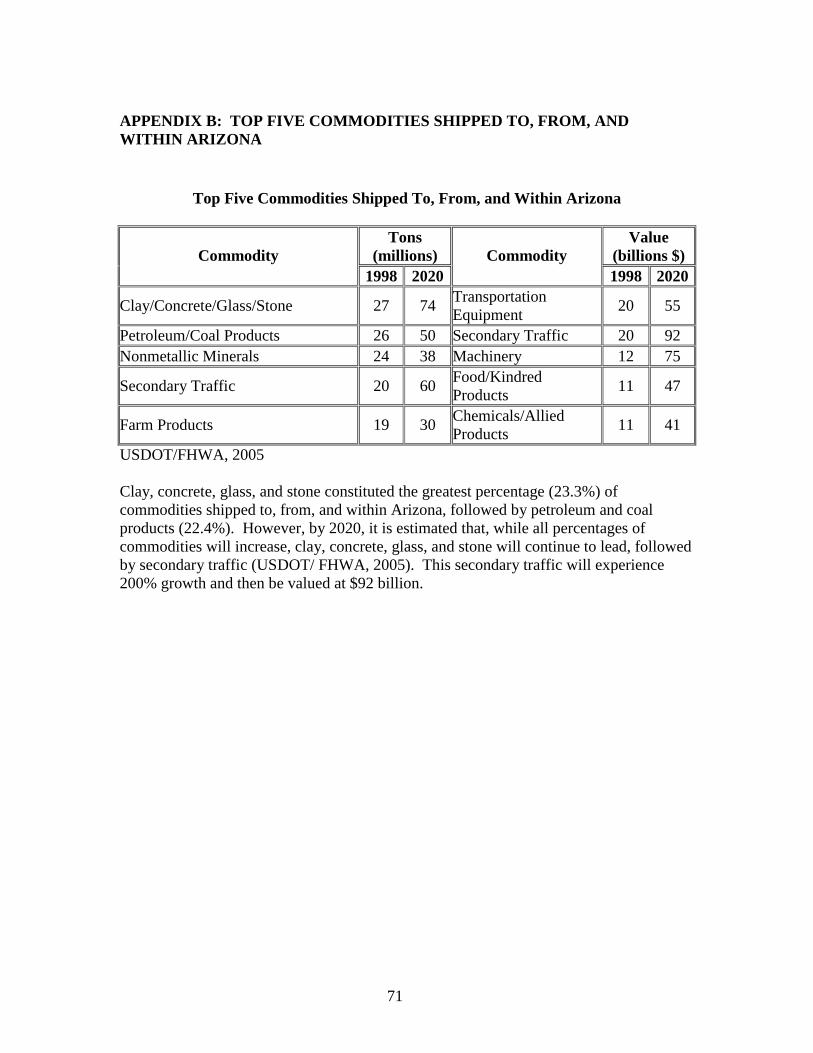
71
APPENDIX B: TOP FIVE COMMODITIES SHIPPED TO, FROM, AND WITHIN ARIZONA
Top Five Commodities Shipped To, From, and Within Arizona
Tons (millions)
Value (billions $) Commodity
1998 2020Commodity
1998 2020
Clay/Concrete/Glass/Stone 27 74 Transportation Equipment 20 55
Petroleum/Coal Products 26 50 Secondary Traffic 20 92 Nonmetallic Minerals 24 38 Machinery 12 75
Secondary Traffic 20 60 Food/Kindred Products 11 47
Farm Products 19 30 Chemicals/Allied Products 11 41
USDOT/FHWA, 2005 Clay, concrete, glass, and stone constituted the greatest percentage (23.3%) of commodities shipped to, from, and within Arizona, followed by petroleum and coal products (22.4%). However, by 2020, it is estimated that, while all percentages of commodities will increase, clay, concrete, glass, and stone will continue to lead, followed by secondary traffic (USDOT/ FHWA, 2005). This secondary traffic will experience 200% growth and then be valued at $92 billion.
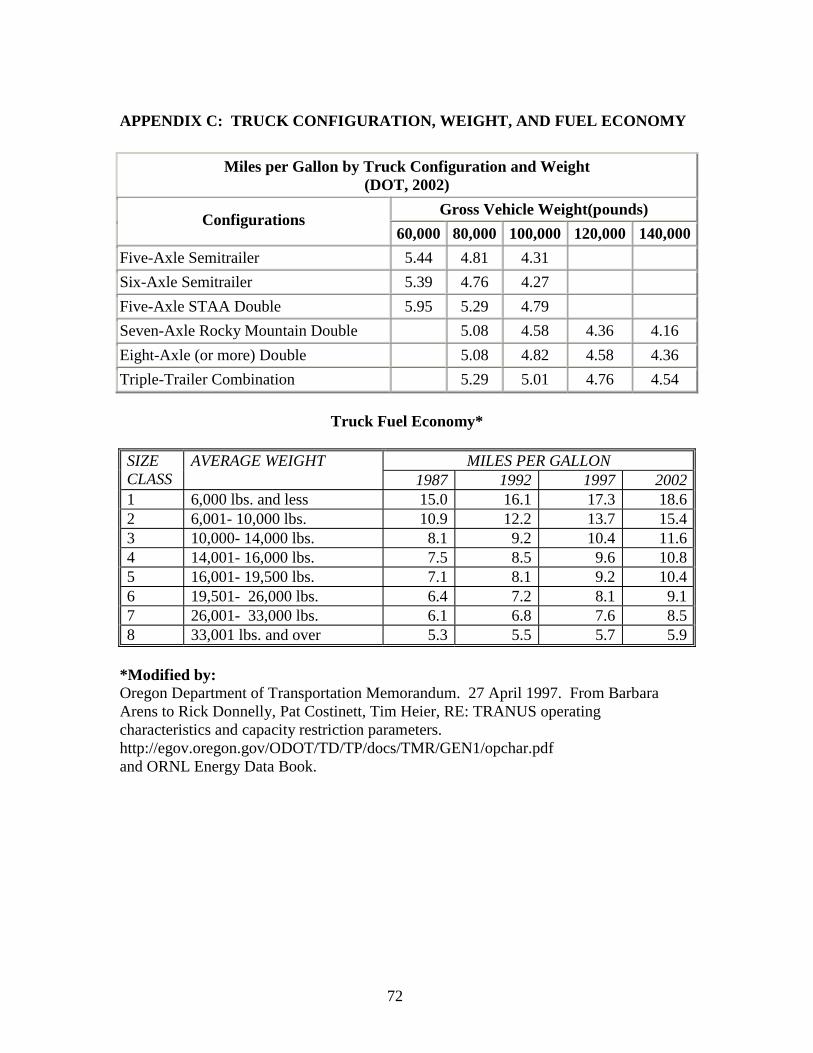
72
APPENDIX C: TRUCK CONFIGURATION, WEIGHT, AND FUEL ECONOMY
Miles per Gallon by Truck Configuration and Weight (DOT, 2002)
Gross Vehicle Weight(pounds) Configurations
60,000 80,000 100,000 120,000 140,000Five-Axle Semitrailer 5.44 4.81 4.31 Six-Axle Semitrailer 5.39 4.76 4.27 Five-Axle STAA Double 5.95 5.29 4.79 Seven-Axle Rocky Mountain Double 5.08 4.58 4.36 4.16 Eight-Axle (or more) Double 5.08 4.82 4.58 4.36 Triple-Trailer Combination 5.29 5.01 4.76 4.54
Truck Fuel Economy*
MILES PER GALLON SIZE CLASS
AVERAGE WEIGHT 1987 1992 1997 2002
1 6,000 lbs. and less 15.0 16.1 17.3 18.62 6,001- 10,000 lbs. 10.9 12.2 13.7 15.43 10,000- 14,000 lbs. 8.1 9.2 10.4 11.64 14,001- 16,000 lbs. 7.5 8.5 9.6 10.85 16,001- 19,500 lbs. 7.1 8.1 9.2 10.46 19,501- 26,000 lbs. 6.4 7.2 8.1 9.17 26,001- 33,000 lbs. 6.1 6.8 7.6 8.58 33,001 lbs. and over 5.3 5.5 5.7 5.9
*Modified by: Oregon Department of Transportation Memorandum. 27 April 1997. From Barbara Arens to Rick Donnelly, Pat Costinett, Tim Heier, RE: TRANUS operating characteristics and capacity restriction parameters. http://egov.oregon.gov/ODOT/TD/TP/docs/TMR/GEN1/opchar.pdf and ORNL Energy Data Book.
73
ACKNOWLEDGEMENTS This study was funded by the Arizona Department of Transportation (through a grant provided by the Federal Highway Administration of the United States of America) and ESRA Consulting Corporation. I thank John Semmens, ADOT Project Manager, and Frank Darmiento, ADOT/ ATRC Manager, for allowing me the opportunity to undertake yet another exciting, complex, and challenging project. John realized the potential of my creativity and molded this report into its form par excellence. When John, Frank, and I combine forces, we are quite an amazing team. I appreciate the great feedback provided by Capt. Steve Abney of ADOT/ MVD. Mobile enforcement officers face extraordinary challenges in Arizona now and in the future. It is my hope that this report conveys the dire need for increased funding for their security activities, safety initiatives, and pavement damage reduction techniques. I thank the other members of TAC for their expeditious review of this report: Joe Flaherty, James Delton, Gary Orlich, and Ed Stillings. I am indebted to my parents, grandmother, family, friends, and colleagues who inspire me all of the time. Dr. Ian Farmer, Robert Morgan, and Russell N. are truly extraordinary. I am grateful for the Law Offices of Ainslee R. Ferdie for continuing to provide ESRA with outstanding legal counsel. ERSA would like to express its appreciation to the following people for their assistance in collecting various parts of the data: Lisa Phillips, Xiaojun Gu, Stephen Shang, and Michael Shang. I thank Jason Carey for his contributions as these relate to “Traffic Data Collection Methods in Arizona.” He also interviewed several members of ADOT whose responses were incorporated into this section. -SHS