Embed Size (px)
Citation preview

U.S. Department of the Interior Bureau of Reclamation July 2014
Estimating the Cost of Brackish Groundwater Desalination in Texas Final Report Submitted to the Texas Water Development Board

Mission Statements
The U.S. Department of the Interior protects America’s
natural resources and heritage, honors our cultures and
tribal communities, and supplies the energy to power
our future.
The mission of the Bureau of Reclamation is to manage,
develop, and protect water and related resources in an
environmentally and economically sound manner in the
interest of the American public.

U.S. Department of the Interior Bureau of Reclamation Water Treatment Engineering Research Group Denver, Colorado July 2014
Estimating the Cost of Brackish Groundwater Desalination in Texas Final Report Submitted to the Texas Water Development Board
Prepared by:
Water Treatment Group, Technical Services Center
Valerie Batista Stariha, Mechanical Engineer
Katharine Dahm, Civil Engineer
Katherine Guerra, Chemical Engineer
Andrew Tiffenbach, Mechanical Engineer
In Coordination with:
Texas Water Development Board
Funded by:
Great Plains Region, Oklahoma-Texas Area Office


i
Executive Summary
Factors that affect the cost of desalination include: source water quality, pre-
treatment needs, depth and distance to water source, power, production volume,
and concentrate disposal method. Furthermore, the effort involved with
estimating the cost of a project increases as the project progresses through the
planning, design, and construction phases. As a project advances through the
various phases, the degree of accuracy of the cost estimates increases as more
site-specific data becomes available.
The goal of this study is to assess available methods for communities in Texas to
develop a planning-level cost estimate (including capital and operation and
maintenance costs) for brackish groundwater desalination facilities. The two cost
estimating tools identified for this assessment are The Desalting Handbook for
Planners (Handbook) as revised by the Bureau of Reclamation in 2003 and the
Unified Costing Model developed by the Texas Water Development Board in
2013. Unlike the Handbook, the Unified Costing Model was developed for a
variety of water management strategies with brackish groundwater desalination
cost estimating as just one of the many standard functions.
In July 2012, Texas Water Development Board staff sent a data request to 13
brackish groundwater desalination facilities in Texas for capital costs and
operations and maintenance costs. Seven facilities responded to the survey. In
addition, publically available cost information was obtained for two additional
facilities.
Based on the comparisons performed during this study, it appears that the cost
curves presented in the Handbook can provide a planning-level estimate for the
capital and operations and maintenance costs for brackish groundwater
desalination facilities in Texas. Facility costs obtained from the nine plants (when
indexed to the same year as the Handbook cost curves) typically fell within the -
50% to +100% accuracy range of an Association for the Advancement of Cost
Engineering Class 5 cost estimate. Although the limited number of reported
brackish groundwater desalination facility costs included in this study typically
fell within this accuracy range, there is no guarantee that a future cost estimate
prepared by using the Handbook cost curves will produce a Class 5 cost estimate.
The Unified Costing Model was used to produce a cost curve for comparison
during this study. This cost curve is approximately 18% lower than the indexed
Handbook cost curve at the low end of the curve range, and approximately 26%
higher than the indexed Handbook cost curve at the high end of the curve range.
When comparing the time and effort required to generate a cost estimate using the
Handbook cost curves and Unified Costing Model, the Handbook was quicker and
easier than the Unified Costing Model because only the treatment plant capacity is

ii
needed. However when more information is known about the proposed
desalination facilities, it may be more appropriate to use the Unified Costing
Model in order to take advantage of the wide range of user inputs that are
available.
An opportunity may exist to further refine the Unified Costing Model specifically
for brackish desalination plant costs. As new brackish groundwater desalination
projects are constructed, estimates generated by the model can be refined with
actual capital and operations and maintenance costs. These comparisons could
help identify strengths and weaknesses within the current Unified Costing Model
and guide future development of this tool for desalination costs.
iii
Acronyms
AACE Association for the Advancement of Cost Engineering
ac-ft/yr acre-feet per year
BWRO brackish water reverse osmosis
Handbook Desalting Handbook for Planners
m3/d cubic meters per day
mgd millions gallons per day
mg/l milligrams per liter
NAWSC North Alamo Water Supply Corporation
O&M operation and maintanance
RO reverse ssmosis
TDS total dissolved solids
TWDB Texas Water Development Board
UCM Unified Costing Model

iv
Table of Contents
Page
Executive Summary ................................................................................................. i Acronyms ............................................................................................................... iii Table of Contents ................................................................................................... iv
List of Figures ........................................................................................................ iv 1. Project Scope and Objectives.............................................................................1 2. Data Collection ..................................................................................................2 3. Comparison of Texas Brackish Groundwater Desalination Plant Costs to Cost
Estimating Methods .................................................................................................5 4. Conclusions / Recommendations .....................................................................13
5. References ........................................................................................................14 6. Larger versions of Figure 1-7 ..........................................................................15
List of Figures
Page
Figure 1: Total Capital Cost – BWRO Plant with Well Water Feed .......................... 7/15
Figure 2: Total Capital Cost – Wellfields ............................................................... 8/16
Figure 3: Annual Cost – Labor for Membrane Processes ......................................... 9/17
Figure 4: Annual Cost – Chemicals for Ground Water Membrane Processes............. 9/18
Figure 5: Annual Cost – BWRO Plant Electricity.................................................. 10/19
Figure 6: Cost Curves for BWRO – Capital Costs ................................................. 11/20
Figure 7: Cost Curves for BWRO - O&M Costs ................................................... 12/21

1
1. Project Scope and Objectives
Currently, there are 46 municipal brackish water desalination facilities in Texas.
Twelve of these facilities use brackish surface water as a source of raw water,
which accounts for a design capacity of 50 million gallons per day (mgd) or
56,000 acre-feet per year (ac-ft/yr). Thirty-four facilities use brackish
groundwater as a raw water source, which accounts for a design capacity of
approximately 73 mgd (81,760 ac-ft/yr). Among the brackish groundwater
desalination facilities, El Paso Water Utilities’ Kay Bailey Hutchison Desalination
facility has the highest design capacity in the state (27.5 mgd or 30,800 ac-ft/yr).
In total, the state has a desalination design capacity of approximately 123 mgd
(137,778 ac-ft/yr).
In the 2012 State Water Plan, five regional water planning groups recommended
brackish groundwater desalination as a water management strategy to meet at
least some of their projected water needs. In total, the regional water planning
groups project that desalting brackish groundwater can create about 162 mgd
(181,568 ac-ft/yr) of new water by 2060 accounting for 2 percent of all
recommended water management strategies. Local water planners are now
exploring brackish groundwater desalination to meet the recommendations of the
water plan, but many are still questioning whether this will be achievable. One of
the most common questions asked to the Texas Water Development Board
(TWDB) has been what is the cost of brackish groundwater desalination in Texas,
both in terms of construction cost and operations and maintenance (O&M) costs?
Factors that affect the cost of desalination include: source water quality, pre-
treatment needs, depth and distance to water source, power, production volume,
and concentrate disposal method. Furthermore, the effort involved with
estimating the cost of a project increases as the project progresses through the
planning, design, and construction phases. As a project advances through the
various phases, the degree of accuracy of the cost estimates increases as more
site-specific data becomes available.
The goal of this study is to assess available methods for communities in Texas to
develop a planning-level cost estimate (including capital and operation and
maintenance costs) for brackish groundwater desalination facilities. The two cost
estimating tools identified for this assessment are The Desalting Handbook for
Planners (Handbook) as revised by the Bureau of Reclamation in 2003 and the
Unified Costing Model developed by the Texas Water Development Board in
2013. Unlike the Handbook, the Unified Costing Model was developed for a
variety of water management strategies with brackish groundwater desalination
cost estimating as just one of the many standard functions.

2
2. Data Collection
Reverse osmosis (RO) is the predominant desalination technology used in Texas;
44 of 46 brackish water desalination facilities use RO technology. To track the
growth of desalination in Texas, the TWDB maintains a desalination plant
database for Texas (TWDB desalination plant database for Texas). In July 2012,
TWDB staff sent a request for data to 13 brackish groundwater desalination
facilities in Texas for actual capital and O&M costs. The following seven RO
facilities provided information:
North Alamo Water Supply Corporation (NAWSC) Victoria Road RO
Plant No. 5
NAWSC Doolittle
NAWSC Owassa
Clarksville City
Roscoe
Kay Bailey Hutchison
North Cameron
In addition to the survey responses, cost information was publically available for
the following two facilities:
Southmost: “Economic Costs of Desalination in South Texas: A Case
Study” (Sturdivant, 2007) provides a detailed capital and O&M cost
breakdown for the 7.5 mgd (8,407 ac-ft/yr) desalination facility.
NAWSC La Sara: “Economies of Size in Municipal Water-Treatment
Technologies: A Texas Lower Rio Grande Valley Case Study” (Boyer,
2010) provides a detailed capital and O&M cost breakdown for the 1.2
mgd (1,345 ac-ft/yr) desalination facility.
Table 1 summarizes the key information for each of the desalination plants used
in this study. Information in this table was gathered from the TWDB desalination
plant database, “Cost of Brackish Groundwater Desalination in Texas” (Arroyo,
2012), and survey responses. Please note that the facilities listed above provided
cost information that varied in terms of level of detail and format. The project
team used engineering judgment in determining how to compare these reported
costs with currently available methods for developing planning-level cost
estimates for brackish groundwater desalination facilities.

3
Table 1. Summary of brackish groundwater desalination plant cost information
Plant name Year
plant
built
Plant
capacity
(mgd)a
Desal
capacity
(mgd)b
Feed water
salinity
(mg/l)
Pretreatment Post treatment Membrane
recovery (%)
Concentrate
disposal
NAWSC
Victoria
2012 2.25 2.0 3,800 Not provided Not provided Not provided Not provided
NAWSC
Doolittle
2008 3.5 3.0 2,500 –
3,000
Cartridge filter,
chemical addition
Blending, gas
removal, pH
adjustment,
disinfection
Not provided Not provided
NAWSC
Owassa
2008 2.0 1.5 2,500 –
3,000
Cartridge filter Blending, gas
removal, pH
adjustment
Not provided Not provided
Clarksville
City
2006 0.288 0.288 Not
provided
Cartridge filter Disinfection, scaling
control
75 WWTP
Roscoe 2013 0.5 0.36 3,800 Not provided Not provided Not provided Not provided
Kay Bailey
Hutchison
2007 27.5 15 2,000 –
3,000
Cartridge filter,
scaling control
pH adjustment,
blending, corrosion
control, disinfection
82.5 Well Injection
a Plant capacity as designed to include both RO capacity and raw water blending capacity.
b Desal capacity as designed to include only the RO capacity of the plant.

4
Table 1. Summary of brackish groundwater desalination plant cost information (continued)
Plant
name
Year
plant
built
Plant
capacity
(mgd)a
Desal
capacity
(mgd)b
Feed
water
salinity
(mg/l)
Pretreatment Post treatment Membrane
recovery (%)
Concentrate
disposal
North
Cameron
2007 2.5 2.0 3,500 Cartridge filter,
chemical addition
Blending, gas removal,
pH adjustment,
disinfection
75 Surface water
discharge
Southmost 2004 7.5 6 3,500 Cartridge filter, pH
adjustment,
antiscalant
Blending, gas removal,
pH adjustment,
corrosion control,
disinfection
75 Surface water
discharge
NAWSC
La Sara
2005 1.2 1.0 2,500 –
3,000
Cartridge filter,
chemical addition
Blending, gas removal,
pH adjustment,
disinfection
Not provided Not provided
a Plant capacity as designed to include both RO capacity and raw water blending capacity.
b Desal capacity as designed to include only the RO capacity of the plant.

5
3. Comparison of Texas Brackish Groundwater Desalination Plant Costs to Cost Estimating Methods
3.1 Desalting Handbook for Planners Originally developed by the Office of Water Research and Technology and the
Bureau of Reclamation in 1972 and later revised in 1977 and 2003, the Desalting
Handbook for Planners (Handbook) was created to assist in the decision-making
process for potential desalination users. This Handbook is designed for use by
appointed and elected officials, planners, and consultants with a limited
knowledge of the technologies involved, but who have enough familiarity with
the general principles to recognize that desalting may have value as a viable
alternative source of drinking water for their communities.
The Handbook contains a series of cost curve graphs for estimating the cost of
numerous desalting processes and related infrastructure, along with annual
operations and maintenance expenses. The Handbook states that these cost curves
should be used only to compare alternative schemes for water supply at a
planning level, with an implied level of accuracy of +/- 30%. All of the cost
curves in the Handbook are presented in year 2000 dollars. These cost curves
have not been updated since 2003, so any technological advances made in the last
decade are not reflected in the curves.
There is little flexibility built into the Handbook cost curves, as they are all based
on plant capacity. Plant capacities are listed along the x-axis of each curve, with
the estimated cost on the y-axis. A number of assumptions are built into each
curve, with no way of adjusting these assumptions. For example, the curve for
brackish water reverse osmosis (BWRO) assumes 75% recovery with no
blending, and a raw water total dissolved solids (TDS) of 2,000 – 3,000
milligrams per liter (mg/l). These inherent assumptions make it very difficult for
a user to adjust the costs for local conditions.
Presented below is a series of graphs which compare various Handbook cost
curves to the costs of nine brackish groundwater desalination facilities in Texas.
All costs have been indexed to year 2000 dollars using the Engineering News
Record Construction Cost Index to match the Handbook.
Also shown on each figure are dashed lines showing -50% of the cost curve and
+100% of the cost curve. These values were chosen based on guidance provided
by the Association for the Advancement of Cost Engineering (AACE)
Recommended Practice No. 18R-97 (AACE, 2011), which describes a cost
estimate classification system as applied in engineering, procurement, and
6
construction for the process industries. This document describes a Class 5 cost
estimate as follows:
“Class 5 estimates generally use stochastic estimating methods
such as cost/capacity curves and factors.”
“Class 5 estimates are generally prepared based on very limited
information, and subsequently have wide accuracy ranges. Class
5 estimates, due to the requirements of end use, may be prepared
within a very limited amount of time and with little effort expended
– sometimes required less than an hour to prepare. Often, little
more than proposed plant type, location, and the capacity are
known at the time of estimate preparation.”
“Class 5 estimates are prepared for any number of strategic
business planning purposes, such as but not limited to market
studies, assessment of initial viability, evaluation of alternative
schemes, project screening, project location studies, evaluation of
resource needs and budgeting, long-range capital planning, etc.”
“Typical accuracy ranges for Class 5 estimates are -20% to -50%
on the low side, and +30% to +100% on the high side, depending
on technological complexity of the project, appropriate reference
information and other risks.”
Based on the guidance presented by AACE it appears that cost estimates
generated using the Handbook can be classified as Class 5 estimates. The
accuracy range of +/- 30% described in the Handbook falls within the Class 5
accuracy range defined by AACE.
Capital Costs
Figure 1 compares the Handbook cost curve for total capital cost of brackish
groundwater reverse osmosis (BWRO) plants (Handbook Figure 9-8) to the costs
of nine BWRO facilities in Texas (indexed to year 2000 dollars). The
Handbook’s capital cost curve includes: the desalting plant proper, in-plant
piping, pumps, motors, controls, post treatment, building, membrane cleaning
system, electrical distribution, and indirect costs. The Handbook does not provide
any specific details for these included items, such as level of post treatment,
building size or features, pumping requirements, etc. The capital cost curve
excludes: land costs, product water delivery, and concentrate disposal. For this
study the level of cost detail provided by BWRO facilities was sufficient to ensure
that excluded items were not included in the capital costs shown in Figure 1.

7
Figure 1: Total Capital Cost – BWRO Plant with Well Water Feed1. Larger
versions of the figures are included in Section 6.
Generally the costs of the facilities fell within the AACE Class 5 estimate
accuracy range of -50% to +100%. Four of the reported costs were near the -50%
indicating that the Handbook cost curve estimates are higher than the actual costs
for the Texas BWRO plants. Also note that the minimum capacity described by
the Handbook cost curves is 3,800 cubic meters per day (m3/day) (approximately
1 mgd); therefore, the Handbook cost curves cannot be used to prepare cost
estimates of plants with capacity less than 1 mgd (1,120 ac-ft/yr).
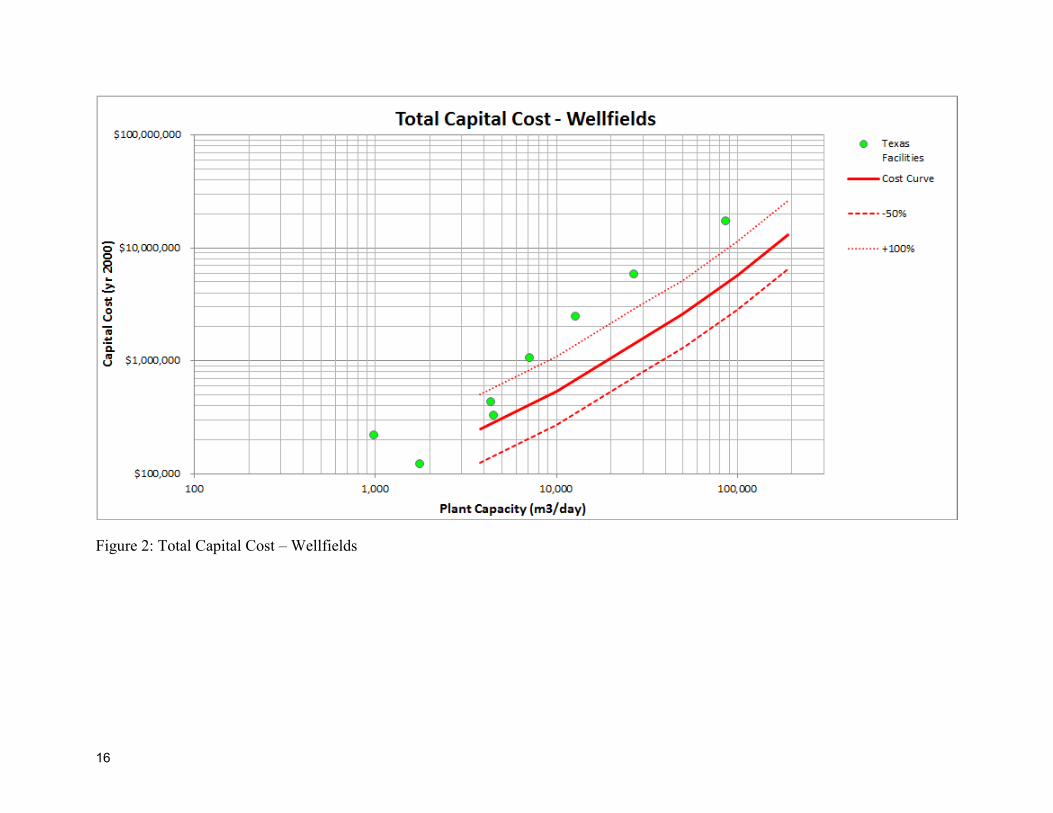
Figure 2 compares the Handbook cost curve for total capital costs for wellfields
with a 400 foot well depth (Handbook Figure 9-18) to the cost of wellfields for
BWRO facilities in Texas (indexed to year 2000 dollars) excluding the cost of
raw water delivery from the wellfield to the BWRO facility. The Handbook
capital cost includes wells, pumping equipment, electrical, controls, wellhouse,
lateral piping, and collector piping. The cost excludes land costs and well water
delivery.
The costs for six desalinations plants are substantially higher than the Handbook
cost curve. The Handbook cost curve assumes a water yield of 2 mgd (2,240 ac-
ft/yr) per well, which may not be accurate for the Texas facilities surveyed. The
well yield for each facility was not collected as part of this effort. The water yield
per well determines the number of wells required to generate the desired capacity.
Assuming an incorrect number of wells could escalate the cost of constructing the
well field. The Handbook does not allow the user to adjust the well yield and
could explain this cost difference.
1 Note that the cost curves are shown on a log-log scale in order to show a wide
range of plant capacities and costs on the same chart.

8
Figure 2: Total Capital Cost – Wellfields. Larger versions of the figures are
included in Section 6.
Operation and Maintenance Cost
Figure 3 compares the Handbook cost curve for membrane process labor costs
(Handbook Figure 9-37) to the labor costs of BWRO facilities in Texas (indexed
to year 2000 dollars). The Handbook cost curve assumes a plant larger than
18,925 m3/d (5 mgd) will be staffed 24 hours per day, 7 days per week. For a
plant smaller than 5 mgd (5,600 ac-ft/yr), it assumes the plant will be staffed 16
hours per day, 5 days per week. A labor rate of $25,000 per year (in year 2000
dollars) is also assumed. Texas desalination plant labor costs are slightly higher
than the Handbook cost curve for the two larger plants, while costs for the four
smaller plants are significantly lower than the cost curve. The Handbook does not
allow adjusting either the staffing level or labor cost to account for local
conditions. This can result in discrepancies such as the fact that larger plants are
usually in more developed, larger cities with a higher cost of living compared to
small plants which are often in more rural areas with a lower cost of living.

9
Figure 3: Annual Cost – Labor for Membrane Processes. Larger versions of the
figures are included in Section 6.
Figure 4 compares the Handbook cost curve for membrane process chemical costs
(Handbook Figure 9-42) to the costs of BWRO facilities in Texas (indexed to year
2000 dollars). The Handbook cost curve includes the chemical costs for
pretreatment, post-treatment, and cleaning for membrane systems. The chemical
costs for the two larger desalination plants are fairly close to the Handbook cost
curve, while reported costs are more variable for smaller plants. The Handbook
does not provide any method for adjusting the types, quantities, or unit costs of
chemicals.
Figure 4: Annual Cost – Chemicals for Ground Water Membrane Processes.
Larger versions of the figures are included in Section 6.
Figure 5 compares the Handbook cost curve for electricity costs (Handbook
Figure 9-47) to the reported electricity costs of BWRO facilities in Texas
(indexed to year 2000 dollars). The annual cost includes power for well pumps,

10
process power, distribution pump power, and building services. A power cost of
$0.06/kWh is assumed. The annual costs are within the accuracy range of the
Handbook cost curve for all six of the plants that fall within the Handbook cost
curve range.
Figure 5: Annual Cost – BWRO Plant Electricity. Larger versions of the figures
are included in Section 6.
3.2 Unified Costing Model The Unified Costing Model (UCM) was developed by the TWDB in 2013. This
tool helps the TWDB compile consistent cost estimates from all 16 State planning
regions for use in developing the State Water Plan. The UCM contains a module
for estimating the cost of brackish groundwater desalination facilities, which can
also be compared to actual cost data. Unlike the Handbook, the UCM was
developed for a variety of water management strategies with brackish
groundwater desalination cost estimating as just one of the many standard
functions.
The UCM is an Excel-based tool used to develop cost estimates for a wide range
of infrastructure items, such as well fields, pipelines, treatment plants, pump
stations, storage tanks, etc. In order to estimate the cost of a brackish
groundwater desalination plant in the UCM, the required inputs are plant capacity
and feed water salinity. For this study the UCM was used to generate a cost curve
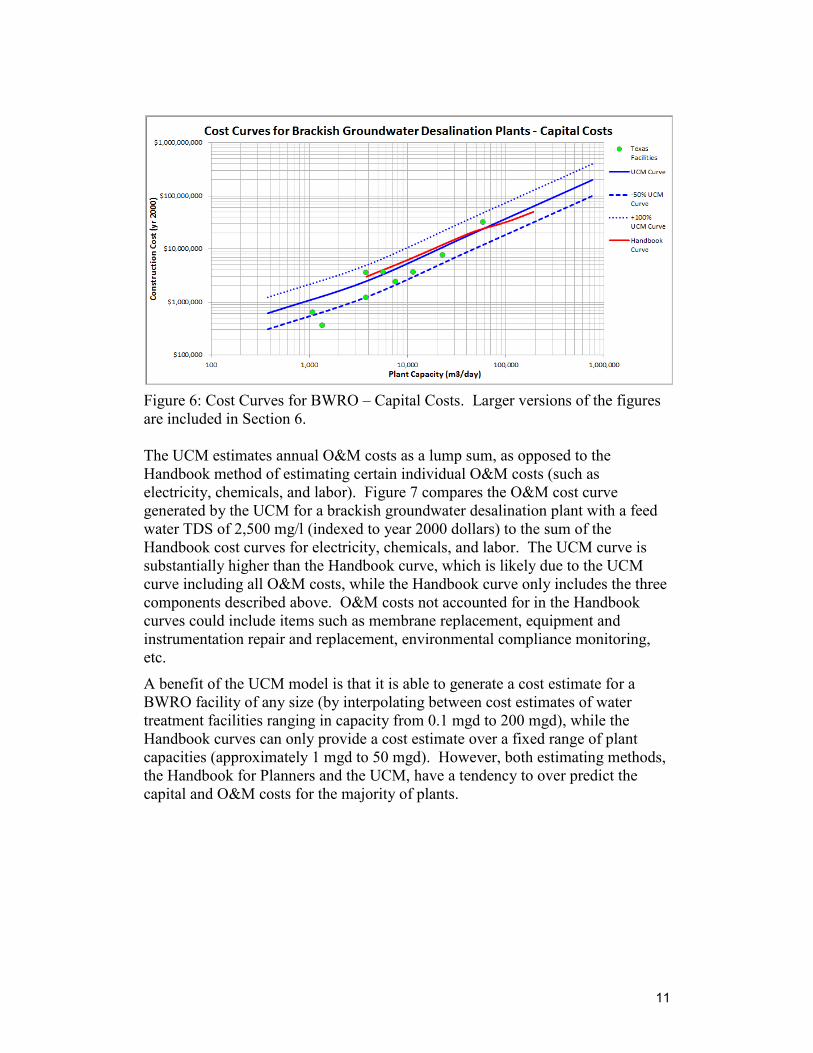
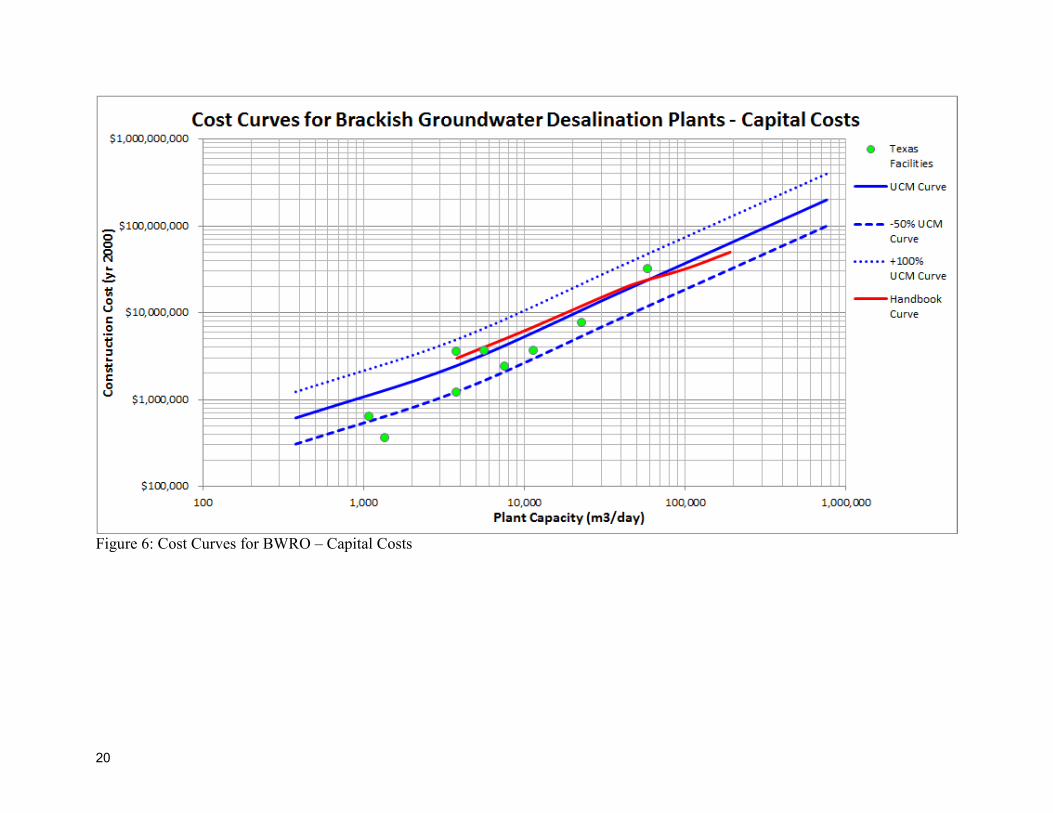
for comparison by inputting interval plant capacities. Figure 6 compares the
curve generated by the UCM for a brackish groundwater desalination plant with a
feed water TDS of 2,500 mg/l (indexed to year 2000 dollars) to the equivalent
Handbook cost curve. The UCM cost curve is approximately 18% lower than the
indexed Handbook cost curve at the low end of the curve range, and
approximately 26% higher than the indexed Handbook cost curve at the high end
of the curve range.
11
Figure 6: Cost Curves for BWRO – Capital Costs. Larger versions of the figures
are included in Section 6.
The UCM estimates annual O&M costs as a lump sum, as opposed to the
Handbook method of estimating certain individual O&M costs (such as
electricity, chemicals, and labor). Figure 7 compares the O&M cost curve
generated by the UCM for a brackish groundwater desalination plant with a feed
water TDS of 2,500 mg/l (indexed to year 2000 dollars) to the sum of the
Handbook cost curves for electricity, chemicals, and labor. The UCM curve is
substantially higher than the Handbook curve, which is likely due to the UCM
curve including all O&M costs, while the Handbook curve only includes the three
components described above. O&M costs not accounted for in the Handbook
curves could include items such as membrane replacement, equipment and
instrumentation repair and replacement, environmental compliance monitoring,
etc.
A benefit of the UCM model is that it is able to generate a cost estimate for a
BWRO facility of any size (by interpolating between cost estimates of water
treatment facilities ranging in capacity from 0.1 mgd to 200 mgd), while the
Handbook curves can only provide a cost estimate over a fixed range of plant
capacities (approximately 1 mgd to 50 mgd). However, both estimating methods,
the Handbook for Planners and the UCM, have a tendency to over predict the
capital and O&M costs for the majority of plants.

12
Figure 7: Cost Curves for BWRO - O&M Costs. Larger versions of the figures
are included in Section 6.

13
4. Conclusions / Recommendations
Based on the comparisons performed during this study, it appears that the cost
curve presented in the Handbook can provide a planning-level capital cost
estimate for BWRO facilities in Texas. Facility costs obtained from the seven
plants within the Handbook capacity curve (when indexed to the same year as the
Handbook cost curves) fell within or very close to the -50% to +100% accuracy
range of an American Association of Cost Engineering Class 5 cost estimate. The
cost curve presented in the Handbook for electricity costs at BWRO facilities also
fell within the -50% to +100% accuracy range for all six plants. Please note that
this range is significantly higher than the +/- 30% accuracy range described in the
Handbook. Although the limited number of reported BWRO facility capital costs
and electricity costs included in this study fell within the -50% to +100%
accuracy range, there is no guarantee that a future cost estimate prepared by using
the Handbook cost curves will produce a Class 5 cost estimate.
The costs curves presented in the Handbook were not as successful at generating
cost estimates within the -50% to +100% accuracy range for wellfields and
individual O&M items. The Handbook curves fell outside of this accuracy range
for four out of six wellfield estimates, three out of six labor estimates, and three
out of six chemical estimates.
While a cost estimate can be generated very quickly using the Handbook cost
curves, the primary drawback of these cost curves is the inflexibility of the cost
estimating methodology. Many assumptions are incorporated within each cost
curve, and it is very difficult (or impossible) to adjust these assumptions based on
local conditions, such as electricity cost, labor rate, well depth, raw water
conveyance, and source water quality. The UCM provides users much more
flexibility in generating a cost estimate, as many inputs can be adjusted to account
for local conditions such as those listed above. If more information is known
about the proposed desalination facilities, it may be more appropriate to use the
UCM in order to take advantage of the wider range of user inputs that are
available.
As seen above, the number of data points used in this study was relatively modest,
ranging from six to nine points per curve. It would be useful to include cost data
for additional brackish groundwater desalination facilities in Texas if such
information becomes available in the future.
An opportunity may exist to further refine the Unified Cost Model specifically for
desalination plant costs. As new brackish groundwater desalination projects are
constructed, estimates generated by the model can be refined with actual capital
and O&M costs. These comparisons could help identify strengths and
weaknesses within the current Unified Cost Model and guide future development
of this tool for desalination costs.
14
5. References
Arroyo, Jorge and Saqib Shirzai. 2012. Cost of Brackish Groundwater
Desalination in Texas. Texas Water Development Board – Innovative Water
Technologies
Association for the Advancement of Cost Engineering. 2011. Cost Estimate
Classification System – as Applied in Engineering, Procurement, and
Construction for the Process Industries. AACE International Recommended
Practice No. 18R-97
Boyer, Christopher N., M. Edward Rister, Callie S. Rogers, Allen W. Sturdivant,
Ronald D. Lacewell, Charles “Chuck” Browning, Jr., James R. Elium III, and
Emily K. Seawright. 2010. Economies of Size in Municipal Water-Treatment
Technologies: A Texas Lower Rio Grande Valley Case Study. Texas Water
Resources Institute Technical Report No. 367. College Station, Texas.
Bureau of Reclamation. 2003. Desalting Handbook for Planners. Desalination
and Water Purification Research and Development Program Report No. 72,
3rd
Edition. Denver, Colorado
Engineering News Record Construction Cost Index. 2013. McGraw Hill
Construction
Sturdivant, Allen W., Callie S. Rogers, M. Edward Rister, Ronald D. Lacewell,
Joseph W. “Bill” Norris, Jesús Leal, Jose A. Garza, and Judy
Adams. 2007. Economic Costs of Desalination in South Texas: A Case
Study. Journal of Contemporary Water Research and Education, Issue 137,
pp. 21-39, September 2007. Universities Council on Water Resources,
Carbondale, Illinois.

15
6. Larger versions of Figure 1-7
Figure 1: Total Capital Cost – BWRO Plant with Well Water Feed2
2 Note that the cost curves are shown on a log-log scale in order to show a wide range of plant capacities and costs on the same chart.
16
Figure 2: Total Capital Cost – Wellfields

17
Figure 3: Annual Cost – Labor for Membrane Processes

18
Figure 4: Annual Cost – Chemicals for Ground Water Membrane Processes

19
Figure 5: Annual Cost – BWRO Plant Electricity
20
Figure 6: Cost Curves for BWRO – Capital Costs

21
Figure 7: Cost Curves for BWRO - O&M Costs